Brazilian Real Estate Trends and prospects. Our business is making business
|
|
|
- Shanon Welch
- 6 years ago
- Views:
Transcription

1 Brazilian Real Estate Trends and prospects making business
2 You cannot manage what you can t measure You cannot measure what is not defined You cannot define what you don t understand and there is no success without management William Edwards Deming
3 Suspicion is not certainty! Robert Schiller (2005) was one of the first to demonstrate that very long-term evolution of Real Estate prices existed in the USA (and was awarded the Nobel Prize for his work) The conclusion he reached was that: The explosion of real estate prices in the USA during the years of the 2000 decade was a bubble. During a short visit to Brazil in 2013 he declared; I suspect that there is a real estate market bubble in Brazil I cannot be absolutely certain that a bubble exists in Brazil because I do not have sufficient knowledge of the local market characteristics In 2004 he repeated the insinuation that Brazil would have a bubble in There is no bubble in Brazil because the characteristics of a bubble are completely different from those indicated. How can one affirm something without a wide knowledge of the local market?
4 ZERO risk of a bubble Real Estate credit and its contribution to the Brazilian GDP is too small to be able to generate a crisis of a real estate bubble. Comparing Brazil to other countries. particularly the USA. Holland and Spain. one sees at once that the relationship with a bubble is directly connected to real estate credit and the respective country GDP. USA 82% Holland 64% Spain 57% South Africa 50% France 41% Germany 38% Italy 23% Chile Brazil Mexico 1,0% 9,5% 21%
 Demand For")
 Potential market for over")
5 ZERO risk of a bubble 11.6 milion of households are rented (18% of the total) Demand For Real Estate 5.8 milion residences ( housing shortage) Potential market for over 10 years 341 divorces thousand 1.1 milion weddings Pinheiro. Source: PNAD 2014 (IBGE) & Fundação João
6 Housing Deficit and Demand in Brazil 2012 deficit: 5.8 million units (FJP. 2014) 2007/2009 Projected demand (Cedeplar. Planhab.2009): 2012 to 2015: 5.2 million units 2016 to 2019: 5.9 million units 2020 to 2023: 7.2 million units. Total 2012 to 2023: 18.3 million units.

7 Real Estate Financing Real Estate SBPE Financing (BRL Bilions) Acquisition and Construction We are back to the 2011 platform.
 - - Borrowers are receiving the Keys and financing themselves with the financial agent.")
8 Real Estate Financing Real Estate SBPE Financing (BRL Bilions) Acquisition New Buildings Variation 2015/2014 (-10%) - A considerable portion of these purchases was acquired from the drawings (old buy decisions) - - Borrowers are receiving the Keys and financing themselves with the financial agent. Previously Used Buildings Variation 2015/2014 (-50%) - More selectivity os the financial agentes - Lower Loan-to-value (LTV)

9 Real Estate Financing Real Estate SBPE Financing (BRL Bilions) Construction - Adverse economic conditions - Fall in the incorporator s sales - Reduction of real estate launchings - Drop in demand

10 Non-payment of real estate credit Mortgage + Liens Liens

11 Visiting the past and looking to the future It is difficult to foresee the future without first reviewing the past because the economic and market cycles tend to repeat themselves. At present Brazil does not have an historical base of real estate prices formatted with the necessary consistency what exists are data-bases recently elaborated by two of the principle Brazilian real estate portals. ZAP and VivaReal. Even these two data-bases concentrate the information on the principal Brazilian business center in the City of São Paulo and start only in June * * Monthly IPCA Variation Source: FIPE/ZAP
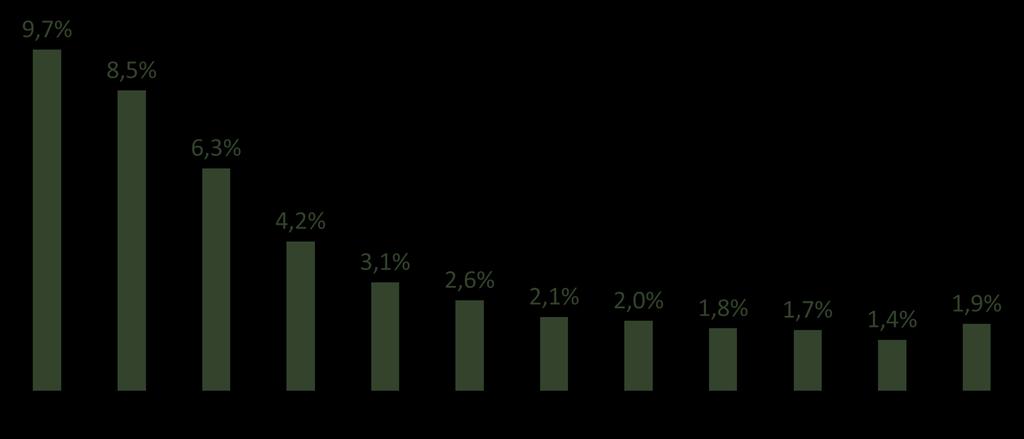
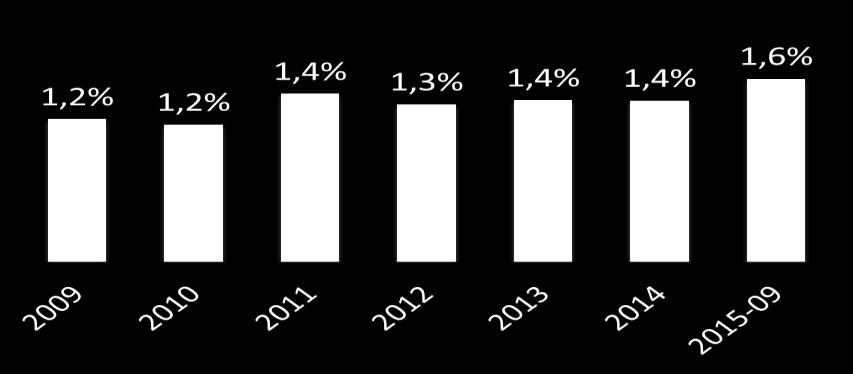
12 Variation of real estate prices in Brazil * * Values adjusted in accordance with the IPCA (denominated INPC up to 1979) Source: FIPE/ZAP
 *1 Cruzado Monetary Plan Source:")
13 Variation of real estate prices in Brazil * *1 * Values adjusted in accordance with the IPCA (denominated INPC up to 1979) *1 Cruzado Monetary Plan Source: FIPE/ZAP
14 Variation of real estate prices in Brazil. * * Values adjusted in accordance with the IPCA (denominated INPC up to 1979) Source: FIPE/ZAP
15 Variation of real estate prices in Brazil * * Values adjusted in accordance with the IPCA (denominated INPC up to 1979) Source: FIPE/ZAP
16 Variation of real estate prices in Brazil * * Values adjusted in accordance with the IPCA (denominated INPC up to 1979) Source: FIPE/ZAP
17 Variation of real estate prices in Brazil * * Values adjusted in accordance with the IPCA (denominated INPC up to 1979) Source: FIPE/ZAP
 Source:")
18 Variation of real estate prices in Brazil * * Values adjusted in accordance with the IPCA (denominated INPC up to 1979) Source: FIPE/ZAP
19 Variation of the real estate prices in Brazil * * Values adjusted in accordance with the IPCA (denominated INPC up to 1979) Source: FIPE/ZAP
20 Variation of the real estate prices in Brazil * Fonte: FIPE/ZAP * Values adjusted in accordance with the IPCA (denominated INPC up to 1979) Source: FIPE/ZAP
. *1 Index Fipe/Zap historical (IPCA/IBGE).")
21 Variation of real estate prices in Brazil * *1 *2 * Fipe/Zap historical values adjusted in accordance with the IPCA (Denominated INPC up to 1979); for the USA numbers. Source was Schiller (2015). *1 Index Fipe/Zap historical (IPCA/IBGE). *2 Prices for the USA real estate (Schiller 2015) Source: FIPE/ZAP
 *1 Deflated byincc (FGV) Source:")
22 Variation of real estate prices in Brazil * *1 * Deflated by the IPCA index (IBGE) *1 Deflated byincc (FGV) Source: FIPE/ZAP

23 Variation of real estate prices in Brazil * *1 *2 * Fipe/Zap historical values in BRL adjusted in accordance with the IPCA/INPCA and converted to te USA dollar by the exchange rote on the date and duly adjusted by the CPI. *1 Fine/Zap historical index (IPCA/IBGE) *2 Fine/Zap historical index (USD) Source: FIPE/ZAP
 *2 Salary formal mass. Source: RAIS (up to 1997) and FGTS from 1997 to the present.")
24 Variation of real estate prices in Brazil * *1 *2 * Values adjusted in accordance with the IPCA (Denominated INPC up to 1979); for the wage and salary mass. *1 Fine/Zap historical index (IPCA/IBGE) *2 Salary formal mass. Source: RAIS (up to 1997) and FGTS from 1997 to the present.

25 Elements of real estate prices Subtitles: Employment Open Areas Bedromms Suites Balconies Parkinf Spaces Commerce Swimming Pools Metro Schools Slums Parks Hospitals Source: FIPE/ZAP

26 Variation in real estate financing The Real estate market stats to gain value. BRL bilion made available for financiong BRL 113 bilion made available for financing Unstable economy Expansion of the Brazilian Real Estate Market when the crisis endsv BRL 79.0 bilion made available for financiong BRL bilion made available for financing Instability of the Brazilian economy Drop of BRL 75.6 bilion in availability of financing Confirmed fall in real estate prices Source: FIPE/ZAP
27 Real Estate Financing Units Financed Amounts in BRL milions Period Construction Acquisition Total Construction Acquisition Total Jan Feb Mar Apr May Jun Jul Aug Sep Oct Nov Dec Total Source: Abecip and the Banco Central Obs: Repairs and material for construiction are included in the Construction linr.
28 Real Estate Financing Financed Units Jan Fev Mar Abr Mai Jun Jul Ago Set Out Nov Dez Construção Construction Aquisição Acquisition Values Financed Jan Fev Mar Abr Mai Jun Jul Ago Set Out Nov Dez Construção Construction Aquisição Acquisition
29 Real Estate Financing Period Financed Units Values in R$ Million Construction Aquisition Total Construction Aquisition Total Jan Feb Mar Apr May June July Aug Sept Oct Nov Dec Total Source: Abecip & Banco Central Obs: Repairs and construction material are included in Costruction.
30 Real Estate Financing Financed units Jan Fev Mar Abr Mai Jun Jul Ago Set Out Nov Dez Construção Construction Aquisição Acquisition Values financed Jan Fev Mar Abr Mai Jun Jul Ago Set Out Nov Dez Construção Construction Aquisição Acquisition
31 Units launched Month Period Considered Units Launched jan/ feb/ mar/14 Jan-Mar/ apr/14 Feb-Apr/ may/14 Mar-May/ june/14 Apr-June/ july/14 MayJuly/ aug/14 June-Aug/ sep/14 July-Set/ out/14 Aug-Out/ nov/14 Sep-Nov/ dec/14 Out-Dec/ jan/15 Nov/2014-Jan/ feb/15 Dec/2014-Feb/ mar/15 Jan-Mar/ abr/15 Feb-Apr/ may/15 Mar-May/ jun/15 Apr-Jun/ jul/15 May-Jul/ aug/15 June-Aug/ sep/15 July-Sep/ oct/15 Aug-Out/ nov/15 Sept-Nov/ dec/15 Oct-Dec/ Source: Abrainc/Fipe Last update: 18/02/2016 Methodology available in
32 VGV s launched Reference Month Period Considered jan/14 - feb/14 - VGV s launched ( Lançado (R$ million. nominal) mar/14 Jan-Mar/ abr/14 Feb-Abr/ may/14 Mar-May/ june/14 Apr-June/ july/14 May-July/ aug/14 Jun-Aug/ sep/14 July-Set/ oct/14 Aug-Oct/ nov/14 Sep-Nov/ dec/14 Oct-Dec jan/15 Nov/2014-Jan/ feb/15 Dec/2014-Feb/ mar/15 Jan-Mar/ apr/15 Feb-Apr/ may15 Mar-May/ jun/15 Apr-Jun/ jul/15 May-Jul/ aug/15 June-Aug/ sep/15 July-Set/ oct/15 Aug-Out/ nov/15 Sep-Nov/ dec/15 Oct-Dec/ Source: Abrainc/Fipe Last update: 18/02/2016 Methodology available in
33 Units sold Reference Month Period Considered Units Sold jan/ feb/ mar/14 Jan-Mar/ apr/14 Feb-Apr/ may/14 Mar-May/ june/14 Apr-Jun/ july/14 May-Jul/ aug/14 Jun-Aug/ sep/14 Jul-Sep/ oct/14 Aug-Oct/ nov/14 Sep-Nov/ dec/14 Oct-Dec/ jan/15 Nov/2014-Jan/ feb/15 Dec/2014-Feb/ mar/15 Jan-Mar/ apr/15 Feb-Apr/ may/15 Mar-May/ jun/15 Apr-Jun/ jul/15 May-Jul/ aug/15 Jun-Aug/ sep/15 Jul-Sep/ oct/15 Aug-Out/ nov/15 Sep-Nov/ Dec/15 Oct-Dez/ Source: Abrainc/Fipe Last Update: 18/02/2016 Methodology available in
34 Sales Values Reference Month Period Considered jan/14 - feb/14 - VGV s Launched (BRT million. nominal) mar/14 Jan-Mar/ apr/14 Feb-Apr/ may/14 Mar-May/ June14 Apr-June/ july/14 May-July/ aug/14 June-Aug/ sep/14 July-Sep/ oct/14 Aug-Oct/ nov/14 Sep-Nov/ dec/14 Oct-Dec/ jan/15 Nov/2014-Jan/ Feb15 Dec/2014-Feb/ mar/15 Jan-Mar/ apr/15 Feb-Apr/ may/15 Mar-May/ june/15 Apr-June/ july/15 May-July/ aug/15 June-Aug/ sep/15 July-Sep/ oct/15 Aug-Out/ nov/15 Sep-Nov/ dec/15 Oct-Dec/ Source: Abrainc/Fipe Last Update: 18/02/2016 Methodology available in
35 Offers Available Reference Month Period Considered Final Offer (units) jan/ feb/ mar/14 Jan-Mar/ apr/14 Feb-Apr/ may/14 Mar-May/ jun/14 Apr-Jun/ jul/14 May-Jul/ aug/14 Jun-Aug/ sep/14 Jul-Sep/ oct/14 Aug-Oct/ nov/14 Sep-Nov/ dec/14 Oct-Dec/ jan/15 Nov/2014-Jan/ feb/15 Dec/2014-Feb/ mar/15 Jan-Mar/ apr/15 Feb-Apr/ may/15 Mar-May/ jun/15 Apr-Jun/ jul/15 May-Jul/ aug/15 Jun-Aug/ sep/15 Jul-Sep/ oct/15 Aug-Oct/ nov/15 Sep-Nov/ dec/15 Oct-Dec/ Source: Abrainc/Fipe Last Update: 18/02/2016 Methodology available in
36 Sales & Offer Reference Month Period Considered VSO trimestral jan/ feb/ mar/ apr/14 Fev-Apr/ % may/14 Mar-May/ % jun/14 Apr-Jun/ % jul/14 May-Jul/ % aug/14 Jun-Aug/ % sep/14 Jul-Sep/ % oct/14 Aug-Oct/ % nov/14 Sep-Nov/ % dec/14 Oct-Dez/ % jan/15 Nov/2014-Jan/ % feb/15 Dec/2014-Feb/ % mar/15 Jan-Mar/ % apr/15 Fev-Apr/ % may/15 Mar-May/ % jun/15 Apr-Jun/ % jul/15 May-Jul/ % aug/15 Jun-Aug/ % sep/15 Jul-Sep/ % oct/15 Aug-Oct/ % nov/15 Sep-Nov/ % dec/15 Oct-Dec/ % Source: Abrainc/Fipe Last Update: 18/02/2016 Methodology available in
37 Deliveries Reference Month Period Considered Unidades entregues jan/14 - fev/14 - mar/14 Jan-Mar/ apr/14 Feb-Apr/ may/14 Mar-May/ jun/14 Apr-Jun/ jul/14 May-Jul/ aug/14 Jun-Aug/ sep/14 Jul-Sep/ oct/14 Aug-Oct/ nov/14 Sep-Nov/ dec/14 Oct-Dec/ jan/15 Nov/2014-Jan/ feb/15 Dec/2014-Feb/ mar/15 Jan-Mar/ apr/15 Feb-Apr/ may/15 Mar-May/ jun/15 Apr-Jun/ jul/15 May-Jul/ aug/15 Jun-Aug/ sep/15 Jul-Sep/ oct/15 Aug-Oct/ nov/15 Sep-Nov/ dec/15 Oct-Dec/ Source: Abrainc/Fipe Last Update: 18/02/2016 Methodology available in
38 I research therefore I know Heitor Kuser The key to success in business is to perceive where the world is heading to and get there first Bill Gates Some people use statistics in the same way as drunks use light poles more for support than for illumination Andrew Long An approximate reply for the right problem is worth much more than an exact reply for an approximate problem John Wilder Tukey I think therefore I am - René Descarte I research therefore I know Heitor Kuser
39 Our commitment makes all the difference! Phone
Kempen & Co Spanish Property Seminar Madrid 26th June, 2014
 Kempen & Co Spanish Property Seminar Madrid 26th June, 2014 SCHIBSTED CLASSIFIED MEDIA Leading online classifieds business in Europe 29 countries 1.500 employees 525 M turnover OUR FAMILY IN SPAIN 10.000.000
Puerto Rico Housing Finance Authority Housing Stimulus Programs
 Puerto Rico Housing Finance Authority Housing Stimulus Programs March 31, 2012 (Final with US Data) Total sales assisted by PRHFA stimulus from $240MM Fund Assignment As of March 31, 2012 Silent Second
MLS of Greater Cincinnati - Charts for the Month: November 2017
 MLS of Greater Cincinnati - Charts for the Month: November 2017 The following charts provide an overview of what has occurred in the MLS over the past month. Each chart provides a historical trend. The
Puerto Rico Housing Finance Authority Housing Stimulus Programs
 Puerto Rico Housing Finance Authority Housing Stimulus Programs June 30, 2011 (Preliminary June US data not yet available) Total sales assisted by PRHFA stimulus from $180MM Fund Assignment As of June
California Housing Market Update. Monthly Sales and Price Statistics November 2018
 California Housing Market Update Monthly Sales and Price Statistics November 2018 Home Sales: Largest Decline Since 2014 California, November 2018 Sales: 381,400 Units, -4.6% YTD, -13.4% YTY 700,000 600,000
Outlook for Median Home Selling Prices. United States data are useless for us.
 Outlook for Median Home Selling Prices Outline United States Data Unobserved Prices The Future of California s Median Home Price Bill Watkins August 28, 28 2.% Existing Single-family Housing Sales percent
July 2012 was $162,256. ($153,956). was $314,607. was $172,488. ($164,426). Kansas City Region Average Sales Price - Existing Homes
. was $314,607. was $172,488. ($164,426). Kansas City Region Average Sales Price - Existing Homes") July 212 Kansas City Regional Real Estate Market Report Average Sales Price The average exis ng home sale price in July 212 was $162,256. 25 Kansas City Region Average Sales Price - Existing Homes July
July 212 Kansas City Regional Real Estate Market Report Average Sales Price The average exis ng home sale price in July 212 was $162,256. 25 Kansas City Region Average Sales Price - Existing Homes July
August Discussion Material
 Discussion Material August, 2018 August, 2018 Disclaimer This presentation is only indicative of the Company's intention to develop the mentioned projects. The images presented are merely illustrative,
SFR Condo Residential Lot Sales Inventory Sales Inventory Sales Inventory. Month YTD Month Month YTD Month Month YTD Month
 Grand Strand Market Report 2017 capped off a great year for the Grand Strand as full year SFR sales volume and median sales price were up 9.8% and 4.3%, respectively. Condo sales activity increased 3.0%
California Housing Market Update. Monthly Sales and Price Statistics October 2018
 California Housing Market Update Monthly Sales and Price Statistics October 2018 Sales Had the 2 nd Largest Drop in the Last 6 Months California, October 2018 Sales: 397,060 Units, -3.7% YTD, -7.9% YTY
SE Michigan Residential Real Estate Recovery Are we there yet or is it over?
 SE Michigan Residential Real Estate Recovery Are we there yet or is it over? Changing View of Residential Transactions Changing View of Residential Transactions 2015 Short Sales 3% Leases Bank 11% Owned
California Housing Market Update. Monthly Sales and Price Statistics December 2018
 California Housing Market Update Monthly Sales and Price Statistics December 2018 Sales Reached the Lowest Level since Jan 2015 California, December 2018 Sales: 372,260 Units, -5.2% YTD, -11.6% YTY 700,000
Economic and Housing Market Outlook ( ) October 31, Contra Costa AOR
 October 31, Contra Costa AOR") Economic and Housing Market Outlook (2012 2013) Contra Costa AOR October 31, 2012 Oscar Wei Senior Research Analyst California Association of REALTORS Overview US and California Economies California Housing
Economic and Housing Market Outlook (2012 2013) Contra Costa AOR October 31, 2012 Oscar Wei Senior Research Analyst California Association of REALTORS Overview US and California Economies California Housing
California Housing Market Update. Monthly Sales and Price Statistics September 2018
 California Housing Market Update Monthly Sales and Price Statistics September 2018 Sales Had the Largest Decline since March 2014 California, September 2018 Sales: 382,550 Units, -3.3% YTD, -12.4% YTY
Housing Market Cycles
 MEGA AGENT Market Update Gary Keller and Jay Papasan 2 The U.S. Housing Market Keller Williams Realty, Inc. Housing Market Cycles 4 The U.S. Housing Market Housing Market Cycles 5 The U.S. Housing Market
Monthly Indicators % % - 3.5%
 Monthly Indicators 2017 New Listings were up 6.3 percent for the category but decreased 33.1 percent for the category. Pending Sales increased 5.0 percent for but decreased 1.3 percent for. The Median
Changing Economic Times. Market Pulse. Dr. Gary Jackson Director, Regional Economic Research Institute Florida Gulf Coast University April 8, 2008
 Changing Economic Times Presented to: Market Pulse Bonita Springs Area Chamber of Commerce Bonita Springs-Estero Association of REALTORS, Inc. Dr. Gary Jackson Director, Regional Economic Research Institute
Second Quarter 2008 Results
 Second Quarter 2008 Results Earnings Release and Supplemental Financial Information Investor Relations Contact: Julia Freitas ri@gafisa.com.br 1 Overview of 2Q08 Results - Wilson Amaral, CEO Financial
The State of the U.S. & Washington CRE Market: 2008 Review/2009 Outlook
 The State of the U.S. & Washington CRE Market: 2008 Review/2009 Outlook Copyright 2008 CoStar Group, Inc. All Rights Reserved. Although CoStar makes efforts to ensure the accuracy and reliability of the
Housing Price Forecasts. Illinois and Chicago PMSA, December 2015
 Housing Price Forecasts Illinois and Chicago PMSA, December 2015 Presented To Illinois Association of Realtors From R E A L Regional Economics Applications Laboratory, Institute of Government and Public
While a project is typically acquired on a specific date
 A Presentation of the National Association of Home Builders While a project is typically acquired on a specific date Building rehab (if there are multiple buildings) is typically completed building by
THE VALUE PROPOSITION OF A STRONG INDUSTRY ASSOCIATION SCOTT ANDISON
 THE VALUE PROPOSITION OF A STRONG INDUSTRY ASSOCIATION SCOTT ANDISON JANUARY 15, 2016 THE LINE UP THE FRPO BRAND INDUSTRY PROFILE THE NEED FOR INDUSTRY ADVOCACY SELECT POLICY PRIORITIES QUESTIONS 2 Professional
Monthly Indicators + 7.3% + 6.6% + 8.3% Single-Family Market Overview Condo Market Overview New Listings Pending Sales.
 Monthly Indicators 2018 The three most prominent national market trends for residential real estate are the ongoing lack of abundant inventory, the steadily upward movement of home prices and year-over-year
Monthly Indicators % % - 9.2%
 Monthly Indicators 2016 New Listings were down 1.4 percent for single family/duplex homes and 25.0 percent for townhouse-condo properties. Pending Sales increased 58.3 percent for single family/duplex
Information sheet A Data
 House prices: Statistics activity House prices change over time, but do so at different rates in different places. In this activity you will use statistical diagrams and measures to compare house prices
Patience required in Calgary's housing market recovery Jul. 2018
 July 18 MONTHLY STATISTICS PACKAGE City of Calgary Patience required in Calgary's housing market recovery 18 City of Calgary, August 1, 18 Recent struggles in the job market, accompanied by yet another
May 2008 MLS Month in Review
 May 28 MLS Month in Review The Albuquerque Market continues to improve, and it s evident that finally, the negative media is turning into positive media. This month s TOP Selling Price Range is $2K to
Monthly Indicators + 4.8% - 3.5% %
 Monthly Indicators 2015 New Listings were up 45.0 percent for single family/duplex homes but decreased 44.1 percent for townhouse-condo properties. Pending Sales increased 14.3 percent for single family/duplex
Minneapolis St. Paul Residential Real Estate Index
 University of St. Thomas Minneapolis St. Paul Residential Real Estate Index October 2017 About the Report: The University of St Thomas Residential Real Estate Index has been developed by the Shenehon Center
THE OUTLOOK FOR HOUSING IN ILLINOIS
 THE OUTLOOK FOR HOUSING IN ILLINOIS Jonathan Smoke Chief Economist January 25, 2017 NATIONAL TRENDS 2 2000.01 2000.05 2000.09 2001.01 2001.05 2001.09 2002.01 2002.05 2002.09 2003.01 2003.05 2003.09 2004.01
A A p p r ril 2017
 April 17 17 Housing market retains momentum in April Citywide prices hold steady as labour market improves City of Calgary, May 1, 17 Calgary s housing market continued to show signs of stability in April.
1 June FNB House Price Index - Real and Nominal Growth MAY FNB HOUSE PRICE INDEX FINDINGS
 1 June 2016 MARKET ANALYTICS AND SCENARIO FORECASTING UNIT JOHN LOOS: HOUSEHOLD AND PROPERTY SECTOR STRATEGIST 087-328 0151 john.loos@fnb.co.za THEO SWANEPOEL: PROPERTY MARKET ANALYST 087-328 0157 tswanepoel@fnb.co.za
The Real Estate Market in Southern Tasmania
 The Real Estate Market in Southern Tasmania 1995 to 2018 Real Estate by Nigel Heaven Director of Property Marketing & Management Pty Ltd Involved in over 0 property sales in the past 23 years Real Estate
Asking Price Index Released 12/02/16 February 2016
 EMBARGOED UNTIL 12/02/16 HOME.CO UK ASKING PRICE INDEX February 2016 Released: 12/02/2016 1 of 6 Asking Price Index Released 12/02/16 February 2016 England Prices Take a Spring Leap Headlines England prices
Sep September 2018
 18 September 18 MONTHLY STATISTICS PACKAGE City of Calgary Persistent buyers market continues 18 City of Calgary, October 1, 18 With no change in the economic climate, Calgary s sales activity totaled
Monthly Statistics Package November 2015
 Vancouver Island Real Estate Board Monthly Statistics Package November 2015 FOR IMMEDIATE RELEASE December 1, 2015 November Sales Activity Up Significantly From One Year Ago NANAIMO, BC November sales
MONTHLY STATISTICS PACKAGE. City of Calgary. May creb.com
 MONTHLY STATISTICS PACKAGE City of Calgary May 1 creb.com Housing supply swells in cool spring market MONTHLY STATISTICS PACKAGE City of Calgary May 1 City of Calgary, June 1, 1 Calgary s housing inventory
Monthly Statistics Package July 2016
 Vancouver Island Real Estate Board Monthly Statistics Package July 2016 FOR IMMEDIATE RELEASE August 2, 2016 Home Sales a Bit Cooler in July But Significantly Higher Than Last Year NANAIMO, BC Home sales
2018 Real Estate Forecast Breakfast. Real Estate Market Update
 2018 Real Estate Forecast Breakfast Central Oregon Association of REALTORS Real Estate Market Update Paul C. Bishop, PhD, CBE Vice President, Research NATIONAL ASSOCIATION OF REALTORS February 22, 2018
California Housing Market Update. Monthly Sales and Price Statistics August 2018
 California Housing Market Update Monthly Sales and Price Statistics August 2018 Sales Declined for the 4 th Consecutive Month California, August 2018 Sales: 399,600 Units, -2.1% YTD, -6.6% YTY 700,000
UDIA WA PROPERTY MARKET STATISTICS
 UDIA WA PROPERTY MARKET STATISTICS OCTOBER 217 1 IN THIS ISSUE KEY TRENDS INDUSTRY UPDATE 3 4 ECONOMY RESIDENTIAL LAND DEVELOPMENT RESIDENTIAL PROPERTY SETTLEMENTS RESIDENTIAL PROPERTY MARKET RESIDENTIAL
California Housing Market Update. Monthly Sales and Price Statistics May 2018
 California Housing Market Update Monthly Sales and Price Statistics May 2018 Sales Lost Momentum as Mortgage Rates Continued to Climb California, May 2018 Sales: 409,270 Units, +0.3% YTD, -4.6% YTY 700,000
MARKET OUTLOOK FOR SAN MATEO
 MARKET OUTLOOK FOR SAN MATEO Jonathan Smoke Chief Economist August 2, 2016 NATIONAL TRENDS 2 JOB CREATION REBOUNDED IN JUNE 229,000 jobs created by month in 2015; 172,000 average this year Employment and
MonthlyStatistics DECEMBER 2017
 MonthlyStatistics DECEMBER 2017 FOR IMMEDIATE RELEASE January 2, 2018 VIREB Posts the Strongest December on Record NANAIMO, BC The Vancouver Island Real Estate Board (VIREB) reports that on a seasonally
MonthlyStatistics AUGUST 2018
 MonthlyStatistics AUGUST 2018 FOR IMMEDIATE RELEASE September 4, 2018 Sales Bounce Back Slightly From July But Still Lower Than in 2017 NANAIMO, BC Sales of single-family homes in August were seven per
May Discussion Material
 Discussion Material May, 2018 May, 2018 Disclaimer This presentation is only indicative of the Company's intention to develop the mentioned projects. The images presented are merely illustrative, and the
Rightmove House Price Index
 Rightmove House Price Index The largest monthly sample of residential property prices January 2018 London edition Asking prices down 1.4% in London this month as sellers tempt New Year buyers New-to-market
Competitive Strategies and Value Innovation. Contents are subject to change. For the latest updates visit
 Competitive Strategies and Value Innovation Page 1 of 9 Why Attend This course introduces key concepts, tools, and principles of strategic management allowing managers to create their organization's unique
Bureau of Business Research Webinar Series October 2016
 Bureau of Business Research Webinar Series October 2016 Presented by Eric Thompson W.W. Marshall Associate Professor of Economics Director, Bureau of Business Research Outline Importance of Affordable
MARKET STRATEGY VIEWPOINT U.S. Housing Decelerating
 Jan-01 Oct-01 Jul-02 Apr-03 Jan-0 Oct-0 Jul-05 Apr-0 Jan-07 Oct-07 Jul-08 Apr-09 Jan-10 Oct-10 Jul-11 Apr-12 Jan-13 Oct-13 Jul-1 Apr-15 Jan-1 Oct-1 Jul-17 Apr-18 U.S. Housing Decelerating August 27, 2018
Minneapolis St. Paul Residential Real Estate Index
 University of St. Thomas Minneapolis St. Paul Residential Real Estate Index September 2017 Welcome to the latest edition of the UST Minneapolis St. Paul Residential Real Estate Index. The University of
SMALL INVESTORS CAN NOW PROVIDE TURNKEY PROPERTIES NATIONWIDE
 SMALL INVESTORS CAN NOW PROVIDE TURNKEY PROPERTIES NATIONWIDE Large real estate investment firms have been riding a large wave of opportunity and profit margins by providing turnkey rental investment properties
Demand down with net migration
 July 1 Demand down with net migration City of Calgary, August, 1 In step with City census data on declining net migration levels, housing sales activity totaled 1,71 units in July, a 1. per cent decrease
September 2018 MLS Statistical Report
 September 218 MLS Statistical Report Total Sales Blame it on Hurricane Florence but overall, sales dropped drastically in August - down 17%. Total Sales Sept'18 172-17% Sept'17 26-2% Sept'16 211 7% 3 2
M onthly arket. July Table of Contents. Monthly Highlights
 Table of Contents Market Inventory...2 www.gaar.com Monthly Highlights The median sale price of single-family, detached homes climbed to $190,000 in July 2014, the highest level since August 2008. Market
O O ct ct ober 2017
 October Status Quo for Calgary's Housing Market Prices remain similar to last year, but ease in October., November 1, 17 October s housing market conditions closely echoed previous month s trends with
S Sep eptember 2016
 September Detached prices stabilize in soft market, October, The segment of Calgary s housing market with the greatest influence on the overall market is showing signs of pricing stability. The detached
Monthly Indicators % % %
 Monthly Indicators 2016 Percent changes calculated using year-over-year comparisons. New Listings were down 27.6 percent for single family homes and 41.8 percent for townhouse-condo properties. Pending
Monthly Indicators % + 9.7% %
 Monthly Indicators 2016 Percent changes calculated using year-over-year comparisons. New Listings were up 11.1 percent for single family homes and down 30.8 percent for townhouse-condo properties. Pending
2019 Housing Market Forecast. Palos Verdes Peninsula AOR January 8, 2019 Jordan G. Levine Senior Economist
 2019 Housing Market Forecast Palos Verdes Peninsula AOR January 8, 2019 Jordan G. Levine Senior Economist Overview Good News: Economic fundamentals solid Homeownership still the dream Rates might not go
São Paulo: the lowest vacancy rate in the world.
 211 OFFICE SÃO PAULO OFFICE MARKET REPORT OFFICE RESEARCH REPORT CLASS A+ and A São Paulo: the lowest vacancy rate in the world. Economic Overview The economy of São Paulo state performed well in the first
MONTHS OF SUPPLY AND PRICE CHANGES. Home improvement November marks a rise in sales. MONTHLY STATISTICS PACKAGE City of Calgary. Nov.
 November 17 17 Home improvement November marks a rise in sales. City of Calgary, December 1, 17 The November housing market was spurred by a rise in sales, particularly in the lower price ranges. Sales
England Occupancy Survey May 2017 SUMMARY OF RESULTS
 England Occupancy Survey 2017 SUMMARY OF RESULTS Room occupancy in 2017 increased +1% to 73%. Bedspace occupancy also increased +1% to 54%. Weekday room occupancy remained stable at 72% whilst weekend
REIDIN.com The United Arab Emirates Residential Property Price Indices: April 2011 Results. Issue: 16 15/05/2011
 REIDIN.com The United Arab Emirates Residential Property Price Indices: April 2011 Results Issue: 16 15/05/2011 Content Page Dubai Residential Property Price Indices: Sales Price Indices 3-7 Dubai Residential
In this presentation we make forward-looking statements that are subject to risks and uncertainties.
 Disclaimer In this presentation we make forward-looking statements that are subject to risks and uncertainties. Such statements are based on beliefs and assumptions of our management and information to
The Effective Analyst: From Research to Execution. Contents are subject to change. For the latest updates visit
 The Effective Analyst: From Research to Page 1 of 8 Why Attend Solving problems in the business world is essential to keeping things moving along smoothly. While problems differ in complexity, almost all
Oversupply persists despite improved sales activity for affordable product Mar. 2019
 March 19 MONTHLY STATISTICS PACKAGE Oversupply persists despite improved sales activity for affordable product 19, April 1, 19 March saw a modest decline in city wide sales activity compared to last year.
Scott Market Report Stronger Sales Continue
 June 20 Scott Market Report Stronger Sales Continue The Outer Banks real estate market is seeing good signs in most market segments. After a somewhat slow start to 20, sales agreements picked up significantly
New year kicks off with slow sales Jan. 2019
 January 19 19 MONTHLY STATISTICS PACKAGE New year kicks off with slow sales 19, February 1, 19 As economic challenges linger into 19, housing markets remain on a sluggish pace. January sales totalled 8
Certificate in Financial Management
 Certificate in Financial Page 1 of 11 Why Attend Most strategic and operational business decisions rely on a fundamental knowledge of financial management. Speaking and understanding the language of finance
Greater Las Vegas Snapshot by Sale Type
 9.% Closed Sales Trend by Type December Closings by Type 8.% 7.% 6.% 8% Short Sales 1% 5.% 4.% 3.% Traditional Equity 82% 2.% 1.%.% Greater Las Vegas Snapshot by Sale Type - SFR Only Available List Price
CALIFORNIA ECONOMIC & MARKET OUTLOOK. October 29,2014 Contra Costa Association of REALTORS Leslie Appleton Young, Chief Economist
 2014 2015 CALIFORNIA ECONOMIC & MARKET OUTLOOK October 29,2014 Contra Costa Association of REALTORS Leslie Appleton Young, Chief Economist OVERVIEW Economic Outlook California Housing Market Outlook Housing
MonthlyStatistics JANUARY 2018
 MonthlyStatistics JANUARY 2018 FOR IMMEDIATE RELEASE February 1, 2018 Sales Return to Seasonal Norms in January NANAIMO, BC Coming off the busiest December on record, sales in the VIREB area returned to
2017 RESIDENTIAL REAL ESTATE MARKET REPORT
 2017 RESIDENTIAL REAL ESTATE MARKET REPORT Published January 26, 2018 Our market reports have been focused on the effects of low inventory on our housing market and for good reason. December 2017 marked
UDIA WA PROPERTY MARKET STATISTICS
 UDIA WA PROPERTY MARKET STATISTICS JUNE 218 1 IN THIS ISSUE KEY TRENDS INDUSTRY UPDATE ECONOMY RESIDENTIAL LAND DEVELOPMENT RESIDENTIAL PROPERTY SETTLEMENTS RESIDENTIAL PROPERTY MARKET RESIDENTIAL CONSTRUCTION
UDIA WA PROPERTY MARKET STATISTICS
 UDIA WA PROPERTY MARKET STATISTICS APRIL 218 1 IN THIS ISSUE KEY TRENDS INDUSTRY UPDATE ECONOMY RESIDENTIAL LAND DEVELOPMENT RESIDENTIAL PROPERTY SETTLEMENTS RESIDENTIAL PROPERTY MARKET RESIDENTIAL CONSTRUCTION
Tri-Cities Insider September 2015
 Tri-Cities Insider Your Current Real Estate Market 1 Go to: http://grouponetricities.com click on this logo to view market info each month. 2 3 Yearly Comparisons- Real Trends July/June 2015 Housing Market
Monthly Market Watch for Maricopa County An overview of what is happening in the Maricopa County real estate market
 Monthly Market Watch for Maricopa County An overview of what is happening in the Maricopa County real estate market Provided by Susan Kraemer of Prudential Arizona Properties Report overview: This report
Monthly Indicators % % %
 Monthly Indicators 2018 Percent changes calculated using year-over-year comparisons. New Listings were down 12.9 percent for single family homes and 21.3 percent for townhouse-condo properties. Pending
ANNUAL HOUSE PRICE GROWTH RISES TO 4.5%
 ANNUAL HOUSE PRICE GROWTH RISES TO 4.5% 07/11/2017 +4.5% Annual change +0.3% Monthly change +2.3% Quarterly change 225,826 Average Price House prices in the last three months (August-October) were 2.3%
Multi-Family Methodology Analysis
 Multi-Family Methodology 2018 Analysis Assessment Department February, 2018 2018 Multi-Family Assessment Methodology Property assessments in the City of Medicine Hat reflect the fee simple market value
UDIA WA PROPERTY MARKET STATISTICS
 UDIA WA PROPERTY MARKET STATISTICS MAY 218 1 IN THIS ISSUE KEY TRENDS INDUSTRY UPDATE 3 4 ECONOMY RESIDENTIAL LAND DEVELOPMENT RESIDENTIAL PROPERTY SETTLEMENTS RESIDENTIAL PROPERTY MARKET RESIDENTIAL CONSTRUCTION
October 1, Victoria Real Estate Market Continues to Stabilize
 PRESIDENT Kyle Kerr PRESIDENT ELECT Cheryl Woolley SECRETARY TREASURER David Langlois PAST PRESIDENT Ara Balabanian DIRECTORS Jackie Adkins Sandi-Jo Ayers Bill Ethier Karen Dinnie-Smyth Andrew Plank EXECUTIVE
MonthlyStatistics NOVEMBER 2017
 MonthlyStatistics NOVEMBER 2017 FOR IMMEDIATE RELEASE December 1, 2017 Lack of Inventory Continues to Drive Housing Market NANAIMO, BC The Vancouver Island Real Estate Board (VIREB) reports that single-family
Aug. Aug 2018 ust 2018
 August 18 MONTHLY STATISTICS PACKAGE City of Calgary Unemployment rate slows housing market recovery 18 City of Calgary, September, 18 Easing sales, gains in new listings and elevated inventory levels
FOR IMMEDIATE RELEASE Contact: David B. Bennett President & CEO Phone:
 FOR IMMEDIATE RELEASE Contact: David B. Bennett President & CEO Phone: 727-216-32 Email: dbennett@tampabayrealtor.com Real Estate Statistics for September 216 At this time of year everyone starts to get
Residential December 2009
 Residential December 2009 Karl L. Guntermann Fred E. Taylor Professor of Real Estate Adam Nowak Research Associate Year End Review The dramatic decline in Phoenix house prices caused by an unprecedented
MonthlyStatistics JULY 2018
 MonthlyStatistics JULY 2018 FOR IMMEDIATE RELEASE August 1, 2018 Prices Continue to Sizzle in Summer Housing Market NANAIMO, BC Prices of single-family homes, apartments, and townhouses continue to rise
MonthlyStatistics DECEMBER 2018
 MonthlyStatistics DECEMBER 2018 FOR IMMEDIATE RELEASE January 2, 2019 Housing Market in 2018 Performed as Expected NANAIMO, BC Sales of single-family homes in December dropped by 48 per cent from one year
Weak sales persist in Calgary and beyond Jun. 2018
 June 218 MONTHLY STATISTICS PACKAGE City of Calgary Weak sales persist in Calgary and beyond 218 City of Calgary, July 3, 218 Many Canadian energyrelated municipalities within Alberta and Saskatchewan
Housing Bulletin Monthly Report
 January 21 1 Housing Bulletin Monthly Report Most new homes built in second half of 29 25, 2, 15, 1, 5, Dec 7 Jan 8 Feb 8 mar 8 apr 8 Alberta s 29 housing starts increased 72.8 per cent over 28, suggesting
Inner Perth Residential Market Report
 Inner Perth Residential Market Report MARCH QUARTER 2014 Inner Perth Residential Market Market Highlights While Western Australia will experience slowed short term growth as the state transitions from
MonthlyStatistics OCTOBER 2018
 MonthlyStatistics OCTOBER 2018 FOR IMMEDIATE RELEASE November 1, 2018 Prices Continue Rising Despite Moderating Sales NANAIMO, BC Sales of single-family homes in October were 11 per cent higher than in
AAug ugust 2017
 August 17 17 Housing recovery a balancing act Growth in new listings outpaced sales preventing inventory declines City of Calgary, September 1, 17 Sales posted a modest gain in August, but a rise in new
Housing Price Forecasts. Illinois and Chicago PMSA, April 2013
 Housing Price Forecasts Illinois and Chicago PMSA, April 2013 Presented To Illinois Association of Realtors From R E A L Regional Economics Applications Laboratory, Institute of Government and Public Affairs
MonthlyStatistics MAY 2018
 MonthlyStatistics MAY 2018 FOR IMMEDIATE RELEASE June 1, 2018 Single-Family Benchmark Price Surpasses $500,000 in May NANAIMO, BC The benchmark price of a single-family home in the VIREB area broke the
Marine Corps Resident Energy Conservation Program (RECP) MCCS Cherry Point
 MCCS Cherry Point") Marine Corps Resident Energy Conservation Program (RECP) MCCS Cherry Point 1 Welcome Agenda Col Zimmerman Command Representative Program Briefing AMCC Video Questions and Answers 2 Resident Energy Conservation
Marine Corps Resident Energy Conservation Program (RECP) MCCS Cherry Point 1 Welcome Agenda Col Zimmerman Command Representative Program Briefing AMCC Video Questions and Answers 2 Resident Energy Conservation
A Panel Discussion of Developments, Trends and Issues Affecting Commercial Property Iowa Commercial Real Estate Expo
 A Panel Discussion of Developments, Trends and Issues Affecting Commercial Property By Bryon Tack, MAI, CAE Polk County Deputy Assessor January 1 : Assessment of property (appraisal date) Historical data
duna house August issue The latest property market info from Duna House network
 duna house BaromEter 74. issue August 2017 The latest property market info from Duna House network www.dh.hu PRIVACY POLICY Statistical information and estimates published in the Duna House Barometer are
Housing market feels the chill as oversupply continues Feb. 2019
 February 19 19 MONTHLY STATISTICS PACKAGE Housing market feels the chill as oversupply continues 19, March 1, 19 The effects of Calgary s economic climate continue to create weak sales activity and elevated