M onthly arket. July Table of Contents. Monthly Highlights
|
|
|
- Reynold Cole
- 5 years ago
- Views:
Transcription

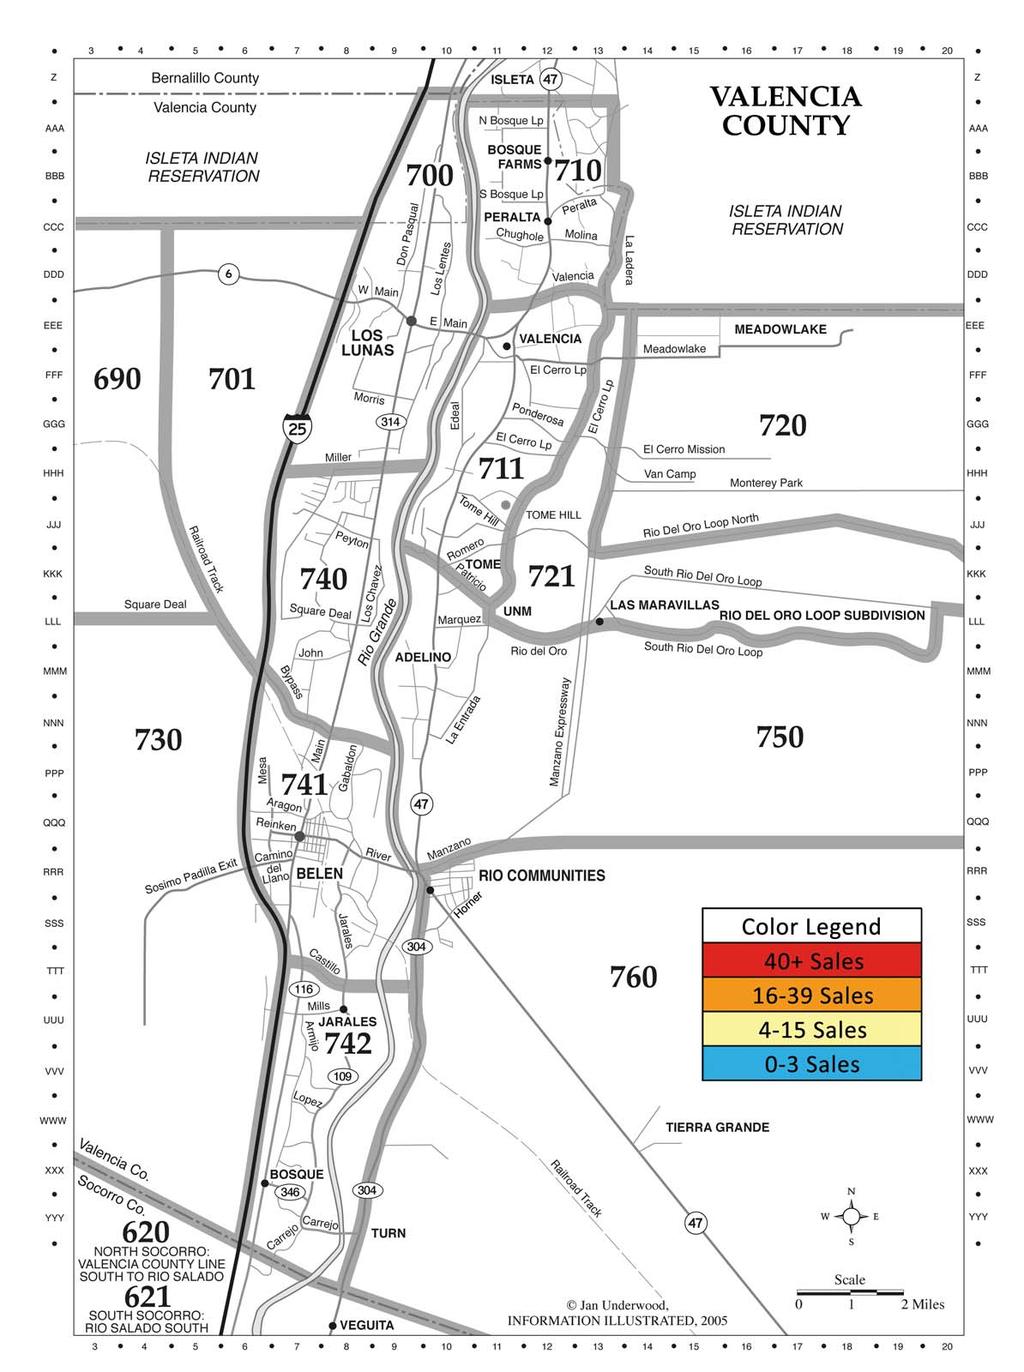
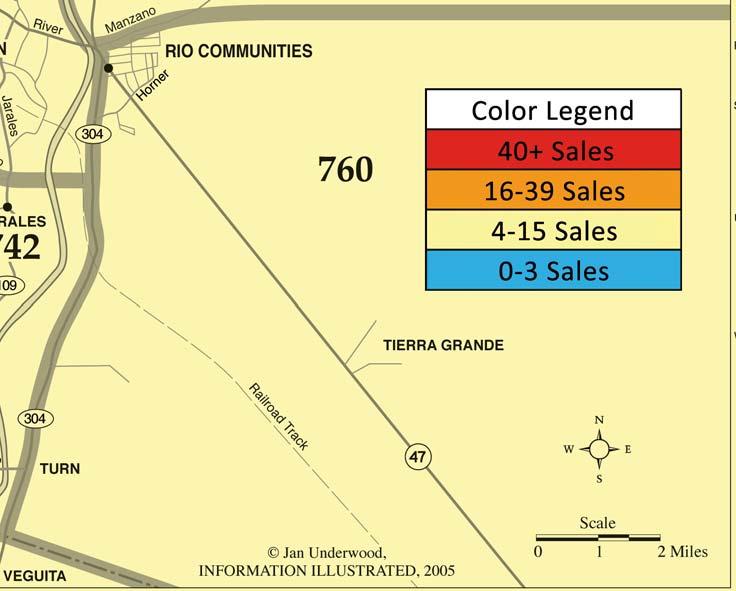
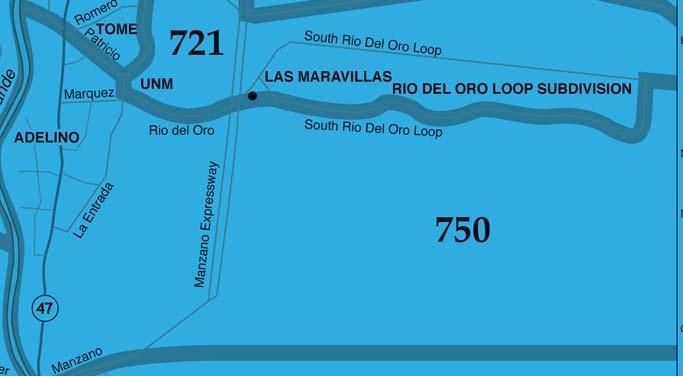
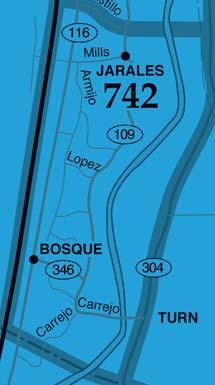
1 Table of Contents Market Inventory Monthly Highlights The median sale price of single-family, detached homes climbed to $190,000 in July 2014, the highest level since August Market Activity...3 Home Sales by Area...4 Closed Sales by Price Supply-Demand/Absorption Rate...7 Home Sales Prices Market Activity by Zip Code...10 Market Overview...11 July had the highest monthly sales count in 2014 with 823 single-family, detached sales. Market Comparisons Area Sales Color Maps M onthly arket R E P O R T July 2014 Contact John Kynor, 2014 GAAR President Phone president@gaar.com
2 Market Inventory Detached Historical Year January 3,750 3,611 3,884 February 3,668 3,676 3,925 March 3,705 3,809 4,164 April 3,806 3,953 4,382 May 3,986 4,112 4,682 June 4,097 4,388 4,937 July 4,152 4,497 4,967 August 4,103 4,578 September 4,081 4,608 October 4,083 4,439 November 3,902 4,255 December 3,587 3,836 Attached Historical Year January February March April May June July August September October November December ,000 5,000 4,000 3,000 2,000 1, Detached homes on market Jul-13 Aug-13 Sep-13 Oct-13 Nov-13 Dec-13 Jan-14 Feb-14 Mar-14 Apr-14 May-14 Jun-14 Jul-14 Detached represents existing single-family detached homes Attached homes on market Jul-13 Aug-13 Sep-13 Oct-13 Nov-13 Dec-13 Jan-14 Feb-14 Mar-14 Apr-14 May-14 Jun-14 Jul-14 Attached represents existing condo/townhomes attached homes SOURCE: Greater Albuquerque Association of REALTORS - based on data from the the Southwest Multiple Listing Service. Data is deemed reliable not guaranteed. 2
3 Market Activity (New, Pending, Closed) Market Activity Month New Pending Closed Jul-13 1, * 939 Aug-13 1, * 857 Sep-13 1, * 769 Oct-13 1, Nov-13 1, Dec Jan-14 1, Feb-14 1, Mar-14 1, Apr-14 1, May-14 1, Jun-14 1, Jul-14 1, Change from last month/year New Listings 1,756 1,734 1,7 27 1,800 2,000 1,578 1,613 1,592 1,600 1,578 1,429 1,613 1,756 1,734 1,7 27 1,800 1,592 1,400 1,600 1,429 1,213 1,249 1,288 1,259 1,400 1,213 1,249 1,288 1,259 1,200 1,091 1,200 1,091 1, , Jan-12 Jul-13 Feb-12 Aug-13 Mar-12 Sep-13 Apr-12 Oct-13 May- Nov-13 Jun-12 Dec-13 Jul-12 Jan-14 Aug-12Sep-12 Feb-14 Mar-14 Oct-12 Apr-14 Nov-12Dec-12 May-14 Jun-14 Jan-13Jul Pending Sales 1,400 1,200 1, , , Jan-12 Jul-13 Feb-12 Aug-13 Mar-12 Sep-13 Apr-12 Oct-13 May- Nov-13 Jun-12 Dec-13 Jul-12 Jan-14 Aug-12Sep-12 Feb-14 Mar-14 Oct-12 Apr-14 Nov-12Dec-12 May-14 Jun-14 Jan-13 Jul Jul-14 Jun-14 Jul-13 New 1,592 1,727 1,578 % Change % 0.89% Pending % Change % -1.10% Closed % Change % % 1,000 1,200 1, Closed Sales Jan-12 Jul-13 Feb-12Mar-12 Aug-13 Sep-13 Apr-12 Oct-13 May- Nov-13 Jun-12 Dec-13 Jul-12 Jan-14 Aug-12Sep-12 Feb-14 Mar-14 Oct-12 Apr-14 Nov-12Dec-12 May-14 Jun-14 Jan-13 Jul Data is for single-family detached homes Closed Sales chart also shows average days on market, indicated by a line. The average days on market for July 2014 detached sales was 60. *Due to an MLS system change in October 2013 the data collection methods for pending sales changed. Pending sales are now calculated only once for a particular property, whether or not that property goes under contract multiple times during the month. Pending sales from 2013 have been adjusted in this report to adjust for the change. 3
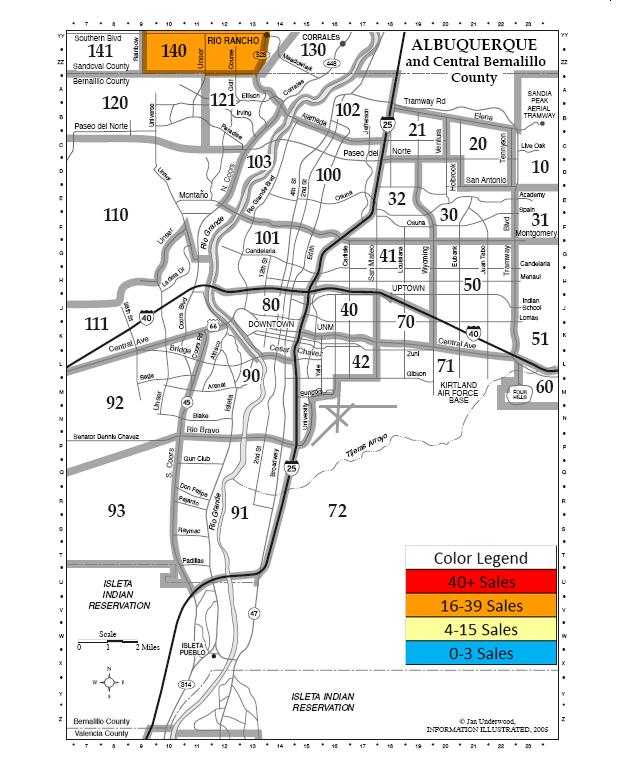
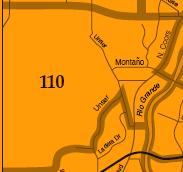
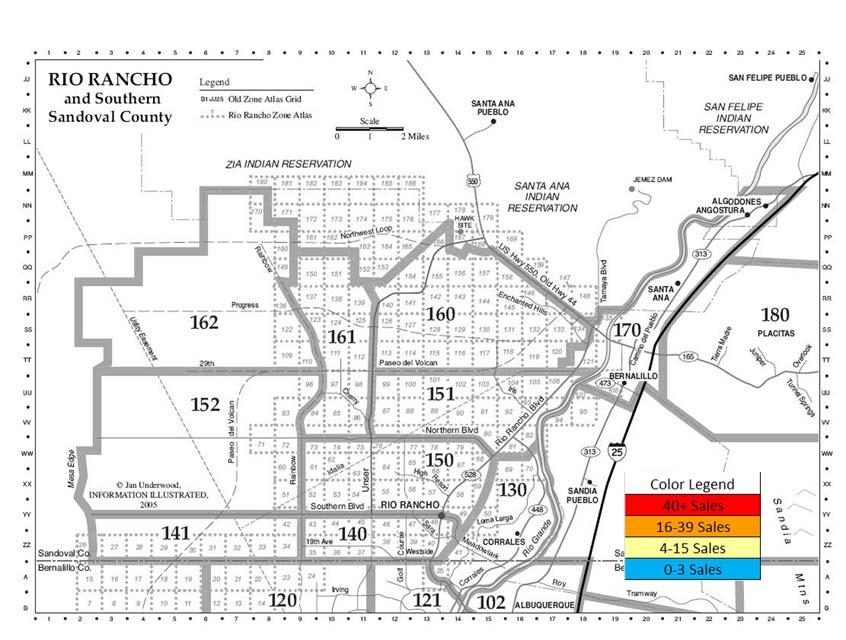
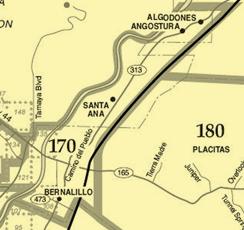
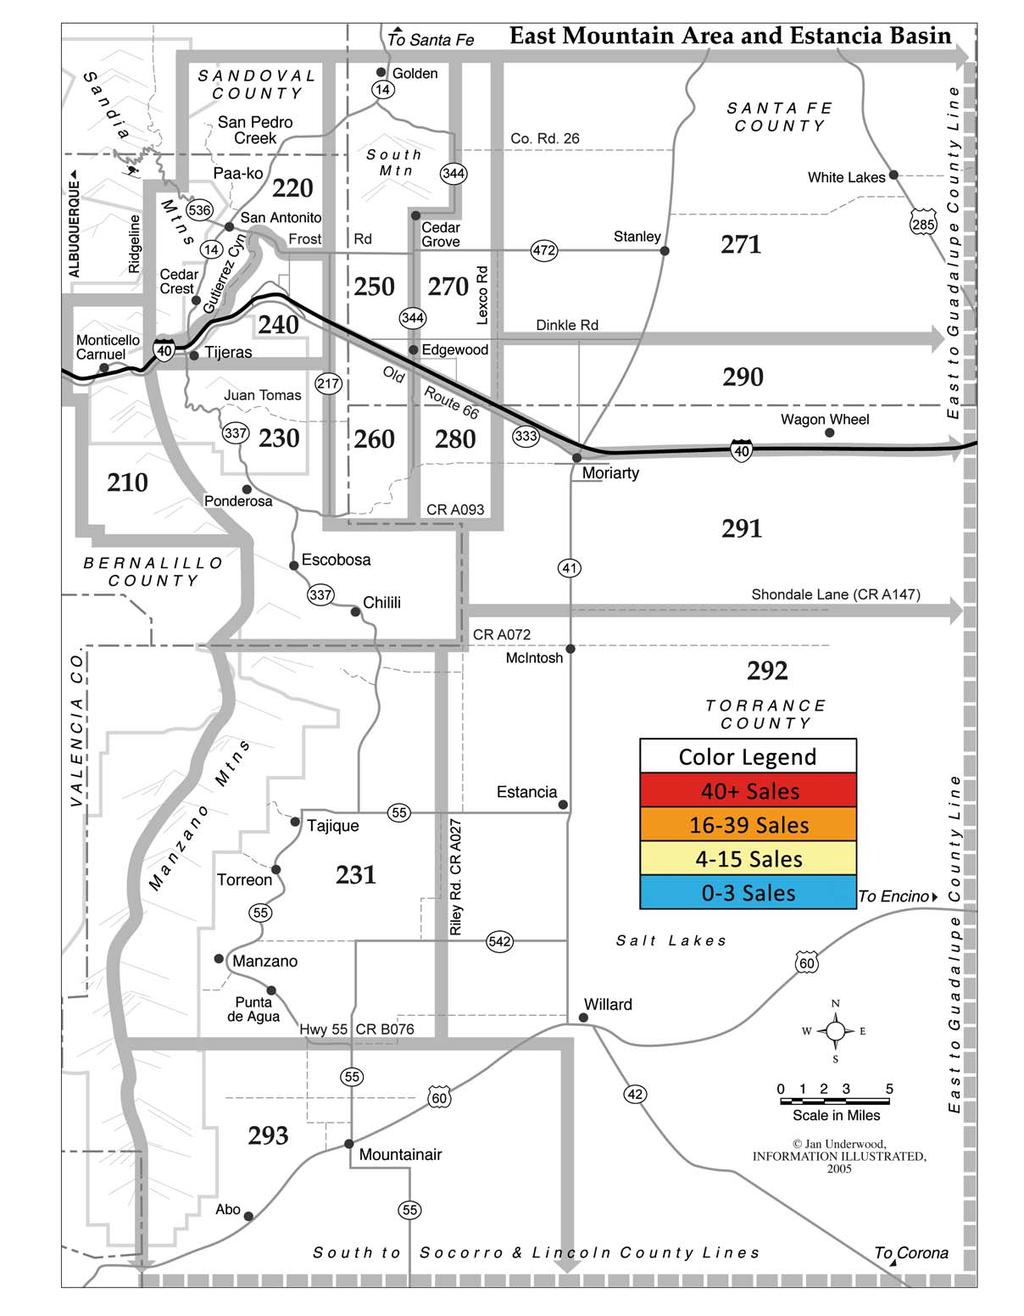
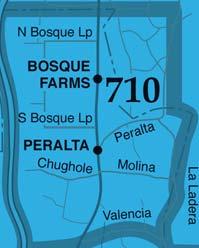
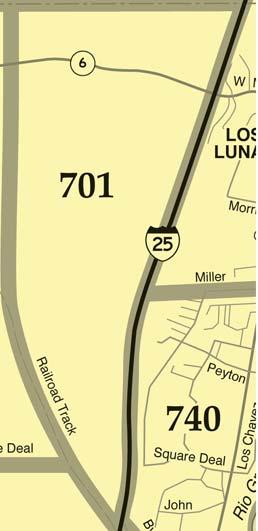
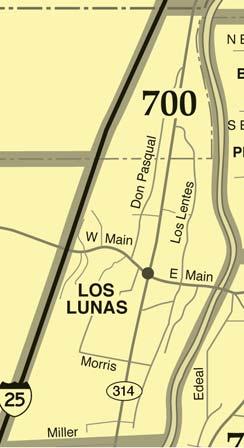
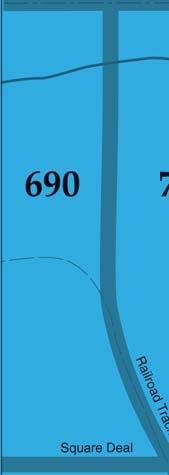
4 Homes Sales by Market Area Single-family detached sales MLS Area Area Name Jul-13 Jul Albuquerque Corrales Rio Rancho Bernalillo Placitas E. Mountains Valencia Co Total All , , Jan. July Detached detached Sales sales and Median Sale Price $220,000 $210,000 $200,000 $190,000 $180,000 $170,000 $160,000 $150,000 $140,000 Condo/townhome (attached) sales MLS Area Area Name Jul-13 Jul Albuquerque Corrales Rio Rancho Bernalillo Placitas E. Mountains Valencia Co. 4 2 Total All Jan. July Attached attached Sales sales and Median Sale Price $180,000 $170,000 $160,000 $150,000 $140,000 $130,000 $120,000 $110,000 $100,000 MLS Areas include East Mountains and Estancia Basin Blue line on charts represents the median sale price for that month. MLS Areas include Belen, Los Lunas, Bosque Farms. SOURCE: Greater Albuquerque Association of REALTORS - based on data from the the Southwest Multiple Listing Service. Data is deemed reliable not guaranteed. 4
5 Closed Sales by Price 160 Detached Sales by Price July historical (in thousands) < 30K Jul Jul Jul M+ Top Selling Price Range for Detached Homes $200,000 - $249,999 SOURCE: Greater Albuquerque Association of REALTORS - based on data from the the Southwest Multiple Listing Service. Data is deemed reliable not guaranteed. 5
6 Closed Sales by Price 20 Attached Sales by Price July historical (in thousands) < 30K Jul Jul Jul M+ Top Selling Price Ranges for Attached Homes $120,000 - $139,999 SOURCE: Greater Albuquerque Association of REALTORS - based on data from the the Southwest Multiple Listing Service. Data is deemed reliable not guaranteed. 6
7 Market Indicators Supply-Demand Year January February March April May June July August September October November December Number of Active Listings Per Buyer (detached) Supply-Demand The Supply-Demand Ratio is calculated by dividing the number of homes for sale (listings available) by the number of total pending sales for that month. The higher the ratio, the more supply there is relative to demand. Absorption Rate Year January February March April May June July August September October November December Month Supply of Homes (detached) Absorption Rate The Absorption Rate measures how long it will take to exhaust or sell the current housing inventory. An average market is traditionally a six-month supply. Data is for single-family detached homes SOURCE: Greater Albuquerque Association of REALTORS - based on data from the the Southwest Multiple Listing Service. Data is deemed reliable not guaranteed. 7
8 Monthly Sale Prices Median Sale Price Monthly Sale Prices Year January $165,000 $158,000 $167,900 February $161,500 $168,500 $169,000 March $159,000 $175,000 $170,000 April $174,775 $168,000 $175,000 May $175,000 $174,900 $180,000 June $172,700 $172,000 $180,000 July $175,000 $182,000 $190,000 August $165,000 $182,500 September $172,000 $177,500 October $166,300 $166,000 November $165,000 $170,000 December $169,500 $185,000 $251,000 $201,000 $151,000 Median SP Average SP Average Sale Price Year January $194,352 $186,051 $203,687 February $195,165 $203,514 $198,483 March $189,676 $202,605 $202,672 April $211,186 $197,908 $215,560 May $211,213 $211,505 $223,193 June $207,679 $212,456 $213,504 July $210,685 $222,505 $230,750 August $201,833 $223,533 September $203,016 $212,307 October $202,827 $208,152 November $204,653 $207,986 December $211,191 $219,909 $101,000 $51,000 $1,000 Jul-13 Aug-13 Sep-13 Oct-13 Nov-13 Dec-13 Jan-14 Feb-14 Mar-14 Apr-14 May-14 Jun-14 Jul-14 Data is for single-family detached homes SOURCE: Greater Albuquerque Association of REALTORS - based on data from the the Southwest Multiple Listing Service. Data is deemed reliable not guaranteed. 8
9 Historical Home Prices Year Median Sale Price Median Sale Price 2003 $148, $152, $174, $191, $214, $196, $185, $186, $178, $175, $182, $190,000 % Change From Previous Year 9.63% 3.04% 14.10% 10.29% 11.99% -8.79% -5.61% 0.54% -4.30% -1.69% 4.00% 4.40% $251,000 $201,000 $151,000 Historical Sale Prices (July Only) Median SP Average SP Average Sale Price Year Average Sale Price 2003 $178, $186, $213, $233, $261, $240, $224, $230, $210, $210, $222, $230,750 % Change From Previous Year 9.41% 4.86% 14.42% 9.35% 11.91% -7.91% -6.94% 2.65% -8.44% -0.05% 5.61% 3.71% $101,000 $51,000 $1, Data is for single-family detached homes SOURCE: Greater Albuquerque Association of REALTORS - based on data from the the Southwest Multiple Listing Service. Data is deemed reliable not guaranteed. 9
10 July Market Activity by Zip Code Zip Code Active listings Sold Listings % of All Sales Zip Code Active listings Sold Listings % of All Sales Zip Code Active listings Sold Listings % of All Sales % % % % % % % % % % % % % % % % % % % % % % % % % % % % % % % % % % % % Any Zip code 21that is located 2.55% in the Southwest MLS 232Service Area 55 that had 6.68% at least 1 Active listing or 1 Sale that month will 0 be included 0.00% in the Zip Code report % SOURCE: Greater Albuquerque Association of REALTORS - based on data from the the Southwest Multiple Listing Service. Data is deemed reliable not guaranteed. 10
11 Market Overview Percent Change (ATT) 2014 (ATT) 2013 Percent Change (DET+ATT) 2014 Yearto-Date (DET+ATT) 2013 Yearto-Date Percent Change New Listings Jul 1,592 1, % % 12,013 10, % Aug 1, ,383 Sep 1, ,704 Pending Sales Jul * -1.10% * % 6,990 7,179* -2.63% Aug 886* 104* 8,169* Sep 770* 52* 8,991 Closed Sales Jul % % 5,371 5, % Dollar Volume of Closed Sales (in millions) Aug ,586 Sep ,428 Jul $190.0 $ % $10.7 $ % $1,127.3 $1, % Aug $191.6 $10.9 $1,339.1 Sep $163.3 $10.2 $1,512.6 Median Sales Price Jul $190,000 $182, % $136,000 $129, % Aug $182,500 $126, Sep $177,500 $128,000 Average Sales Price Jul $230,750 $222, % $142,363 $139, % Aug $223,533 $129, Sep $212,307 $139,424 Total Active Jul 4,967 4, % % Listings Available Aug 4, Sep 4, Average Days on Market Jul % % Aug Sep *Due to an MLS system change in October 2013 the data collection methods for pending sales changed. Pending sales are now calculated only once for a particular property, whether or not that property goes under contract multiple times during the month. Pending sales from 2013 have been adjusted in this report to adjust for the change. 11
12 Market Comparison Albuquerque & Rio Rancho City of Albuquerque Percent Change City of Rio Rancho Percent Change New Listings Jul 1,030 1, % New Listings Jul % Aug 893 Aug 250 Sep 790 Sep 211 Pending Sales Jul * -1.93% Pending Sales Jul * -5.79% Aug 603* Aug 154* Sep 501* Sep 139* Closed Sales Jul % Closed Sales Jul % Aug 579 Aug 178 Sep 517 Sep 142 Median Sales Price Jul $190,000 $190, % Median Sales Price Jul $175,000 $150, % Aug $185,000 Aug $175,115 Sep $177,000 Sep $175,000 Average Sales Price Jul $233,648 $229, % Average Sales Price Jul $191,803 $178, % Aug $231,706 Aug $188,681 Sep $216,102 Sep $180,397 Total Active Jul 2,887 2, % Total Active Jul % Aug 2,569 Aug 732 Sep 2,617 Sep 724 Average Days on Market Jul % Average Days on Market Jul % Aug 48 Aug 57 Sep 54 Sep 61 *Due to an MLS system change in October 2013 the data collection methods for pending sales changed. Pending sales are now calculated only once for a particular property, whether or not that property goes under contract multiple times during the month. Pending sales from 2013 have been adjusted in this report to adjust for the change. 12
13 Market Comparison East Mountains/Estancia Basin & Valencia County East Mountains & Estancia Basin Percent Change Valencia County Percent Change New Listings Jul % New Listings Jul % Aug 97 Aug 110 Sep 68 Sep 96 Pending Sales Jul 49 44* 11.36% Pending Sales Jul 63 58* -7.94% Aug 37* Aug 58* Sep 37* Sep 76* Closed Sales Jul % Closed Sales Jul % Aug 23 Aug 47 Sep 30 Sep 54 Median Sales Price Jul $230,000 $210, % Median Sales Price Jul $120,000 $127, % Aug $250,000 Aug $110,000 Sep $264,500 Sep $120,000 Average Sales Price Jul $234,247 $205, % Average Sales Price Jul $143,701 $174, % Aug $256,117 Aug $129,512 Sep $266,057 Sep $130,520 Total Active Jul % Total Active Jul % Aug 469 Aug 485 Sep 464 Sep 464 Average Days on Market Jul % Average Days on Market Jul % Aug 140 Aug 93 Sep 94 Sep 114 *Due to an MLS system change in October 2013 the data collection methods for pending sales changed. Pending sales are now calculated only once for a particular property, whether or not that property goes under contract multiple times during the month. Pending sales from 2013 have been adjusted in this report to adjust for the change. 13


14


15


16


17
April Paul Wilson 2015 GAAR President. Monthly Market Report. APRIL At a glance * Table of Contents
 Monthly Market Report April 2015 APRIL At a glance * Active Listings Pending sales Closed sales 3,953 1,180 844-9.79% from last year +20.90% from last year +17.06% from last year Table of Contents Market
January Paul Wilson 2015 GAAR President MONTHLY MARKET REPORT JANUARY AT A GLANCE * TABLE OF CONTENTS CONTACT
 MONTHLY MARKET REPORT January 2015 JANUARY AT A GLANCE * Active Listings Pending sales Closed sales 3,741 855 537-3.68% from last year +11.18 % from last year -0.37% from last year TABLE OF CONTENTS Market
February Paul Wilson 2015 GAAR President MONTHLY MARKET REPORT FEBRUARY AT A GLANCE * TABLE OF CONTENTS CONTACT
 MONTHLY MARKET REPORT February 2015 FEBRUARY AT A GLANCE * Active Listings Pending sales Closed sales 3,665 921 554-6.62% from last year +16.14% from last year +0.73% from last year TABLE OF CONTENTS Market
April Jon Schnoor 2016 GAAR President MONTHLY MARKET REPORT AT A GLANCE * TABLE OF CONTENTS CONTACT
 MONTHLY MARKET REPORT April 2016 AT A GLANCE * Active Listings Pending sales Closed sales 3,275 1,211 930-17.15% from last year +2.63% from last year +10.19% from last year TABLE OF CONTENTS Market Inventory...2
June Jon Schnoor 2016 GAAR President MONTHLY MARKET REPORT AT A GLANCE * TABLE OF CONTENTS CONTACT
 MONTHLY MARKET REPORT June 2016 AT A GLANCE * Active Listings Pending sales Closed sales 3,553 1,173 1,076-13.11% from last year -1.26% from last year +9.35% from last year TABLE OF CONTENTS Market Inventory...2
February Jon Schnoor 2016 GAAR President MONTHLY MARKET REPORT FEBRUARY AT A GLANCE * TABLE OF CONTENTS CONTACT
 MONTHLY MARKET REPORT February 2016 FEBRUARY AT A GLANCE * Active Listings Pending sales Closed sales 3,108 1,040 638-15.2% from last year 12.92% from last year 15.16% from last year TABLE OF CONTENTS
May Jon Schnoor 2016 GAAR President MONTHLY MARKET REPORT AT A GLANCE * TABLE OF CONTENTS CONTACT
 MONTHLY MARKET REPORT May 2016 AT A GLANCE * Active Listings Pending sales Closed sales 3,363 1,215 984-15.16% from last year -1.54% from last year +8.97% from last year TABLE OF CONTENTS Market Inventory...2
Oct Paul Wilson 2015 GAAR President MONTHLY MARKET REPORT OCTOBER AT A GLANCE * TABLE OF CONTENTS CONTACT
 MONTHLY MARKET REPORT Oct. 2015 OCTOBER AT A GLANCE * Active Listings Pending sales Closed sales 3,763 958 835-20.02% from last year +15.28% from last year +10.16% from last year TABLE OF CONTENTS Market
May 2008 MLS Month in Review
 May 28 MLS Month in Review The Albuquerque Market continues to improve, and it s evident that finally, the negative media is turning into positive media. This month s TOP Selling Price Range is $2K to
June 2008 MLS Month in Review
 June 28 MLS Month in Review The Greater Albuquerque Real Estate Market continues to be strong. REALTORS put 1,769 homes under contract in the month of June. For our Market Area, sales are up 9.5% for Detached
MLS of Greater Cincinnati - Charts for the Month: November 2017
 MLS of Greater Cincinnati - Charts for the Month: November 2017 The following charts provide an overview of what has occurred in the MLS over the past month. Each chart provides a historical trend. The
Monthly Indicators % % %
 Monthly Indicators 2016 Percent changes calculated using year-over-year comparisons. New Listings were down 27.6 percent for single family homes and 41.8 percent for townhouse-condo properties. Pending
SFR Condo Residential Lot Sales Inventory Sales Inventory Sales Inventory. Month YTD Month Month YTD Month Month YTD Month
 Grand Strand Market Report 2017 capped off a great year for the Grand Strand as full year SFR sales volume and median sales price were up 9.8% and 4.3%, respectively. Condo sales activity increased 3.0%
Monthly Indicators % + 9.7% %
 Monthly Indicators 2016 Percent changes calculated using year-over-year comparisons. New Listings were up 11.1 percent for single family homes and down 30.8 percent for townhouse-condo properties. Pending
Monthly Indicators % % - 9.2%
 Monthly Indicators 2016 New Listings were down 1.4 percent for single family/duplex homes and 25.0 percent for townhouse-condo properties. Pending Sales increased 58.3 percent for single family/duplex
4 th QTR Don Martindell 2017 GAAR President QUARTERLY MARKET REPORT CONTACT QUARTERLY HIGHLIGHTS. New Listings Closed Sales Average Sale Price
 QUARTERLY MARKET REPORT 4 th QTR New Listings Closed Sales Average Sale Price Detached 2,977 3,113 Detached 2,467 2,313 Detached $221,456 $212,648 Attached 321 311 Attached 251 240 Attached $149,346 $146,493-4.37%
Monthly Indicators + 4.8% - 3.5% %
 Monthly Indicators 2015 New Listings were up 45.0 percent for single family/duplex homes but decreased 44.1 percent for townhouse-condo properties. Pending Sales increased 14.3 percent for single family/duplex
Monthly Indicators % % - 3.5%
 Monthly Indicators 2017 New Listings were up 6.3 percent for the category but decreased 33.1 percent for the category. Pending Sales increased 5.0 percent for but decreased 1.3 percent for. The Median
California Housing Market Update. Monthly Sales and Price Statistics October 2018
 California Housing Market Update Monthly Sales and Price Statistics October 2018 Sales Had the 2 nd Largest Drop in the Last 6 Months California, October 2018 Sales: 397,060 Units, -3.7% YTD, -7.9% YTY
California Housing Market Update. Monthly Sales and Price Statistics November 2018
 California Housing Market Update Monthly Sales and Price Statistics November 2018 Home Sales: Largest Decline Since 2014 California, November 2018 Sales: 381,400 Units, -4.6% YTD, -13.4% YTY 700,000 600,000
California Housing Market Update. Monthly Sales and Price Statistics September 2018
 California Housing Market Update Monthly Sales and Price Statistics September 2018 Sales Had the Largest Decline since March 2014 California, September 2018 Sales: 382,550 Units, -3.3% YTD, -12.4% YTY
Monthly Indicators + 7.3% + 6.6% + 8.3% Single-Family Market Overview Condo Market Overview New Listings Pending Sales.
 Monthly Indicators 2018 The three most prominent national market trends for residential real estate are the ongoing lack of abundant inventory, the steadily upward movement of home prices and year-over-year
California Housing Market Update. Monthly Sales and Price Statistics August 2018
 California Housing Market Update Monthly Sales and Price Statistics August 2018 Sales Declined for the 4 th Consecutive Month California, August 2018 Sales: 399,600 Units, -2.1% YTD, -6.6% YTY 700,000
California Housing Market Update. Monthly Sales and Price Statistics December 2018
 California Housing Market Update Monthly Sales and Price Statistics December 2018 Sales Reached the Lowest Level since Jan 2015 California, December 2018 Sales: 372,260 Units, -5.2% YTD, -11.6% YTY 700,000
California Housing Market Update. Monthly Sales and Price Statistics May 2018
 California Housing Market Update Monthly Sales and Price Statistics May 2018 Sales Lost Momentum as Mortgage Rates Continued to Climb California, May 2018 Sales: 409,270 Units, +0.3% YTD, -4.6% YTY 700,000
Monthly Indicators % % %
 Monthly Indicators 2018 Percent changes calculated using year-over-year comparisons. New Listings were down 12.9 percent for single family homes and 21.3 percent for townhouse-condo properties. Pending
FALLON CHURCHILL COUNTY, NEVADA RESIDENTIAL REAL ESTATE TRACKING REPORT
 FALLON CHURCHILL COUNTY, NEVADA RESIDENTIAL REAL ESTATE TRACKING REPORT 3rd QUARTER 15 BOB GETTO, C.R.S. & S.F.R. Nevada real estate broker, Lic # 16039 Council of Residential Specialists certified, National
FALLON CHURCHILL COUNTY, NEVADA RESIDENTIAL REAL ESTATE TRACKING REPORT
 FALLON CHURCHILL COUNTY, NEVADA RESIDENTIAL REAL ESTATE TRACKING REPORT 1st QUARTER 2016 BOB GETTO, C.R.S. & S.F.R. Nevada real estate broker, Lic # 16039 Council of Residential Specialists certified,
July 2012 was $162,256. ($153,956). was $314,607. was $172,488. ($164,426). Kansas City Region Average Sales Price - Existing Homes
. was $314,607. was $172,488. ($164,426). Kansas City Region Average Sales Price - Existing Homes") July 212 Kansas City Regional Real Estate Market Report Average Sales Price The average exis ng home sale price in July 212 was $162,256. 25 Kansas City Region Average Sales Price - Existing Homes July
July 212 Kansas City Regional Real Estate Market Report Average Sales Price The average exis ng home sale price in July 212 was $162,256. 25 Kansas City Region Average Sales Price - Existing Homes July
Jackson County Residental Market Trends. February Pending Sales New Listings
 Jackson County Residental Market Trends February 2017 Pending Sales..2 New Listings..3 Overall activity trends are not a measure of pricing or value for individual properties. Small Sampling sizes can
Josephine County Residental Market Trends. January Pending Sales New Listings
 Josephine County Residental Market Trends January 217 Pending Sales..2 New Listings..3 Overall activity trends are not a measure of pricing or value for individual properties. Small Sampling sizes can
A free research tool from the Minneapolis Area Association of REALTORS brought to you by the unique data-sharing traditions of the REALTOR community
 A free research tool from the Minneapolis Area Association of REALTORS brought to you by the unique data-sharing traditions of the REALTOR community Buyer activity took another step up in as the final
Jackson County Residental Market Trends. November Pending Sales New Listings
 Jackson County Residental Market Trends November 2017 Pending Sales..2 New Listings..3 Overall activity trends are not a measure of pricing or value for individual properties. Small Sampling sizes can
Greater Las Vegas Snapshot by Sale Type
 9.% Closed Sales Trend by Type December Closings by Type 8.% 7.% 6.% 8% Short Sales 1% 5.% 4.% 3.% Traditional Equity 82% 2.% 1.%.% Greater Las Vegas Snapshot by Sale Type - SFR Only Available List Price
2017 IN REVIEW THE BLUE MTS. REAL ESTATE MARKET REPORT LOCATIONS ROYAL LEPAGE S 2016 BROKERAGE OF THE YEAR FOR ONTARIO.
 THE BLUE MTS. REAL ESTATE MARKET REPORT IN REVIEW WE RE PROUD AND GRATEFUL TO HAVE BEEN CHOSEN AS ROYAL LEPAGE S BROKERAGE OF THE YEAR FOR ONTARIO OVERVIEW RECORD VOLUME SALES, HIGHER PRICES, SHORTER SALE
Multiple Listing Service of Southern Arizona Monthly Statistics September 2018
 For Immediate Release: October, CONTACT: Judith Grammond MLSSAZ President (5) 7 Sean Murphy Executive Vice President (5) 7 Randy Rogers CEO, MLSSAZ (5) 374 Multiple Listing Service of Southern Arizona
Ada County Existing/Resale
 Ada County Existing/Resale June 2018 ket Statistics Report provided by Boise Regional REALTORS Data from the Intermountain MLS as of y 11, 2018 Key Metrics Jun 2017 Jun 2018 % Chg YTD 2017 YTD 2018 % Chg
Information sheet A Data
 House prices: Statistics activity House prices change over time, but do so at different rates in different places. In this activity you will use statistical diagrams and measures to compare house prices
Monthly Market Watch for the Prescott Quad City Area. Provided by Keller Williams Check Realty Statistics from August 2012 Prescott MLS
 August 2012 Monthly Market Watch for the Prescott Quad City Area Provided by Keller Williams Check Realty Statistics from August 2012 Prescott MLS Report Overview: This report includes MLS data for the
Delaware County Pennsylvania Luxury Housing Market Update
 Delaware County Pennsylvania Luxury Housing Market Update March 218 Delaware County, Pennsylvania - March 218 The real estate market is always changing, and if you re buying or selling a home especially
O O ct ct ober 2017
 October Status Quo for Calgary's Housing Market Prices remain similar to last year, but ease in October., November 1, 17 October s housing market conditions closely echoed previous month s trends with
MARKET AREA UPDATE Year: 2018 Report as of: 1Q 2Q 3Q 4Q
 Market Area (City, State): Portland Metropolitan Area MARKET AREA UPDATE Year: 2018 Report as of: 1Q 2Q 3Q 4Q Provided by (Company / Companies): BHHSNW Real Estate, Archibald Relocation, Coldwell Banker
MONTHLY STATISTICS PACKAGE. City of Calgary. May creb.com
 MONTHLY STATISTICS PACKAGE City of Calgary May 1 creb.com Housing supply swells in cool spring market MONTHLY STATISTICS PACKAGE City of Calgary May 1 City of Calgary, June 1, 1 Calgary s housing inventory
MONTHS OF SUPPLY AND PRICE CHANGES. Home improvement November marks a rise in sales. MONTHLY STATISTICS PACKAGE City of Calgary. Nov.
 November 17 17 Home improvement November marks a rise in sales. City of Calgary, December 1, 17 The November housing market was spurred by a rise in sales, particularly in the lower price ranges. Sales
The Market Watch Monthly Housing Report. Coachella Valley Median Detached Home Price Dec Dec 2016
 The Market Watch Monthly Housing Report Median Price $450,000 Coachella Valley Median Detached Home Price Dec 2002 - Dec 2016 $400,000 $350,000 $300,000 $339,930 $340,000 $250,000 $200,000 $150,000 CV
Puerto Rico Housing Finance Authority Housing Stimulus Programs
 Puerto Rico Housing Finance Authority Housing Stimulus Programs March 31, 2012 (Final with US Data) Total sales assisted by PRHFA stimulus from $240MM Fund Assignment As of March 31, 2012 Silent Second
South Bay Market Intelligence Report Vol. 4 October 2018
 South Bay Market Intelligence Report Vol. 4 October Designed to give you the facts & trends overview of the most relevant market activities as they unfold in the South Bay real estate community This Sales
New year kicks off with slow sales Jan. 2019
 January 19 19 MONTHLY STATISTICS PACKAGE New year kicks off with slow sales 19, February 1, 19 As economic challenges linger into 19, housing markets remain on a sluggish pace. January sales totalled 8
Oversupply persists despite improved sales activity for affordable product Mar. 2019
 March 19 MONTHLY STATISTICS PACKAGE Oversupply persists despite improved sales activity for affordable product 19, April 1, 19 March saw a modest decline in city wide sales activity compared to last year.
Ada County Existing/Resale
 Ada County Existing/Resale Report provided by Boise Regional REALTORS Key Metrics 2018 2019 % Chg YTD 2018 YTD 2019 % Chg Closed Sales 602 498-17.3% 1,465 1,281-12.6% Median Sales Price $290,000 $309,900
 Palos Verdes Peninsula Market Intelligence Report Vol. 4 October Designed to give you the facts & trends overview of the most relevant market activities as they unfold in the South Bay real estate community
Residential Market Update
 Residential Market Update 2016 Quarter 4 Information Proudly Provided by your Business Development Managers: Nancy Pierson Biltmore / nancyp@eta-az.com / 602-769-1438 Maggie Clark Scottsdale / maggiec@eta-az.com
Santa Clara County Real Estate Market Overview Dynamics
 Santa Clara County Real Estate Market Overview Dynamics Data from sources deemed reliable, but may contain errors and subject to revision. All numbers should be considered approximate. Jan-90 Sep-90 May-91
Provided by Keller Williams Realty Professional Partners Statistics from September 2010 MLS
 Monthly Market Watch for Maricopa County An overview of what is happening in the Maricopa County real estate market (using September 2010 statistics) Report overview: This report includes MLS data for
Aug. Aug 2018 ust 2018
 August 18 MONTHLY STATISTICS PACKAGE City of Calgary Unemployment rate slows housing market recovery 18 City of Calgary, September, 18 Easing sales, gains in new listings and elevated inventory levels
Demand down with net migration
 July 1 Demand down with net migration City of Calgary, August, 1 In step with City census data on declining net migration levels, housing sales activity totaled 1,71 units in July, a 1. per cent decrease
Outlook for Median Home Selling Prices. United States data are useless for us.
 Outlook for Median Home Selling Prices Outline United States Data Unobserved Prices The Future of California s Median Home Price Bill Watkins August 28, 28 2.% Existing Single-family Housing Sales percent
S Sep eptember 2016
 September Detached prices stabilize in soft market, October, The segment of Calgary s housing market with the greatest influence on the overall market is showing signs of pricing stability. The detached
FOR IMMEDIATE RELEASE Contact: David B. Bennett President & CEO Phone:
 FOR IMMEDIATE RELEASE Contact: David B. Bennett President & CEO Phone: 727-216-32 Email: dbennett@tampabayrealtor.com Real Estate Statistics for September 216 At this time of year everyone starts to get
The Greater Reno-Tahoe Real Estate Report
 February, 2018February, 2018 February, 2018 Issue The Greater Reno-Tahoe Real Estate Report Housing Market Trends for: Reno, Sparks, Carson City, Carson Valley, Lake Tahoe, Dayton, and Fernley A FREE monthly
Patience required in Calgary's housing market recovery Jul. 2018
 July 18 MONTHLY STATISTICS PACKAGE City of Calgary Patience required in Calgary's housing market recovery 18 City of Calgary, August 1, 18 Recent struggles in the job market, accompanied by yet another
Tri-Cities Insider September 2015
 Tri-Cities Insider Your Current Real Estate Market 1 Go to: http://grouponetricities.com click on this logo to view market info each month. 2 3 Yearly Comparisons- Real Trends July/June 2015 Housing Market
MONTHLY MARKET INSIGHT REPORT
 MONTHLY MARKET INSIGHT REPORT Detached Single-Family Homes JULY 218 The 1,651 homes sold in July 218 was the fifth highest sales total for the month and was a 5.7 percent increase from the July 217 sales
AAug ugust 2017
 August 17 17 Housing recovery a balancing act Growth in new listings outpaced sales preventing inventory declines City of Calgary, September 1, 17 Sales posted a modest gain in August, but a rise in new
Monthly Indicators. October 2010
 37-2 Monthly Indicators 31-3 31-5 31-1 41-2 31-2 31-3 41-1 21-1 31-4 37-4 37-6 41-4 20 26-1 21-2 26-2 26-3 26-4 2010 26-7 26-5 26-6 9-1 9-2 9-4 22-1 22-2 22 (3-7) 55-2 16 17 10 11 25 55-1 60 59 23 18 12
Housing market feels the chill as oversupply continues Feb. 2019
 February 19 19 MONTHLY STATISTICS PACKAGE Housing market feels the chill as oversupply continues 19, March 1, 19 The effects of Calgary s economic climate continue to create weak sales activity and elevated
Dec December 2018
 December MONTHLY STATISTICS PACKAGE Job market weakness and lending restrictions a common thread in s housing market, January, 19 As oversupply continues in Calgary s housing market, December prices eased
MONTHLY MARKET INSIGHT REPORT
 Detached Single-Family Homes JANUARY 219 The 77 homes sold in January 219 was the tenth highest sales volume for the month and was a 11 percent decrease from the 794 homes sold in January 218. The median
Victoria Real Estate Market Statistics for August Sept 1, 2017
 Victoria Real Estate Market Statistics for August 27 Sept, 27 A total of 736 properties sold in the Victoria Real Estate Board region this August, 6.6 per cent fewer than the 883 properties sold in August
MONTHLY MARKET INSIGHT REPORT
 Detached Single-Family Homes DECEMBER 217 The 1,27 homes sold in December 217 was the seventh highest sales total for the month and was a 9.7 percent decrease in sales volume from the 1,137 homes sold
MONTHLY MARKET INSIGHT REPORT
 MONTHLY MARKET INSIGHT REPORT AUGUST 218 Detached Single-Family Homes The 1,679 homes sold in August 218 was the fourth highest sales total for the month and was a 3.3 percent increase in sales volume
MONTHLY MARKET INSIGHTS REPORT
 MONTHLY MARKET INSIGHTS REPORT Detached Single-Family Homes JUNE 218 The 1,822 homes sold in June 218was the fifth highest sales total for the month and was a 6.2 percent decrease from the record June
A A p p r ril 2017
 April 17 17 Housing market retains momentum in April Citywide prices hold steady as labour market improves City of Calgary, May 1, 17 Calgary s housing market continued to show signs of stability in April.
October 1, Victoria Real Estate Market Continues to Stabilize
 PRESIDENT Kyle Kerr PRESIDENT ELECT Cheryl Woolley SECRETARY TREASURER David Langlois PAST PRESIDENT Ara Balabanian DIRECTORS Jackie Adkins Sandi-Jo Ayers Bill Ethier Karen Dinnie-Smyth Andrew Plank EXECUTIVE
MONTHLY MARKET INSIGHTS REPORT
 MONTHLY MARKET INSIGHTS REPORT Detached Single-Family Homes OCTOBER 217 The 1,11 homes sold in October 217 was the fourth highest sales total for the month and was a 14.3 percent increase in sales volume
Monthly Market Watch for Maricopa County An overview of what is happening in the Maricopa County real estate market
 Monthly Market Watch for Maricopa County An overview of what is happening in the Maricopa County real estate market Provided by Susan Kraemer of Prudential Arizona Properties Report overview: This report
MONTHLY MARKET INSIGHT REPORT
 Detached Single-Family Homes FEBRUARY 218 The 481 homes sold in February 218 was the twelfth highest sales volume for the month and was a 5.5 percent decrease from the 59 homes sold in February 217. This
MONTHLY MARKET INSIGHTS REPORT
 MONTHLY MARKET INSIGHTS REPORT Detached Single-Family Homes SEPTEMBER 217 The 1,1 homes sold in September 217 was the seventh highest sales total for the month, and was a 5. percent decrease in sales volume
Weak sales persist in Calgary and beyond Jun. 2018
 June 218 MONTHLY STATISTICS PACKAGE City of Calgary Weak sales persist in Calgary and beyond 218 City of Calgary, July 3, 218 Many Canadian energyrelated municipalities within Alberta and Saskatchewan
Sep September 2018
 18 September 18 MONTHLY STATISTICS PACKAGE City of Calgary Persistent buyers market continues 18 City of Calgary, October 1, 18 With no change in the economic climate, Calgary s sales activity totaled
Scott Market Report Stronger Sales Continue
 June 20 Scott Market Report Stronger Sales Continue The Outer Banks real estate market is seeing good signs in most market segments. After a somewhat slow start to 20, sales agreements picked up significantly
September 2018 MLS Statistical Report
 September 218 MLS Statistical Report Total Sales Blame it on Hurricane Florence but overall, sales dropped drastically in August - down 17%. Total Sales Sept'18 172-17% Sept'17 26-2% Sept'16 211 7% 3 2
FOR IMMEDIATE RELEASE Contact: David B. Bennett President & CEO Phone:
 FOR IMMEDIATE RELEASE Contact: David B. Bennett President & CEO Phone: 727-216-32 Email: dbennett@tampabayrealtor.com Real Estate Statistics for December 217 wrapped up a sizzling 217 with a steady month
Bureau of Business Research Webinar Series October 2016
 Bureau of Business Research Webinar Series October 2016 Presented by Eric Thompson W.W. Marshall Associate Professor of Economics Director, Bureau of Business Research Outline Importance of Affordable
Changing Economic Times. Market Pulse. Dr. Gary Jackson Director, Regional Economic Research Institute Florida Gulf Coast University April 8, 2008
 Changing Economic Times Presented to: Market Pulse Bonita Springs Area Chamber of Commerce Bonita Springs-Estero Association of REALTORS, Inc. Dr. Gary Jackson Director, Regional Economic Research Institute
CALGARY REGIONAL HOUSING MARKET STATISTICS 12.14
 CALGARY REGIONAL HOUSING MARKET STATISTICS 12.14 Yearly records set as monthly sales see slight decline Condominium and townhouse sales set a new record for 214 Calgary, January 2, 215 It was a record
2019 Housing Market Forecast. Palos Verdes Peninsula AOR January 8, 2019 Jordan G. Levine Senior Economist
 2019 Housing Market Forecast Palos Verdes Peninsula AOR January 8, 2019 Jordan G. Levine Senior Economist Overview Good News: Economic fundamentals solid Homeownership still the dream Rates might not go
VANCOUVER, BC December 2, 2016 Home buyer and seller activity remains near historical averages in the Metro Vancouver* housing market.
 News Release FOR IMMEDIATE RELEASE: Home sales and listings just below 10-year average VANCOUVER, BC December 2, Home buyer and seller activity remains near historical averages in the Metro Vancouver*
Coachella Valley Median Detached Home Price April April 2017
 The Desert Housing Report Median Price $450,000 $400,000 Coachella Valley Median Detached Home Price April 2002 - $349,000 $389,000 $350,000 $300,000 $250,000 $200,000 $150,000 CV Detached Median Price
FOR IMMEDIATE RELEASE Contact: David B. Bennett President & CEO Phone:
 FOR IMMEDIATE RELEASE Contact: David B. Bennett President & CEO Phone: 727-216-32 Email: dbennett@tampabayrealtor.com Real Estate Statistics for September 217 September s numbers are out, and it comes
August 1, Victoria Housing Market Still Finding Its Balance
 August, 28 PRESIDENT Kyle Kerr PRESIDENT ELECT Cheryl Woolley SECRETARY TREASURER David Langlois PAST PRESIDENT Ara Balabanian DIRECTORS Jackie Adkins Sandi-Jo Ayers Bill Ethier Karen Dinnie-Smyth Andrew
Puerto Rico Housing Finance Authority Housing Stimulus Programs
 Puerto Rico Housing Finance Authority Housing Stimulus Programs June 30, 2011 (Preliminary June US data not yet available) Total sales assisted by PRHFA stimulus from $180MM Fund Assignment As of June
February 2016 Austin Real Estate Market Report
 February 2016 Austin Real Estate Market Report A comprehensive report on the Austin and Central Texas real estate market. Volume 11, Issue II Year to Date Sales February 2016 3 1 Year-to-date sales in
657 S Belvoir South Euclid, OH Mark Khuri
 657 S Belvoir South Euclid, OH 44121 Overview Property Type: Multi-Family Size: 6,612 sq ft Sale Price: $499,000 # of Units: 8 Year Built: 1972 # of Stories: 2 Construction: Brick Parking Type: Covered
A Panel Discussion of Developments, Trends and Issues Affecting Commercial Property Iowa Commercial Real Estate Expo
 A Panel Discussion of Developments, Trends and Issues Affecting Commercial Property By Bryon Tack, MAI, CAE Polk County Deputy Assessor January 1 : Assessment of property (appraisal date) Historical data
Year to Date Summary. Average and Median Sale Prices
 A Publication of RMLS, The Source for Real Estate Statistics in Your Community Residential Review: Metro Portland, Oregon September 2018 Reporting Period September Residential Highlights Cooler numbers
THE OUTLOOK FOR HOUSING IN ILLINOIS
 THE OUTLOOK FOR HOUSING IN ILLINOIS Jonathan Smoke Chief Economist January 25, 2017 NATIONAL TRENDS 2 2000.01 2000.05 2000.09 2001.01 2001.05 2001.09 2002.01 2002.05 2002.09 2003.01 2003.05 2003.09 2004.01
Victoria Real Estate Market Continues to Sizzle in Summer Months. August , Victoria, BC
 Victoria Real Estate Market Continues to Sizzle in Summer Months August 16, Victoria, BC A total of 97 properties sold in the Victoria Real Estate Board region this July, an increase of per cent compared
Coachella Valley Median Detached Home Price Jan Jan 2017
 The Desert Housing Report Median Price $450,000 Coachella Valley Median Detached Home Price Jan 2002 - Jan 2017 $400,000 $350,000 $300,000 $250,000 $335,000 $340,000 $200,000 $150,000 CV Detached Median
October 2017 Austin Real Estate Market Report
 October 2017 Austin Real Estate Market Report A comprehensive report on the Austin and Central Texas real estate market. Volume 12, Issue X Year to Date Sales October 2017 3 1 Year to data sales in Austin