Changing Economic Times. Market Pulse. Dr. Gary Jackson Director, Regional Economic Research Institute Florida Gulf Coast University April 8, 2008
|
|
|
- Emerald James
- 5 years ago
- Views:
Transcription

1 Changing Economic Times Presented to: Market Pulse Bonita Springs Area Chamber of Commerce Bonita Springs-Estero Association of REALTORS, Inc. Dr. Gary Jackson Director, Regional Economic Research Institute Florida Gulf Coast University April 8, 2008
2 Outline for Presentation National Economic Trends FED Economic Forecasts for 2008 through 2010 Local Economic Trends
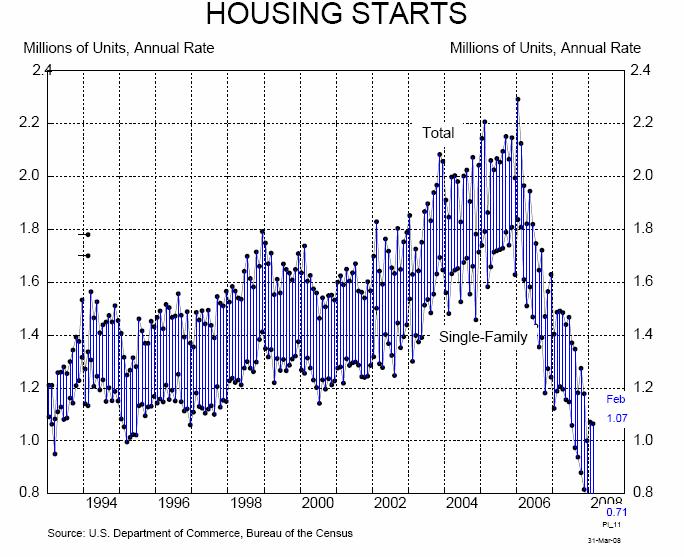
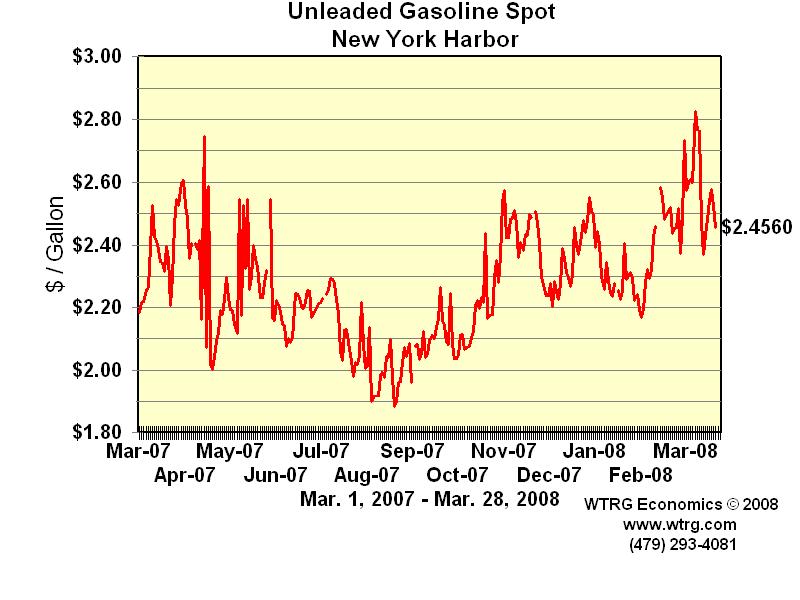
3 National Economic Trends Real GDP (Output measure) Employment Unemployment Initial Unemployment Claims Consumer Prices Consumer Confidence Retail Sales S & P 500 Stock Index Industrial Production Light-Weight Vehicle Sales Housing Starts Mortgage Rates Crude Oil Prices Gasoline Prices

4 01 Recession 91 Recession 4 th Qtr 0.6 4

5 Jan -17,000 Feb -63, Recession 01 Recession
6 Source: BLS 7.5 U.S. UNEMPLOYMENT RATE 01 Recession Recession Av. 06 Jan 07 Feb 07 Mar 07 Apr 07 May 07 Jun 07 Jul 07 Aug 07 Sep 07 Oct 07 Nov 07 Dec 07 Jan 07 Feb 07 Av. 90 Av. 91 Av. 92 Av. 93 Av. 94 Av. 95 Av. 96 Av. 97 Av. 98 Av. 99 Av. 00 Av. 01 Av. 02 Av. 03 Av. 04 Av. 05
7 400,000 U.S. Weekly Unemployment Claims Initial Claims, SA 380, , , , , ,000 2/24/ 3/31/ 5/5/ 6/9/ 7/14/ 8/18/ 9/22/ 10/27/ 12/1/ 1/5/2008 2/9/2008 Source: US Department of Labor
8 3/4/2008 Florida Weekly Unemployment Claims Initial Claims, SA 21,000 19,000 17,000 15,000 13,000 9,000 11,000 7,000 5,000 3/10/ 4/9/ 5/9/ 6/8/ 7/8/ 8/7/ 9/6/ 10/6/ 11/5/ 12/5/ 1/4/2008 2/3/2008 Source: US Department of Labor
9 Feb 4.1%
10 Consumer Confidence Index Source:Conference Board, Mar 08 Jan 06 Feb 06 Mar 06 Apr 06 May 06 Jun 06 Jul 06 Aug 06 Sept 06 Oct 06 Nov 06 Dec 06 Jan 07 Feb 07 Mar 07 Apr 07 May 07 Jun 07 Jul 07 Index 1985=100 Aug 07 Sep 07 Oct 07 Nov 07 Dec 07 Jan 08 Feb 08
11 Jan Feb - 0.6
12 Feb 1,354.9

13 Feb Recession 01 Recession
14 Feb 15.38
15
16 Interest Rate Conventional 30 Year Fixed Rate Mortgage Rates Jan 00 Jan 01 Jan Jan Jan Jan Jan Month and Year 5.85% for Mar 27th weekly survey Jan 07 Jan 08 Source: Freddie Mac

17
18
19 Federal Reserve System Economic Forecast Real GDP Unemployment Rate Consumer Prices Total Inflation Core Inflation
20 Growth of Real GDP Percent % 3.2% 3.2% 3.2% 2.9% % 2.5% % % % 1.8% 1.3% 1.0% Year Source:FED,
21 Unemployment Rate Percent Year Source:FED,
22 PCE Inflation Percent Year 1.5 Source:FED,
23 Core PCE Inflation Percent Year Source:FED,
24 Important Factors For the Economy Oil Shock/Middle East War? Weather (Hurricane?) Inflationary Expectations Productivity Wealth Effects (Housing/Stock Market) Global Economy (Increased demand for oil, raw materials, and increased trade)

25 Southwest Florida Trends Population Employment Unemployment Airport Passengers Taxable Sales Single Family Permits Median Housing Price and Existing Sales
26 Florida EDR: February 2008.
27 1200 Long-Run Population Growth Projections July, Lee and Collier- Thousands , actual Collier Lee Source: Florida EDR: Demographic Estimating conference Database, Updated July.
28 290, , , , , , , , ,000 Source: BLS LEE COUNTY EMPLOYMENT 285, , , , , , , , , ,271 (P) Jun 07 Jul 07 Aug 07 Sept 07 Oct 07 Nov 07 Dec 07 Jan 08 Jan 06 Feb 06 Mar 06 Apr 06 May 06 Jun 06 Jul 06 Aug 06 Sept 06 Oct 06 Nov 06 Dec 06 Jan 07 Feb 07 Mar 07 Apr 07 May 07
29 156, , , , , , , , ,000 Source: BLS COLLIER COUNTY EMPLOYMENT 155, , , , , , , , , ,839 (P) Sept 06 Oct 06 Nov 06 Dec 06 Jan 07 Feb 07 Mar 07 Apr 07 May 07 Jun 07 Jul 07 Aug 07 Sept 07 Oct 07 Nov 07 Dec 07 Jan 08 Jan 06 Feb 06 Mar 06 Apr 06 May 06 Jun 06 Jul 06 Aug 06
30 Unemployment Rates SWFL Coastal County Unemployment Rates (%) Monthly Averages; Most Recent 12 Months Data Charlotte Collier Lee 6.5% 6.1% 4.8% Mar 07 Apr 07 May 07 Jun 07 Jul 07 Aug 07 Sep 07 Oct 07 Nov 07 Dec 07 Jan 08. Feb 08 Source: Florida AWI
31 Airport Passenger Travel Trends 1200 RSW (SW Florida International) Airport Passenger Traffic Trend Thousands Arrivals plus Departures Jan Feb Mar Apr May Jun Jul Aug Sep Oct Nov Dec Source: Local Airport Authorities
32 Monthly Taxable Sales 2000 to Monthly Averages; Average of Most Recent 12 Months 1,200 Charlotte / Collier / Lee - Million 1, Collier Lee Avg Dec06 to Nov07 Monthly Averages for Each Year to 2006 Source: Florida Department of Tax Research
33 Source: Florida Department of Tax Research Taxable Sales by Month Dec-06 Jan-07 Feb-07 Charlotte / Collier / Lee - Million Mar-07 Apr-07 May-07 Jun-07 Jul-07 Aug-07 Sep-07 Oct-07 Nov-07 Collier Lee
34 1600 Single Family Permits Issued Lee County Single Family Permits Issued - Lee County Monthly Averages for Each Year; Most Recent 12 Months Data Permits Issued Av 2002 Av 2004 Av 2006 Av Apr Jun Aug Oct Dec Feb 2008 Source: Local Building and Zoning Departments, included Fort Myers, Cape Coral, and unincorporated Lee County permits
35 Single Family Permits Issued Collier County Single Family Permits Issued - Collier County Monthly Averages; Most Recent 12 Months Data Permits Issued Av 2002 Av 2004 Av 2006 Av Apr Jun Aug Oct Dec Feb 2008 Source: Local Building and Zoning Departments; includes unincorporated Collier County permits only.
36 Lee County Existing Single Family Sales by REALTORS Bar Chart, Scale on the Left Median Housing Price Line Chart, Scale on the Right Lee County Existing Single Family Home Sales by Realtors 1200 $ $300 $250 $200 $150 $100 $50 0 $0 Feb 2006 Mar 2006 Apr 2006 May 2006 Jun 2006 Jul 2006 Aug 2006 Sep 2006 Oct 2006 Nov 2006 Dec 2006 Jan Feb Mar Apr May Jun Jul Aug Sep Oct Nov Dec Jan 2008 Homes Sold by Realtors Median Sale Price - Thousands Lee Homes Sold by Realtors Lee Median Sale Price Source: Florida Association of REALTORS, August 05 price estimated,
37 Collier County Existing Single Family Sales by REALTORS Bar Chart, Scale on the Left Median Housing Price Line Chart, Scale on the Right Collier County Existing Single Family Home Sales by Realtors 250 $700 Homes Sold by Realtors Collier Homes Sold by Realtors Collier Median Sale Price $600 $500 $400 $300 $200 $100 Median Sale Price - Thousands 0 Jan Feb Mar Apr May Jun Jul Aug Sep Oct Nov Dec Jan 2008 $0 Source: Naples Area Board of Realtors (NABOR),
38 Summary Negative growth or very slow growth the first half to 2008; Continued growth but at a slower pace during the second half of 2008 and 2009 with more normal growth in 2010; Unemployment rates at higher levels during the first half of 2008; Risk of shocks to the economy; Inflation is above the rate desired and is a a concern; Housing recover is not expected until 2009.
THE OUTLOOK FOR HOUSING IN ILLINOIS
 THE OUTLOOK FOR HOUSING IN ILLINOIS Jonathan Smoke Chief Economist January 25, 2017 NATIONAL TRENDS 2 2000.01 2000.05 2000.09 2001.01 2001.05 2001.09 2002.01 2002.05 2002.09 2003.01 2003.05 2003.09 2004.01
Monthly Indicators + 7.3% + 6.6% + 8.3% Single-Family Market Overview Condo Market Overview New Listings Pending Sales.
 Monthly Indicators 2018 The three most prominent national market trends for residential real estate are the ongoing lack of abundant inventory, the steadily upward movement of home prices and year-over-year
MARKET OUTLOOK FOR SAN MATEO
 MARKET OUTLOOK FOR SAN MATEO Jonathan Smoke Chief Economist August 2, 2016 NATIONAL TRENDS 2 JOB CREATION REBOUNDED IN JUNE 229,000 jobs created by month in 2015; 172,000 average this year Employment and
Housing Market Cycles
 MEGA AGENT Market Update Gary Keller and Jay Papasan 2 The U.S. Housing Market Keller Williams Realty, Inc. Housing Market Cycles 4 The U.S. Housing Market Housing Market Cycles 5 The U.S. Housing Market
Monthly Indicators % % - 3.5%
 Monthly Indicators 2017 New Listings were up 6.3 percent for the category but decreased 33.1 percent for the category. Pending Sales increased 5.0 percent for but decreased 1.3 percent for. The Median
SWFL Regional Economic Indicators Affecting Growth and Development
 SWFL Regional Economic Indicators Affecting Growth and Development Prepared for: The Collier Building Industry Association Chris Westley Regional Economic Research Institute Florida Gulf Coast University
MLS of Greater Cincinnati - Charts for the Month: November 2017
 MLS of Greater Cincinnati - Charts for the Month: November 2017 The following charts provide an overview of what has occurred in the MLS over the past month. Each chart provides a historical trend. The
Outlook for Median Home Selling Prices. United States data are useless for us.
 Outlook for Median Home Selling Prices Outline United States Data Unobserved Prices The Future of California s Median Home Price Bill Watkins August 28, 28 2.% Existing Single-family Housing Sales percent
Monthly Indicators % % %
 Monthly Indicators 2016 Percent changes calculated using year-over-year comparisons. New Listings were down 27.6 percent for single family homes and 41.8 percent for townhouse-condo properties. Pending
Monthly Indicators + 4.8% - 3.5% %
 Monthly Indicators 2015 New Listings were up 45.0 percent for single family/duplex homes but decreased 44.1 percent for townhouse-condo properties. Pending Sales increased 14.3 percent for single family/duplex
2019 Housing Market Forecast. Palos Verdes Peninsula AOR January 8, 2019 Jordan G. Levine Senior Economist
 2019 Housing Market Forecast Palos Verdes Peninsula AOR January 8, 2019 Jordan G. Levine Senior Economist Overview Good News: Economic fundamentals solid Homeownership still the dream Rates might not go
Jackson County Residental Market Trends. February Pending Sales New Listings
 Jackson County Residental Market Trends February 2017 Pending Sales..2 New Listings..3 Overall activity trends are not a measure of pricing or value for individual properties. Small Sampling sizes can
Housing Price Forecasts. Illinois and Chicago PMSA, December 2015
 Housing Price Forecasts Illinois and Chicago PMSA, December 2015 Presented To Illinois Association of Realtors From R E A L Regional Economics Applications Laboratory, Institute of Government and Public
Greater Las Vegas Snapshot by Sale Type
 9.% Closed Sales Trend by Type December Closings by Type 8.% 7.% 6.% 8% Short Sales 1% 5.% 4.% 3.% Traditional Equity 82% 2.% 1.%.% Greater Las Vegas Snapshot by Sale Type - SFR Only Available List Price
Jackson County Residental Market Trends. November Pending Sales New Listings
 Jackson County Residental Market Trends November 2017 Pending Sales..2 New Listings..3 Overall activity trends are not a measure of pricing or value for individual properties. Small Sampling sizes can
California Housing Market Update. Monthly Sales and Price Statistics May 2018
 California Housing Market Update Monthly Sales and Price Statistics May 2018 Sales Lost Momentum as Mortgage Rates Continued to Climb California, May 2018 Sales: 409,270 Units, +0.3% YTD, -4.6% YTY 700,000
UDIA WA PROPERTY MARKET STATISTICS
 UDIA WA PROPERTY MARKET STATISTICS OCTOBER 217 1 IN THIS ISSUE KEY TRENDS INDUSTRY UPDATE 3 4 ECONOMY RESIDENTIAL LAND DEVELOPMENT RESIDENTIAL PROPERTY SETTLEMENTS RESIDENTIAL PROPERTY MARKET RESIDENTIAL
Economic and Housing Market Outlook ( ) October 31, Contra Costa AOR
 October 31, Contra Costa AOR") Economic and Housing Market Outlook (2012 2013) Contra Costa AOR October 31, 2012 Oscar Wei Senior Research Analyst California Association of REALTORS Overview US and California Economies California Housing
Economic and Housing Market Outlook (2012 2013) Contra Costa AOR October 31, 2012 Oscar Wei Senior Research Analyst California Association of REALTORS Overview US and California Economies California Housing
California Housing Market Update. Monthly Sales and Price Statistics December 2018
 California Housing Market Update Monthly Sales and Price Statistics December 2018 Sales Reached the Lowest Level since Jan 2015 California, December 2018 Sales: 372,260 Units, -5.2% YTD, -11.6% YTY 700,000
Tri-Cities Insider September 2015
 Tri-Cities Insider Your Current Real Estate Market 1 Go to: http://grouponetricities.com click on this logo to view market info each month. 2 3 Yearly Comparisons- Real Trends July/June 2015 Housing Market
ECONOMIC CURRENTS. Vol. 3, Issue 1. THE SOUTH FLORIDA ECONOMIC QUARTERLY Introduction
 ECONOMIC CURRENTS THE SOUTH FLORIDA ECONOMIC QUARTERLY Introduction Economic Currents provides an overview of the South Florida regional economy. The report contains current employment, economic and real
2017 RESIDENTIAL REAL ESTATE MARKET REPORT
 2017 RESIDENTIAL REAL ESTATE MARKET REPORT Published January 26, 2018 Our market reports have been focused on the effects of low inventory on our housing market and for good reason. December 2017 marked
Bureau of Business Research Webinar Series October 2016
 Bureau of Business Research Webinar Series October 2016 Presented by Eric Thompson W.W. Marshall Associate Professor of Economics Director, Bureau of Business Research Outline Importance of Affordable
Monthly Indicators % + 9.7% %
 Monthly Indicators 2016 Percent changes calculated using year-over-year comparisons. New Listings were up 11.1 percent for single family homes and down 30.8 percent for townhouse-condo properties. Pending
California Housing Market Update. Monthly Sales and Price Statistics October 2018
 California Housing Market Update Monthly Sales and Price Statistics October 2018 Sales Had the 2 nd Largest Drop in the Last 6 Months California, October 2018 Sales: 397,060 Units, -3.7% YTD, -7.9% YTY
California Housing Market Update. Monthly Sales and Price Statistics September 2018
 California Housing Market Update Monthly Sales and Price Statistics September 2018 Sales Had the Largest Decline since March 2014 California, September 2018 Sales: 382,550 Units, -3.3% YTD, -12.4% YTY
California Housing Market Update. Monthly Sales and Price Statistics November 2018
 California Housing Market Update Monthly Sales and Price Statistics November 2018 Home Sales: Largest Decline Since 2014 California, November 2018 Sales: 381,400 Units, -4.6% YTD, -13.4% YTY 700,000 600,000
SFR Condo Residential Lot Sales Inventory Sales Inventory Sales Inventory. Month YTD Month Month YTD Month Month YTD Month
 Grand Strand Market Report 2017 capped off a great year for the Grand Strand as full year SFR sales volume and median sales price were up 9.8% and 4.3%, respectively. Condo sales activity increased 3.0%
Monthly Indicators % % - 9.2%
 Monthly Indicators 2016 New Listings were down 1.4 percent for single family/duplex homes and 25.0 percent for townhouse-condo properties. Pending Sales increased 58.3 percent for single family/duplex
Housing Price Forecasts. Illinois and Chicago PMSA, June 2012
 Housing Price Forecasts Illinois and Chicago PMSA, June 2012 Presented To Illinois Association of REALTORS From R E A L Regional Economics Applications Laboratory, Institute of Government and Public Affairs
Josephine County Residental Market Trends. January Pending Sales New Listings
 Josephine County Residental Market Trends January 217 Pending Sales..2 New Listings..3 Overall activity trends are not a measure of pricing or value for individual properties. Small Sampling sizes can
The Florida Housing Market
 Florida International University FIU Digital Commons Economics Research Occasional Paper Series Department of Economics 1-2007 The Florida Housing Market Jorge Salazar-Carrillo Department of Economics,
M onthly arket. July Table of Contents. Monthly Highlights
 Table of Contents Market Inventory...2 www.gaar.com Monthly Highlights The median sale price of single-family, detached homes climbed to $190,000 in July 2014, the highest level since August 2008. Market
June 2008 MLS Month in Review
 June 28 MLS Month in Review The Greater Albuquerque Real Estate Market continues to be strong. REALTORS put 1,769 homes under contract in the month of June. For our Market Area, sales are up 9.5% for Detached
Housing Price Forecasts. Illinois and Chicago PMSA, April 2013
 Housing Price Forecasts Illinois and Chicago PMSA, April 2013 Presented To Illinois Association of Realtors From R E A L Regional Economics Applications Laboratory, Institute of Government and Public Affairs
Housing Price Forecasts. Illinois and Chicago PMSA, October 2014
 Housing Price Forecasts Illinois and Chicago PMSA, October 2014 Presented To Illinois Association of Realtors From R E A L Regional Economics Applications Laboratory, Institute of Government and Public
May 2008 MLS Month in Review
 May 28 MLS Month in Review The Albuquerque Market continues to improve, and it s evident that finally, the negative media is turning into positive media. This month s TOP Selling Price Range is $2K to
With last month's gain, sales are now up 4.5% from May 2015 and are at their highest annual pace since February 2007.
 JULY 2016 With last month's gain, sales are now up 4.5% from May 2015 and are at their highest annual pace since February 2007. - Lawrence Yun NAR s Chief Economist Now in its seventh year, the US economic
Housing Price Forecasts. Illinois and Chicago PMSA, May 2018
 Housing Price Forecasts Illinois and Chicago PMSA, May 2018 Presented To Illinois Realtors From R E A L Regional Economics Applications Laboratory, Institute of Government and Public Affairs University
2018 Real Estate Forecast Breakfast. Real Estate Market Update
 2018 Real Estate Forecast Breakfast Central Oregon Association of REALTORS Real Estate Market Update Paul C. Bishop, PhD, CBE Vice President, Research NATIONAL ASSOCIATION OF REALTORS February 22, 2018
1 June FNB House Price Index - Real and Nominal Growth MAY FNB HOUSE PRICE INDEX FINDINGS
 1 June 2016 MARKET ANALYTICS AND SCENARIO FORECASTING UNIT JOHN LOOS: HOUSEHOLD AND PROPERTY SECTOR STRATEGIST 087-328 0151 john.loos@fnb.co.za THEO SWANEPOEL: PROPERTY MARKET ANALYST 087-328 0157 tswanepoel@fnb.co.za
CALIFORNIA ECONOMIC & MARKET OUTLOOK. October 29,2014 Contra Costa Association of REALTORS Leslie Appleton Young, Chief Economist
 2014 2015 CALIFORNIA ECONOMIC & MARKET OUTLOOK October 29,2014 Contra Costa Association of REALTORS Leslie Appleton Young, Chief Economist OVERVIEW Economic Outlook California Housing Market Outlook Housing
2018 Housing Market Outlook. Central Coast Realty Group Business Symposium February 22, 2018 Oscar Wei Senior Economist
 2018 Housing Market Outlook Central Coast Realty Group Business Symposium February 22, 2018 Oscar Wei Senior Economist Overview Economic Update California Housing Market Outlook Regional Housing Market
The State of the Nation s Housing 2007: A Sneak Peek
 The State of the Nation s Housing 2007: A Sneak Peek Eric Belsky Remodeling Futures Conference April 10, 2007 Do Not Distribute Embargoed Until June 11, 2007 www.jchs.harvard.edu The Homebuilding Correction
Puerto Rico Housing Finance Authority Housing Stimulus Programs
 Puerto Rico Housing Finance Authority Housing Stimulus Programs March 31, 2012 (Final with US Data) Total sales assisted by PRHFA stimulus from $240MM Fund Assignment As of March 31, 2012 Silent Second
TEXAS HOUSING INSIGHT
 TEXAS HOUSING INSIGHT JAMES P. GAINES CHIEF ECONOMIST WAYNE DAY RESEARCH ASSOCIATE LUIS B. TORRES RESEARCH ECONOMIST TECHNICAL REPORT 2 1 2 0 OCTOBER 2016 TR Contents About this Report... 3 August 2016
Housing Price Forecasts. Illinois and Chicago PMSA, March 2018
 Housing Price Forecasts Illinois and Chicago PMSA, March 2018 Presented To Illinois Realtors From R E A L Regional Economics Applications Laboratory, Institute of Government and Public Affairs University
California Housing Market Update. Monthly Sales and Price Statistics August 2018
 California Housing Market Update Monthly Sales and Price Statistics August 2018 Sales Declined for the 4 th Consecutive Month California, August 2018 Sales: 399,600 Units, -2.1% YTD, -6.6% YTY 700,000
Atlanta Housing Economic Trends
 Atlanta Housing Economic Trends February 2015 Note: This information is deemed accurate but not guaranteed. It is intended for the personal use of HBA members only. Atlanta Employment Pace of Employment
Housing Price Forecasts. Illinois and Chicago PMSA, July 2016
 Housing Price Forecasts Illinois and Chicago PMSA, July 2016 Presented To Illinois Association of Realtors From R E A L Regional Economics Applications Laboratory, Institute of Government and Public Affairs
Housing Price Forecasts. Illinois and Chicago PMSA, January 2019
 Housing Price Forecasts Illinois and Chicago PMSA, January 2019 Presented To Illinois Realtors From R E A L Regional Economics Applications Laboratory, Institute of Government and Public Affairs University
Released: May 7, 2010
 Released: May 7, 2010 Commentary 2 The Numbers That Drive Real Estate 3 Recent Government Action 9 Topics for Home Buyers, Sellers, and Owners 11 Brought to you by: KW Research Commentary The economic
MONTHLY STATISTICS PACKAGE. City of Calgary. May creb.com
 MONTHLY STATISTICS PACKAGE City of Calgary May 1 creb.com Housing supply swells in cool spring market MONTHLY STATISTICS PACKAGE City of Calgary May 1 City of Calgary, June 1, 1 Calgary s housing inventory
Sep September 2018
 18 September 18 MONTHLY STATISTICS PACKAGE City of Calgary Persistent buyers market continues 18 City of Calgary, October 1, 18 With no change in the economic climate, Calgary s sales activity totaled
Atlanta Housing Economic Trends
 Atlanta Housing Economic Trends August 2013 Note: This information is deemed accurate but not guaranteed. It is intended for the personal use of HBA members only. Atlanta Employment Pace of Employment
New year kicks off with slow sales Jan. 2019
 January 19 19 MONTHLY STATISTICS PACKAGE New year kicks off with slow sales 19, February 1, 19 As economic challenges linger into 19, housing markets remain on a sluggish pace. January sales totalled 8
Housing Price Forecasts. Illinois and Chicago PMSA, March 2016
 Housing Price Forecasts Illinois and Chicago PMSA, March 2016 Presented To Illinois Association of Realtors From R E A L Regional Economics Applications Laboratory, Institute of Government and Public Affairs
This Month in Real Estate
 Keller Williams Research This Month in Real Estate Released: September 14, 2009 Commentary. The Numbers That Drive Real Estate Recent Government Action. Research for Buyers and Sellers. 2 4 10 14 1 Green
Released: June Commentary 2. The Numbers That Drive Real Estate 3. Recent Government Action 9. Topics for Home Buyers, Sellers, and Owners 11
 Released: June 2011 Commentary 2 The Numbers That Drive Real Estate 3 Recent Government Action 9 Topics for Home Buyers, Sellers, and Owners 11 Brought to you by: KW Research Commentary The U.S. housing
Phoenix, Central and Northern Arizona
 Phoenix, Central and Northern Arizona End of Year Housing Report 1-8-354-5664 LongRealty.com 217 End of Year Housing Report SALES & INVENTORY Housing market trends For the overall real estate market in
Sonoma County Business Barometer Q1 CY 2007
 EDB Sonoma County Economic Development Board economy Sonoma County Business Barometer Q1 CY 2007 Economic Development Board 401 College Avenue Suite D Santa Rosa CA 95401 707.565.7170 EDB Sonoma County
FALLON CHURCHILL COUNTY, NEVADA RESIDENTIAL REAL ESTATE TRACKING REPORT
 FALLON CHURCHILL COUNTY, NEVADA RESIDENTIAL REAL ESTATE TRACKING REPORT 3rd QUARTER 15 BOB GETTO, C.R.S. & S.F.R. Nevada real estate broker, Lic # 16039 Council of Residential Specialists certified, National
SE Michigan Residential Real Estate Recovery Are we there yet or is it over?
 SE Michigan Residential Real Estate Recovery Are we there yet or is it over? Changing View of Residential Transactions Changing View of Residential Transactions 2015 Short Sales 3% Leases Bank 11% Owned
Inner Perth Residential Market Report
 Inner Perth Residential Market Report MARCH QUARTER 2014 Inner Perth Residential Market Market Highlights While Western Australia will experience slowed short term growth as the state transitions from
Housing Price Forecasts. Illinois and Chicago PMSA, January 2018
 Housing Price Forecasts Illinois and Chicago PMSA, January 2018 Presented To Illinois Realtors From R E A L Regional Economics Applications Laboratory, Institute of Government and Public Affairs University
Housing Price Forecasts. Illinois and Chicago PMSA, March 2019
 Housing Price Forecasts Illinois and Chicago PMSA, March 2019 Presented To Illinois Realtors From R E A L Regional Economics Applications Laboratory, Institute of Government and Public Affairs University
Patience required in Calgary's housing market recovery Jul. 2018
 July 18 MONTHLY STATISTICS PACKAGE City of Calgary Patience required in Calgary's housing market recovery 18 City of Calgary, August 1, 18 Recent struggles in the job market, accompanied by yet another
September 2018 MLS Statistical Report
 September 218 MLS Statistical Report Total Sales Blame it on Hurricane Florence but overall, sales dropped drastically in August - down 17%. Total Sales Sept'18 172-17% Sept'17 26-2% Sept'16 211 7% 3 2
National Housing Trends
 National Housing Trends 34% America s Choice of Best Long Term Investment 26% 17% 15% 6% Real Estate Stocks / Mutual Funds Gold Savings Accounts / CDs Bonds Gallup 2018 Housing Affordability 197 Index
Atlanta Housing Economic Trends
 Atlanta Housing Economic Trends October 2011 Note: This information is deemed accurate but not guaranteed. It is intended for the personal use of HBA members only. Market Update With Smart Numbers Steve
Monthly Indicators % % %
 Monthly Indicators 2018 Percent changes calculated using year-over-year comparisons. New Listings were down 12.9 percent for single family homes and 21.3 percent for townhouse-condo properties. Pending
Information sheet A Data
 House prices: Statistics activity House prices change over time, but do so at different rates in different places. In this activity you will use statistical diagrams and measures to compare house prices
FALLON CHURCHILL COUNTY, NEVADA RESIDENTIAL REAL ESTATE TRACKING REPORT
 FALLON CHURCHILL COUNTY, NEVADA RESIDENTIAL REAL ESTATE TRACKING REPORT 1st QUARTER 2016 BOB GETTO, C.R.S. & S.F.R. Nevada real estate broker, Lic # 16039 Council of Residential Specialists certified,
Housing market feels the chill as oversupply continues Feb. 2019
 February 19 19 MONTHLY STATISTICS PACKAGE Housing market feels the chill as oversupply continues 19, March 1, 19 The effects of Calgary s economic climate continue to create weak sales activity and elevated
Released: June 7, 2010
 Released: June 7, 2010 Commentary 2 The Numbers That Drive Real Estate 3 Recent Government Action 9 Topics for Home Buyers, Sellers, and Owners 11 Brought to you by: KW Research Commentary The housing
Housing Price Forecasts. Illinois and Chicago PMSA, August 2017
 Housing Price Forecasts Illinois and Chicago PMSA, August 2017 Presented To Illinois Realtors From R E A L Regional Economics Applications Laboratory, Institute of Government and Public Affairs University
ECONOMIC CURRENTS. Vol. 3, Issue 3 SOUTH FLORIDA ECONOMIC QUARTERLY. Introduction
 ECONOMIC CURRENTS THE Introduction SOUTH FLORIDA ECONOMIC QUARTERLY Economic Currents provides an overview of the South Florida regional economy. The report presents current employment, economic and real
Dec December 2018
 December MONTHLY STATISTICS PACKAGE Job market weakness and lending restrictions a common thread in s housing market, January, 19 As oversupply continues in Calgary s housing market, December prices eased
Average Change Sale Price 07 v. 08 Clackamas $375,800-6% Columbia $230,700-9% Multnomah $331,400-1% Washington $317,100-5% Yamhill $270,700-5%
 A Publication of RMLS, The Source for Real Estate Statistics in Your Community Residential Review: Metro, Oregon 29 Reporting Period Residential Highlights Although closed sales dragged to a new low in,
United States Housing, 2012
 United States Department of Agriculture United States Housing, 2012 Delton Alderman ABSTRACT Provides current and historical information on housing market in the United States. Information includes trends
CALGARY REGIONAL HOUSING MARKET STATISTICS 12.14
 CALGARY REGIONAL HOUSING MARKET STATISTICS 12.14 Yearly records set as monthly sales see slight decline Condominium and townhouse sales set a new record for 214 Calgary, January 2, 215 It was a record
Market Overview TAMPA BAY OFFICE THIRD QUARTER
 Market Overview TAMPA BAY OFFICE THIRD QUARTER 29 COLLIERS ARNOLD TAMPA BAY Insights on the Market OFFICE THIRD QUARTER 29 MARKET INDICATORS TAMPA BAY INVENTORY 8,58,612 Sq. Ft. Q3 Q4* OVERALL VACANCY
Housing Price Forecasts. Illinois and Chicago PMSA, April 2018
 Housing Price Forecasts Illinois and Chicago PMSA, April 2018 Presented To Illinois Realtors From R E A L Regional Economics Applications Laboratory, Institute of Government and Public Affairs University
The State of the U.S. & Washington CRE Market: 2008 Review/2009 Outlook
 The State of the U.S. & Washington CRE Market: 2008 Review/2009 Outlook Copyright 2008 CoStar Group, Inc. All Rights Reserved. Although CoStar makes efforts to ensure the accuracy and reliability of the
TUCSON and SOUTHERN ARIZONA
 TUCSON and SOUTHERN ARIZONA End of Year Housing Report (52) 818-454 Stephen@TeamWoodall.com 217 End of Year Housing Report SALES & INVENTORY Housing market trends For the overall real estate market in
Economic Highlights. Payroll Employment Growth by State 1. Durable Goods 2. The Conference Board Consumer Confidence Index 3
 August 26, 2009 Economic Highlights Southeastern Employment Payroll Employment Growth by State 1 Manufacturing Durable Goods 2 Consumer Spending The Conference Board Consumer Confidence Index 3 Real Estate
Aug. Aug 2018 ust 2018
 August 18 MONTHLY STATISTICS PACKAGE City of Calgary Unemployment rate slows housing market recovery 18 City of Calgary, September, 18 Easing sales, gains in new listings and elevated inventory levels
Puerto Rico Housing Finance Authority Housing Stimulus Programs
 Puerto Rico Housing Finance Authority Housing Stimulus Programs June 30, 2011 (Preliminary June US data not yet available) Total sales assisted by PRHFA stimulus from $180MM Fund Assignment As of June
U.S. Economic and Institutional Apartment Market Overview and Outlook. January 7, 2015
 U.S. Economic and Institutional Apartment Market Overview and Outlook January 7, 2015 Emerging Economic Trends Inflation Adjusted Crude Oil Prices In Alignment with Long-Term Average Price per Barrel (Nov.
Metropolitan Indianapolis Board of REALTORS. Broker/Owner Meeting March 14, 2007
 Metropolitan Indianapolis Board of REALTORS Broker/Owner Meeting March 14, 2007 Tom Renkert Information Services Director MIBOR PropertyLinx 2 Implementation Time Line February 1-28 March 1 June 30 July
Metropolitan Tract Performance Report for the Quarter Ended September 30, 2009
 VII. STANDING COMMITTEES F 4 B. Finance, Audit and Facilities Committee Metropolitan Tract Performance Report for the Quarter Ended September 30, 2009 Attachment Metropolitan Tract performance Report for
Housing Price Forecasts. Illinois and Chicago PMSA, March 2017
 Housing Price Forecasts Illinois and Chicago PMSA, March 2017 Presented To Illinois Realtors From R E A L Regional Economics Applications Laboratory, Institute of Government and Public Affairs University
Weak sales persist in Calgary and beyond Jun. 2018
 June 218 MONTHLY STATISTICS PACKAGE City of Calgary Weak sales persist in Calgary and beyond 218 City of Calgary, July 3, 218 Many Canadian energyrelated municipalities within Alberta and Saskatchewan
This Month in Real Estate
 Keller Williams Research This Month in Real Estate Released: June 11, 2009 Commentary. The Numbers That Drive Real Estate Recent Government Action. Research for Buyers and Sellers. 2 4 10 13 1 Green Shoots
UDIA WA PROPERTY MARKET STATISTICS
 UDIA WA PROPERTY MARKET STATISTICS JUNE 218 1 IN THIS ISSUE KEY TRENDS INDUSTRY UPDATE ECONOMY RESIDENTIAL LAND DEVELOPMENT RESIDENTIAL PROPERTY SETTLEMENTS RESIDENTIAL PROPERTY MARKET RESIDENTIAL CONSTRUCTION
UDIA WA PROPERTY MARKET STATISTICS
 UDIA WA PROPERTY MARKET STATISTICS APRIL 218 1 IN THIS ISSUE KEY TRENDS INDUSTRY UPDATE ECONOMY RESIDENTIAL LAND DEVELOPMENT RESIDENTIAL PROPERTY SETTLEMENTS RESIDENTIAL PROPERTY MARKET RESIDENTIAL CONSTRUCTION
MARKET STRATEGY VIEWPOINT U.S. Housing Decelerating
 Jan-01 Oct-01 Jul-02 Apr-03 Jan-0 Oct-0 Jul-05 Apr-0 Jan-07 Oct-07 Jul-08 Apr-09 Jan-10 Oct-10 Jul-11 Apr-12 Jan-13 Oct-13 Jul-1 Apr-15 Jan-1 Oct-1 Jul-17 Apr-18 U.S. Housing Decelerating August 27, 2018
Jim & Jim McKenna LBA & LSA TheJims.com
 Jim & Jim McKenna LBA & LSA 631-974-9151 TheJims.com Return on Investment January 2000 March 2013 MSN Money.com, Case Shiller Pending Home Sales 110 105 100 95 90 Jan Feb Mar Apr May Jun Jul Aug Sep Oct
AAug ugust 2017
 August 17 17 Housing recovery a balancing act Growth in new listings outpaced sales preventing inventory declines City of Calgary, September 1, 17 Sales posted a modest gain in August, but a rise in new
The Helen Adams Realty Monthly Market Update. Housing Market Expected to Continue Steady for Remainder of the Year
 ON the MOVE The Helen Adams Realty Monthly Market Update November 2018 IN this ISSUE P2 P3 Vital Signs Why Buyers Should Continue Their House Hunt in the Fall P4 Ideas for Entertaining Out of Town Guests