San Francisco Housing Market Update
|
|
|
- Junior Lamb
- 6 years ago
- Views:
Transcription
1 San Francisco Housing Market Update California Economic and Housing Market Outlook The national economy maintained a healthy growth rate in the first quarter of 2005 and appeared to be settling in for a soft landing as hoped for by the Federal Reserve. Despite it having the smallest quarterly gain in the past two years, GDP increased at an annual rate of 3.1 percent in the first quarter. After posting an 8 percent increase in January and a 7.8 percent increase in February, retail sales slowed to a 5.8 percent increase in March 2005, in part due to high energy costs. Nonfarm payroll employment gained 2.1 million jobs in March 2005 over the same month of last year, while the national unemployment rate fell from 5.7 percent in March 2004 to 5.2 percent in March At the state level, nonfarm payroll employment rose by 17,600 in March 2005, after gaining an average of 18,000 jobs per month for the first two months of State payroll was only 30,000 jobs shy of the state s pre-recession peak employment level in March Meanwhile, the state unemployment rate fell to 5.4 percent in March 2005, down from 6.4 percent in the same month a year ago. Although the economy has not been as strong as many expected, the national and the state economies are on course to another year with decent economic growth. The California housing market got off to a strong start in 2005 as statewide sales remained robust and the median price set another record in the first quarter. Sales of detached existing single-family homes rose 6.0 percent from 598,370 units in the first quarter of 2004 to 634,090 units in the first quarter of 2005, the highest seasonally adjusted annualized sales figure for any first quarter. Sales were driven in part by continued low mortgage rates and higher inventory levels. Although the Federal Reserve has increased interest rates eight times since last June, fixed mortgage rates have remained below 6 percent since last August. Anticipations that interest rates will increase in the wake of future Fed Funds rate hikes this year may have prompted some buyers to act earlier rather than later. Higher inventory levels may also have contributed to the elevated pace of sales. At 3.2 months, the supply of homes was exactly double that of a year ago, unleashing some of the pent-up demand that has been characteristics of the market in recent years. The median price of a detached single-family home increased 19.8 percent to $488,600 in the first quarter of 2005 from $407,710 a year ago. The median increased 3.8 percent from $470,840 in the fourth quarter of San Francisco Economic and Housing Market Outlook The San Francisco economy began to grow at the end of 2004 and continued to improve in the first quarter of Nonfarm payroll employment in the San Francisco Metropolitan Area increased by 0.5 percent in March 2005 from the same time last year, and has been growing since November The unemployment rate of the San Francisco County also declined by more than one percentage point from 6.5 percent to 5.2 percent in March Bay Area consumer confidence has improved, as the index of the consumer sentiment increased from 90.9 in March 2004 to 92.7 in March

 compared to last year, sales of condominiums fell 7.5 percent.")
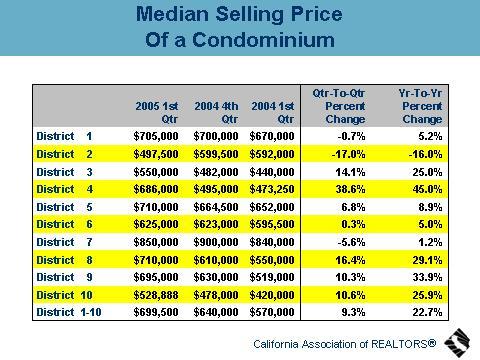
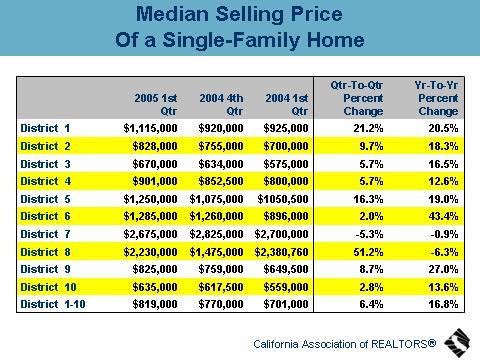
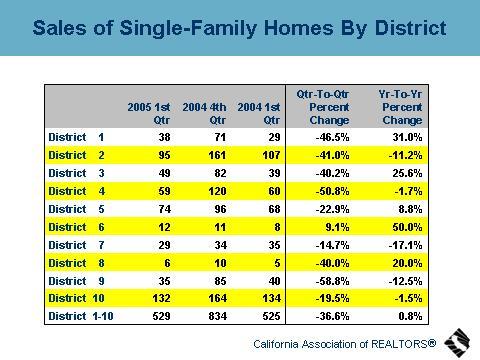
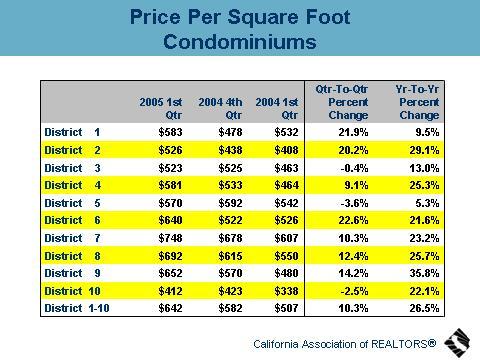
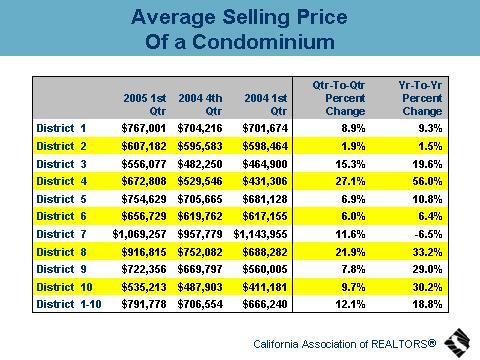
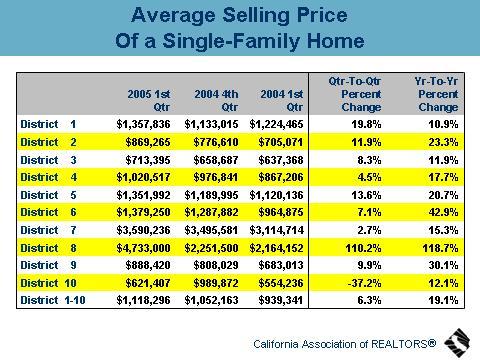
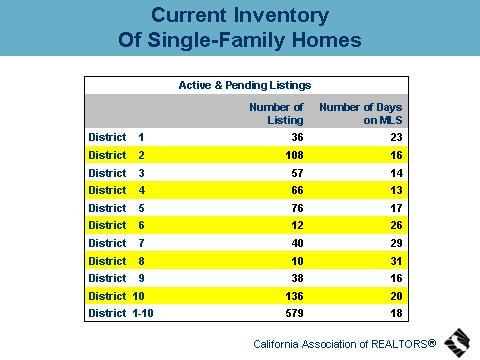
2 The San Francisco housing market lagged that of the state in the first quarter of Sales of detached single-family homes and condominiums 1 decreased 4.0 percent from the first quarter of 2004, and dropped by 26.8 percent from the fourth quarter of Most of the decline in overall residential sales was attributed to the decline in sales of condominiums. As sales of single-family homes were virtually unchanged (+0.8%) compared to last year, sales of condominiums fell 7.5 percent. The drop in condominium sales was mainly due to the decrease in sales in District 9, where sales in sub-districts Inner Mission and Central Waterfront dropped by 76.3 percent and 73.1 percent respectively. Inner Mission sales declined from 76 units in the first quarter of 2004 to 18 units in the current quarter, while Central Waterfront declined from 41 units to 11 units in the same time span. Despite the overall decline in condominium sales, some districts continued to grow over the year, particularly District 6 where sales rose by 72.6 percent year-to-year. The combined median price of detached single-family homes and condominiums increased 20.0 percent year-to-year from $625,000 to $750,000. The median price of a single-family home in the first quarter of 2005 was $819,000, increasing 16.8 percent year-to-year and rising 6.4 percent from the fourth quarter of Double-digit percentage increases in single-family homes were the norm throughout San Francisco, except in Districts 7 and 8 where the median price dropped 0.9 percent and 6.3 percent respectively. District 6 had the strongest growth in single-family home prices, with a year-to-year 43.4 percent increase from $896,000 to $1,285,000. The condominium market experienced greater price appreciation in the first quarter of 2005 than the detached home market, as the median price of condominiums increased 22.7 percent from $570,000 in the first quarter of 2004 to $699,500 in the first quarter of Prices increased in all districts except for District 2, where the median declined 16 percent year-to-year. District 4 had the largest annual gain of 45 percent in condominium prices, followed by District 9 with a 33.9 percent increase. With a median price per square foot for condominiums at $642, it is noteworthy that condominiums in San Francisco are more expensive than detached homes, which were valued at $582 per square foot. Inventory levels increased in the first quarter as active and pending listings grew a significant 38.9 percent from the previous quarter to 1,181, partly in anticipation of the peak summer month. Active and pending single-family home listings increased 52 percent quarter-to-quarter, while condominiums registered a 28 percent increase. 1 Condominium include condominiums, coop, TLC, and townhouses 2
3 3
4 4
5 5


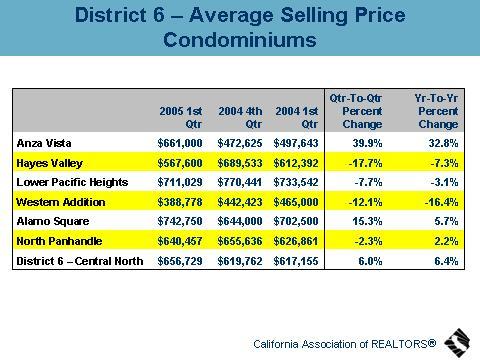
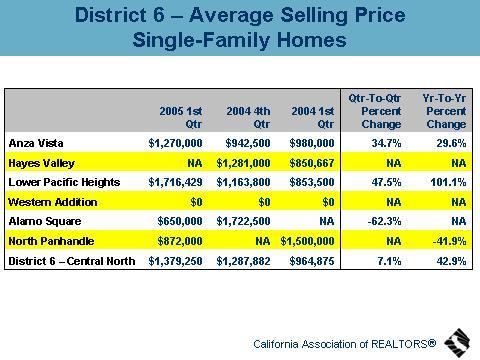
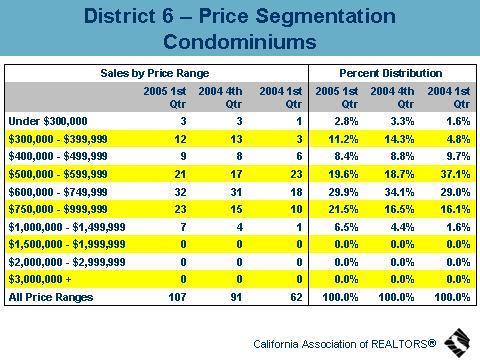
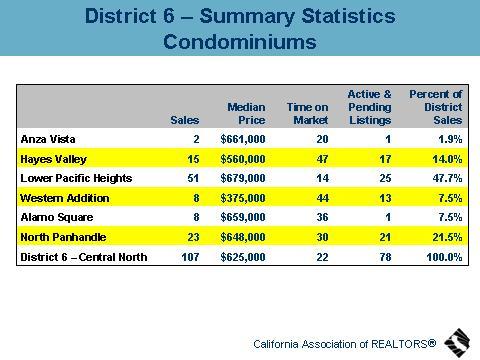
6 District 6- Central North Sales - Quarterly sales of single-family homes and condominiums increased 70 percent from last year and 16.7 percent from the previous quarter. Condominiums, which made up the majority of home sales in District 6, were the force behind the sales in the district in the first quarter of Sales of condominiums increased 72.6 percent year-to-year and 17.6 percent quarter-to-quarter, driven in part by sales in Lower Pacific Heights that surged 325 percent from that of last year. Price Median prices of single-family homes and condominiums continued to grow on a year-to-year basis, but began to show signs of slowing down. Single-family homes registered a year-to-year gain of 43.4 percent from $896,500 to $1,285,500, while posting a quarterly increase of 2.0 percent from last quarter s $1,260,000. The median price of condominiums increased by 5.0 percent from last year, but was virtually unchanged from the fourth quarter of Inventory and Days on Market The inventory level (active and pending listings) decreased from last quarter s 102 listings to 90 listings in the first quarter of Over half of the listings were located in Lower Pacific Heights and North Panhandle, and more than four out of five of the listings were condominiums. Homes were selling faster in the first quarter of 2005, as compared to a year ago. Both single-family homes and condominiums had a median time on market of less than 30 days. Properties located in Lower Pacific Heights were selling the fastest with a median time on market of 6

7 15 days, while Hayes Valley had the longest median time on market of 47 days in the first quarter of
8 8

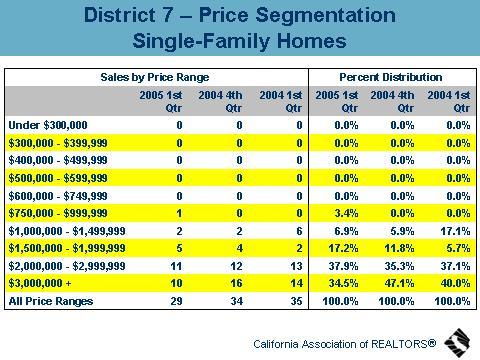
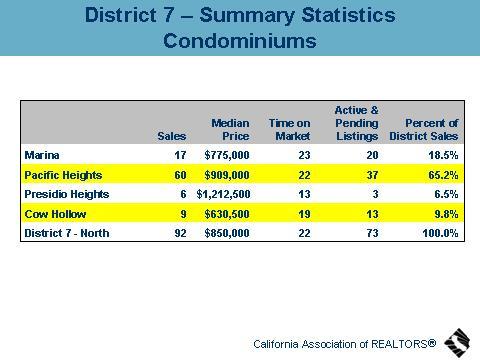
9 District 7- North Sales - Sales of single-family homes and condominiums increased moderately by 8 percent from last year and remained unchanged from the previous quarter. Homes sold in Pacific Heights comprised more than 60 percent of all homes sold in the district. Together with Marina, the two sub-districts continued to dominate sales in District 7. Sales of condominiums continued to grow in the district as the number of units sold increased 19.5 percent from a year ago. Price The median price of a detached single-family home declined slightly by 0.9 percent from last year s $2,700,000 to $2,675,000 in the first quarter of 2005, while the median price of a condominium increased 1.2 percent from $840,000 to $850,000. Pacific Heights, where most of the homes were sold, posted a combined median price of $1,100,000 for detached single-family homes and condominiums, which was an increase of 5.2 percent year-to-year and an increase of 3.8 percent quarter-to-quarter. The median price of a single-family home in the sub-district declined 16.3 percent quarter-to-quarter and 7.3 percent year-to-year to $2,850,000 in the first quarter of 2005 after it peaked at $3,400,000 in the fourth quarter of On the other hand, the median price of a condominium in Pacific Heights continued to grow 9.5 percent quarter-to-quarter and 13.6 year-toyear to reach $909,000. 9
10 Inventory and Days on Market The number of active and pending listings increased 67 percent from 68 in the last quarter to 113 in the first quarter of Over 80 percent of the listings were located in Marina and Pacific Heights, and more than about 60 percent of the listings were condominiums. Condominiums, in general, were selling faster than single-family homes in the first quarter of 2005, with a median time on market of 22 days, compared to 41 days for single-family homes. 10
11 11


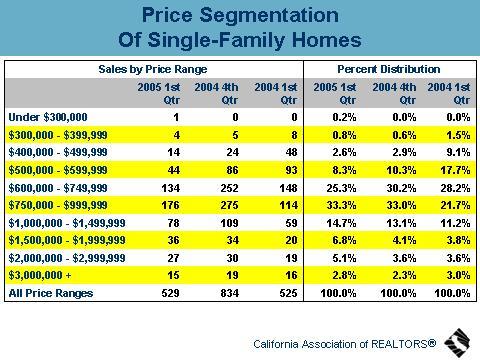
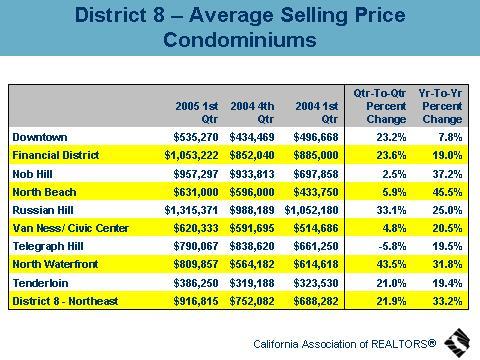
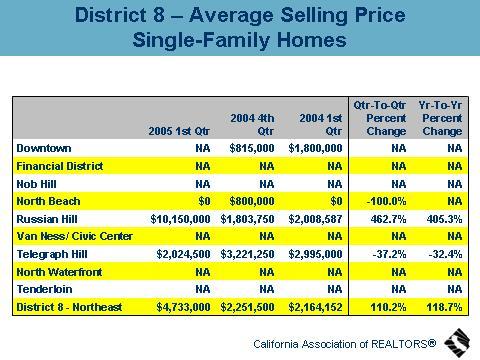
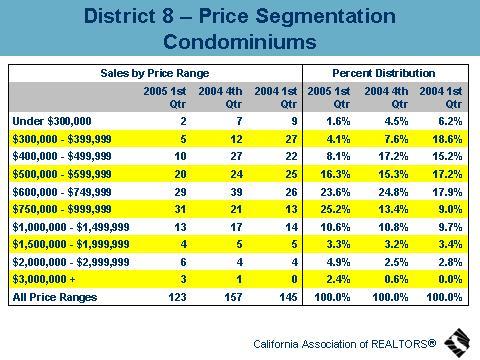
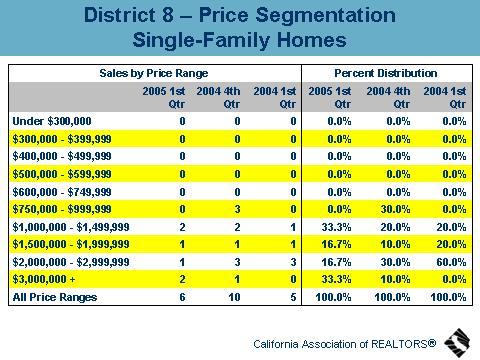
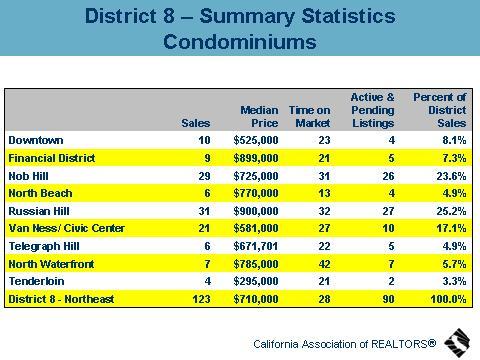
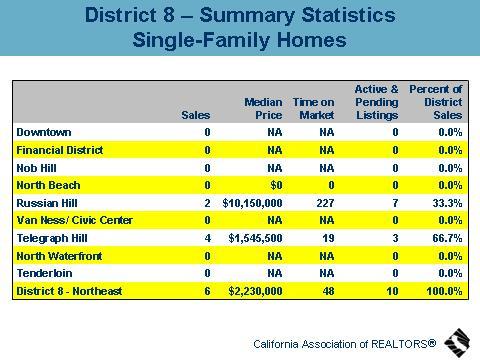
12 District 8- Northeast Sales Condominium sales dominated the market in District 8, accounting for 123 of the 129 sales. Sales of condominiums decreased 15.2 percent from last year and 21.7 percent from the previous quarter. Sales dropped on a year-to-year basis in all but three sub-districts: the Financial District, North Beach, and Russian Hill. Price The median price of condominiums increased 29.1 percent from last year s $550,000 to $710,000, and increased 16.4 percent quarter-to-quarter from the fourth quarter median of $610,000. Median prices in all sub-districts increased from a year ago, with North Waterfront posting the highest year-to-year increase at 51.3 percent, and the Financial District posting the smallest gain at 4.2 percent. All sub-districts had double-digit percentage gains in prices except the Financial District and Tenderloin. Significant price appreciation in the condominium market was also reflected in the declining number of affordable housing units sold in the district. Less than 14 percent of the condominiums sold in the first quarter of 2005 were under $500,000, compared to 40 percent in the same quarter of On the other hand, condominiums priced between $750,000 and $999,999, increased from 9 percent in the first quarter of 2004 to 25 percent in the current quarter. The number of units sold above $1,000,000 also increased by more than 5 percent to 21.1 percent, a reflection of overall appreciation in the market. 12
13 Inventory and Days on Market Listings (active and pending) increased from last quarter s 85 to 100 in the first quarter of Sixty percent of the listings were from Nob Hill and Russian Hill. Homes sold at a faster pace as the median time on market for the first quarter of 2005 was 28 days compared to 37 days in the same quarter of last year, and 32 days in the previous quarter. 13
14 14
Single Family Sales Maine: Units
 Maine Home Connection 19 Commercial St Portland, Maine 04101 MaineHomeConnection.com Office: (207) 517-3100 Email: Info@MaineHomeConnection.com For the fourth consecutive year, Maine home sales set a new
Housing Price Forecasts. Illinois and Chicago PMSA, March 2018
 Housing Price Forecasts Illinois and Chicago PMSA, March 2018 Presented To Illinois Realtors From R E A L Regional Economics Applications Laboratory, Institute of Government and Public Affairs University
INLAND EMPIRE REGIONAL INTELLIGENCE REPORT
 INLAND EMPIRE REGIONAL INTELLIGENCE REPORT June 2016 EMPLOYMENT After a slow start to 2016, the Inland Empire s labor market returned to form, in recent job figures. Seasonally adjusted nonfarm employment
Housing Price Forecasts. Illinois and Chicago PMSA, October 2014
 Housing Price Forecasts Illinois and Chicago PMSA, October 2014 Presented To Illinois Association of Realtors From R E A L Regional Economics Applications Laboratory, Institute of Government and Public
INLAND EMPIRE REGIONAL INTELLIGENCE REPORT. School of Business. April 2018
 INLAND EMPIRE REGIONAL INTELLIGENCE REPORT April 2018 Key economic indicators suggest that the Inland Empire s economy will continue to expand throughout the rest of 2018, building upon its recent growth.
Housing and Economy Market Trends
 Housing and Economy Market Trends Mainstreet Organization Prices of single-family, detached homes in suburban Chicago increased 12.1 percent in May 2014 compared with the same period a year ago. Overall,
ANALYSIS OF THE CENTRAL VIRGINIA AREA HOUSING MARKET 1st quarter 2013 By Lisa A. Sturtevant, PhD George Mason University Center for Regional Analysis
 ANALYSIS OF THE CENTRAL VIRGINIA AREA HOUSING MARKET 1st quarter By Lisa A. Sturtevant, PhD George Mason University Center for Regional Analysis Economic Overview Key economic factors in the first quarter
nd Quarter Market Report
 2015 2 nd Quarter Market Report The voice of real estate in Central Virginia CAAR Member Copy Expanded Edition Charlottesville Area 2 nd Quarter 2015 Highlights: Closed sales in the Greater Charlottesville
Housing Price Forecasts. Illinois and Chicago PMSA, January 2018
 Housing Price Forecasts Illinois and Chicago PMSA, January 2018 Presented To Illinois Realtors From R E A L Regional Economics Applications Laboratory, Institute of Government and Public Affairs University
Housing Price Forecasts. Illinois and Chicago PMSA, March 2016
 Housing Price Forecasts Illinois and Chicago PMSA, March 2016 Presented To Illinois Association of Realtors From R E A L Regional Economics Applications Laboratory, Institute of Government and Public Affairs
Housing Price Forecasts. Illinois and Chicago PMSA, June 2012
 Housing Price Forecasts Illinois and Chicago PMSA, June 2012 Presented To Illinois Association of REALTORS From R E A L Regional Economics Applications Laboratory, Institute of Government and Public Affairs
Housing Price Forecasts. Illinois and Chicago PMSA, May 2018
 Housing Price Forecasts Illinois and Chicago PMSA, May 2018 Presented To Illinois Realtors From R E A L Regional Economics Applications Laboratory, Institute of Government and Public Affairs University
The Knox County HOUSING MARKET
 T E C H REPORT SERIES The Knox HOUSING MARKET Date: August 2007 For more information: MPC Contact Person: Bryan Berry 215-2500 MPC Website and e-mail www.knoxmpc.org contact@knoxmpc.org INTRODUCTION In
Has The Office Market Reached A Peak? Vacancy. Rental Rate. Net Absorption. Construction. *Projected $3.65 $3.50 $3.35 $3.20 $3.05 $2.90 $2.
 Research & Forecast Report OAKLAND METROPOLITAN AREA OFFICE Q1 Has The Office Market Reached A Peak? > > Vacancy remained low at 5. > > Net Absorption was positive 8,399 in the first quarter > > Gross
Housing Price Forecasts. Illinois and Chicago PMSA, April 2018
 Housing Price Forecasts Illinois and Chicago PMSA, April 2018 Presented To Illinois Realtors From R E A L Regional Economics Applications Laboratory, Institute of Government and Public Affairs University
Rapid recovery from the Great Recession, buoyed
 Game of Homes The Supply-Demand Struggle Laila Assanie, Sarah Greer, and Luis B. Torres October 4, 2016 Publication 2143 Rapid recovery from the Great Recession, buoyed by the shale oil boom, has fueled
California Housing Market Update. Monthly Sales and Price Statistics October 2018
 California Housing Market Update Monthly Sales and Price Statistics October 2018 Sales Had the 2 nd Largest Drop in the Last 6 Months California, October 2018 Sales: 397,060 Units, -3.7% YTD, -7.9% YTY
Housing Price Forecasts. Illinois and Chicago PMSA, December 2015
 Housing Price Forecasts Illinois and Chicago PMSA, December 2015 Presented To Illinois Association of Realtors From R E A L Regional Economics Applications Laboratory, Institute of Government and Public
Monthly Indicators + 5.9% - 6.6% + 8.1%
 ly Indicators A RESEARCH TOOL PROVIDED BY METRO MLS FOR ACTIVITY IN THE 4-COUNTY MILWAUKEE METROPOLITAN AREA 2019 Quick Facts Despite a strong U.S. economy, historically low unemployment and steady wage
San Francisco Bay Area to Santa Clara and San Benito Counties Housing and Economic Outlook
 San Francisco Bay Area to 2020 Santa Clara and San Benito Counties Housing and Economic Outlook Economic Forecast Summary 2017 Presented by Pacific Union International, Inc. and John Burns Real Estate
California Housing Market Update. Monthly Sales and Price Statistics May 2018
 California Housing Market Update Monthly Sales and Price Statistics May 2018 Sales Lost Momentum as Mortgage Rates Continued to Climb California, May 2018 Sales: 409,270 Units, +0.3% YTD, -4.6% YTY 700,000
Housing Price Forecasts. Illinois and Chicago PMSA, January 2019
 Housing Price Forecasts Illinois and Chicago PMSA, January 2019 Presented To Illinois Realtors From R E A L Regional Economics Applications Laboratory, Institute of Government and Public Affairs University
Connecticut First Nine Months Housing Report 2014
 Connecticut First Nine Months Housing Report 2014 First Nine Months of 2014 Highlight Positive Outlook for Multi-family Home Construction Millennial buyers are finally increasing their rate of household
Housing Price Forecasts. Illinois and Chicago PMSA, August 2016
 Housing Price Forecasts Illinois and Chicago PMSA, August 2016 Presented To Illinois Association of Realtors From R E A L Regional Economics Applications Laboratory, Institute of Government and Public
Quarterly Housing Market Update
 Quarterly Housing Market Update An Overview New Hampshire s current housing market performance, as well as its overall economy, is slowly improving, with positives such as increasing employment and rising
Housing Price Forecasts. Illinois and Chicago PMSA, March 2019
 Housing Price Forecasts Illinois and Chicago PMSA, March 2019 Presented To Illinois Realtors From R E A L Regional Economics Applications Laboratory, Institute of Government and Public Affairs University
Monthly Indicators % + 2.1% %
 Monthly Indicators A RESEARCH TOOL PROVIDED BY NORTH TEXAS REAL ESTATE INFORMATION SYSTEMS, INC. 2019 Despite a strong U.S. economy, historically low unemployment and steady wage growth, home sales began
San Francisco Bay Area to Marin, San Francisco, and San Mateo Counties Housing and Economic Outlook
 San Francisco Bay Area to 2020 Marin, San Francisco, and San Mateo Counties Housing and Economic Outlook Economic Forecast Summary 2017 Presented by Pacific Union International, Inc. and John Burns Real
Housing Price Forecasts. Illinois and Chicago PMSA, March 2017
 Housing Price Forecasts Illinois and Chicago PMSA, March 2017 Presented To Illinois Realtors From R E A L Regional Economics Applications Laboratory, Institute of Government and Public Affairs University
2019 Housing Market Forecast. Palos Verdes Peninsula AOR January 8, 2019 Jordan G. Levine Senior Economist
 2019 Housing Market Forecast Palos Verdes Peninsula AOR January 8, 2019 Jordan G. Levine Senior Economist Overview Good News: Economic fundamentals solid Homeownership still the dream Rates might not go
California Housing Market Update. Monthly Sales and Price Statistics November 2018
 California Housing Market Update Monthly Sales and Price Statistics November 2018 Home Sales: Largest Decline Since 2014 California, November 2018 Sales: 381,400 Units, -4.6% YTD, -13.4% YTY 700,000 600,000
RESIDENTIAL MARKET ANALYSIS
 RESIDENTIAL MARKET ANALYSIS CLANCY TERRY RMLS Student Fellow Master of Real Estate Development Candidate Oregon and national housing markets both demonstrated shifting trends in the first quarter of 2015
Washington Market Highlights: Fourth Quarter 2018
 Washington State s Housing Market 4th Quarter 2018 Washington Market Highlights: Fourth Quarter 2018 Existing home sales fell in the fourth quarter by 2.7 percent to a seasonally adjusted annual rate of
1200 Premier Drive, Suite 140 Chattanooga, TN Each office is independently owned and operated.
 THIS MONTH IN REAL ESTATE K im aulston R REALTOR 1200 Premier Drive, Suite 140 Chattanooga, TN 37421 Each office is independently owned and operated. Cell: 423-316-4022 Office: 423-664-1600 Email: kcraulston@gmail.com
WISCONSIN HOUSING MARKETPLACE
 WISCONSIN REALTORS ASSOCIATION WISCONSIN HOUSING MARKETPLACE Date: 2/16/06 For Release: Immediately For More Information Contact: David E. Clark, Economist C3 Statistical Solutions Inc. Office phone: 414-803-6537
Housing Price Forecasts. Illinois and Chicago PMSA, September 2016
 Housing Price Forecasts Illinois and Chicago PMSA, September 2016 Presented To Illinois Realtors From R E A L Regional Economics Applications Laboratory, Institute of Government and Public Affairs University
California Housing Market Update. Monthly Sales and Price Statistics January 2018
 California Housing Market Update Monthly Sales and Price Statistics January 2018 Sales Started with a Slight Decrease California, Jan. 2018 Sales: 388,800 Units, -2.9% YTD, -2.9% YTY 700,000 600,000 500,000
Sonoma County Business Barometer Q1 CY 2007
 EDB Sonoma County Economic Development Board economy Sonoma County Business Barometer Q1 CY 2007 Economic Development Board 401 College Avenue Suite D Santa Rosa CA 95401 707.565.7170 EDB Sonoma County
Housing Price Forecasts. Illinois and Chicago PMSA, July 2016
 Housing Price Forecasts Illinois and Chicago PMSA, July 2016 Presented To Illinois Association of Realtors From R E A L Regional Economics Applications Laboratory, Institute of Government and Public Affairs
Year to Date (thru June)
") CAAR Market Report 2009 Mid-Year Published by the Charlottesville Area Association of REALTORS Where Are We Now? The pace of home purchases in the Charlottesville area continues to improve from the dismal
CAAR Market Report 2009 Mid-Year Published by the Charlottesville Area Association of REALTORS Where Are We Now? The pace of home purchases in the Charlottesville area continues to improve from the dismal
THE REAL ESTATE BOARD OF NEW YORK
 THE REAL ESTATE BOARD OF NEW YORK REAL ESTATE BROKER CONFIDENCE INDEX FIRST QUARTER 2018 EXECUTIVE SUMMARY The Real Estate Board of New York s (REBNY) Real Estate Broker Index for the first quarter of
Economic Highlights. Payroll Employment Growth by State 1. Durable Goods 2. The Conference Board Consumer Confidence Index 3
 August 26, 2009 Economic Highlights Southeastern Employment Payroll Employment Growth by State 1 Manufacturing Durable Goods 2 Consumer Spending The Conference Board Consumer Confidence Index 3 Real Estate
High-priced homes have a unique place in the
 Livin' Large Texas' Robust Luxury Home Market Joshua G. Roberson December 3, 218 Publication 2217 High-priced homes have a unique place in the overall housing market. Their buyer pool, home characteristics,
ECONOMIC CURRENTS. Vol. 4, Issue 3. THE Introduction SOUTH FLORIDA ECONOMIC QUARTERLY
 ECONOMIC CURRENTS THE Introduction SOUTH FLORIDA ECONOMIC QUARTERLY Vol. 4, Issue 3 Economic Currents provides an overview of the South Florida regional economy. The report presents current employment,
Western Economic Developments
 IN THIS ISSUE F E D E R A L R E S E R V E B A N K O F S A N F R A N C I S C O Western Economic Developments Office market slumps, housing demand remains strong in District Figure, panel B: Commercial office
FY General Revenue Forecast Presentation
 FY 2015-2019 General Revenue Forecast Presentation Steven A. Solomon Director of Finance February 18, 2014 Overview Current Economic Outlook National State Local FY 2014 2nd Quarter Revenue Update Five
STRENGTHENING RENTER DEMAND
 5 Rental Housing Rental housing markets experienced another strong year in 2012, with the number of renter households rising by over 1.1 million and marking a decade of unprecedented growth. New construction
Q B O S T O N M A R K E T R E P O R T
 Q 3 2 1 7 B O S T O N M A R K E T R E P O R T Introducing the Compass Q3 217 Greater Boston Market Report Page 2 Page 3 Page 5 Page 7 Page 8 Map of Coverage Area Single Family Overview Condo Overview Time
California Housing Market Update. Monthly Sales and Price Statistics September 2018
 California Housing Market Update Monthly Sales and Price Statistics September 2018 Sales Had the Largest Decline since March 2014 California, September 2018 Sales: 382,550 Units, -3.3% YTD, -12.4% YTY
Washington Market Highlights: Third Quarter 2018
 Washington State s Housing Market 3rd Quarter 2018 Washington Market Highlights: Third Quarter 2018 Existing home sales rose in the third quarter by 0.1 percent to a seasonally adjusted annual rate of
Vacancy Inches Higher, Despite Continued Absorption
 Research & Forecast Report GREATER PHOENIX OFFICE 1Q 2017 Vacancy Inches Higher, Despite Continued Absorption Key Takeaways > > Improving conditions in the Greater Phoenix office market took a pause in
By several measures, homebuilding made a comeback in 2012 (Figure 6). After falling another 8.6 percent in 2011, single-family
. After falling another 8.6 percent in 2011, single-family") 2 Housing Markets With sales picking up, low inventories of both new and existing homes helped to firm prices and spur new single-family construction in 212. Multifamily markets posted another strong year,
2 Housing Markets With sales picking up, low inventories of both new and existing homes helped to firm prices and spur new single-family construction in 212. Multifamily markets posted another strong year,
Sonoma County Business Barometer Q4 CY 2007
 EDB Sonoma County Economic Development Board economy Sonoma County Business Barometer Q4 CY 27 Economic Development Board 41 College Avenue Suite D Santa Rosa CA 9541 77.565.717 EDB Sonoma County Economic
2015 First Quarter Market Report
 2015 First Quarter Market Report CAAR Member Copy Expanded Edition Charlottesville Area First Quarter 2015 Highlights: Median sales price for the region was up 5.1% over Q1-2014, rising from $244,250 to
Economic Highlights. Retail Sales Components 1. University of Michigan Consumer Sentiment Index 2. Industrial Production and Capacity Utilization 3
 November 17, 2010 Economic Highlights Consumer Spending Retail Sales Components 1 University of Michigan Consumer Sentiment Index 2 Manufacturing Industrial Production and Capacity Utilization 3 Real Estate
California Housing Market Update. Monthly Sales and Price Statistics December 2018
 California Housing Market Update Monthly Sales and Price Statistics December 2018 Sales Reached the Lowest Level since Jan 2015 California, December 2018 Sales: 372,260 Units, -5.2% YTD, -11.6% YTY 700,000
San Francisco Bay Area to Napa County Housing and Economic Outlook
 San Francisco Bay Area to 019 Napa County Housing and Economic Outlook Bay Area Economic Forecast Summary Presented by Pacific Union International, Inc. and John Burns Real Estate Consulting, LLC On Nov.
CALIFORNIA ECONOMIC & MARKET OUTLOOK. October 29,2014 Contra Costa Association of REALTORS Leslie Appleton Young, Chief Economist
 2014 2015 CALIFORNIA ECONOMIC & MARKET OUTLOOK October 29,2014 Contra Costa Association of REALTORS Leslie Appleton Young, Chief Economist OVERVIEW Economic Outlook California Housing Market Outlook Housing
rd Quarter Market Report
 2012 3 rd Quarter Market Report The voice of real estate in Central Virginia CAAR Member Copy Expanded Edition Charlottesville Area 3 rd Quarter 2012 Highlights: Overall sales in Greater Charlottesville
Washington Market Highlights: Fourth Quarter 2017
 Washington State s Housing Market 4th Quarter 2017 Washington Market Highlights: Fourth Quarter 2017 Existing home sales declined in the fourth quarter by 0.2 percent to a seasonally adjusted annual rate
RESIDENTIAL MARKET ANALYSIS
 11 RESIDENTIAL MARKET ANALYSIS Kyle Smith Portland State University National housing market statistics reflect an increase in value from the prior year, bucking the multi-quarter trend of declining sales
ECONOMIC CURRENTS. Vol. 3, Issue 3 SOUTH FLORIDA ECONOMIC QUARTERLY. Introduction
 ECONOMIC CURRENTS THE Introduction SOUTH FLORIDA ECONOMIC QUARTERLY Economic Currents provides an overview of the South Florida regional economy. The report presents current employment, economic and real
The San Francisco Bay Area Apartment Building Market
 The San Francisco Bay Area Apartment Building Market April 2018 Market Report Main Focus on 2-4 Unit Buildings For San Francisco, Alameda & Marin Counties Sales in Millions of Dollars San Francisco Apartment
San Francisco Bay Area to Alameda and Contra Costa Counties Housing and Economic Outlook
 San Francisco Bay Area to 2020 Alameda and Contra Costa Counties Housing and Economic Outlook Economic Forecast Summary 2017 Presented by Pacific Union International, Inc. and John Burns Real Estate Consulting,
March 2016 Washington, DC Market Trends Report March sales represent a 12 percent increase; top the five-year March average
 FOR IMMEDIATE RELEASE Contact: Bobette Banks 301-590-8764 Director of Communications Greater Capital Area Association of REALTORS bbanks@gcaar.com March 2016 Washington, DC Market Trends Report March sales
Housing Price Forecasts. Illinois and Chicago PMSA, August 2017
 Housing Price Forecasts Illinois and Chicago PMSA, August 2017 Presented To Illinois Realtors From R E A L Regional Economics Applications Laboratory, Institute of Government and Public Affairs University
San Francisco Bay Area to Sonoma County Housing and Economic Outlook
 San Francisco Bay Area to 2020 Sonoma County Housing and Economic Outlook Economic Forecast Summary 2017 Presented by Pacific Union International, Inc. and John Burns Real Estate Consulting, LLC On Nov.
Monthly Market Snapshot
 SEPTEMBER 2018 Vacancy continues to fall. Nearing the end of the third quarter, the vacancy rate dropped 10 basis points to 6.4%, compared to this time last month at 6.5%. Occupancy of the 1.1 million
2018 Housing Market Remains Strong Despite Limited Inventories
 Date: 1/21/19 For Release: Immediately For More Information Contact: Michael Theo, WRA President & CEO, 608-241-2047, mtheo@wra.org or David Clark, Economist, C3 Statistical Solutions and Professor of
MONTHLY RESEARCH BULLETIN SEPTEMBER 2016
 MONTHLY RESEARCH BULLETIN SEPTEMBER 2016 ABOUT REIV The Real Estate Institute of Victoria has been the peak professional association for the Victorian real estate industry since 1936. Over 2,000 real estate
4 RENTAL MARKETS. While the fundamentals remain strong for. investors, there are signs that rental markets
 4 RENTAL MARKETS While the fundamentals remain strong for investors, there are signs that rental markets are at a turning point. Real rents are still climbing, but at a slower pace now that vacancy rates
MARKET AREA UPDATE Report as of: 1Q 2Q 3Q 4Q
 MARKET AREA UPDATE Report as of: 1Q 2Q 3Q 4Q Year: 2013 Market Area (City, State): Washington DC Metropolitan Area Provided by (Company / Companies): LONG & FOSTER REAL ESTATE, INC. What are the most significant
Nothing Draws a Crowd Like a Crowd: The Outlook for Home Sales
 APRIL 2018 Nothing Draws a Crowd Like a Crowd: The Outlook for Home Sales The U.S. economy posted strong growth with fourth quarter 2017 Real Gross Domestic Product (real GDP) growth revised upwards to
ECONOMIC CURRENTS. Vol. 3, Issue 1. THE SOUTH FLORIDA ECONOMIC QUARTERLY Introduction
 ECONOMIC CURRENTS THE SOUTH FLORIDA ECONOMIC QUARTERLY Introduction Economic Currents provides an overview of the South Florida regional economy. The report contains current employment, economic and real
Louisiana 2011 YTD v At a Glance
 IN THIS ISSUE... Days on the Market: What Does it Tell Us? Statewide Sales Statistics Unemployment Rates Up, Job Gains Shown Recent Economic Development News LR s Quarterly Report on the Real Estate Market
Monthly Indicators. Monthly Snapshot. April % % + 4.7%
 Monthly Indicators For residential real estate activity in the state of New Jersey 2018 Monthly Snapshot Many sellers and builders are in a good position for financial gains, as the economy continues to
TENNESSEE HOUSING MARKET
 1st Quarter 212 TENNESSEE HOUSING MARKET David A. Penn, Director Business and Economic Research Center Jennings A. Jones College of Business Middle Tennessee State University This quarterly series is supported
2013 Arizona Housing Market Mid-Year Report
 2013 Arizona Housing Market Mid-Year Report This mid-year market report outlines the latest trends in Arizona real estate. The housing market hit bottom in mid to late 2011, and has been in recovery mode
The Manhattan real estate market
 Manhattan Market Report Q 04 by the numbers +.6% StreetEasy Condo Price Index (QuarteroverQuarter) 0.% StreetEasy Condo Price Forecast (MonthoverMonth) 6.0% Total (QuarteroverQuarter) 6.0% Number of Pending
Morningside Heights Harlem. Peter Comitini Senior VP Associate Broker The Corcoran Group
 Sutton Area TriBeCa Upper East Side Upper West Side Washington Heights West Village The Corcoran Report Battery Park City Beekman Carnegie Hill Central Park South Chelsea Flatiron Clinton East Harlem East
NATIONAL ASSOCIATION of REALTORS RESEARCH DIVISION. Prepared for Florida REALTORS
 NATIONAL ASSOCIATION of REALTORS RESEARCH DIVISION Prepared for Florida REALTORS NATIONAL ASSOCIATION OF REALTORS RESEARCH DIVISION Page 1 Page 3 Page 4 Page 6 Page 7 Page 8 Page 9 Page 10 Page 11 Page
Annual Report on the MLS PIN Housing Market A FREE RESEARCH TOOL FROM MLS PROPERTY INFORMATION NETWORK, INC.
 Annual Report on the MLS PIN Housing Market A FREE RESEARCH TOOL FROM MLS PROPERTY INFORMATION NETWORK, INC. Annual Report on the MLS PIN Housing Market A FREE RESEARCH TOOL FROM MLS PROPERTY INFORMATION
August 2015 Washington, DC Market Trends Report Limited supply, high demand continue pushing prices to record highs
 FOR IMMEDIATE RELEASE Contact: Bobette Banks 301-590-8764 Director of Communications Greater Capital Area Association of REALTORS bbanks@gcaar.com August 2015 Washington, DC Market Trends Report Limited
RESIDENTIAL MARKET ANALYSIS
 RESIDENTIAL MARKET ANALYSIS EVAN ABRAMOWITZ RMLS Student Fellow Master of Real Estate Development Graduate Student September existing-home sales declined modestly, but inventory continued to tighten and
Rents Up, Occupancy Steady
 Rents Up, Steady Kansas City s apartment market closed 2014 with a significant increase in rents compared to the prior year. The average per-square-foot rent was $0.88. At the end of 2013 it had been $0.85.
ECONOMIC CURRENTS. Vol. 5 Issue 2 SOUTH FLORIDA ECONOMIC QUARTERLY. Key Findings, 2 nd Quarter, 2015
 ECONOMIC CURRENTS THE Introduction SOUTH FLORIDA ECONOMIC QUARTERLY Economic Currents provides an overview of the South Florida regional economy. The report presents current employment, economic and real
Economic Indicators Quarter 3 City of Oakland
 Attachment B Economic Indicators Quarter 3 City of Oakland PREPARED BY: THE OFFICE OF ECONOMIC AND WORKFORCE DEVELOPMENT CITY OF OAKLAND DECEMBER 2014 September 16, 2014Sepseseee Introduction to Quarter
California Housing Market Update. Monthly Sales and Price Statistics August 2018
 California Housing Market Update Monthly Sales and Price Statistics August 2018 Sales Declined for the 4 th Consecutive Month California, August 2018 Sales: 399,600 Units, -2.1% YTD, -6.6% YTY 700,000
Housing Bulletin Monthly Report
 October 21 1 Housing Bulletin Monthly Report Housing Starts show Slight improvement in September CANADA Housing Starts 2, 15, 1, 5, Sep 8 Oct 8 Nov 8 Dec 8 Preliminary Housing Starts in Alberta and Canada
Monthly Indicators + 3.5% + 3.0% % Activity Overview New Listings Pending Sales. Closed Sales. Days on Market Until Sale. Median Sales Price
 Monthly Indicators 218 Housing price bubble chatter has increased this summer, as market observers attempt to predict the next residential real estate shift. It is too early to predict a change from higher
February 2016 Loudoun County Market Trends Report Contracts and sales activity jump double-digits; Inventories down 15.5 percent
 FOR IMMEDIATE RELEASE Contact: Christine Windle 703-777-2468, cwindle@dullesarea.com Sponsored by: Access National Bank Tom Ciolkosz, (703) 871-1045, tciolkosz@accessnationalbank.com Patty Foster, 703-871-1014,
OVERVIEW OF RECENT/EXPECTED ECONOMIC/ HOUSING MARKET CONDITIONS
 OVERVIEW OF RECENT/EXPECTED ECONOMIC/ HOUSING MARKET CONDITIONS STRONG ECONOMIC FUNDAMENTALS *BUT* EXTRAORDINARY SHORT-TERM FACTORS RESULTING IN MAJOR SHIFTS IN TYPES OF HOUSING PRODUCTS AND GEOGRAPHICAL
Las Vegas Valley Executive Summary
 ARROYO MARKET SQUARE Las Vegas Valley Executive Summary Retail Market 4th Quarter 2013 THE DISTRICT AT GREEN VALLEY RANCH January 23, 2014 Re: Commercial Real Estate Survey: 4th Quarter, 2013 Dear Reader,
Manhattan condo prices rose to
 Manhattan Market Report Q4 4 by the numbers +.8% StreetEasy Condo Price Index (QuarteroverQuarter) +.4% StreetEasy Condo Price Forecast (MonthoverMonth).7% Total (QuarteroverQuarter) +5.7% Number of Pending
Economic Indicators City of Oakland
 Economic Indicators City of Oakland PREPARED BY: THE OFFICE OF ECONOMIC AND WORKFORCE DEVELOPMENT CITY OF OAKLAND JULY 2014 CITY OF OAKLAND ECONOMIC INDICATORS 1 Introduction to Quarter 1, January March
Housing Indicators in Tennessee
 Housing Indicators in l l l By Joe Speer, Megan Morgeson, Bettie Teasley and Ceagus Clark Introduction Looking at general housing-related indicators across the state of, substantial variation emerges but
Q Quick Facts - 3.2% 0.0% %
 CAAR Market Report Includes the city of Charlottesville and the counties of Albemarle, Fluvanna, Greene, Louisa and Nelson. Home prices were consistently up again in most markets in 2018 but at reduced
HGAR HUDSON GATEWAY ASSOCIATION OF REALTORS, INC.
 HGAR HUDSON GATEWAY ASSOCIATION OF REALTORS, INC. HUDSON GATEWAY ASSOCIATION OF REALTORS, INC. 60 South Broadway, White Plains, New York 10601 914.681.0833 Fax 914.681.6044 www.hgar.com 9 Coates Drive,
Economic and Market Watch Report
 Economic and Market Watch Report 2nd Quarter, 2006 *Click on a County to view economic and real estate information at the county and zip code level 2006 Greater Las Vegas Association of REALTORS and NATIONAL
Planning and Development Department Building and Development Permit Summary Report
 Planning and Development Department 21 Building and Development Permit Summary Report February 22, 21 2 21 Building and Development Permit Summary Table of Contents Introduction... 3 Building Permits...