2015 First Quarter Market Report
|
|
|
- Tobias Stokes
- 5 years ago
- Views:
Transcription


1 2015 First Quarter Market Report CAAR Member Copy Expanded Edition Charlottesville Area First Quarter 2015 Highlights: Median sales price for the region was up 5.1% over Q1-2014, rising from $244,250 to $256,750. Sellers received 94% of original list price at sale, 2.7 points higher than the five-year average for the quarter. Closed sales remain consistent as new pending sales were up 18%, boding well for the spring market. Homes in the $300-$400K price range sold fastest, with half of the 80 homes in this segment selling in 34 days or less. Detached median sales price was up 8.2% year-over-year whereas the attached median sales price decreased by 6.5%. 1 of 10

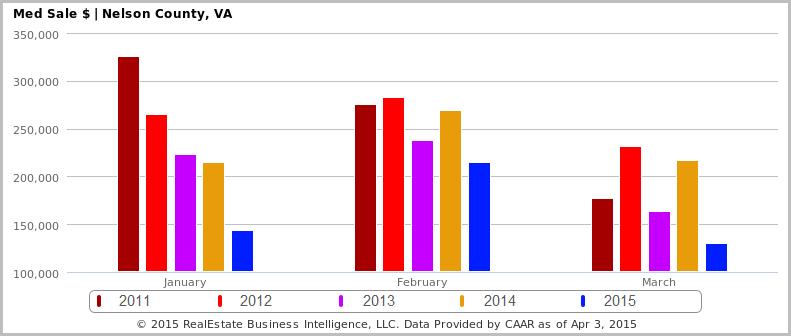
2 Sales Activity There were 493 homes sold in the 1 st Quarter in Greater Charlottesville, virtually unchanged from Q with only one additional closed sale. While the sales rate is even versus the same quarter last year, it is 4.3% higher than the five-year average for the quarter. The 106 attached homes sold (including condos and attached single family homes) is 3.9% higher in Q posted sales. Condos had the largest jump in sales, increasing from 34 last year to 48 in Q1-2015, a gain of 41.2%. The 387 detached homes sold represented a nominal 0.8% decrease (-3 sales) compared to Q There were notable shifts in the number of smaller homes purchased compared to larger home segments. Sales of homes with a living area of less than 1,200 square feet increased 27.5% versus Q (88 vs. 69 sales) while 3,000+ square foot home sales decreased 5.3% (90 vs. 95 sales). While these home size segments account for less than a fifth of the total sales respectively, diverging trends in these outer quantiles can have an outsized effect on the average (mean) sales price. This helps explain why, despite a 5.1% jump in the median sales price seen in Greater Charlottesville compared to Q1-2014, the average sales price dropped 8.9%. Further influencing this average/mean price decline, the 13 homes sold in the largest home segment analyzed (5,000+ sqft) had an average sales price of $1.1M in Q1-2015, down 29.4% compared to the average sales price of $1.6M for the 16 homes sold in Q The exaggerated impact that outlier segments can have on average/mean trends is why analysts tend to refer almost exclusively to shifts in the median when describing housing market trends. Nelson County, the most affordable county with a Q1 median sales price that was over $100,000 lower than that of the greater region, had the largest percent increase in sales (+27.1%). Conversely, in Albemarle County, the most expensive county with a Q1 median sales price nearly $75,000 higher than that of the region, closed sales were down a modest 3.4%. Fluvanna (-15.1%) had the largest percent decrease, with 14 fewer sales than Q Louisa s 48 sales were seven more than last year (+17.1%), while Charlottesville and Greene both saw modest sales gains of 5.1% and 2.3%, respectively. All told, Albemarle home sales accounted for just 39.8% of Greater Charlottesville s total sales, the lowest Q1 share for the county since Q Normal seasonal patterns suggest Albemarle s share should approach 50% in the second quarter and the Q2 median sales price for Greater Charlottesville should increase significantly from the Q1 level as well. 2 of 10


.")
3 Inventory While closed sales were level with the same period one year ago, the 929 new pending sales represent an 18% increase over Q Notably, the 399 new pending sales in March were the highest March-level since 2005, and exceeded the five-year March average of 318 new pendings by 25.5%. The 855 pendings at quarter s end is 25.2% higher than the total pendings headed into the 2 nd Quarter last year indicating a strong start to spring sales. Five of the six jurisdictions have over 20% more pending sales at quarter s end than last year, Charlottesville being the exception with 5.9% fewer pending sales. For the fourth consecutive quarter, Q1 seller activity exceeded the prior year s level. The 1,401 new listings added were 9.4% more than the 1,281 new listings added in Q Albemarle had the largest net gain with over 100 more listings added than last year, 726 versus 618 (+17.5%). Louisa s 116 new listings for the quarter represented the highest percent increase, gaining 34.9% over it s Q total. With 227 new listings, Charlottesville was the only other jurisdiction with more respective listings added, gaining 6.6%. Fluvanna saw the largest year-over-year decline in new listing activity for the quarter, dipping 11% to 145. Greene s 82 new listings were 7.9% down while Nelson saw 6.3% fewer listings with 105. Despite the momentum of new listings added to the market, active inventory headed into the 2 nd Quarter was 7.6% lower than the same point last year. With 1,915 active listings, 2015 marked the first time in nine years that supply headed into April dipped below the 2,000 listings. The 18% gain in new pending sales more than offset the 9.4% uptick in new listings. Using the average monthly sales pace over the last twelve months, the 1,915 active listings represent 9.0 months of supply. This is down from 9.7 months at this point in 2014 and two months lower than the five-year average of 10.9 months for this time of year. Our first quarter statistics remain consistent compared to previous years, which reconfirms the value appreciation when investing in real estate, said CAAR President, Anita Dunbar. Despite having limited homes available, our market home prices are holding strong and the demand is growing as indicated by the high percentage of pending sales. 3 of 10
 were on the market 10 days or less.")
 and condos (136 days).")
4 Days on Market (DOM) and Pricing The median DOM for Greater Charlottesville in the 1 st Quarter was 73 days, three days lower than Q and the lowest Q1-level since One in five homes sold during the quarter (20.9%) were on the market 10 days or less. Homes in the $300k-$400k price range sold fastest, with half of the 80 homes in this segment selling in 34 days or fewer. With a median DOM of 52 days, townhomes sold faster than detached homes (71 days) and condos (136 days). The average DOM for homes sold in the 1 st Quarter was 138 days, 12 days more than the Q level (126 days), but more than two weeks lower than the five-year Q1 average of 155 days. Homes sold fastest, based on median DOM levels, in Louisa (56 days) and Greene (59 days). Albemarle homes took nine days fewer to sell than last year, with a median DOM of 64 days. The city of Charlottesville was the other jurisdiction with a lower level than the region, but its 69-day median was 19 days higher than Q Fluvanna homes took more than a month longer than the rest of the region, though the county saw its median DOM fall by more than two weeks, from 122 to 106 days. Nelson s level more than doubled from Q1-2014, spiking to 185 days. With half of its 47 sales in the 1 st Quarter sitting on the market for over six months, it s not surprising that Nelson sellers received a significantly lower percentage of original asking price than the other jurisdictions in Greater Charlottesville. 4 of 10
 and 2.7 points above the five-year Q1 average (91.3%).")
 and Albemarle (95.")

5 Nelson sellers received 85.7% of the original list price in Q compared to 87.9% last year, eight points below the 94.0% mark for Greater Charlottesville. This regional level was 1.4 points higher than in Q (92.6%) and 2.7 points above the five-year Q1 average (91.3%). As demand improved, five of the six jurisdictions saw gains in their average sold price (SP) to original list price (OLP) ratio, led by a 3.3 point bump in Louisa. At 96.4%, the average SP to OLP ratio in Louisa was slightly higher than Charlottesville, which had an average ratio of 96%. Greene (95.9%) and Albemarle (95.3%) also had higher averages than the greater region. Fluvanna s 91.1% level was an improvement from Q1-2014, but nearly three points below the regional average. Nelson County had the most dramatic statistics from this first quarter. Although it had a 27.1% increase in total sales, the jurisdiction showed a dramatic drop in median sales price and doubled its days on the market from Q1-2014, said CAAR President-Elect, Donna Patton. Home Prices At $256,750, the 1 st Quarter median sales price in Greater Charlottesville reached the highest Q1-level since It was 5.1% higher than Q and shows a 12.9% appreciation over Q when prices bottomed out at $227,500. Detached homes saw the highest year-over-year price gains, increasing 8.2% to $277,750. The $204,500 median price for the attached segment (which includes both single family homes and condos) represented a 6.5% decrease from Q of 10
 and Greene ($205,000) saw modest gains, up 3.8% and 1.3%, respectively. Charlottesville ($275,100) and Fluvanna ($174,750) only saw modest declines of 1.8% and 3.6%.")
6 Half of the jurisdictions saw year-over-year gains in median sales price in the 1 st Quarter. Louisa ($211,500) led the region in price gains with a 23.6% increase. Albemarle ($330,000) and Greene ($205,000) saw modest gains, up 3.8% and 1.3%, respectively. Charlottesville ($275,100) and Fluvanna ($174,750) only saw modest declines of 1.8% and 3.6%. Nelson ($147,000) was the only county to see a significant drop, falling 33.2% from Q of 10
7 7 of 10
8 Attached vs. Detached Homes Prices in the detached housing segment outperformed the attached segment in Greater Charlottesville in the 1 st Quarter. The median sales price for detached homes was up 8.2% from Q to $277,750. This represented the highest Q1- level since The $204,500 median sales price for attached homes was 6.5% less than Q1-2014, primarily due to the increased share that condos accounted for this quarter. Condo properties, which had a median sales price of $139,000, accounted for 45% of attached homes sold, while the higher priced townhome segment (median sales price of $243,500) made up 55% of attached sales. This is a significant shift compared to Q1-2014, when condos accounted for only 33% of all attached sales. There was a 3.9% increase in attached sales, with four more than Q This despite the fact that townhome sales dropped 14.7%, or ten sales, to a total of 58 for the quarter. The 41.2% spike in condos, with 48 1 st Quarter sales compared to 34 in Q1-2014, kept the attached segment tally above last year s level. Detached home sales were flat with only three fewer sales than last year. Townhomes continue to sell faster than detached homes and condos, with a median DOM of 52 days. Half the condos sold were on the market for 136 days or longer, the highest median DOM for this segment since the 1 st quarter of Detached homes had a median of 71 days, seven days lower than Q RBI Key Housing Trend Metrics Charlottesville Area Association of REALTORS All Residential Q1-15 % Q-O-Q Q4-14 % Y-O-Y Q1-14 % Y-O-2Y Q1-13 % Y-O-3Y Q1-12 Average Sales Price $306, % $336, % $332, % $276, % $280,244 Median Sales Price $256, % $259, % $244, % $227, % $230,000 Units Sold (Closed) % % % % 463 Average DOM (Closed) % % % % 167 Listing Discount (Average) 6.0% 6.5% 7.4% 9.1% 10.3% Avg SP to OLP Ratio 94.0% 93.5% 92.6% 91.0% 89.7% Avg SP/Sq Ft $ % $ % $ % $ % $126 Detached Q1-15 % Q-O-Q Q4-14 % Y-O-Y Q1-14 % Y-O-2Y Q1-13 % Y-O-3Y Q1-12 Average Sales Price $328, % $363, % $353, % $298, % $302,614 Median Sales Price $277, % $273, % $256, % $244, % $247,000 Units Sold (Closed) % % % % 352 Average DOM (Closed) % % % % 167 Listing Discount (Average) 5.6% 6.4% 8.1% 9.4% 11.1% Avg SP to OLP Ratio 94.4% 93.6% 91.9% 90.6% 88.9% Avg SP/Sq Ft $ % $ % $ % $ % $121 Attached Q1-15 % Q-O-Q Q4-14 % Y-O-Y Q1-14 % Y-O-2Y Q1-13 % Y-O-3Y Q1-12 Average Sales Price $225, % $238, % $250, % $196, % $209,304 Median Sales Price $204, % $213, % $218, % $183, % $193,000 Units Sold (Closed) % % % % 111 Average DOM (Closed) % % % % 166 Listing Discount (Average) 7.3% 7.1% 4.8% 7.8% 7.5% Avg SP to OLP Ratio 92.7% 93.0% 95.3% 92.2% 92.5% Avg SP/Sq Ft $ % $ % $ % $ % $141 Distressed Inventory Only 46 of the 493 sales in the 1 st Quarter, or 9.3%, were foreclosures. This represents 17 fewer foreclosure sales versus Q1-2014, when foreclosures accounted for 12.8% of sales. This was the fifth consecutive quarter with fewer foreclosure sales than the previous year and the ninth quarter in the last ten quarters. Short sales continue to be a virtual non-factor 8 of 10
9 in Greater Charlottesville, accounting for only 3.4% of all sales. The 17 short sales were three less than Q1-2014, when short sales accounted for 4.1% of sales. The median sales price for foreclosures was $115,000, down 7.3% from last year. The median sales price for short sales was $197,250, a gain of 6.9%. The 430 non-distressed sales were 5.1% more than the 409 in Q and their median sales price of $276,000 represented a 1.5% year-over-year increase. The 1,401 listings added during the 1 st Quarter represented a 9.4% increase from last year s total. However, the 76 distressed listings added during the quarter represented an 8.4% decrease from the number listed during the same quarter last year. There were 63 foreclosed properties listed, slightly more than the 60 added in Q There were only 14 new short sale listings, down from 23. The 1,325 non-distressed listings added represented a 10.6% increase from Q Distressed listings accounted for only 5.5% of new listings, down from 6.5% of new listings in Q Land/Acreage Sales There were 63 land/acreage sales in Greater Charlottesville in the 1 st Quarter, down 35.1% from Q and the lowest 1 st Quarter tally since With 35 sales, the <5 acre segment saw the largest decrease, with 22 fewer sales than Q Land sales in the 5-25 acre segment also declined, from 26 sales in Q to 18 sales in Q There were ten sales in the >25 acre segment, three fewer than the same quarter last year. 9 of 10

10 Land sales were down in all six jurisdictions, with the biggest decrease in Albemarle, where land sales dropped from 42 in Q to 25 this quarter. Nelson had the next highest land sales total at 13, though this was down from 16 last year. Fluvanna had 11 land sales, five fewer than last year. The four land sales in Greene were down from seven last year, though the three of the four sales were for 5 acres or more. Land sales in Louisa fell from 13 to nine, though there was a >25 acre sale this quarter. There was only one land sale in Charlottesville in the 1 st Quarter, down from three last year. 10 of 10
nd Quarter Market Report
 2015 2 nd Quarter Market Report The voice of real estate in Central Virginia CAAR Member Copy Expanded Edition Charlottesville Area 2 nd Quarter 2015 Highlights: Closed sales in the Greater Charlottesville
See Full Corridor Study Volumes I and II as separate attachments.
 See Full Corridor Study Volumes I and II as separate attachments. See Housing Values 2000-2010 and 2000-2013 as separate attachments. 2013 2 nd Quarter and Mid-Year Market Report The voice of real estate
2013 Year-End Market Report
 2013 Year-End Market Report The voice of real estate in Central Virginia CAAR Member Copy Expanded Edition Charlottesville Area Year-End 2013 Highlights: Yearly home sales in Greater Charlottesville were
May 2016 Loudoun County Market Trends Report Homes selling twice as fast as 2015 with re-emergence of seller s market
 FOR IMMEDIATE RELEASE Contact: Christine Windle 703-777-2468 Dulles Area Association of REALTORS cwindle@dullesarea.com Sponsored by: Access National Bank Tom Ciolkosz, (703) 871-1045, tciolkosz@accessnationalbank.com
rd Quarter Market Report
 2012 3 rd Quarter Market Report The voice of real estate in Central Virginia CAAR Member Copy Expanded Edition Charlottesville Area 3 rd Quarter 2012 Highlights: Overall sales in Greater Charlottesville
FOR IMMEDIATE RELEASE Contact: Brenda Morton Dulles Area Association of REALTORS
 FOR IMMEDIATE RELEASE Contact: Brenda Morton 703 777 2468 Dulles Area Association of REALTORS bmorton@dullesarea.com August 2018 Loudoun County Market Trends Report Despite persistent low inventory, sales
February 2016 Loudoun County Market Trends Report Contracts and sales activity jump double-digits; Inventories down 15.5 percent
 FOR IMMEDIATE RELEASE Contact: Christine Windle 703-777-2468, cwindle@dullesarea.com Sponsored by: Access National Bank Tom Ciolkosz, (703) 871-1045, tciolkosz@accessnationalbank.com Patty Foster, 703-871-1014,
August 2017 Loudoun County Market Trends Report Sales Price Reaches Record High; Sales Decline; Inventory Remains Low
 FOR IMMEDIATE RELEASE Contact: Christine Windle 703 777 2468 Dulles Area Association of REALTORS cwindle@dullesarea.com August 2017 Loudoun County Market Trends Report Sales Price Reaches Record High;
FOR IMMEDIATE RELEASE Contact: Bobette Banks Director of Communications Greater Capital Area Association of REALTORS
 FOR IMMEDIATE RELEASE Contact: Bobette Banks 301-590-8764 Director of Communications Greater Capital Area Association of REALTORS bbanks@gcaar.com November 2015 Washington, DC Market Trends Report Median
August 2015 Washington, DC Market Trends Report Limited supply, high demand continue pushing prices to record highs
 FOR IMMEDIATE RELEASE Contact: Bobette Banks 301-590-8764 Director of Communications Greater Capital Area Association of REALTORS bbanks@gcaar.com August 2015 Washington, DC Market Trends Report Limited
November 2017 Loudoun County Market Trends Report Inventory decline persists as total and new listings are down; Sales growth continues to drop
 FOR IMMEDIATE RELEASE Contact: Brenda Morton 703 777 2468 Dulles Area Association of REALTORS bmorton@dullesarea.com November 2017 Loudoun County Market Trends Report Inventory decline persists as total
FOR IMMEDIATE RELEASE Contact: Brenda Morton Dulles Area Association of REALTORS
 FOR IMMEDIATE RELEASE Contact: Brenda Morton 703 777 2468 Dulles Area Association of REALTORS bmorton@dullesarea.com February 2018 Loudoun County Market Trends Report Inventory reaches yet another record
January 2018 Loudoun County Market Trends Report Inventory has another record low month; home sales continue to decline compared to last year.
 FOR IMMEDIATE RELEASE Contact: Brenda Morton 703 777 2468 Dulles Area Association of REALTORS bmorton@dullesarea.com January 2018 Loudoun County Market Trends Report Inventory has another record low month;
May 2018 Loudoun County Market Trends Report Tight inventory continues while price growth stagnates; Condo sales hit a record high.
 FOR IMMEDIATE RELEASE Contact: Brenda Morton 703 777 2468 Dulles Area Association of REALTORS bmorton@dullesarea.com May 2018 Loudoun County Market Trends Report Tight inventory continues while price growth
FOR IMMEDIATE RELEASE Contact: Bobette Banks Director of Communications Greater Capital Area Association of REALTORS
 FOR IMMEDIATE RELEASE Contact: Bobette Banks 301-590-8764 Director of Communications Greater Capital Area Association of REALTORS bbanks@gcaar.com April 2016 Washington, DC Market Trends Report Sales and
May 2016 Washington, DC Market Trends Report Listings continue to move quickly as sales climb nearly 14 percent
 FOR IMMEDIATE RELEASE Contact: Bobette Banks 301-590-8764 Director of Communications Greater Capital Area Association of REALTORS bbanks@gcaar.com May 2016 Washington, DC Market Trends Report Listings
March 2016 Washington, DC Market Trends Report March sales represent a 12 percent increase; top the five-year March average
 FOR IMMEDIATE RELEASE Contact: Bobette Banks 301-590-8764 Director of Communications Greater Capital Area Association of REALTORS bbanks@gcaar.com March 2016 Washington, DC Market Trends Report March sales
September 2018 Loudoun County Market Trends Report Inventory continues to tighten as prices increase and closed sales decline
 FOR IMMEDIATE RELEASE Contact: Brenda Morton 703 777 2468 Dulles Area Association of REALTORS bmorton@dullesarea.com September 2018 Loudoun County Market Trends Report Inventory continues to tighten as
May 2016 Montgomery County Market Trends Report Double-digit gains in closed sales, exceeding the five-year May average
 FOR IMMEDIATE RELEASE Contact: Bobette Banks 301-590-8764 Director of Communications Greater Capital Area Association of REALTORS bbanks@gcaar.com May 2016 Montgomery County Market Trends Report Double-digit
July 2016 Washington, DC Market Trends Report July home prices remain at record highs in the District
 FOR IMMEDIATE RELEASE Contact: Bobette Banks 301-590-8764 Director of Communications Greater Capital Area Association of REALTORS bbanks@gcaar.com July 2016 Washington, DC Market Trends Report July home
November 2018 Montgomery County Market Trends Report Median sales price reaches highest November level in 10 years
 FOR IMMEDIATE RELEASE Contact: Bobette Banks 301-590-8764 Director of Communications Greater Capital Area Association of REALTORS bbanks@gcaar.com November 2018 Montgomery County Market Trends Report Median
Single Family Sales Maine: Units
 Maine Home Connection 19 Commercial St Portland, Maine 04101 MaineHomeConnection.com Office: (207) 517-3100 Email: Info@MaineHomeConnection.com For the fourth consecutive year, Maine home sales set a new
June 2017 Montgomery County Market Trends Report Median sales price up 1.1 percent highest for June since 2008
 FOR IMMEDIATE RELEASE Contact: Bobette Banks 301-590-8764 Director of Communications Greater Capital Area Association of REALTORS bbanks@gcaar.com June 2017 Montgomery County Market Trends Report Median
November 2017 Montgomery County Market Trends Report Median sales price up slightly as median days on market quickens
 FOR IMMEDIATE RELEASE Contact: Bobette Banks 301-590-8764 Director of Communications Greater Capital Area Association of REALTORS bbanks@gcaar.com November 2017 Montgomery County Market Trends Report Median
May 2017 Montgomery County Market Trends Report Median sales price increases 5.8 percent; active listings drop 11.8 percent
 FOR IMMEDIATE RELEASE Contact: Bobette Banks 301-590-8764 Director of Communications Greater Capital Area Association of REALTORS bbanks@gcaar.com May 2017 Montgomery County Market Trends Report Median
February 2018 Montgomery County Market Trends Report Closed sales dip while median sales price reaches highest February mark since 2007
 FOR IMMEDIATE RELEASE Contact: Bobette Banks 301-590-8764 Director of Communications Greater Capital Area Association of REALTORS bbanks@gcaar.com February 2018 Montgomery County Market Trends Report Closed
September 2017 Washington, DC Market Trends Report September median sales price drops 6.4 percent but still near record high
 FOR IMMEDIATE RELEASE Contact: Bobette Banks 301-590-8764 Director of Communications Greater Capital Area Association of REALTORS bbanks@gcaar.com September 2017 Washington, DC Market Trends Report September
June 2018 Montgomery County Market Trends Report Median sales price reaches highest June level on record
 FOR IMMEDIATE RELEASE Contact: Bobette Banks 301-590-8764 Director of Communications Greater Capital Area Association of REALTORS bbanks@gcaar.com June 2018 Montgomery County Market Trends Report Median
September 2017 Montgomery County Market Trends Report Median sales price highest since September 2007
 FOR IMMEDIATE RELEASE Contact: Bobette Banks 301-590-8764 Director of Communications Greater Capital Area Association of REALTORS bbanks@gcaar.com September 2017 Montgomery County Market Trends Report
December 2018 Montgomery County Market Trends Report Median sales rise slightly from 2017; Active listings increase 5.1 percent
 FOR IMMEDIATE RELEASE Contact: Bobette Banks 301-590-8764 Director of Communications Greater Capital Area Association of REALTORS bbanks@gcaar.com December 2018 Montgomery County Market Trends Report Median
CAAR Market Report 2010 First Quarter Published by the Charlottesville Area Association of REALTORS
 CAAR Market Report 2010 First Quarter Published by the Charlottesville Area Association of REALTORS Where Are We Now? In the first quarter of 2010, the Charlottesville real estate market continued the
January 2019 Montgomery County Market Trends Report Average sales and new listings increase; closed sales decline
 FOR IMMEDIATE RELEASE Contact: Bobette Banks 301-590-8764 Director of Communications Greater Capital Area Association of REALTORS bbanks@gcaar.com January 2019 Montgomery County Market Trends Report Average
January 2018 Washington, DC Market Trends Report Closed sales reach highest January level since 2005
 FOR IMMEDIATE RELEASE Contact: Bobette Banks 301-590-8764 Director of Communications Greater Capital Area Association of REALTORS bbanks@gcaar.com January 2018 Washington, DC Market Trends Report Closed
CAAR Market Report 2010 Mid-Year Published by the Charlottesville Area Association of REALTORS
 CAAR Market Report 2010 Mid-Year Published by the Charlottesville Area Association of REALTORS Where Are We Now? The pace of home purchases in the Charlottesville market area showed a significant increase
March 2018 Montgomery County Market Trends Report Median sales price reaches highest March level on record; days-on-market down from 2017
 FOR IMMEDIATE RELEASE Contact: Bobette Banks 301-590-8764 Director of Communications Greater Capital Area Association of REALTORS bbanks@gcaar.com March 2018 Montgomery County Market Trends Report Median
2007 Sales (thru September)
") Third Quarter Market Report Challenges, Opportunities, and Surprises, Oh My! By Dave Phillips, CEO Charlottesville Area Association of REALTORS Someone named Anonymous once said, "Many an opportunity is
Third Quarter Market Report Challenges, Opportunities, and Surprises, Oh My! By Dave Phillips, CEO Charlottesville Area Association of REALTORS Someone named Anonymous once said, "Many an opportunity is
1Q18 TOWN OF PALM BEACH & BARRIER ISLANDS The Corcoran Report
 1Q18 TOWN OF PALM BEACH & BARRIER ISLANDS The Corcoran Report 353 El Brillo Way web# 5339190 on corcoran.com Town of Palm Beach $6.425M $4.075M 46 +31% -1% +8% $1.018M 125-15% +18% $540K +46% 1Q18 Corcoran
Q Quick Facts - 3.2% 0.0% %
 CAAR Market Report Includes the city of Charlottesville and the counties of Albemarle, Fluvanna, Greene, Louisa and Nelson. Home prices were consistently up again in most markets in 2018 but at reduced
November 2017 Washington, DC Market Trends Report Median sales price ties last year for highest November level on record
 FOR IMMEDIATE RELEASE Contact: Bobette Banks 301-590-8764 Director of Communications Greater Capital Area Association of REALTORS bbanks@gcaar.com November 2017 Washington, DC Market Trends Report Median
Year to Date (thru June)
") CAAR Market Report 2009 Mid-Year Published by the Charlottesville Area Association of REALTORS Where Are We Now? The pace of home purchases in the Charlottesville area continues to improve from the dismal
CAAR Market Report 2009 Mid-Year Published by the Charlottesville Area Association of REALTORS Where Are We Now? The pace of home purchases in the Charlottesville area continues to improve from the dismal
March 2018 Washington, DC Market Trends Report Median sales price reaches highest March level on record
 FOR IMMEDIATE RELEASE Contact: Bryan Frantz 301-590-8765 Communications Specialist District of Columbia Association of REALTORS bfrantz@dcrealtors.org March 2018 Washington, DC Market Trends Report Median
June 2018 Washington, DC Market Trends Report Median sales price reaches highest June level on record
 FOR IMMEDIATE RELEASE Contact: Bobette Banks 301-590-8764 Director of Communications Greater Capital Area Association of REALTORS bbanks@gcaar.com June 2018 Washington, DC Market Trends Report Median sales
April 2018 Washington, DC Market Trends Report Home sales up 9.4 percent; median sales price reaches highest April on record
 N FOR IMMEDIATE RELEASE Contact: Bobette Banks 301-590-8764 Director of Communications Greater Capital Area Association of REALTORS bbanks@gcaar.com April 2018 Washington, DC Market Trends Report Home
The Corcoran Report 4Q16 MANHATTAN
 The Corcoran Report 4Q16 MANHATTAN Contents Fourth Quarter 2016 4/7 12/23 3 Overview 8 9 10 Market Wide 11 Luxury 24 2 Sales / Days on Market 3 Inventory / Months of Supply 4 5 Market Share Resale Co-ops
The Corcoran Report 3Q17 MANHATTAN
 The Corcoran Report 3Q17 MANHATTAN Contents Third Quarter 2017 4/7 12/23 3 Overview 8 9 10 Market Wide 11 Luxury 24 4 Sales / Days on Market 5 Inventory / Months of Supply 6 7 Market Share Resale Co-ops
MARKET AREA UPDATE Report as of: 1Q 2Q 3Q 4Q
 MARKET AREA UPDATE Report as of: 1Q 2Q 3Q 4Q Year: 2013 Market Area (City, State): Washington DC Metropolitan Area Provided by (Company / Companies): LONG & FOSTER REAL ESTATE, INC. What are the most significant
Charlottesville Housing Market Report Year-End (Published by the Charlottesville Area Association of REALTORS )
") Charlottesville Housing Market Report - 2009 Year-End (Published by the Charlottesville Area Association of REALTORS ) This Quarterly Market Report is produced by the Charlottesville Area Association of
Charlottesville Housing Market Report - 2009 Year-End (Published by the Charlottesville Area Association of REALTORS ) This Quarterly Market Report is produced by the Charlottesville Area Association of
May 2018 Washington, DC Market Trends Report Sales at record high for May while supply remains scarce
 FOR IMMEDIATE RELEASE Contact: Bryan Frantz 202-626-0097 Communications Specialist District of Columbia Association of REALTORS bfrantz@dcrealtors.org May 2018 Washington, DC Market Trends Report Sales
January 2017 Washington, DC Market Trends Report Median Sales Price Up 4.6 percent Reaches Highest January Level on Record
 FOR IMMEDIATE RELEASE Contact: Bobette Banks 301-590-8764 Director of Communications Greater Capital Area Association of REALTORS bbanks@gcaar.com January 2017 Washington, DC Market Trends Report Median
RESIDENTIAL MARKET ANALYSIS
 RESIDENTIAL MARKET ANALYSIS CLANCY TERRY RMLS Student Fellow Master of Real Estate Development Candidate Oregon and national housing markets both demonstrated shifting trends in the first quarter of 2015
2008 Mid-Year CAAR Market Report Real Estate Market is as Hot as ANWR
 2008 Mid-Year CAAR Market Report Real Estate Market is as Hot as ANWR By Dave Phillips, CEO Charlottesville Area Association of REALTORS Just about everything in life is relative to your perspective. Based
1Q18 MANHATTAN The Corcoran Report
 1Q18 MANHATTAN The Corcoran Report Contents First Quarter 2018 3 Overview 4/7 Market Wide 8 9 10 12/23 24 4 Sales / Days on Market 5 Inventory / Months of Supply 6 Prices 7 Market Share Resale Co-ops Resale
CITI HABITATS. Manhattan Residential Sales Market Report
 Manhattan Residential Sales Market Report Contents 4/7 12/17 3 8 9 10 Market Wide 4 Sales / Days on Market 5 / Months of Supply 6 7 Market Share Resale Co-ops Resale Condos New Developments 11 Luxury Neighborhoods
The Desert Housing Report. Coachella Valley Median Detached Home Price December December 2018
 Median Price $450,000 $400,000 Coachella Valley Median Detached Home Price December 2002 - $369,450 $389,944 $350,000 $300,000 $250,000 $200,000 $150,000 CV Detached Median Price 4% Growth Curve Summary
Washington, D.C. Metro Area December 2017 Housing Market Update
 Washington, D.C. Metro Area December 2017 Housing Market Update Washington D.C. Metro housing market closes out 2017 with record high December house price of $420,050; December inventories decline for
Coachella Valley Median Detached Home Price Jan Jan 2017
 The Desert Housing Report Median Price $450,000 Coachella Valley Median Detached Home Price Jan 2002 - Jan 2017 $400,000 $350,000 $300,000 $250,000 $335,000 $340,000 $200,000 $150,000 CV Detached Median
CAAR Market Report. Greater Charlottesville Area. Q Quick Facts + 3.5% + 8.0% %
 CAAR Market Report Includes the city of Charlottesville and the counties of Albemarle, Fluvanna, Greene, Louisa and Nelson. Quick Facts + 3.5% + 8.0% We can comfortably consider the first quarter to have
MARKET AREA UPDATE Report as of: 1Q 2Q 3Q 4Q
 MARKET AREA UPDATE Report as of: 1Q 2Q 3Q 4Q Year: 2014 Market Area (City, State): Washington DC Metropolitan Area Provided by (Company / Companies): LONG & FOSTER REAL ESTATE, INC. What are the most significant
The Corcoran Report 4Q17 TOWN OF PALM BEACH & BARRIER ISLANDS
 The Corcoran Report 4Q17 TOWN OF PALM BEACH & BARRIER ISLANDS Town of Palm Beach 19 $8.379M $5.717M 19% 102% 92% 52 $607K $364K -7% WEB# 5301358 on corcoran.com 14% 2017 4Q Corcoran Report Palm Beach In
FOR IMMEDIATE RELEASE Contact: Bobette Banks Director of Communications Greater Capital Area Association of REALTORS
 FOR IMMEDIATE RELEASE Contact: Bobette Banks 301-590-8764 Director of Communications Greater Capital Area Association of REALTORS bbanks@gcaar.com December 2018 Washington, DC Market Trends Report DC closes
November 2018 Washington, DC Market Trends Report Median sales price highest November level in past 10 years
 FOR IMMEDIATE RELEASE Contact: Bryan Frantz 202.626.0097 Communications Specialist District of Columbia Association of REALTORS bfrantz@dcrealtors.org November 2018 Washington, DC Market Trends Report
Peter Comitini Senior VP Associate Broker The Corcoran Group
 Sutton Area TriBeCa Upper East Side Upper West Side Washington Heights West Village Battery Park City Beekman Carnegie Hill Central Park South Chelsea Flatiron Clinton East Harlem East Village Financial
California Housing Market Update. Monthly Sales and Price Statistics January 2018
 California Housing Market Update Monthly Sales and Price Statistics January 2018 Sales Started with a Slight Decrease California, Jan. 2018 Sales: 388,800 Units, -2.9% YTD, -2.9% YTY 700,000 600,000 500,000
MARKET AREA UPDATE Report as of: 1Q 2Q 3Q 4Q
 Year: 2013 Market Area (City, State): Baltimore Metropolitan Area MARKET AREA UPDATE Report as of: 1Q 2Q 3Q 4Q Provided by (Company / Companies): LONG & FOSTER REAL ESTATE, INC. What are the most significant
Housing Indicators in Tennessee
 Housing Indicators in l l l By Joe Speer, Megan Morgeson, Bettie Teasley and Ceagus Clark Introduction Looking at general housing-related indicators across the state of, substantial variation emerges but
INTRODUCTION SUMMER SLIDE
 3 Q 2 0 1 8 M A NH AT TA N M A R K E T R E P O R T INTRODUCTION M A N H A T T A N S A L E S R E P O R T Q 3 2 0 1 8 : SUMMER SLIDE It s common knowledge that Manhattan property sales typically take a dip
ANALYSIS OF THE CENTRAL VIRGINIA AREA HOUSING MARKET 1st quarter 2013 By Lisa A. Sturtevant, PhD George Mason University Center for Regional Analysis
 ANALYSIS OF THE CENTRAL VIRGINIA AREA HOUSING MARKET 1st quarter By Lisa A. Sturtevant, PhD George Mason University Center for Regional Analysis Economic Overview Key economic factors in the first quarter
California Housing Market Update. Monthly Sales and Price Statistics October 2018
 California Housing Market Update Monthly Sales and Price Statistics October 2018 Sales Had the 2 nd Largest Drop in the Last 6 Months California, October 2018 Sales: 397,060 Units, -3.7% YTD, -7.9% YTY
ECONOMIC CURRENTS. Vol. 4, Issue 3. THE Introduction SOUTH FLORIDA ECONOMIC QUARTERLY
 ECONOMIC CURRENTS THE Introduction SOUTH FLORIDA ECONOMIC QUARTERLY Vol. 4, Issue 3 Economic Currents provides an overview of the South Florida regional economy. The report presents current employment,
HOUSING REPORT WASHTENAW SEPTEMBER 2018
 WASHTENAW SEPTEMBER 2018 Washtenaw County Recovery Run How Much Longer? This month marks the 10-year anniversary of the market peak prior to the burst of the housing bubble. The nationwide median home
The Market Watch Monthly Housing Report. Coachella Valley Median Detached Home Price Dec Dec 2016
 The Market Watch Monthly Housing Report Median Price $450,000 Coachella Valley Median Detached Home Price Dec 2002 - Dec 2016 $400,000 $350,000 $300,000 $339,930 $340,000 $250,000 $200,000 $150,000 CV
California Housing Market Update. Monthly Sales and Price Statistics December 2018
 California Housing Market Update Monthly Sales and Price Statistics December 2018 Sales Reached the Lowest Level since Jan 2015 California, December 2018 Sales: 372,260 Units, -5.2% YTD, -11.6% YTY 700,000
FOR IMMEDIATE RELEASE Contact: David B. Bennett President & CEO Phone:
 FOR IMMEDIATE RELEASE Contact: David B. Bennett President & CEO Phone: 727-216-32 Email: dbennett@tampabayrealtor.com Real Estate Statistics for September 217 September s numbers are out, and it comes
Property Barometer Q2 2012
 Property Barometer Q2 2012 Measuring the Property Market Analysis by Annette Hughes, DKM Economic Consultants Contents 3 Introduction + Highlights 4 Market analysis 8 County by County Analysis: Market
MONTGOMERY COUNTY JULY 2018
 STATPAK MONTGOMERY COUNTY JULY 2018 McEnearney.com MARKET IN A MINUTE A SUMMARY OF MARKET CONDITIONS FOR JUNE & FIRST HALF 2018 Contract activity in June 2018 was up 1.2% from June 2017, solely because
Q B O S T O N M A R K E T R E P O R T
 Q 3 2 1 7 B O S T O N M A R K E T R E P O R T Introducing the Compass Q3 217 Greater Boston Market Report Page 2 Page 3 Page 5 Page 7 Page 8 Map of Coverage Area Single Family Overview Condo Overview Time
Austin-area home prices set August record, outpace household income growth in August 2015
 Austin-area home prices set August record, outpace household income growth in August 2015 Market Reports Austin Board of REALTORS releases real estate statistics for August 2015 AUSTIN, Texas September
STATPAK MARKET IN A MINUTE A SUMMARY OF MARKET CONDITIONS FOR FEBRUARY McEnearney.com CONTRACTS URGENCY INDEX INVENTORY INTEREST RATES
 STATPAK LOUDOUN COUNTY MARCH 2018 McEnearney.com MARKET IN A MINUTE A SUMMARY OF MARKET CONDITIONS FOR FEBRUARY 2018 Contract activity in February 2018 was almost unchanged, up just 0.2% from February
st Quarter Market Report A Recipe That s Hard to Swallow
 2008 1 st Quarter Market Report A Recipe That s Hard to Swallow By Dave Phillips, CEO Charlottesville Area Association of REALTORS Have you ever stood in your kitchen, felt a creative surge and decided
Housing Supply Overview
 Housing Supply Overview A Research Tool Provided by the Greater San Diego Association of REALTORS December 2017 Quick Facts + 18.1% + 2.1% - 2.3% Inventory was again a driving metric in residential real
MARKET IN A MINUTE A SUMMARY OF MARKET CONDITIONS FOR MARCH & 1st QUARTER 2016
 STATPAK ` WASHINGTON, DC APRIL 2016 MARKET IN A MINUTE A SUMMARY OF MARKET CONDITIONS FOR MARCH & 1st QUARTER 2016 Contract activity in March 2016 was up 12.6% from March of 2015, and there were increases
RESIDENTIAL MARKET ANALYSIS
 RESIDENTIAL MARKET ANALYSIS EVAN ABRAMOWITZ RMLS Student Fellow Master of Real Estate Development Graduate Student September existing-home sales declined modestly, but inventory continued to tighten and
MARKET IN A MINUTE A SUMMARY OF MARKET CONDITIONS FOR SEPTEMBER & 3rd QUARTER 2017
 STATPAK LOUDOUN COUNTY OCTOBER 2017 McEnearney.com MARKET IN A MINUTE A SUMMARY OF MARKET CONDITIONS FOR SEPTEMBER & 3rd QUARTER 2017 Contract activity in September 2017 was up just 0.6% from September
The Coldwell Banker Carlson Real Estate Market Report
 The Coldwell Banker Carlson Real Estate Market Report 2017 Year-End Stowe Area Report Our 2017 Year-End Market Report uses market-wide data, based on transactions that closed in 2017 in the Multiple Listing
ECONOMIC CURRENTS. Vol. 3, Issue 1. THE SOUTH FLORIDA ECONOMIC QUARTERLY Introduction
 ECONOMIC CURRENTS THE SOUTH FLORIDA ECONOMIC QUARTERLY Introduction Economic Currents provides an overview of the South Florida regional economy. The report contains current employment, economic and real
FOR IMMEDIATE RELEASE Contact: David B. Bennett President & CEO Phone:
 FOR IMMEDIATE RELEASE Contact: David B. Bennett President & CEO Phone: 727-216-32 Email: dbennett@tampabayrealtor.com Real Estate Statistics for December 217 wrapped up a sizzling 217 with a steady month
Q Quick Facts + 7.5% + 1.6% - 8.6%
 CAAR Market Report Includes the city of Charlottesville and the counties of Albemarle, Fluvanna, Greene, Louisa and Nelson. Quick Facts + 7.5% + 1.6% Housing markets across the nation are most assuredly
New York City Market Update First Quarter sothebyshomes.com/nyc
 New York City Market Update First Quarter 217 MANHATTAN BROKERAGES Downtown 149 Fifth Avenue, 4 th Floor t: 212.431.244 East Side 38 East 61 st Street t: 212.66.766 West Side 2244 Broadway t: 212.579.93
MARCH 2019 Harrisonburg & Rockingham County Real Estate Market Report
 MARCH 219 Real Estate Market Report An analysis of real estate activity through February 28, 219 provided courtesy of Scott P. Rogers, Funkhouser Real Estate Group Spacious Four Bedroom Brick Colonial
Baltimore, MD Metro Area September 2017 Housing Market Update
 Baltimore, MD Metro Area September 2017 Housing Market Update Baltimore Metro median sales price of $253,000 is near September record; Active inventories decline by 11.4% to lowest September level of the
Morningside Heights Harlem. Peter Comitini Senior VP Associate Broker The Corcoran Group
 Sutton Area TriBeCa Upper East Side Upper West Side Washington Heights West Village The Corcoran Report Battery Park City Beekman Carnegie Hill Central Park South Chelsea Flatiron Clinton East Harlem East
Prescott Area Association of REALTORS
 MARKET DATA REPORT Prescott Area Association of REALTORS Provided for the month of (928) 445-2663 3719 Karicio Lane Prescott, AZ 86303 Listings Trends The key metrics for residential inventory (single-family
2013 Arizona Housing Market Mid-Year Report
 2013 Arizona Housing Market Mid-Year Report This mid-year market report outlines the latest trends in Arizona real estate. The housing market hit bottom in mid to late 2011, and has been in recovery mode
The Desert Housing Report. Coachella Valley Median Detached Home Price March March 2019 $392,000 $415,000
 Median Price $450,000 $400,000 $350,000 $300,000 $250,000 $200,000 $150,000 Coachella Valley Median Detached Home Price March 2002 - $392,000 $415,000 CV Detached Median Price Summary 4% Growth Curve The
Leasing cools, but deal flow consistent
 MARKETVIEW Downtown Manhattan Office, Q3 216 Leasing cools, but deal flow consistent Leasing Activity.85 MSF Net Absorption (.12) MSF Availability Rate 11.7 Vacancy Rate 9.3 Average Asking Rent $57.5 PSF
FEBRUARY 2019 Harrisonburg & Rockingham County Real Estate Market Report
 FEBRUARY 219 Real Estate Market Report An analysis of real estate activity through January 31, 219 provided courtesy of Scott P. Rogers, Funkhouser Real Estate Group Immaculate Brick Highland Park Colonial
Fourth Quarter 2018 Market Report Manhattan Residential
 Market Report Manhattan Residential Data Highlights Cover Property: Halstead.com WEB# 19041474 A pickup in luxury new development closings pushed the average price higher than a year ago. The median apartment
MONTGOMERY COUNTY APRIL 2018
 STATPAK MONTGOMERY COUNTY APRIL 2018 McEnearney.com MARKET IN A MINUTE A SUMMARY OF MARKET CONDITIONS FOR MARCH 2018 Contract activity in March 2018 was down 6.0% from March 2017, and there were decreases
Monthly Indicators. August Quick Facts + 7.0% + 7.3% %
 Monthly Indicators 2018 Indiana REALTORS have closed the books on, releasing their summary of existing-home sales from last month. All metrics are up on a statewide basis except inventory, which is certainly
1200 Premier Drive, Suite 140 Chattanooga, TN Each office is independently owned and operated.
 THIS MONTH IN REAL ESTATE K im aulston R REALTOR 1200 Premier Drive, Suite 140 Chattanooga, TN 37421 Each office is independently owned and operated. Cell: 423-316-4022 Office: 423-664-1600 Email: kcraulston@gmail.com