Louisiana 2011 YTD v At a Glance
|
|
|
- Joan Walsh
- 5 years ago
- Views:
Transcription
 Louisiana 2011 YTD v.")
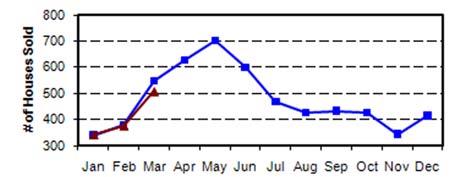
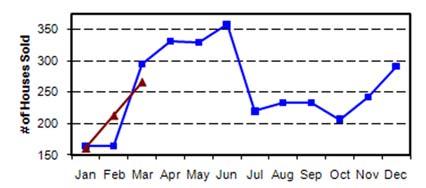
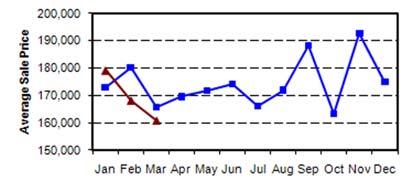
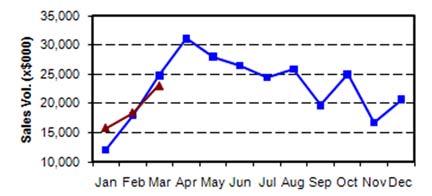
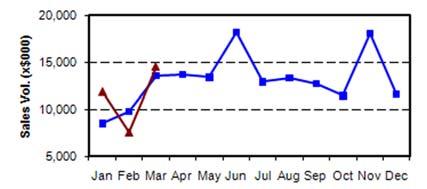
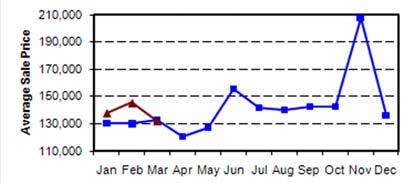
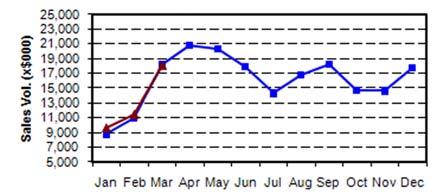
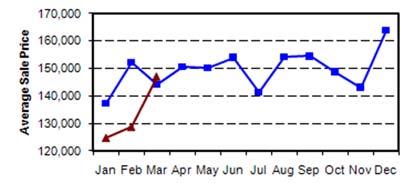
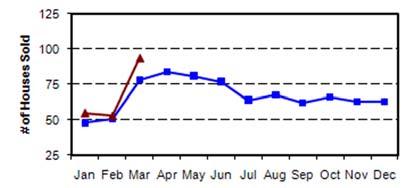
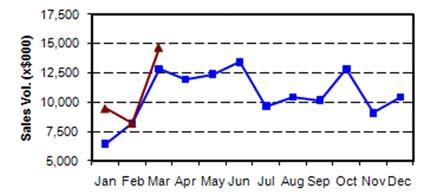
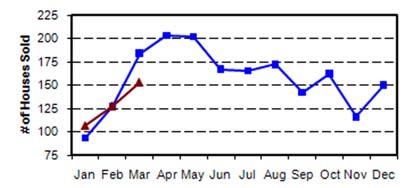
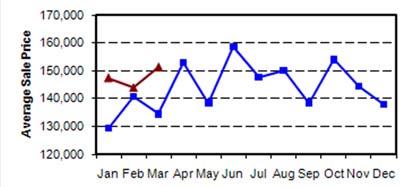
1 IN THIS ISSUE... Days on the Market: What Does it Tell Us? Statewide Sales Statistics Unemployment Rates Up, Job Gains Shown Recent Economic Development News LR s Quarterly Report on the Real Estate Market May 2011 (1st Quarter 2011) Louisiana 2011 YTD v At a Glance Sales information sorted by individual metropolitan areas is provided on pages 4 through 7 of the report. Specific numbers in a table format are on pages 6 and 7 of the report. Residential sales statistics in the report is for the period of January 2010 to March 2011 and provided by the following sources: Bayou Board of REALTORS, Greater Baton Rouge Association of REALTORS, Central Louisiana Association of REALTORS, Gulf States Real Estate Information Network, Northeast Louisiana Association of REALTORS, Northwest Louisiana Association of REALTORS, REALTOR Association of Acadiana, Southwest Louisiana Association of REALTORS First Quarter Residential Sales South Louisiana Sales Looking Up, Statewide Numbers Flat to Start 2011 First quarter Louisiana residential sales numbers remained flat compared to last year, but there are significant bright spots in several regions of the state. Statewide home sales were up 0.6 percent for the quarter compared to the first quarter of 2010, while total sales volume dropped 0.9 percent and the average sales price dropped 1.5 percent from $177,381 to $174,687. Most areas of the state registered sales increases over 2010 during January and February, while March numbers lagged to some degree. The Louisiana real estate market remains stable as we start the year, said Louisiana REALTORS president Derenda Grubb. We re encouraged by the increase of sales activity in the southern half of the state, and despite a drop in sales prices we continue to fare better than the national average. For the first quarter, home prices nationwide are down approximately 3 percent. While Louisiana reflects the national trend, the state s decrease in home values for the same period has been only half of that, at 1.5 percent. Most of the good news comes from south Louisiana, where Houma-Thibodaux bounced back with a 14.1 percent increase in home sales compared to the first quarter of last year. The average home price in the Bayou region went up 3.1 percent and total sales volume jumped an impressive 17.6 percent for the quarter compared to The 94 homes sold in the Houma-Thibodaux metro in March represents the best month for home sales in the region since June of From the time of the Gulf oil spill to the end of 2010, residential sales dropped approximately 20 percent in the region, but unemployment numbers never dropped to the extent many observers expected. The first quarter unemployment rate for the Houma-Thibodaux area was the lowest in the state at 6 percent. Statewide, the figure was 8.2 percent. After a rough 2010, the Bayou area real estate market is off to a solid start, said Grubb. We re hearing from our REALTORS that things are picking up. New Orleans registered positive gains as well, with nearly an 8 percent jump in home sales over the same (continued on page 7)
.")
2 Louisiana Labor Market Unemployment Rates Up, Modest Job Gains Shown Despite a rising statewide unemployment rate, Louisiana employers continue to add nonfarm, private sector jobs, with a 4,400 net job gain added over the year (March March 2011). The Louisiana Workforce Commission s March report showed an over-the-year increase of 15,200 private sector jobs, while the number of government jobs decreased by 10,800 from last year. The state unemployment rate for the first quarter of 2011 was 8.2 percent, up from 7.6 percent in the fourth quarter of The national unemployment rate at the end of 1Q11 stood at 8.8 percent. Louisiana metro area unemployment rates for 1Q11 were as follows: Houma- Thibodaux, 6.0 percent; Lafayette, 6.5 percent; Shreveport- Bossier, 7.4 percent; Lake Charles, 7.5 percent; Alexandria- Pineville, 7.8 percent; Greater New Orleans, 8 percent; Louisiana Unemployment Rate 2010 v Greater Baton Rouge 8.3 percent; Monroe, 8.6 percent. Louisiana Department of Labor, Louisiana Workforce Commission CEO & Consumer Confidence Indices Consumer Confidence Down; CEOs Optimistic; Business Conditions Strengthening After increasing in February, the monthly Consumer Confidence Index declined in March. Lynn Franco, Director of The Conference Board Consumer Research Center says the sharp decline in consumer confidence, 72.0 down to 63.4, was prompted by a sharp decline in expectations. Consumers inflation expectations rose significantly in March and their income expectations soured, a combination that will likely impact spending decisions. On the other hand, consumers assessment of current conditions improved, indicating that while the short-term future may be uncertain, the economy continues to expand. Consumers assessment of current economic conditions is good. Consumers appraisal of the job market was less favorable as those who said jobs are hard to get edged up. Consumers short-term outlook was considerably less favorable and was also more downbeat about the labor market. The U.S. CEO Confidence Index, as reported by The Conference Board, continues to move forward in 1Q11 after bouncing back in 4Q10. The Measure now stands at 67, up from 62 in 4Q10. Lynn Franco, Director of The Conference Board Consumer Research Center says CEOs confidence has improved and expectations are that the economy will continue to expand in the coming months. As for the employment outlook, CEOs are more bullish than last year, with half now saying they intend to ramp up hiring. CEOs optimism about the short-term outlook continues to grow. Expectations for their own industries, however, are 2 slightly less optimistic with less than half of CEOs expecting conditions to improve in the month ahead. CEOs see regulation and litigation are the major obstacles to hiring new workers, followed by health care costs and wage and salary costs. Other fringe benefits are of lesser concern when hiring new workers. National Economy It appears that the national economy is on a bit of a roll. The U.S. economy increased 0.4% in March after increases in February, 1.0%, and January, 0.2%. Ataman Ozyildirim, economist at The Conference Board, says The U.S. Leading Economic Index (LEI) continued to increase in March, pointing to strengthening business conditions in the near term. The March increase was led by the interest rate spread and housing permits components, while consumer expectations dropped. The Coincident Economic Index (CEI), a monthly measure of current economic conditions, also continued to rise, led by gains in industrial production and employment. Ken Goldstein, also an economist at The Conference Board, indicates The U.S. LEI continues to point to sustained economic growth through year end. Global disruptions, including unrest in the Middle East, rising oil prices and the Japan earthquake, may have some repercussions. However, it remains to be seen what the impact of these shocks will be on the United States and the broader global economy. The Conference Board
 figure.")

3 Economist s Perspective Days On the Market: What Does It Tell Us? Lawrence Yun, NAR Chief Economist One fairly consistent trend that has been occurring in many local markets in recent months has been a rising average days-on-market (DOM) figure. Home prices have been shaky, with NAR showing 5.1 percent lower prices in the first quarter of this year compared to last year and Case-Shiller showing 3 percent lower prices in the first two months of this year. These two events appear to go hand-in-hand. Without doubt, some home sellers need to get realistic about how to properly price their homes to attract buyers. However, we should be mindful of the statistic trick that days-on-market can play. Consider also another recent fact showing a fewer number of newly listed properties. That is, of the total existing inventory, an increasingly large percentage of homes are not new listings, which naturally have a very low DOM number. In the table at right, it becomes clear that the average DOM could easily, and in fact is more likely to, be higher in the second row even though the raw inventory numbers would imply healthier market conditions. So the average DOM can mislead market observers. A better measure of the supply-anddemand condition in the market is the total inventory in relation to sales. That is what is captured by the statistics on monthssupply of inventory. Furthermore, the months-supply figure is not subject to any potential manipulation of changing listing status (e.g., delist, wait, then relist as brand new) because it only counts how many homes are listed and not how long properties have been listed. The latest months-supply at the national level is at 8.4 months. That is about the same as last year s figure at this time of the year when the market was artificially juiced up with the homebuyer tax credit. The latest months-supply figure is also lower than the 10 to 12 months-supply conditions during the second half of last year. The lower home price of those transacted homes is partly due to more distressed property sales. But as distressed property sales thin out over time, prices will likely show stabilizing patterns. The bottom line: DOM for an individual property is very important and re-pricing will be necessary at some point if the property s DOM rises. However, an average DOM figure for the market as a whole may not be a good indicator about how to price the home. NAR Economist s Outlook, May 2011 National Real Estate Market Existing Home Sales Up in Most States in 1Q, Metro Area Prices Mixed Existing-home sales continued to recover in the first quarter with gains recorded in 49 states and the District of Columbia, while 22 percent of the available metropolitan areas saw prices rise from a year ago, according to the latest survey by the National Association of REALTORS. Total state existing-home sales, including single-family and condo, rose 8.3 percent to a seasonally adjusted annual rate of 5.14 million in the first quarter from 4.75 million in the fourth quarter, and are only 0.8 percent below a 5.18 million pace during the same period in Also in the first quarter, the median existing single-family home price rose in 34 out of 153 metropolitan statistical areas (MSAs) from the first quarter of 2010, including four with double-digit increases; one was unchanged and 118 areas showed price declines. The national median existing single-family home price was $158,700 in the first quarter, down 4.6 percent from $166,400 in the first quarter of The median is where half sold for more and half sold for less. Distressed homes typically sold at a discount of about 20 percent, accounted for 39 percent of first quarter sales, up from 36 percent a year earlier. Although sales are slightly below a year ago, the volume of homes sold for $100,000 or less in the first quarter was 8.9 percent higher than the first quarter of 2010, creating a downward skew on the overall median price. The share of all-cash home purchases rose to 33 percent in the first quarter from 27 percent in the first quarter of Investors accounted for 21 percent of first quarter transactions, up from 18 percent a year ago, while first-time buyers purchased 32 percent of homes, down from 42 percent in the first quarter of 2010 when a tax credit was in place. Repeat buyers accounted for a 47 percent market share in the first quarter, up from 40 percent a year earlier. NAR 3


4 Greater New Orleans/Northshore Area Greater Baton Rouge Area Source: New Orleans Metropolitan Association of REALTORS Source: Greater Baton Rouge Association of REALTORS Shreveport-Bossier/Northwest Louisiana Lafayette/Acadiana Area 4 Source: Northwest Louisiana Association of REALTORS Source: REALTOR Association of Acadiana
5 Alexandria-Pineville/Central Louisiana Lake Charles/Southwest Louisiana Source: Central Louisiana Association of REALTORS Source: Southwest Louisiana Association of REALTORS Houma-Thibodaux/Bayou Area Monroe/Northeast Louisiana Source: Bayou Board of REALTORS Source: Northeast Louisiana Association of REALTORS 5
6 6 Quarterly Indicators at a Glance
7 Quarterly Indicators at a Glance 1Q11 LOUISIANA MARKET OVERVIEW (continued from page 1) period last year. Total sales volume was up nearly 4 percent while the average sales price was down nearly 4 percent to $188,279. The Lake Charles metro area registered a 10.3 percent jump in sales for the quarter compared to 2010 and a 3.2 percent increase in total volume. Home sales in the Lafayette market were also up 2.6 percent over last year. Central Louisiana also showed gains, with home sales up 2.5 percent, total volume up nearly 7 percent and the average sales price up 4.3 percent over 1Q10. Elsewhere, north Louisiana experienced a cooling off of both the Shreveport-Bossier and Monroe metro markets, with Shreveport home sales down nearly 13 percent compared to last year and Monroe dropping 4 percent. The average sales price in Shreveport increased approximately 2 percent while Monroe prices jumped over 9 percent. Monroe also had the state s largest unemployment rate for the quarter at 8.6 percent, up from 7.5 percent in 1Q10. Home sales in the Greater Baton Rouge area were 3.3 percent lower than a year ago, with total volume down nearly 7 percent and the average sales price dropping from $199,538 to $192,698, a 3.4 percent decrease. LR 7

8 Recent Economic Development News Southwest Louisiana Aeroframe Expansion at Chennault; New Export Grain Terminal at Port On March 18, Aeroframe Services announced that it will further expand its presence at Chennault International Airport, exceeding its previously projected job creation levels. The February 2010 expansion announcement had the company committing to add 300 direct jobs to its existing employment base of 250, which increased total employment to 550 jobs. Already 170 new direct jobs have been added, as direct employment now stands 420 employees, not including more than 100 on-site contractor jobs. With the additional expansion announced in March, the company s total direct employment will increase to 650 direct jobs within 24 months, 100 more jobs than previously committed, and its total payroll will increase to more than $35.7 million. Louisiana Economic Development estimates the 100 additional direct jobs will result in 120 new indirect jobs and will generate approximately $8.2 million in new, state tax revenue and nearly $3.2 million in new, local tax revenue over the next 10 years. Also in the Lake Charles area, the Port of Lake Charles, IFG Port Holdings, and Union Pacific announced in March that a new export grain terminal will be launched at the Port. The project is the first of its kind to be built in the Gulf Coast region in 25 years. The project represents a capital investment by IFG of $59.5 million and will create at least 36 new direct jobs and approximately 20 new indirect jobs. It includes an upgraded rail connection to a new bulk grain elevator at the port. Greater New Orleans Nucor Breaks Ground on St. James Iron & Steel Facility In March, Nucor Corp. broke ground on the first phase of its new multiphase iron and steel project in St. James Parish. The facility will be one of the largest industrial projects in Louisiana history, and could result in more than 1,250 new direct jobs, averaging approximately $75,000 per year, and $3.4 billion in capital investment. Nucor estimates phase I alone will create 500 jobs during peak construction. Northeast Louisiana Kennedy Rice Dryers To Build New Mill in Mer Rouge Kennedy Rice Dryers announced Kennedy Rice Mill, a subsidiary of Kennedy Rice Dryers, will establish a new rice mill in Mer Rouge. The project will create 22 new direct jobs and represent a capital investment of $10 million. The mill will run two shifts, but could add a third shift, which would increase the job count to roughly 30 new direct jobs. Construction on the mill will begin and end during calendar year 2011, and Kennedy Rice Dryers estimates there will be 50 construction jobs created with the project. Louisiana Economic Development estimates the 22 new direct jobs will result in 85 new indirect jobs and will generate approximately $3.5 million in new, state tax revenue and nearly $1.2 million in new, local tax revenue over the next 10 years. Northshore Bradken Expands Amite Foundry Bradken Engineered Products announced on February 8 that the company is expanding its foundry in Amite. The expansion project represents a capital investment of $18.1 million, and will retain 179 jobs and create 171 new direct jobs at an average annual salary of $37,500, plus benefits. Louisiana Economic Development estimates the expansion will also result in the creation of 223 new indirect jobs, for a total of nearly 400 new jobs, along with nearly $5.3 million in new, state tax revenues and nearly $3.2 million in new, local tax revenues over the next 10 years. Bradken expects to complete the expansion in around 18 months. 8 Produced quarterly by Louisiana REALTORS and John C. Borland CCR Correspondence should be addressed to: P.O. Box 14780, Baton Rouge, LA
ECONOMIC CURRENTS. Vol. 4, Issue 3. THE Introduction SOUTH FLORIDA ECONOMIC QUARTERLY
 ECONOMIC CURRENTS THE Introduction SOUTH FLORIDA ECONOMIC QUARTERLY Vol. 4, Issue 3 Economic Currents provides an overview of the South Florida regional economy. The report presents current employment,
ECONOMIC CURRENTS. Vol. 3, Issue 1. THE SOUTH FLORIDA ECONOMIC QUARTERLY Introduction
 ECONOMIC CURRENTS THE SOUTH FLORIDA ECONOMIC QUARTERLY Introduction Economic Currents provides an overview of the South Florida regional economy. The report contains current employment, economic and real
Housing and Economy Market Trends
 Housing and Economy Market Trends Mainstreet Organization Prices of single-family, detached homes in suburban Chicago increased 12.1 percent in May 2014 compared with the same period a year ago. Overall,
ECONOMIC CURRENTS. Vol. 5 Issue 2 SOUTH FLORIDA ECONOMIC QUARTERLY. Key Findings, 2 nd Quarter, 2015
 ECONOMIC CURRENTS THE Introduction SOUTH FLORIDA ECONOMIC QUARTERLY Economic Currents provides an overview of the South Florida regional economy. The report presents current employment, economic and real
Housing Price Forecasts. Illinois and Chicago PMSA, January 2018
 Housing Price Forecasts Illinois and Chicago PMSA, January 2018 Presented To Illinois Realtors From R E A L Regional Economics Applications Laboratory, Institute of Government and Public Affairs University
San Francisco Housing Market Update
 San Francisco Housing Market Update California Economic and Housing Market Outlook The national economy maintained a healthy growth rate in the first quarter of 2005 and appeared to be settling in for
Housing Price Forecasts. Illinois and Chicago PMSA, August 2017
 Housing Price Forecasts Illinois and Chicago PMSA, August 2017 Presented To Illinois Realtors From R E A L Regional Economics Applications Laboratory, Institute of Government and Public Affairs University
Single Family Sales Maine: Units
 Maine Home Connection 19 Commercial St Portland, Maine 04101 MaineHomeConnection.com Office: (207) 517-3100 Email: Info@MaineHomeConnection.com For the fourth consecutive year, Maine home sales set a new
ECONOMIC CURRENTS. Vol. 3, Issue 3 SOUTH FLORIDA ECONOMIC QUARTERLY. Introduction
 ECONOMIC CURRENTS THE Introduction SOUTH FLORIDA ECONOMIC QUARTERLY Economic Currents provides an overview of the South Florida regional economy. The report presents current employment, economic and real
TENNESSEE HOUSING MARKET
 1st Quarter 212 TENNESSEE HOUSING MARKET David A. Penn, Director Business and Economic Research Center Jennings A. Jones College of Business Middle Tennessee State University This quarterly series is supported
Housing Price Forecasts. Illinois and Chicago PMSA, August 2016
 Housing Price Forecasts Illinois and Chicago PMSA, August 2016 Presented To Illinois Association of Realtors From R E A L Regional Economics Applications Laboratory, Institute of Government and Public
This Month in Real Estate
 Keller Williams Research This Month in Real Estate Released: September 14, 2009 Commentary. The Numbers That Drive Real Estate Recent Government Action. Research for Buyers and Sellers. 2 4 10 14 1 Green
INLAND EMPIRE REGIONAL INTELLIGENCE REPORT
 INLAND EMPIRE REGIONAL INTELLIGENCE REPORT June 2016 EMPLOYMENT After a slow start to 2016, the Inland Empire s labor market returned to form, in recent job figures. Seasonally adjusted nonfarm employment
2015 First Quarter Market Report
 2015 First Quarter Market Report CAAR Member Copy Expanded Edition Charlottesville Area First Quarter 2015 Highlights: Median sales price for the region was up 5.1% over Q1-2014, rising from $244,250 to
Housing Price Forecasts. Illinois and Chicago PMSA, April 2018
 Housing Price Forecasts Illinois and Chicago PMSA, April 2018 Presented To Illinois Realtors From R E A L Regional Economics Applications Laboratory, Institute of Government and Public Affairs University
2013 Arizona Housing Market Mid-Year Report
 2013 Arizona Housing Market Mid-Year Report This mid-year market report outlines the latest trends in Arizona real estate. The housing market hit bottom in mid to late 2011, and has been in recovery mode
Housing Price Forecasts. Illinois and Chicago PMSA, December 2015
 Housing Price Forecasts Illinois and Chicago PMSA, December 2015 Presented To Illinois Association of Realtors From R E A L Regional Economics Applications Laboratory, Institute of Government and Public
CONTENTS. Executive Summary. Southern Nevada Economic Situation 1 Household Sector 4 Tourism & Hospitality Industry
 CONTENTS Executive Summary Southern Nevada Economic Situation 1 Household Sector 4 Tourism & Hospitality Industry Residential Trends 6 Existing Home Sales 10 Property Management Market 11 Foreclosure Situation
Housing Price Forecasts. Illinois and Chicago PMSA, June 2012
 Housing Price Forecasts Illinois and Chicago PMSA, June 2012 Presented To Illinois Association of REALTORS From R E A L Regional Economics Applications Laboratory, Institute of Government and Public Affairs
Housing Price Forecasts. Illinois and Chicago PMSA, March 2016
 Housing Price Forecasts Illinois and Chicago PMSA, March 2016 Presented To Illinois Association of Realtors From R E A L Regional Economics Applications Laboratory, Institute of Government and Public Affairs
nd Quarter Market Report
 2015 2 nd Quarter Market Report The voice of real estate in Central Virginia CAAR Member Copy Expanded Edition Charlottesville Area 2 nd Quarter 2015 Highlights: Closed sales in the Greater Charlottesville
INLAND EMPIRE REGIONAL INTELLIGENCE REPORT. School of Business. April 2018
 INLAND EMPIRE REGIONAL INTELLIGENCE REPORT April 2018 Key economic indicators suggest that the Inland Empire s economy will continue to expand throughout the rest of 2018, building upon its recent growth.
Rapid recovery from the Great Recession, buoyed
 Game of Homes The Supply-Demand Struggle Laila Assanie, Sarah Greer, and Luis B. Torres October 4, 2016 Publication 2143 Rapid recovery from the Great Recession, buoyed by the shale oil boom, has fueled
CONTENTS. Executive Summary 1. Southern Nevada Economic Situation 2 Household Sector 5 Tourism & Hospitality Industry
 CONTENTS Executive Summary 1 Southern Nevada Economic Situation 2 Household Sector 5 Tourism & Hospitality Industry Residential Trends 7 Existing Home Sales 11 Property Management Market 12 Foreclosure
Housing Price Forecasts. Illinois and Chicago PMSA, May 2018
 Housing Price Forecasts Illinois and Chicago PMSA, May 2018 Presented To Illinois Realtors From R E A L Regional Economics Applications Laboratory, Institute of Government and Public Affairs University
Economic Highlights. Payroll Employment Growth by State 1. Durable Goods 2. The Conference Board Consumer Confidence Index 3
 August 26, 2009 Economic Highlights Southeastern Employment Payroll Employment Growth by State 1 Manufacturing Durable Goods 2 Consumer Spending The Conference Board Consumer Confidence Index 3 Real Estate
Vacancy Inches Higher, Despite Continued Absorption
 Research & Forecast Report GREATER PHOENIX OFFICE 1Q 2017 Vacancy Inches Higher, Despite Continued Absorption Key Takeaways > > Improving conditions in the Greater Phoenix office market took a pause in
HOW LONG WILL THE HOUSING DEMAND SURGE CONTINUE? WADE R. RAGAS, PHD MAI SRA REAL PROPERTY ASSOCIATES, (504) ( ) WADERAGAS.
 ( ) WADERAGAS.") HOW LONG WILL THE HOUSING DEMAND SURGE CONTINUE? WADE R. RAGAS, PHD MAI SRA REAL PROPERTY ASSOCIATES, (504) (324-3994) WADERAGAS.COM LOUISIANA EMPLOYMENT BY METRO AREA DECEMBER 2015, JANUARY 2015 AND JANUARY
HOW LONG WILL THE HOUSING DEMAND SURGE CONTINUE? WADE R. RAGAS, PHD MAI SRA REAL PROPERTY ASSOCIATES, (504) (324-3994) WADERAGAS.COM LOUISIANA EMPLOYMENT BY METRO AREA DECEMBER 2015, JANUARY 2015 AND JANUARY
Housing Price Forecasts. Illinois and Chicago PMSA, March 2018
 Housing Price Forecasts Illinois and Chicago PMSA, March 2018 Presented To Illinois Realtors From R E A L Regional Economics Applications Laboratory, Institute of Government and Public Affairs University
NATIONAL ASSOCIATION of REALTORS RESEARCH DIVISION. Prepared for Florida REALTORS
 NATIONAL ASSOCIATION of REALTORS RESEARCH DIVISION Prepared for Florida REALTORS NATIONAL ASSOCIATION OF REALTORS RESEARCH DIVISION Page 1 Page 3 Page 4 Page 6 Page 7 Page 8 Page 9 Page 10 Page 11 Page
REAL ESTATE AND THE ECONOMIC OUTLOOK THROUGH 2013:
 1 1 REAL ESTATE AND THE ECONOMIC OUTLOOK THROUGH 2013: Coping With A Different Kind Of Housing Recovery A Presentation To The Commercial Real Estate Education Summit Monrovia, California July 13, 2012
Market Research. Market Indicators
 colliers international LAS VEGAS, NV Market Research OFFICE Third Quarter 2009 Market Indicators Net Absorption Construction Rental Rate Q3-09 Q4-2009 Projected Clark County Economic Data Jul-09 Jul-08
DATA FOR MAY Published June 23, Sales are up +11.3% month-over-month. The year-over-year comparison shows an increase of +11.1%.
 Permission is granted only to ARMLS Subscribers for reproduction with attribution on to ARMLS COPYRIGHT 2017. For questions regarding this publication contact Brand@ARMLS.com. DATA FOR MAY 2017 - Published
Released: May 7, 2010
 Released: May 7, 2010 Commentary 2 The Numbers That Drive Real Estate 3 Recent Government Action 9 Topics for Home Buyers, Sellers, and Owners 11 Brought to you by: KW Research Commentary The economic
Monthly Market Snapshot
 SEPTEMBER 2018 Vacancy continues to fall. Nearing the end of the third quarter, the vacancy rate dropped 10 basis points to 6.4%, compared to this time last month at 6.5%. Occupancy of the 1.1 million
RESIDENTIAL MARKET ANALYSIS
 RESIDENTIAL MARKET ANALYSIS CLANCY TERRY RMLS Student Fellow Master of Real Estate Development Candidate Oregon and national housing markets both demonstrated shifting trends in the first quarter of 2015
Monthly Indicators + 3.5% + 3.0% % Activity Overview New Listings Pending Sales. Closed Sales. Days on Market Until Sale. Median Sales Price
 Monthly Indicators 218 Housing price bubble chatter has increased this summer, as market observers attempt to predict the next residential real estate shift. It is too early to predict a change from higher
rd Quarter Market Report
 2012 3 rd Quarter Market Report The voice of real estate in Central Virginia CAAR Member Copy Expanded Edition Charlottesville Area 3 rd Quarter 2012 Highlights: Overall sales in Greater Charlottesville
Housing Price Forecasts. Illinois and Chicago PMSA, March 2017
 Housing Price Forecasts Illinois and Chicago PMSA, March 2017 Presented To Illinois Realtors From R E A L Regional Economics Applications Laboratory, Institute of Government and Public Affairs University
HOUSING REPORT WASHTENAW SEPTEMBER 2018
 WASHTENAW SEPTEMBER 2018 Washtenaw County Recovery Run How Much Longer? This month marks the 10-year anniversary of the market peak prior to the burst of the housing bubble. The nationwide median home
Housing Price Forecasts. Illinois and Chicago PMSA, January 2019
 Housing Price Forecasts Illinois and Chicago PMSA, January 2019 Presented To Illinois Realtors From R E A L Regional Economics Applications Laboratory, Institute of Government and Public Affairs University
Housing Price Forecasts. Illinois and Chicago PMSA, March 2019
 Housing Price Forecasts Illinois and Chicago PMSA, March 2019 Presented To Illinois Realtors From R E A L Regional Economics Applications Laboratory, Institute of Government and Public Affairs University
2013 Year-End Market Report
 2013 Year-End Market Report The voice of real estate in Central Virginia CAAR Member Copy Expanded Edition Charlottesville Area Year-End 2013 Highlights: Yearly home sales in Greater Charlottesville were
Monthly Indicators + 3.5% + 2.1% - 9.4% Activity Overview New Listings Pending Sales. Closed Sales. Days on Market Until Sale. Median Sales Price
 Monthly Indicators 217 How long can the residential real estate market go on like this? We are about two years into a national trend of dropping housing supply and increasing median sales prices. There
Housing Price Forecasts. Illinois and Chicago PMSA, September 2016
 Housing Price Forecasts Illinois and Chicago PMSA, September 2016 Presented To Illinois Realtors From R E A L Regional Economics Applications Laboratory, Institute of Government and Public Affairs University
Las Vegas Valley Executive Summary
 ARROYO MARKET SQUARE Las Vegas Valley Executive Summary Retail Market 4th Quarter 2013 THE DISTRICT AT GREEN VALLEY RANCH January 23, 2014 Re: Commercial Real Estate Survey: 4th Quarter, 2013 Dear Reader,
Residential Real Estate Market Overview: September 2017 Data
 Residential Real Estate Market Overview: September 2017 Data 2017 Mark A. Melikian Chief Valuation Officer mark.melikian@summitvaluations.com 2800 River Road, Suite 460 The following is a market data summary
Housing Market Update
 Housing Market Update March 2017 New Hampshire s Housing Market and Challenges Market Overview Dean J. Christon Executive Director, New Hampshire Housing Finance Authority New Hampshire s current housing
For the Reno MSA employment has historically been based largely on construction and the leisure and hospitality industry. The construction industry
 For the Reno MSA employment has historically been based largely on construction and the leisure and hospitality industry. The construction industry has lost almost 15,000 construction jobs since 2006,
Housing Price Forecasts. Illinois and Chicago PMSA, October 2014
 Housing Price Forecasts Illinois and Chicago PMSA, October 2014 Presented To Illinois Association of Realtors From R E A L Regional Economics Applications Laboratory, Institute of Government and Public
San Francisco Bay Area to Napa County Housing and Economic Outlook
 San Francisco Bay Area to 019 Napa County Housing and Economic Outlook Bay Area Economic Forecast Summary Presented by Pacific Union International, Inc. and John Burns Real Estate Consulting, LLC On Nov.
Housing Price Forecasts. Illinois and Chicago PMSA, July 2016
 Housing Price Forecasts Illinois and Chicago PMSA, July 2016 Presented To Illinois Association of Realtors From R E A L Regional Economics Applications Laboratory, Institute of Government and Public Affairs
Hamilton s Housing Market and Economy
 Hamilton s Housing Market and Economy Growth Indicator Report November 2016 hamilton.govt.nz Contents 3. 4. 5. 6. 7. 7. 8. 9. 10. 11. Introduction New Residential Building Consents New Residential Sections
August 2015 Washington, DC Market Trends Report Limited supply, high demand continue pushing prices to record highs
 FOR IMMEDIATE RELEASE Contact: Bobette Banks 301-590-8764 Director of Communications Greater Capital Area Association of REALTORS bbanks@gcaar.com August 2015 Washington, DC Market Trends Report Limited
Released: June 7, 2010
 Released: June 7, 2010 Commentary 2 The Numbers That Drive Real Estate 3 Recent Government Action 9 Topics for Home Buyers, Sellers, and Owners 11 Brought to you by: KW Research Commentary The housing
ANALYSIS OF THE CENTRAL VIRGINIA AREA HOUSING MARKET 1st quarter 2013 By Lisa A. Sturtevant, PhD George Mason University Center for Regional Analysis
 ANALYSIS OF THE CENTRAL VIRGINIA AREA HOUSING MARKET 1st quarter By Lisa A. Sturtevant, PhD George Mason University Center for Regional Analysis Economic Overview Key economic factors in the first quarter
MARKET AREA UPDATE Report as of: 1Q 2Q 3Q 4Q
 MARKET AREA UPDATE Report as of: 1Q 2Q 3Q 4Q Year: 2013 Market Area (City, State): Washington DC Metropolitan Area Provided by (Company / Companies): LONG & FOSTER REAL ESTATE, INC. What are the most significant
Year to Date (thru June)
") CAAR Market Report 2009 Mid-Year Published by the Charlottesville Area Association of REALTORS Where Are We Now? The pace of home purchases in the Charlottesville area continues to improve from the dismal
CAAR Market Report 2009 Mid-Year Published by the Charlottesville Area Association of REALTORS Where Are We Now? The pace of home purchases in the Charlottesville area continues to improve from the dismal
MARKET AREA UPDATE Report as of: 1Q 2Q 3Q 4Q
 Year: 2013 Market Area (City, State): Baltimore Metropolitan Area MARKET AREA UPDATE Report as of: 1Q 2Q 3Q 4Q Provided by (Company / Companies): LONG & FOSTER REAL ESTATE, INC. What are the most significant
San Francisco Bay Area to Santa Clara & San Benito Counties Housing and Economic Outlook
 San Francisco Bay Area to 019 Santa Clara & San Benito Counties Housing and Economic Outlook Bay Area Economic Forecast Summary Presented by Pacific Union International, Inc. and John Burns Real Estate
Monthly Indicators + 5.9% - 6.6% + 8.1%
 ly Indicators A RESEARCH TOOL PROVIDED BY METRO MLS FOR ACTIVITY IN THE 4-COUNTY MILWAUKEE METROPOLITAN AREA 2019 Quick Facts Despite a strong U.S. economy, historically low unemployment and steady wage
Monthly Indicators. Monthly Snapshot. April % % + 4.7%
 Monthly Indicators For residential real estate activity in the state of New Jersey 2018 Monthly Snapshot Many sellers and builders are in a good position for financial gains, as the economy continues to
This Month in Real Estate
 Keller Williams Research This Month in Real Estate Released: June 11, 2009 Commentary. The Numbers That Drive Real Estate Recent Government Action. Research for Buyers and Sellers. 2 4 10 13 1 Green Shoots
The Corcoran Report 4Q16 MANHATTAN
 The Corcoran Report 4Q16 MANHATTAN Contents Fourth Quarter 2016 4/7 12/23 3 Overview 8 9 10 Market Wide 11 Luxury 24 2 Sales / Days on Market 3 Inventory / Months of Supply 4 5 Market Share Resale Co-ops
} Construction jobs have
 Texas Housing Market Finally Building a Solid Recovery By D Ann Petersen } Construction jobs have contributed to total employment consistently beginning this year, making construction the last of the major
The Coldwell Banker Carlson Real Estate Market Report
 The Coldwell Banker Carlson Real Estate Market Report 2017 Year-End Stowe Area Report Our 2017 Year-End Market Report uses market-wide data, based on transactions that closed in 2017 in the Multiple Listing
Summary Statistics. Closed Sales. Paid in Cash. Median Sale Price. Average Sale Price. Dollar Volume. Median Time to Sale.
 ly Market Detail - Q1 216 Summary Statistics Q1 216 Q1 215 Paid in Cash 57,913 57,742.3% 2,133 23,724-15.1% $23,5 $182, 11.8% Average Sale Price Dollar Volume $285,447 $266,453 7.1% $16.5 Billion $15.4
San Francisco Bay Area to Marin, San Francisco, and San Mateo Counties Housing and Economic Outlook
 San Francisco Bay Area to 019 Marin, San Francisco, and San Mateo Counties Housing and Economic Outlook Bay Area Economic Forecast Summary Presented by Pacific Union International, Inc. and John Burns
HOULIHAN LAWRENCE COMMERCIAL GROUP
 HOULIHAN LAWRENCE COMMERCIAL GROUP TH QUARTER EXECUTIVE SUMMARY FOURTH QUARTER Dear Clients, With behind us and the new year in full swing, we can now reflect, summarize and gain insight from the past
February 2016 Loudoun County Market Trends Report Contracts and sales activity jump double-digits; Inventories down 15.5 percent
 FOR IMMEDIATE RELEASE Contact: Christine Windle 703-777-2468, cwindle@dullesarea.com Sponsored by: Access National Bank Tom Ciolkosz, (703) 871-1045, tciolkosz@accessnationalbank.com Patty Foster, 703-871-1014,
FOR IMMEDIATE RELEASE Contact: Brenda Morton Dulles Area Association of REALTORS
 FOR IMMEDIATE RELEASE Contact: Brenda Morton 703 777 2468 Dulles Area Association of REALTORS bmorton@dullesarea.com August 2018 Loudoun County Market Trends Report Despite persistent low inventory, sales
August 2017 Loudoun County Market Trends Report Sales Price Reaches Record High; Sales Decline; Inventory Remains Low
 FOR IMMEDIATE RELEASE Contact: Christine Windle 703 777 2468 Dulles Area Association of REALTORS cwindle@dullesarea.com August 2017 Loudoun County Market Trends Report Sales Price Reaches Record High;
Summary Statistics. Closed Sales. Paid in Cash. Median Sale Price. Average Sale Price. Dollar Volume. Median Time to Sale.
 ly Market Detail - Q1 217 Summary Statistics Q1 217 Q1 216 Paid in Cash 6,69 57,779 5.% 18,678 2,133-7.2% $226, $24,74 1.7% Average Sale Price Dollar Volume $311,2 $286,99 8.8% $18.9 Billion $16.5 Billion
Minneapolis St. Paul Residential Real Estate Index
 University of St. Thomas Minneapolis St. Paul Residential Real Estate Index Welcome to the latest edition of the UST Minneapolis St. Paul Residential Real Estate Index. The University of St Thomas Residential
Foreclosures Continue to Bring Home Prices Down * FNC releases Q Update of Market Distress and Foreclosure Discount
 Foreclosures Continue to Bring Home Prices Down * FNC releases Q4 2011 Update of Market Distress and Foreclosure Discount The latest FNC Residential Price Index (RPI), released Monday, indicates that U.S.
REAL ESTATE MARKET OVERVIEW 1 st Half of 2015
 REAL ESTATE MARKET OVERVIEW 1 st Half of 2015 With Comparisons to the 2 nd Half of 2014 September 4, 2015 Prepared for: First Bank of Wyoming Prepared by: Ken Markert, AICP MMI Planning 2319 Davidson Ave.
San Francisco Bay Area to Sonoma County Housing and Economic Outlook
 San Francisco Bay Area to 2020 Sonoma County Housing and Economic Outlook Economic Forecast Summary 2017 Presented by Pacific Union International, Inc. and John Burns Real Estate Consulting, LLC On Nov.
THE SWEARINGEN REPORT VICTORIA MLS
 THE SWEARINGEN REPORT VICTORIA MLS Current Observations: Victoria at a Crossroads -This month's comments are from The Texas A&M Real Estate Center article dated Sept 5, 218. More than a year after Hurricane
Monthly Indicators - 7.4% + 5.6% % Activity Overview New Listings Pending Sales. Closed Sales. Days on Market Until Sale. Median Sales Price
 Monthly Indicators 218 Rising home prices, higher interest rates and increased building material costs have pressured housing affordability to a ten-year low, according to the National Association of Home
Summary Statistics. Closed Sales. Paid in Cash. Median Sale Price. Average Sale Price. Dollar Volume. Median Time to Sale.
 ly Market Detail - Q1 217 Summary Statistics Q1 217 Q1 216 Paid in Cash 2,96 2,713 9.1% 1,85 1,71 1.3% $249,9 $22,7 13.6% Average Sale Price Dollar Volume $351,61 $328,235 7.% $1. Billion $89.5 Million
Monthly Indicators % % % Activity Overview New Listings Pending Sales. Closed Sales. Days on Market Until Sale. Median Sales Price
 Monthly Indicators 2018 Residential real estate activity has been relatively slow in the first quarter of 2018, yet housing is proving its resiliency in a consistently improving economy. Some markets have
CAAR Market Report 2010 Mid-Year Published by the Charlottesville Area Association of REALTORS
 CAAR Market Report 2010 Mid-Year Published by the Charlottesville Area Association of REALTORS Where Are We Now? The pace of home purchases in the Charlottesville market area showed a significant increase
Summary Statistics. Closed Sales. Paid in Cash. Median Sale Price. Average Sale Price. Dollar Volume. Median Time to Sale.
 Summary Statistics Q4 218 Q4 217 Paid in Cash 1,149 1,113 3.2% 353 356 -.8% $231, $216,5 6.7% Average Sale Price Dollar Volume $269,36 $252,948 6.5% $39.5 Million $281.5 Million 9.9% Median Percent of
Summary Statistics. Closed Sales. Paid in Cash. Median Sale Price. Average Sale Price. Dollar Volume. Median Time to Sale.
 Summary Statistics January 219 January 218 Paid in Cash 15,526 16,561-6.2% 4,556 5,34-9.5% $249,9 $24, 4.1% Average Sale Price Dollar Volume $34,241 $334,381 1.8% $5.3 Billion $5.5 Billion -4.6% Median
Monthly Indicators. August Quick Facts + 7.0% + 7.3% %
 Monthly Indicators 2018 Indiana REALTORS have closed the books on, releasing their summary of existing-home sales from last month. All metrics are up on a statewide basis except inventory, which is certainly
Summary Statistics. Closed Sales. Paid in Cash. Median Sale Price. Average Sale Price. Dollar Volume. Median Time to Sale.
 ly Market Detail - January 218 Summary Statistics January 218 January 217 Paid in Cash 7,634 7,29 5.9% 4,328 4,298.7% $179,9 $161, 11.7% Average Sale Price Dollar Volume $286,44 $244,52 17.1% $2.2 Billion
TREND Economic and Market Watch Report. Index
 TREND Economic and Watch Report TREND is the Multiple Listing Service (MLS) for more than 32,000 real estate professionals in and around the Philadelphia metropolitan region. TREND s 13-county primary
Commercial Real Estate Outlook
 Commercial Real Estate Outlook By Lawrence Yun, Ph.D. Chief Economist, National Association of REALTORS Presentation at Annual Conference of National Association of REALTORS Chicago, IL November 3, 2017
Summary Statistics. Closed Sales. Paid in Cash. Median Sale Price. Average Sale Price. Dollar Volume. Median Time to Sale.
 Summary Statistics Q3 218 Q3 217 Paid in Cash 28,894 26,39 9.5% 14,3 13,783 3.8% $182,5 $171,945 6.1% Average Sale Price Dollar Volume $254,582 $239,736 6.2% $7.4 Billion $6.3 Billion 16.3% Median Percent
Summary Statistics. Closed Sales. Paid in Cash. Median Sale Price. Average Sale Price. Dollar Volume. Median Time to Sale.
 ly Market Detail - Q1 215 Summary Statistics Q1 215 Q1 214 Paid in Cash 57,742 49,845 15.8% 23,724 23,51.9% $182, $168, 8.3% Average Sale Price Dollar Volume $266,453 $256,477 3.9% $15.4 Billion $12.7
Summary Statistics. Closed Sales. Paid in Cash. Median Sale Price. Average Sale Price. Dollar Volume. Median Time to Sale.
 ly Market Detail - Q3 215 Summary Statistics Q3 215 Q3 214 Paid in Cash 28,458 26,35 8.2% 16,918 17,16 -.6% $15, $138, 8.7% Average Sale Price Dollar Volume $221,755 $213,948 3.6% $6.3 Billion $5.6 Billion
WISCONSIN HOUSING MARKETPLACE
 WISCONSIN REALTORS ASSOCIATION WISCONSIN HOUSING MARKETPLACE Date: 2/16/06 For Release: Immediately For More Information Contact: David E. Clark, Economist C3 Statistical Solutions Inc. Office phone: 414-803-6537
DATA FOR JANUARY Published Feburary 16, Sales are down -14.0% month-over-month. The year-over-year comparison is up +2.5%.
 Permission is granted only to ARMLS Subscribers for reproduction with attribution on to ARMLS COPYRIGHT 2018. For questions regarding this publication contact Brand@ARMLS.com. DATA FOR JANUARY 2018 - Published
By several measures, homebuilding made a comeback in 2012 (Figure 6). After falling another 8.6 percent in 2011, single-family
. After falling another 8.6 percent in 2011, single-family") 2 Housing Markets With sales picking up, low inventories of both new and existing homes helped to firm prices and spur new single-family construction in 212. Multifamily markets posted another strong year,
2 Housing Markets With sales picking up, low inventories of both new and existing homes helped to firm prices and spur new single-family construction in 212. Multifamily markets posted another strong year,
FOR IMMEDIATE RELEASE Contact: Bobette Banks Director of Communications Greater Capital Area Association of REALTORS
 FOR IMMEDIATE RELEASE Contact: Bobette Banks 301-590-8764 Director of Communications Greater Capital Area Association of REALTORS bbanks@gcaar.com November 2015 Washington, DC Market Trends Report Median
Summary Statistics. Closed Sales. Paid in Cash. Median Sale Price. Average Sale Price. Dollar Volume. Median Time to Sale.
 Summary Statistics November 218 November 217 Paid in Cash 2,578 19,983 3.% 5,338 5,372 -.6% $255, $24, 6.3% Average Sale Price Dollar Volume $331,711 $314,76 5.4% $6.8 Billion $6.3 Billion 8.5% Median
Summary Statistics. Closed Sales. Paid in Cash. Median Sale Price. Average Sale Price. Dollar Volume. Median Time to Sale.
 ly Market Detail - Q3 217 Summary Statistics Q3 217 Q3 216 Paid in Cash 67,787 71,723-5.5% 17,176 19,595-12.3% $24, $225, 6.7% Average Sale Price Dollar Volume $313,15 $293,766 6.6% $21.2 Billion $21.1
RESIDENTIAL MARKET ANALYSIS
 RESIDENTIAL MARKET ANALYSIS RMLS Student Fellow Master of Real Estate Development Candidate Many of the single family housing trends in the second quarter of 2017 bounced upwards following a continuation
HOUSING MARKET OUTLOOK: SAN LUIS OBISPO, CA AND SURROUNDING AREA
 HOUSING MARKET OUTLOOK: SAN LUIS OBISPO, CA AND SURROUNDING AREA GABE RANDALL SCOTT KELTING April15, 2009 National Market Overview April 15, 2009 2008: A Year in Review Starting between 1999 and 2000,
Sarasota/Manatee Housing Market Still Tipped Toward Sellers
 FOR IMMEDIATE RELEASE Realtor Association of Sarasota and Manatee Contact: Kathy Roberts (941) 952-343 kathy@myrasm.com Sarasota/Manatee Housing Market Still Tipped Toward Sellers SARASOTA, Fla. (May 24,