FY General Revenue Forecast Presentation
|
|
|
- Isaac Potter
- 6 years ago
- Views:
Transcription


1 FY General Revenue Forecast Presentation Steven A. Solomon Director of Finance February 18, 2014
2 Overview Current Economic Outlook National State Local FY nd Quarter Revenue Update Five Year Revenue Forecasting Process FY Revenue Forecast Residential Real Estate Tax Revenue Commercial Real Estate Tax Revenue Personal Property Tax Revenue Sales Tax Revenue All Other Revenue Summary 2
3 CURRENT ECONOMIC OUTLOOK 3


4 Current Economic Situation: National S & P 500, S&P 500: Closed at 1, on Dec. 31, 2013; Up 168% from 2009 bottom; lost some ground to start out 2014 GDP: 3.2% in 4 th Quarter 2013 (prel.), following 4.1% in 3 rd Quarter; strengthening economy despite continued sequestration and federal government shutdown in October U.S. Unemployment Rate: 6.6% in Jan. 2014, compared to 7.9% one year earlier; 1.37 million net new jobs in 2013 First time unemployment claims: currently bounded between 325,000 and 350,000, a slight improvement over 2013 New home sales: total sales in 2013 increased 16.3% to 428,000 from 368,000 in 2012; still well below pre-recession levels Retail sales: increased 2.4% annually in December; if consumers continue to be willing to spend, consumption gains could be one of the leading contributors to 2014 GDP growth 4

 y-o-y in Q2 CY 2013 Source: Virginia Employment Commission Average")


5 Current Economic Situation: State Unemployment at 4.8% in December 2013 compared to 5.4% one year earlier Employment grew by over 30,000 (0.8%) y-o-y in Q2 CY 2013 Source: Virginia Employment Commission Average weekly wages increased 1.7% y-o-y in Q2 CY 2013 Total state general fund revenue collections exceeded the forecast by $263.6 million in fiscal year Total revenues rose 5.3 percent, ahead of the revised annual forecast of 3.6 percent growth Source: Virginia Employment Commission Source: Virginia Secretary of Finance Source: Virginia Employment Commission 5
6 Current Economic Situation: State Currently the Commonwealth does two-year revenue forecasts The state s FY revenue forecast has been reduced by $140M FY 14 General Fund revenue estimates were reduced by $125 million FY 15 General Fund revenue estimates were reduced by $15 million This revision was based on updated economic information and actual revenue collections through January 31, 2014 Year-to-date collections fell.5% from last year, compared to the December forecast for 1.7% growth The two primary revenue classes that led to this decline are nonwithholding individuals (primarily self-employed) and corporate income taxes This will impact the Commonwealth budget process this year 6

 up 3.9% y-o-y 12.")


 compared to 9.")

7 Current Economic Situation: Local Source: Virginia Employment Commission Unemployment Rate: 4.3% December 2013 compared to 4.5% in December a year earlier and still below the nation and state rates At-place employment (117,965 in Q2 CY 2013) up 3.9% y-o-y 12.5% since 2008 Housing market values are moving toward a more sustainable growth rate inventory still down. Average sale price, Dec. 2013: $335, % increase y-o-y 2013 foreclosures (632) down 81% since 2009 peak; down 33% y-o-y Office, Industrial and Flex commercial vacancy rates improving, Retail vacancy slightly higher, y-o-y. Total vacancy rate (8.4% in December 2013) compared to 9.0% one year earlier; total new construction continues at a generally reduced level from peak Sales tax revenue growth experienced slight decline due to uncertainty caused by sequestration and the Federal government shutdown Source:. Wm. Co. Courthouse Source: MRIS Source: Pr. Wm. Co. Finance Dept. 7


8 Current Economic Situation: PWC Residential Real Estate Market 8
9 History of Residential Real Estate Assessment Changes in Prince William County 30% 25% 20% 15% 10% 5% 0% -5% -10% -15% -20% 13.13% -1.79% Actual Residential Appreciation FY15-19 Forecast 17.47% 27.20% 0.10% 5.24% 4.70% 2.77% -25% -30% -35% Average Residential Real Estate Appreciation 4.5% CPI (Balt/Wash metro area), Avg. 3.1% % CY84, FY86 CY85, FY87 CY86, FY88 CY87, FY89 CY88, FY90 CY89, FY91 CY90, FY92 CY91, FY93 CY92, FY94 CY93, FY95 CY94, FY96 CY95, FY97 CY96, FY98 CY97, FY99 CY98, FY00 CY99, FY01 CY00, FY02 CY01, FY03 CY02, FY04 CY03, FY05 CY04, FY06 CY05, FY07 CY06, FY08 CY07, FY09 CY08, FY10 CY09, FY11 CY10, FY12 CY11, FY13 CY12, FY14 CY of Value, FY of Revenue 9
10 FY 2014 SECOND QUARTER REVENUE UPDATE 10
11 FY nd Quarter Revenue Update June 30, 2014 Projected (Amounts in millions) Prior Year FISCAL YEAR 2014 Category of FY 13 1st Qtr. 2nd Qtr. Net % from General Revenues Year-End Revised Revised Adopted Variance Adopted Real Estate Taxes $516.4 $538.6 $537.1 $538.6 $ % Personal Property Taxes % Sales Tax % Consumer Utility Tax % Communications Tax % BPOL Tax % Investment Income % All Other % General Property Taxes: -0.20% Variance Other Revenue Sources -1.22% Variance Total General Revenues $788.9 $824.5 $821.4 $824.5 $ % 11
12 FIVE YEAR REVENUE FORECASTING PROCESS 12
13 Multi-Year Revenue Forecasting PWC does multi-year revenue and expenditure forecasts through the Five Year Plan The FY forecast was developed in January 2013 that is the revenue projection we are now updating GFOA referred to this as a best practice that should be adopted by other local governments in the United States Currently the Commonwealth does two year revenue forecasts Every other local government jurisdiction in this region does one year forecasting Those jurisdictions see the FY 15 projection for the first time when their FY 15 budget is presented 13
14 Revenue Forecasting Process BOCS Adopts a Tax Policy Identify Major Revenue Sources Ongoing Analysis of U.S., State, and Local Trends Bring in Knowledgeable Partners Developing Projections Data driven Conservative assumptions Monitor Trends 14


15 Identify The Revenue Sources 17.74% 1.62% 2.23% 2.89% 0.81% 6.91% 64.99% 2.81% Real Estate Taxes Personal Property Taxes Sales Tax Consumer Utility Tax Communications Sales Tax BPOL Tax Investment Income All Other Revenue Real Estate, Personal Property, and Sales Taxes Comprise Over 89% of Prince William County Revenue 15

16 Develop a Process To Become Knowledgeable About Local, State and National Economic Trends JOBS RELATED DATA PRODUCTION/INVENTORY DATA HOUSING SALES GOVERNMENT / GDP PRICES / EX-IM 16
17 Internal and External Partners in Developing a Revenue Forecast State Economists Association of Realtors Federal Reserve Bank of Richmond Local Builders Industry Assoc. FINANCE STAFF Commercial Real Estate Brokers Auto Industry Budget Development Services Economic Development Planning Public Works Schools Retail Industry 17
18 Residential Real Estate Assessments The Virginia Constitution requires properties to be assessed at fair market value as of January 1 (tax year) Board cannot adopt separate rates for residential and commercial real estate Metropolitan Regional Information Systems (MRIS) is the service the County uses to monitor residential sales throughout the year The Assessments Office continuously studies the sales market and collects information about properties to estimate fair market value as of January 1 of each year 18
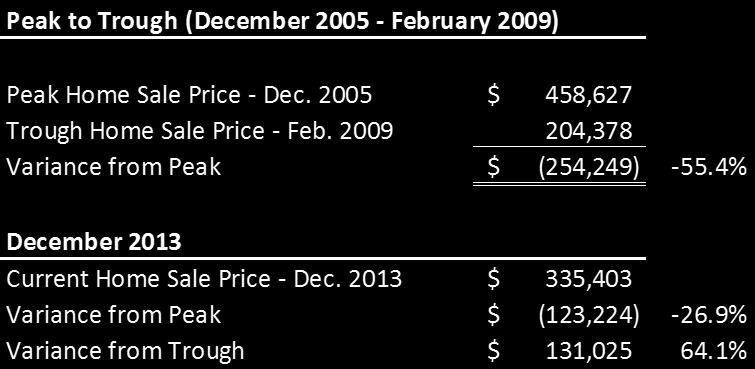
19 Residential Real Estate Assessments Sales occurring from January 1 st to December 31 st of each year are analyzed to determine if market values of residential properties should change Since the assessment is as of January 1 st, sales occurring in the last quarter of the year are weighted more heavily December 2013 average sales price ($335,403) were higher than the average of all other months 19
20 Developing Projections: Real Estate Revenue Drivers Equalization (change in value of existing properties) Residential (tax policy) Commercial (retail, office, industrial, flex) Apartments Agricultural Growth (new value added through construction) New residential units constructed Value of new residential units Square footage of new commercial construction completed Value of new construction per square foot 20
21 Developing Projections: Residential Revenue Drivers Real Estate Market Metrics Average Sales Price Average Number of Days on the Market Ratio of Active Listings to Sales (Months of Inventory) Foreclosures External Factors 30-Year Mortgage Rates Unemployment rate Credit environment 21
 Number of days on market Inventory to sales ratio Percentage of sales using financing Percentage of")
22 Real Estate Revenue Monitoring Sales price vs. assessed values Sales volume Foreclosures Real estate market metrics (MRIS) Number of days on market Inventory to sales ratio Percentage of sales using financing Percentage of sales price to list price Market stratification data Average sales price Residential Financing PWC December, 2013 Source: MRIS.com 22
23 Commercial Real Estate Assessments The Virginia Constitution requires properties to be assessed at fair market value as of January 1 (tax year) The frequency of sales of comparable properties are not as prevalent in the commercial market as they are in the residential market As a result, Prince William County utilizes the income approach to valuing commercial property National and regional capitalization rate information is analyzed to determine if market values of income producing properties should change Income & expense information is gathered from County businesses to assess their market value Lease rates are valued at the market rate as of January 1 of the tax year 23
24 Developing Projections: Commercial Revenue Drivers Commercial Real Estate Market Metrics Vacancy rates Lease rates per sq. ft. Prevailing capitalization rates Size and composition of commercial pipeline Income and expense data for each commercial property Market sales Additional weighting is given to information received closest to the valuation date (January 1) 24
25 Residential vs Commercial Assessments Residential Values Average sales price Average number of days on the market Ratio of active listings to sales (months of inventory) Foreclosures Commercial Values Vacancy rates Lease rates per sq. Ft. Prevailing capitalization rates Size and composition of commercial pipeline Income and expense data for each commercial property Market sales 25

26 FY REVENUE FORECAST 26
27 Current Situation: Residential Values Housing values for existing residential properties were higher than anticipated this year Housing values are recouping value lost in the recession Reasons for increasing values of existing residential real estate: Low inventory and strong demand particularly under $450K price point Fast home turnover 39 days on average Slow growth in new housing units PWC homes still have an affordability advantage relative to most nearby jurisdictions Residential values appear to be growing faster than surrounding jurisdictions January 2013 forecast of residential value appreciation for FY % January 2014 projection forecast of residential value appreciation for FY % 27
28 Current Situation: New Residential Growth New residential growth is less than previously forecasted The price point spread between existing and new home values is still very wide January 2013 forecast of new residential units for FY 15 1,260 January 2014 forecast of new residential units for FY 15 1,201 New residential growth is now expected to be lower throughout the five year plan than previously forecasted 28
29 Current Situation: Commercial Values Commercial values grew at a slower rate than previously forecasted Values in the Office space were weaker than expected regionwide Retail values did not advance as much as projected Among a group with unusually divergent commercial vacancy trends, PWC has the lowest rate at 8.9% January 2013Forecast of Commercial Value Appreciation for FY % January 2014 Forecast of Commercial Value Appreciation for FY % 29
30 FY Real Estate Revenue Forecast ($ in 000s) FY 14 FY 15 FY 16 FY 17 FY 18 FY 19 Real Estate Taxes ($ in 000s) $537,072 $550,239 $570,560 $592,219 $614,106 $637,252 Percent Change in Revenue 4.00% 2.45% 3.69% 3.80% 3.70% 3.77% Residential Appreciation 4.70% 7.50% 5.00% 3.50% 3.50% 3.50% New Residential Units 1,205 1,201 1,200 1,250 1,300 1,350 Commercial Appreciation 5.00% 2.50% 3.00% 3.00% 3.00% 3.00% New Commercial S.F. 969, , , , , ,000 Apartment Appreciation 12.60% 5.00% 5.00% 5.00% 5.00% 5.00% New Apartment Units ,243 1,

31 Projected New Apartment Unit Production 31
32 History of Residential Real Estate (Includes Projection) 30% 27.20% 25% 20% 17.47% 15% 10% 5% 13.13% 5.24% 7.50% 4.70% 0% 0.10% 2.77% -5% -1.79% -10% -15% -20% -25% -30% -35% Actual Residential Appreciation FY15-19 Forecast Average Residential Real Estate Appreciation 4.5% CPI (Balt/Wash metro area), Avg. 3.1% % CY84, FY86 CY85, FY87 CY86, FY88 CY87, FY89 CY88, FY90 CY89, FY91 CY90, FY92 CY91, FY93 CY92, FY94 CY93, FY95 CY94, FY96 CY95, FY97 CY96, FY98 CY97, FY99 CY98, FY00 CY99, FY01 CY00, FY02 CY01, FY03 CY02, FY04 CY03, FY05 CY04, FY06 CY05, FY07 CY06, FY08 CY07, FY09 CY08, FY10 CY09, FY11 CY10, FY12 CY11, FY13 CY12, FY14 CY13, FY15 CY14, FY16 CY15, FY17 CY16, FY18 CY17, FY19 CY of Value, FY of Revenue 32
33 Personal Property Tax Drivers Average value of vehicles located in the county Number of additional vehicles entering the county Business equipment replacement rate 33
34 Current Situation Personal Property Tax Revenue Average assessment increase fell from 2.89% to 0.50% in the Preliminary forecast due to the overall national acceleration in the sale of new autos which brought the value of used cars down Units increased modestly, however still not at the levels of the early 2000s FY 15 remains at 8,000 units FY 16 increased from 7,500 to 9,790 FY increased from 7,500 to 8,000 34
35 FY Personal Property Revenue Forecast ($ in 000s) FY 14 FY 15 FY 16 FY 17 FY 18 FY 19 Personal Property Taxes $ 146,860 $ 150,180 $ 158,250 $ 165,820 $ 173,690 $ 181,870 Percent Change in Revenue 8.16% 2.26% 5.37% 4.78% 4.75% 4.71% Assessed Value Growth 1.66% 0.50% 2.84% 2.84% 2.84% 2.84% Billable Unit Growth 2.90% 2.43% 2.91% 2.31% 2.25% 2.21% Business Tangible 5.41% 2.50% 2.50% 2.00% 2.00% 2.00% 35
36 Sales Tax Drivers Consumer spending habits Median household income Population growth or contraction Inflation Number of businesses 36
37 Current Situation Sales Tax Revenue Adopted sales tax revenue increase of 4% for FY 15 has been reduced to 3% in the preliminary forecast Summer months showed some weakening in the consistency and strength of the upward trend that had been in place for over 3 years The longer term local impacts of the government shutdown and sequestration are still not certain 37
38 FY All Other Revenue Forecast ($ in 000s) FY 14 FY 15 FY 16 FY 17 FY 18 FY 19 Sales Tax $ 56,825 $ 58,525 $ 60,280 $ 62,090 $ 63,950 $ 65,870 %Change 3.0% 3.0% 3.0% 3.0% 3.0% 3.0% Consumer Utility Tax $ 13,566 $ 13,700 $ 13,910 $ 14,190 $ 14,540 $ 14,900 %Change 0.6% 1.0% 1.5% 2.0% 2.5% 2.5% Communication Tax $ 18,720 $ 18,910 $ 19,290 $ 19,670 $ 20,070 $ 20,470 % Growth 1.0% 1.0% 2.0% 2.0% 2.0% 2.0% BPOL Tax $ 23,658 $ 24,427 $ 25,221 $ 26,041 $ 26,887 $ 27,761 %Change 3.3% 3.3% 3.3% 3.3% 3.2% 3.3% Investment Income $ 6,430 $ 6,831 $ 7,247 $ 7,676 $ 8,120 $ 8,578 %Change -23.3% 6.2% 6.1% 5.9% 5.8% 5.6% All Other $ 23,290 $ 23,802 $ 24,384 $ 24,970 $ 25,614 $ 26,262 %Change -5.4% 2.2% 2.4% 2.4% 2.6% 2.5% 38
39 Changes in Revenue Drivers Jan Jan Forecast Forecast for FY 15 for FY 15 Residential Value 3.5% 7.5% Commercial Value 3.0% 2.5% Personal Property 2.9% 0.5% Sales Tax Revenue 4.0% 3.0% Tax Rate $1.170 $1.126 Avg. Residential Tax Bill Increase 2.5% 2.50% Avg. Commercial Tax Bill Increase 2.0% -2.3% 39
40 Impact of Real Estate Market Value Changes and the Tax Policy on the Revenue Forecast To keep average residential tax bills growing at just 2.5% require 5.5 cent tax rate reduction New lower tax rate is applied to all commercial and residential property Result is a reduction in most commercial tax bills Result is a reduction in projected commercial revenue in FY 15 of 4.64% and an average commercial tax bill decrease of 2.3% 40
41 Preliminary Revenue Projected Reductions for County and Schools Both the County and Schools have had to rebalance their Five Year Plans at the reduced projected revenue amounts The County s rebalancing is reflected in the Proposed FY Five Year Plan Total General Revenue FY 15 FY 16 FY 17 FY 18 FY 19 TOTAL School $ (8,748,916) $ (9,217,208) $ (9,542,497) $ (10,963,821) $ (12,168,027) $ (50,640,469) County (6,470,374) (6,783,346) (6,988,445) (7,803,651) (8,795,597) (36,841,413) CHANGE LOSS IN IN REVENUE $ (15,219,290) $ (16,000,554) $ (16,530,942) $ (18,767,472) $ (20,963,624) $ (87,481,882) 41
42 Summary Housing values are recouping value lost in the recession Low inventory and strong demand particularly under $450K price point Fast home turnover 39 days on average Slow growth in new housing units PWC homes still have an affordability advantage relative to most nearby jurisdictions Commercial values grew less than projected Values in the Office space were weaker than expected region-wide Retail values did not advance as much as projected Apartment appreciation projected at 5% over the five year plan with projected new construction in FY 16 of over 2,200 units Personal Property did not appreciate as much as expected due to the reduction in value of used cars Sales Tax revenue growth slowed its upward trend that had been in place for over 3½ years Investment income is projected to remain constrained given market conditions and Federal monetary policy 42
43 FY Revenue Forecast BOCS Guidance: 2.5% Tax Bill Increase Real Estate Tax Rate: $1.181 $1.126 $1.099 $1.088 $1.078 $1.068 % to Total FY 2014 ($ in 000s) (FY 2015) Revised Est. FY 2015 FY 2016 FY 2017 FY 2018 FY 2019 Real Estate Taxes 64.99% $537,072 $550,239 $570,560 $592,219 $614,106 $637,252 Personal Property Taxes 17.74% 146, , , , , ,870 Sales Tax 6.91% 56,825 58,525 60,280 62,090 63,950 65,870 Consumer Utility Tax 1.62% 13,566 13,700 13,910 14,190 14,540 14,900 Communications Sales Tax 2.23% 18,720 18,910 19,290 19,670 20,070 20,470 BPOL Tax 2.89% 23,658 24,427 25,221 26,041 26,887 27,761 Investment Income 0.81% 6,430 6,831 7,247 7,676 8,120 8,578 All Other 2.81% 23,290 23,803 24,385 24,970 25,614 26,262 Total General Revenue % $826,421 $846,614 $879,142 $912,676 $946,977 $982,963 Increase over Prior Year 2.44% 3.84% 3.81% 3.76% 3.80% School Portion $469,030 $480,508 $499,024 $518,112 $537,616 $558,081 County Portion 352, , , , , ,106 Transportation Fund 5,081 5,182 5,312 5,445 5,608 5,776 Total General Revenue $826,421 $846,614 $879,142 $912,676 $946,977 $982,963 43
Housing Price Forecasts. Illinois and Chicago PMSA, January 2019
 Housing Price Forecasts Illinois and Chicago PMSA, January 2019 Presented To Illinois Realtors From R E A L Regional Economics Applications Laboratory, Institute of Government and Public Affairs University
ECONOMIC CURRENTS. Vol. 4, Issue 3. THE Introduction SOUTH FLORIDA ECONOMIC QUARTERLY
 ECONOMIC CURRENTS THE Introduction SOUTH FLORIDA ECONOMIC QUARTERLY Vol. 4, Issue 3 Economic Currents provides an overview of the South Florida regional economy. The report presents current employment,
ANALYSIS OF THE CENTRAL VIRGINIA AREA HOUSING MARKET 1st quarter 2013 By Lisa A. Sturtevant, PhD George Mason University Center for Regional Analysis
 ANALYSIS OF THE CENTRAL VIRGINIA AREA HOUSING MARKET 1st quarter By Lisa A. Sturtevant, PhD George Mason University Center for Regional Analysis Economic Overview Key economic factors in the first quarter
Housing Price Forecasts. Illinois and Chicago PMSA, March 2018
 Housing Price Forecasts Illinois and Chicago PMSA, March 2018 Presented To Illinois Realtors From R E A L Regional Economics Applications Laboratory, Institute of Government and Public Affairs University
Housing Price Forecasts. Illinois and Chicago PMSA, January 2018
 Housing Price Forecasts Illinois and Chicago PMSA, January 2018 Presented To Illinois Realtors From R E A L Regional Economics Applications Laboratory, Institute of Government and Public Affairs University
Pikes Peak area housing Market Statistics (As of: 2/28/2018)
") Jan-1-1 -1-1 Jan-2-2 -2-2 Jan-3-3 -3-3 -4-4 -4-5 -5-5 -6-6 -6-7 -7-7 -8-8 -8-9 -9-9 -1-1 -1-11 -11-11 -12-12 -12-13 -13-13 -14-14 -14-15 -15-15 -16-16 -16-17 -17-17 Jan-1-1 -1-1 Jan-2-2 -2-2 Jan-3-3 -3-3
Jan-1-1 -1-1 Jan-2-2 -2-2 Jan-3-3 -3-3 -4-4 -4-5 -5-5 -6-6 -6-7 -7-7 -8-8 -8-9 -9-9 -1-1 -1-11 -11-11 -12-12 -12-13 -13-13 -14-14 -14-15 -15-15 -16-16 -16-17 -17-17 Jan-1-1 -1-1 Jan-2-2 -2-2 Jan-3-3 -3-3
Pikes Peak area housing Market Statistics (As of: 9/30/2018)
") $156,25 $184, $174,697 $177,2 $21,53 $185,83 $173, $178,29 $172,25 $212,75 $21,95 $226,692 $197,5 $199, $196, $28, $25, $223,95 $216,75 $29,527 $234,9 $218,82 $229,74 $235,518 $231,457 $255, $259,11 $269,98
$156,25 $184, $174,697 $177,2 $21,53 $185,83 $173, $178,29 $172,25 $212,75 $21,95 $226,692 $197,5 $199, $196, $28, $25, $223,95 $216,75 $29,527 $234,9 $218,82 $229,74 $235,518 $231,457 $255, $259,11 $269,98
INLAND EMPIRE REGIONAL INTELLIGENCE REPORT
 INLAND EMPIRE REGIONAL INTELLIGENCE REPORT June 2016 EMPLOYMENT After a slow start to 2016, the Inland Empire s labor market returned to form, in recent job figures. Seasonally adjusted nonfarm employment
ECONOMIC CURRENTS. Vol. 3, Issue 1. THE SOUTH FLORIDA ECONOMIC QUARTERLY Introduction
 ECONOMIC CURRENTS THE SOUTH FLORIDA ECONOMIC QUARTERLY Introduction Economic Currents provides an overview of the South Florida regional economy. The report contains current employment, economic and real
ECONOMIC CURRENTS. Vol. 3, Issue 3 SOUTH FLORIDA ECONOMIC QUARTERLY. Introduction
 ECONOMIC CURRENTS THE Introduction SOUTH FLORIDA ECONOMIC QUARTERLY Economic Currents provides an overview of the South Florida regional economy. The report presents current employment, economic and real
San Francisco Housing Market Update
 San Francisco Housing Market Update California Economic and Housing Market Outlook The national economy maintained a healthy growth rate in the first quarter of 2005 and appeared to be settling in for
Economic Indicators City of Oakland
 Economic Indicators City of Oakland PREPARED BY: THE OFFICE OF ECONOMIC AND WORKFORCE DEVELOPMENT CITY OF OAKLAND JULY 2014 CITY OF OAKLAND ECONOMIC INDICATORS 1 Introduction to Quarter 1, January March
Housing Price Forecasts. Illinois and Chicago PMSA, April 2018
 Housing Price Forecasts Illinois and Chicago PMSA, April 2018 Presented To Illinois Realtors From R E A L Regional Economics Applications Laboratory, Institute of Government and Public Affairs University
Housing Price Forecasts. Illinois and Chicago PMSA, October 2014
 Housing Price Forecasts Illinois and Chicago PMSA, October 2014 Presented To Illinois Association of Realtors From R E A L Regional Economics Applications Laboratory, Institute of Government and Public
ECONOMIC CURRENTS. Vol. 5 Issue 2 SOUTH FLORIDA ECONOMIC QUARTERLY. Key Findings, 2 nd Quarter, 2015
 ECONOMIC CURRENTS THE Introduction SOUTH FLORIDA ECONOMIC QUARTERLY Economic Currents provides an overview of the South Florida regional economy. The report presents current employment, economic and real
Housing Price Forecasts. Illinois and Chicago PMSA, May 2018
 Housing Price Forecasts Illinois and Chicago PMSA, May 2018 Presented To Illinois Realtors From R E A L Regional Economics Applications Laboratory, Institute of Government and Public Affairs University
INLAND EMPIRE REGIONAL INTELLIGENCE REPORT. School of Business. April 2018
 INLAND EMPIRE REGIONAL INTELLIGENCE REPORT April 2018 Key economic indicators suggest that the Inland Empire s economy will continue to expand throughout the rest of 2018, building upon its recent growth.
Weekly Market Activity Report
 Weekly Market Report A RESEARCH TOOL FROM THE MINNEAPOLIS AREA ASSOCIATION OF REALTORS BROUGHT TO YOU BY THE UNIQUE DATA-SHARING TRADITIONS OF THE REALTOR COMMUNITY For Week Ending June 30, 2018 Publish
MARKET AREA UPDATE Report as of: 1Q 2Q 3Q 4Q
 MARKET AREA UPDATE Report as of: 1Q 2Q 3Q 4Q Year: 2013 Market Area (City, State): Washington DC Metropolitan Area Provided by (Company / Companies): LONG & FOSTER REAL ESTATE, INC. What are the most significant
Economic Highlights. Payroll Employment Growth by State 1. Durable Goods 2. The Conference Board Consumer Confidence Index 3
 August 26, 2009 Economic Highlights Southeastern Employment Payroll Employment Growth by State 1 Manufacturing Durable Goods 2 Consumer Spending The Conference Board Consumer Confidence Index 3 Real Estate
February 2016 Loudoun County Market Trends Report Contracts and sales activity jump double-digits; Inventories down 15.5 percent
 FOR IMMEDIATE RELEASE Contact: Christine Windle 703-777-2468, cwindle@dullesarea.com Sponsored by: Access National Bank Tom Ciolkosz, (703) 871-1045, tciolkosz@accessnationalbank.com Patty Foster, 703-871-1014,
Housing Price Forecasts. Illinois and Chicago PMSA, June 2012
 Housing Price Forecasts Illinois and Chicago PMSA, June 2012 Presented To Illinois Association of REALTORS From R E A L Regional Economics Applications Laboratory, Institute of Government and Public Affairs
2015 First Quarter Market Report
 2015 First Quarter Market Report CAAR Member Copy Expanded Edition Charlottesville Area First Quarter 2015 Highlights: Median sales price for the region was up 5.1% over Q1-2014, rising from $244,250 to
Housing Price Forecasts. Illinois and Chicago PMSA, March 2019
 Housing Price Forecasts Illinois and Chicago PMSA, March 2019 Presented To Illinois Realtors From R E A L Regional Economics Applications Laboratory, Institute of Government and Public Affairs University
Housing Price Forecasts. Illinois and Chicago PMSA, March 2016
 Housing Price Forecasts Illinois and Chicago PMSA, March 2016 Presented To Illinois Association of Realtors From R E A L Regional Economics Applications Laboratory, Institute of Government and Public Affairs
FOR IMMEDIATE RELEASE Contact: Brenda Morton Dulles Area Association of REALTORS
 FOR IMMEDIATE RELEASE Contact: Brenda Morton 703 777 2468 Dulles Area Association of REALTORS bmorton@dullesarea.com February 2018 Loudoun County Market Trends Report Inventory reaches yet another record
Housing Price Forecasts. Illinois and Chicago PMSA, August 2016
 Housing Price Forecasts Illinois and Chicago PMSA, August 2016 Presented To Illinois Association of Realtors From R E A L Regional Economics Applications Laboratory, Institute of Government and Public
nd Quarter Market Report
 2015 2 nd Quarter Market Report The voice of real estate in Central Virginia CAAR Member Copy Expanded Edition Charlottesville Area 2 nd Quarter 2015 Highlights: Closed sales in the Greater Charlottesville
HOUSING OUTLOOK MID-YEAR 2013
 DELTA ASSOCIATES WASHINGTON AREA HOUSING OUTLOOK MID-YEAR 213 MARKET INDICATORS Washington Metro Area At 2 nd Quarter 213 Figure 1 Q2 AVG. SALES PRICE CHANGE VS. Q1 213 *Sales pace at June 213. Pace is
Housing and Economy Market Trends
 Housing and Economy Market Trends Mainstreet Organization Prices of single-family, detached homes in suburban Chicago increased 12.1 percent in May 2014 compared with the same period a year ago. Overall,
January 2018 Loudoun County Market Trends Report Inventory has another record low month; home sales continue to decline compared to last year.
 FOR IMMEDIATE RELEASE Contact: Brenda Morton 703 777 2468 Dulles Area Association of REALTORS bmorton@dullesarea.com January 2018 Loudoun County Market Trends Report Inventory has another record low month;
Market Research. Market Indicators
 colliers international LAS VEGAS, NV Market Research OFFICE Third Quarter 2009 Market Indicators Net Absorption Construction Rental Rate Q3-09 Q4-2009 Projected Clark County Economic Data Jul-09 Jul-08
CONTENTS. Executive Summary 1. Southern Nevada Economic Situation 2 Household Sector 5 Tourism & Hospitality Industry
 CONTENTS Executive Summary 1 Southern Nevada Economic Situation 2 Household Sector 5 Tourism & Hospitality Industry Residential Trends 7 Existing Home Sales 11 Property Management Market 12 Foreclosure
Housing Price Forecasts. Illinois and Chicago PMSA, March 2017
 Housing Price Forecasts Illinois and Chicago PMSA, March 2017 Presented To Illinois Realtors From R E A L Regional Economics Applications Laboratory, Institute of Government and Public Affairs University
Monthly Indicators + 5.9% - 6.6% + 8.1%
 ly Indicators A RESEARCH TOOL PROVIDED BY METRO MLS FOR ACTIVITY IN THE 4-COUNTY MILWAUKEE METROPOLITAN AREA 2019 Quick Facts Despite a strong U.S. economy, historically low unemployment and steady wage
Median Income and Median Home Price
 Homeownership Remains Unaffordable; Rental Affordability Showing Signs of Improvement Richard E. Taylor, Research Manager at MaineHousing MaineHousing has released the 217 Maine Homeownership and Rental
MULTIFAMILY 2012 MULTI-FAMILY HAMPTON ROADS MARKET REVIEW. Author. Data Analysis. Financial Support. Disclosure. Charles Dalton.
 HAMPTON ROADS MARKET REVIEW MULTIFAMILY Author Data Analysis Financial Support Disclosure Charles Dalton Real Data The E. V. Williams Center for Real Estate and Economic Development (CREED) functions and
Economic Indicators Quarter 3 City of Oakland
 Attachment B Economic Indicators Quarter 3 City of Oakland PREPARED BY: THE OFFICE OF ECONOMIC AND WORKFORCE DEVELOPMENT CITY OF OAKLAND DECEMBER 2014 September 16, 2014Sepseseee Introduction to Quarter
2018 Housing Market Outlook. Central Coast Realty Group Business Symposium February 22, 2018 Oscar Wei Senior Economist
 2018 Housing Market Outlook Central Coast Realty Group Business Symposium February 22, 2018 Oscar Wei Senior Economist Overview Economic Update California Housing Market Outlook Regional Housing Market
2018 Greater Toronto Area Economic Outlook
 2018 Greater Toronto Area Economic Outlook 1 HIGHLIGHTS Although the Canadian economy performed exceptionally well in the first half of, posting GDP growth of approximately 4.0%, it has slowed since then
State of the Nation s Housing 2008: A Preview
 State of the Nation s Housing 28: A Preview Eric S. Belsky Remodeling Futures Conference April 15, 28 www.jchs.harvard.edu The Housing Market Has Suffered Steep Declines Percent Change Median Existing
Vacancy Inches Higher, Despite Continued Absorption
 Research & Forecast Report GREATER PHOENIX OFFICE 1Q 2017 Vacancy Inches Higher, Despite Continued Absorption Key Takeaways > > Improving conditions in the Greater Phoenix office market took a pause in
May 2016 Loudoun County Market Trends Report Homes selling twice as fast as 2015 with re-emergence of seller s market
 FOR IMMEDIATE RELEASE Contact: Christine Windle 703-777-2468 Dulles Area Association of REALTORS cwindle@dullesarea.com Sponsored by: Access National Bank Tom Ciolkosz, (703) 871-1045, tciolkosz@accessnationalbank.com
Housing Bulletin Monthly Report
 January 21 1 Housing Bulletin Monthly Report Most new homes built in second half of 29 25, 2, 15, 1, 5, Dec 7 Jan 8 Feb 8 mar 8 apr 8 Alberta s 29 housing starts increased 72.8 per cent over 28, suggesting
Housing Price Forecasts. Illinois and Chicago PMSA, August 2017
 Housing Price Forecasts Illinois and Chicago PMSA, August 2017 Presented To Illinois Realtors From R E A L Regional Economics Applications Laboratory, Institute of Government and Public Affairs University
Washington, D.C. Metro Area December 2017 Housing Market Update
 Washington, D.C. Metro Area December 2017 Housing Market Update Washington D.C. Metro housing market closes out 2017 with record high December house price of $420,050; December inventories decline for
Rapid recovery from the Great Recession, buoyed
 Game of Homes The Supply-Demand Struggle Laila Assanie, Sarah Greer, and Luis B. Torres October 4, 2016 Publication 2143 Rapid recovery from the Great Recession, buoyed by the shale oil boom, has fueled
Austin-Round Rock Area Local Market Report, Fourth Quarter 2017
 -Round Rock Area Local Market Report, Fourth Quarter 2017 Today's Market $350,000 Median Price (Red Line) and One-year Price Growth 12% $300,000 $250,000 10% 8% 6% $200,000 4% $150,000 2% $100,000 $50,000
Has The Office Market Reached A Peak? Vacancy. Rental Rate. Net Absorption. Construction. *Projected $3.65 $3.50 $3.35 $3.20 $3.05 $2.90 $2.
 Research & Forecast Report OAKLAND METROPOLITAN AREA OFFICE Q1 Has The Office Market Reached A Peak? > > Vacancy remained low at 5. > > Net Absorption was positive 8,399 in the first quarter > > Gross
OVERALL MARKET ACTIVITY PROPERTIES TRACKED TOTAL
 MARKET SUMMARY The latest GDP data shows that the Canadian economy continues to slow, and despite the NAFTA/USMCA renegotiations effectively behind us, there remains a tremendous amount of economic and
HOUSING MARKET OUTLOOK Calgary CMA
 H o u s i n g M a r k e t I n f o r m a t i o n HOUSING MARKET OUTLOOK Calgary CMA C a n a d a M o r t g a g e a n d H o u s i n g C o r p o r a t i o n Date Released: Fall 2011 NEW HOME MARKET Total housing
Quick Facts. For Week Ending January 12, 2019 Publish Date: January 21, 2019 All comparisons are to % + 6.9% + 2.
 Weekly Market Report A RESEARCH TOOL FROM THE SAINT PAUL AREA ASSOCIATION OF REALTORS. BROUGHT TO YOU BY THE UNIQUE DATA-SHARING TRADITIONS OF THE REALTOR COMMUNITY For Week Ending January 12, 2019 Publish
Housing Price Forecasts. Illinois and Chicago PMSA, September 2016
 Housing Price Forecasts Illinois and Chicago PMSA, September 2016 Presented To Illinois Realtors From R E A L Regional Economics Applications Laboratory, Institute of Government and Public Affairs University
Houston Summer Retail. Office. July 2016 Commercial Markets. Independent Valuations for a Variable World Page 1. Summary Q1 Statistics
 July 2016 Commercial Markets In This Issue Commercial Markets Retail Office Industrial Multifamily Housing Trends Single Family Housing Lot Supply & New Home Data % 10% 8% 6% 4% 2% 0% Retail 2007 Q1 2008
Monthly Indicators % % % Activity Overview New Listings Pending Sales. Closed Sales. Days on Market Until Sale. Median Sales Price
 Monthly Indicators 2018 Residential real estate activity has been relatively slow in the first quarter of 2018, yet housing is proving its resiliency in a consistently improving economy. Some markets have
MARKET AREA UPDATE Report as of: 1Q 2Q 3Q 4Q
 MARKET AREA UPDATE Report as of: 1Q 2Q 3Q 4Q Year: 2013 Market Area (City, State): Arlington, Virginia Provided by (Company / Companies): McEnearney Associates, Inc. Realtors What are the most significant
Inner Perth Residential Market Report
 Inner Perth Residential Market Report MARCH QUARTER 2014 Inner Perth Residential Market Market Highlights While Western Australia will experience slowed short term growth as the state transitions from
Q B O S T O N M A R K E T R E P O R T
 Q 3 2 1 7 B O S T O N M A R K E T R E P O R T Introducing the Compass Q3 217 Greater Boston Market Report Page 2 Page 3 Page 5 Page 7 Page 8 Map of Coverage Area Single Family Overview Condo Overview Time
The State of the U.S. & Washington CRE Market: 2008 Review/2009 Outlook
 The State of the U.S. & Washington CRE Market: 2008 Review/2009 Outlook Copyright 2008 CoStar Group, Inc. All Rights Reserved. Although CoStar makes efforts to ensure the accuracy and reliability of the
Minneapolis St. Paul Residential Real Estate Index
 University of St. Thomas Minneapolis St. Paul Residential Real Estate Index Welcome to the latest edition of the UST Minneapolis St. Paul Residential Real Estate Index. The University of St Thomas Residential
Quick Facts. For Week Ending July 29, 2017 Publish Date: August 7, 2017 All comparisons are to % - 4.7% - 16.
 Weekly Market Report A RESEARCH TOOL FROM THE SAINT PAUL AREA ASSOCIATION OF REALTORS. BROUGHT TO YOU BY THE UNIQUE DATA-SHARING TRADITIONS OF THE REALTOR COMMUNITY For Week Ending July 29, 2017 Publish
Monthly Indicators + 0.5% + 3.7% + 4.0%
 Monthly Indicators A RESEARCH TOOL PROVIDED BY NORTH TEXAS REAL ESTATE INFORMATION SYSTEMS, INC. 2018 Many sellers and builders are in a good position for financial gains, as the economy continues to favor
Housing Bulletin Monthly Report
 August 21 Housing Bulletin Monthly Report 1 C a n a da s P r e li m i n a ry H o u s i n g S ta r t s s l i p i n J u ly Preliminary Housing St arts in Albert a* and Canada* July 28 to July 21 25, Canada
Housing Price Forecasts. Illinois and Chicago PMSA, December 2015
 Housing Price Forecasts Illinois and Chicago PMSA, December 2015 Presented To Illinois Association of Realtors From R E A L Regional Economics Applications Laboratory, Institute of Government and Public
Housing Price Forecasts. Illinois and Chicago PMSA, April 2013
 Housing Price Forecasts Illinois and Chicago PMSA, April 2013 Presented To Illinois Association of Realtors From R E A L Regional Economics Applications Laboratory, Institute of Government and Public Affairs
TOP-TIER REAL ESTATE REPORT
 TOP-TIER REAL ESTATE REPORT JAN 1 - JUN 30, 2015 TOP-TIER REAL ESTATE REPORT TABLE OF CONTENTS INTRODUCTION 3 NATIONAL SUMMARY 4 VANCOUVER 7 Vancouver Market Summary 8 Overall Market 11 Condominiums 13
Monthly Indicators + 7.3% + 6.6% + 8.3% Single-Family Market Overview Condo Market Overview New Listings Pending Sales.
 Monthly Indicators 2018 The three most prominent national market trends for residential real estate are the ongoing lack of abundant inventory, the steadily upward movement of home prices and year-over-year
REAL ESTATE AND THE ECONOMIC OUTLOOK THROUGH 2013:
 1 1 REAL ESTATE AND THE ECONOMIC OUTLOOK THROUGH 2013: Coping With A Different Kind Of Housing Recovery A Presentation To The Commercial Real Estate Education Summit Monrovia, California July 13, 2012
Housing Bulletin Monthly Report
 February 21 1 Housing Bulletin Monthly Report Housing Starts 25, 2, 15, 1, 5, Alberta Housing Starts up 5 per cent from 29 From February 29 to 21, preliminary housing starts increased 82.7 per cent across
Quarterly Housing Market Update
 Quarterly Housing Market Update An Overview New Hampshire s current housing market performance, as well as its overall economy, is slowly improving, with positives such as increasing employment and rising
Housing Price Forecasts. Illinois and Chicago PMSA, July 2016
 Housing Price Forecasts Illinois and Chicago PMSA, July 2016 Presented To Illinois Association of Realtors From R E A L Regional Economics Applications Laboratory, Institute of Government and Public Affairs
2019 Housing Market Forecast. Palos Verdes Peninsula AOR January 8, 2019 Jordan G. Levine Senior Economist
 2019 Housing Market Forecast Palos Verdes Peninsula AOR January 8, 2019 Jordan G. Levine Senior Economist Overview Good News: Economic fundamentals solid Homeownership still the dream Rates might not go
Washoe County. Quarterly Revenue and Economic Review
 Washoe County S p e c i a l p o i n t s o f i n t e r e s t : Property taxes were 5.3% lower than they were in the previous year Single Family Home permits were up 28.5% from last year Consolidated Taxes
Houston-Baytown-Sugar Land Area Local Market Report, First Quarter Median Price (Red Line) and One-year Price Growth 2016 Q1. Local Price Trends
 and One-year Price Growth 2016 Q1. Local Price Trends") -Baytown-Sugar Land Area Local Market Report, First Quarter 2016 Today's Market $250,000 Median Price (Red Line) and One-year Price Growth 15% $200,000 10% $150,000 5% $100,000 0% $50,000-5% $0 2007 2008
-Baytown-Sugar Land Area Local Market Report, First Quarter 2016 Today's Market $250,000 Median Price (Red Line) and One-year Price Growth 15% $200,000 10% $150,000 5% $100,000 0% $50,000-5% $0 2007 2008
Monthly Indicators + 3.5% + 3.0% % Activity Overview New Listings Pending Sales. Closed Sales. Days on Market Until Sale. Median Sales Price
 Monthly Indicators 218 Housing price bubble chatter has increased this summer, as market observers attempt to predict the next residential real estate shift. It is too early to predict a change from higher
By several measures, homebuilding made a comeback in 2012 (Figure 6). After falling another 8.6 percent in 2011, single-family
. After falling another 8.6 percent in 2011, single-family") 2 Housing Markets With sales picking up, low inventories of both new and existing homes helped to firm prices and spur new single-family construction in 212. Multifamily markets posted another strong year,
2 Housing Markets With sales picking up, low inventories of both new and existing homes helped to firm prices and spur new single-family construction in 212. Multifamily markets posted another strong year,
Residential Real Estate, Demographics, and the Economy
 Residential Real Estate, Demographics, and the Economy Presented to: Regional & Community Bankers Conference Yolanda K. Kodrzycki Senior Economist and Policy Advisor Federal Reserve Bank of Boston October
See Full Corridor Study Volumes I and II as separate attachments.
 See Full Corridor Study Volumes I and II as separate attachments. See Housing Values 2000-2010 and 2000-2013 as separate attachments. 2013 2 nd Quarter and Mid-Year Market Report The voice of real estate
Mueller. Real Estate Market Cycle Monitor Second Quarter 2018 Analysis
 Mueller Real Estate Market Cycle Monitor Second Quarter 2018 Analysis Real Estate Market Cycle analysis of 5 property types in 54 Metropolitan Statistical Areas (MSAs). Graphic Clarification! Point 11
Ontario Rental Market Study Results: Measuring the Supply Gap / Renovation Investment and the Role of Vacancy Decontrol
 Ontario Rental Market Study Results: Measuring the Supply Gap / Renovation Investment and the Role of Vacancy Decontrol AGENDA Measuring the Supply Gap Estimating Current Rental Demand in Ontario Drivers
+ 3.3% % + 8.4%
 ly Indicators A RESEARCH TOOL PROVIDED BY THE SANTA FE ASSOCIATION OF REALTORS INCLUDES ALL SINGLE FAMILY, CONDO AND TOWNHOME LISTINGS IN THE MLS Q2 2018 Housing markets across the nation are most assuredly
Monthly Indicators + 8.1% + 1.6% - 8.6%
 ly Indicators A RESEARCH TOOL PROVIDED BY THE CHARLOTTE REGIONAL REALTOR ASSOCIATION FOR MORE INFORMATION CONTACT A REALTOR 2014 Most local markets continue to recover from a soft patch earlier this year.
FOR IMMEDIATE RELEASE Contact: Brenda Morton Dulles Area Association of REALTORS
 FOR IMMEDIATE RELEASE Contact: Brenda Morton 703 777 2468 Dulles Area Association of REALTORS bmorton@dullesarea.com August 2018 Loudoun County Market Trends Report Despite persistent low inventory, sales
Multifamily Market Commentary February 2018
 Multifamily Market Commentary February 2018 2018 Multifamily Affordable Market Outlook A Long Way to Go Momentum in the overall multifamily sector will likely slow in 2018 due to elevated levels of new
Minneapolis St. Paul Residential Real Estate Index
 University of St. Thomas Minneapolis St. Paul Residential Real Estate Index Welcome to the latest edition of the UST Minneapolis St. Paul Residential Real Estate Index. The University of St Thomas Residential
2013 San Diego Economic Outlook. 29 th Annual Economic Roundtable Marney Cox Chief Economist San Diego Association of Governments January 25, 2013
 213 San Diego Economic Outlook 29 th Annual Economic Roundtable Marney Cox Chief Economist San Diego Association of Governments January 25, 213 US The Problem Slow Economic Growth Gross Domestic Product
Monthly Indicators - 5.1% + 3.6% % Market Overview New Listings Pending Sales. Closed Sales. Days on Market Until Sale. Median Sales Price
 Monthly Indicators 2015 In 2015, national residential real estate, by and large, had a good year. Supply and demand were healthy in an environment rife with low interest rates and improved employment.
2018 Housing Market Remains Strong Despite Limited Inventories
 Date: 1/21/19 For Release: Immediately For More Information Contact: Michael Theo, WRA President & CEO, 608-241-2047, mtheo@wra.org or David Clark, Economist, C3 Statistical Solutions and Professor of
Las Vegas Valley Executive Summary
 ARROYO MARKET SQUARE Las Vegas Valley Executive Summary Retail Market 4th Quarter 2013 THE DISTRICT AT GREEN VALLEY RANCH January 23, 2014 Re: Commercial Real Estate Survey: 4th Quarter, 2013 Dear Reader,
May 2018 Loudoun County Market Trends Report Tight inventory continues while price growth stagnates; Condo sales hit a record high.
 FOR IMMEDIATE RELEASE Contact: Brenda Morton 703 777 2468 Dulles Area Association of REALTORS bmorton@dullesarea.com May 2018 Loudoun County Market Trends Report Tight inventory continues while price growth
September 2018 Loudoun County Market Trends Report Inventory continues to tighten as prices increase and closed sales decline
 FOR IMMEDIATE RELEASE Contact: Brenda Morton 703 777 2468 Dulles Area Association of REALTORS bmorton@dullesarea.com September 2018 Loudoun County Market Trends Report Inventory continues to tighten as
Pulse. prince george s CONTENTS. Changes in Employment. Top Ten Changes in Employment 3rd Quarter 2014 to 3rd Quarter 2015
 M-NCPPC Prince George s County Planning Department APRIL 2016 VOL. 1, ISSUE 4 prince george s CONTENTS Pulse Employment and Wages... 2 Employment Private Sector Employment Total Wages Average Wage Per
Quick Facts. For Week Ending July 14, 2018 Publish Date: July 23, 2018 All comparisons are to % - 2.7% - 14.
 Weekly Market Report A RESEARCH TOOL FROM THE SAINT PAUL AREA ASSOCIATION OF REALTORS. BROUGHT TO YOU BY THE UNIQUE DATA-SHARING TRADITIONS OF THE REALTOR COMMUNITY For Week Ending July 14, 2018 Publish
Beaumont-Port Arthur Area Local Market Report, First Quarter 2017
 -Port Arthur Area Local Market Report, First Quarter 2017 Today's Market $180,000 Median Price (Red Line) and One-year Price Growth 20% $160,000 $140,000 $120,000 15% 10% $100,000 5% $80,000 0% $60,000
2013 Year-End Market Report
 2013 Year-End Market Report The voice of real estate in Central Virginia CAAR Member Copy Expanded Edition Charlottesville Area Year-End 2013 Highlights: Yearly home sales in Greater Charlottesville were
Phoenix Real Estate Outlook. May 2015
 Phoenix Real Estate Outlook May 2015 General Economy 2 Arizona & US Nonfarm Employment YTY % Change 240,600 jobs lost 208,400 jobs gained (87%) Source: ADOA 3 Arizona Jobs Regained Since Bottom of Cycle
Housing Indicators in Tennessee
 Housing Indicators in l l l By Joe Speer, Megan Morgeson, Bettie Teasley and Ceagus Clark Introduction Looking at general housing-related indicators across the state of, substantial variation emerges but
Housing Bulletin Monthly Report
 October 21 1 Housing Bulletin Monthly Report Housing Starts show Slight improvement in September CANADA Housing Starts 2, 15, 1, 5, Sep 8 Oct 8 Nov 8 Dec 8 Preliminary Housing Starts in Alberta and Canada
Monthly Indicators + 5.7% % % Market Overview New Listings Pending Sales. Closed Sales. Days on Market Until Sale. Median Sales Price
 Monthly Indicators 2018 The three most prominent national market trends for residential real estate are the ongoing lack of abundant inventory, the steadily upward movement of home prices and year-over-year
CALGARY REGIONAL HOUSING MARKET STATISTICS 12.14
 CALGARY REGIONAL HOUSING MARKET STATISTICS 12.14 Yearly records set as monthly sales see slight decline Condominium and townhouse sales set a new record for 214 Calgary, January 2, 215 It was a record