Housing Price Forecasts. Illinois and Chicago PMSA, October 2014
|
|
|
- Eugene Preston
- 5 years ago
- Views:
Transcription
1 Housing Price Forecasts Illinois and Chicago PMSA, October 2014 Presented To Illinois Association of Realtors From R E A L Regional Economics Applications Laboratory, Institute of Government and Public Affairs University of Illinois October 21, 2014
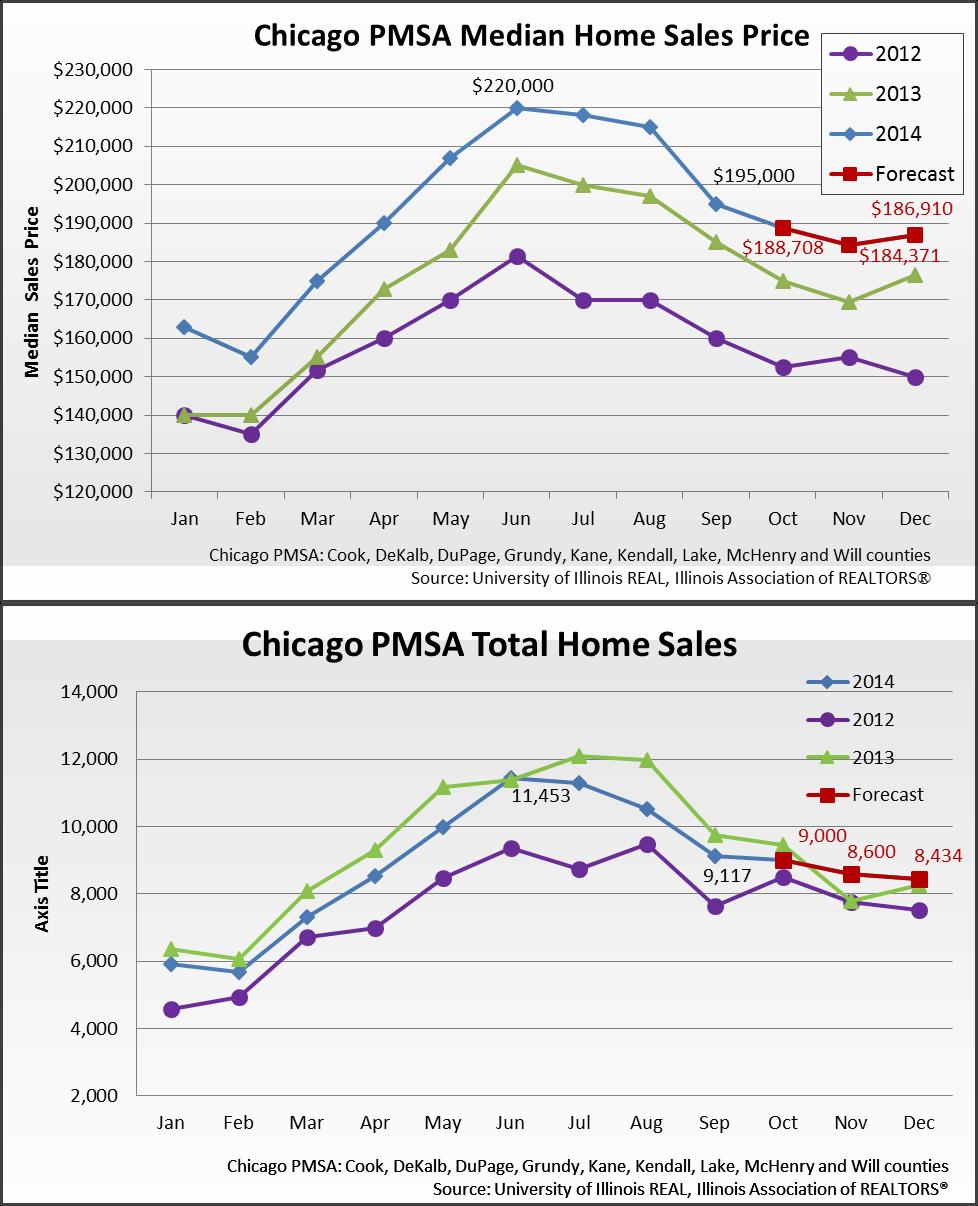
2 Housing Price Forecast: Illinois and Chicago PMSA, October 2014 The Housing Market In September, sales and median housing prices in Illinois and the Chicago PMSA both experienced milder annual changes compared to last month. Sales experienced the smallest year-over-year decrease since January ,879 houses were sold in Illinois, 4.4% less than a year ago. In the Chicago PMSA, 9,117 houses were sold, 6.4% less than last September. The median price experienced the smallest year-over-year increase since March The median price was $161,900 in Illinois, up 4.5% from September last year; the comparable figure for the Chicago PMSA was $195,000, up 5.4% from this time last year. The reduction in the declining rates for the total sales was mainly contributed by a smaller decrease in the regular sales. 7,495 regular sales were made in September, only a trivial 0.9% less than a year ago while foreclosed properties sold were 25.9% less than a year ago. The milder increase in the median prices is due to smaller growth in both regular and foreclosed property sales. The median price was $218,000 for regular property sales in Chicago, up 2.8% from September last year; the comparable figure for the foreclosed properties was $115,500, up 5.0% from this time last year. The sales forecast for October, November and December 2014 suggests an uptick on the annual basis but declines on the monthly basis. Annually, the three-month average forecasts point to a change of between 2.0% and 2.7% for Illinois; for the Chicago PMSA, the change will range from 1.7% to 2.3%. On a monthly basis, the three-month average sales are forecast to decrease by 2.7%-3.6% for Illinois and 2.2%-2.9% for the Chicago PMSA. Foreclosed property sales are related to the number of real estate owned (REO) properties and there were 1,797 REOs generated this September. The median price forecast indicates moderate annual increases in median prices for October, November and December compared to a year ago. In Illinois, the median price is forecast to rise by 4.6% in October, 7.0% in November and 4.1% in December. For the Chicago PMSA, the comparable figures are 7.8% in October, 8.8% in November and 5.9% in December. As a complement to the median housing price index (HPI), the REAL HPI 1 forecast a more robust growth trend for Illinois and the Chicago PMSA. In Illinois, the REAL HPI (Jan 2008=1) is forecast to rise by 7.8% in October, 8.0% in November and 5.2% in December. The comparable figures for the Chicago PMSA are 10.1% in October, 12.4% in November and 9.7% in December. REAL HPI takes housing characteristics into account and constructs comparable baskets of homes for each month. The full recovery to healthy housing market conditions seems to be continuing but the encouraging news in the job market seems not to have fully influenced the housing market. Earlier this year, Freddie Mac released a new index - MiMi 2 to monitor on the stability and recovery of the nation s housing market. They indicate each market s current conditions as weak, in range or elevated, relative to their historic stable level before Four 1 REAL HPI was developed by Esteban Lopez and Minshu Du. Contact us for further details. 2
3 perspectives are gauged: home purchase application, payment-to-income ratios, portion of ontime mortgage and local employment. In September, Illinois is most improved states on a monthly basis (+0.92%). Chicago Metro is the second (+0.62%) and third (+14.73%) most improved metro area respectively on a month-over-month and year-over-year basis. However, the housing market conditions in these two areas are still weak compared to their historic stable level. The recovery level of Illinois ranks 47 th among all the states and the Chicago Metro ranks 44 th out of 50 Metro areas. As noted, the job market has sent positive signals in the last few months. In September 2014, according to the Bureau of Labor Statistics (BLS) Employment Situation report, the national unemployment rate declined to a six-year low of 5.9% and nonfarm payroll jobs experienced gains of 248,000 jobs. Statewide, according to Illinois Department of Employment Security (IDES) news release, in August 2014 the Illinois unemployment rate fell to 6.7% - the lowest since July 2008 and also the largest year-over-year decline since ,800 non-farm payroll jobs were created. The University of Michigan Consumer Sentiment Index increased to 84.6 the highest in the last seven years, largely due to the positive consumers sentiment on the job growth. However, the Conference Board Consumer Confidence Index decreased for the first time after four consecutive months of increase. The Scotsman Guide reporting on research conducted by Fannie Mae found that millennials (those born between 1981 and 2000) have reasonable access to affordable housing but are not buying, largely for reasons already known: high unemployment, not enough access to down payment capital, lots of student loan debt and subpar median incomes. The report found that if the homeownership rates of 2006 had continued uninterrupted, there would be 2.4 million more young homeowners today. At the same time, some three-quarters of young people are now spending 30 percent of their income on housing, less than at other times over the past decade. The analysis continued to note that homeownership rates among this group were falling but at a moderating rate. Additional evidence suggests that this cohort may have much reduced preferences for ownership with higher dependence on rental housing, cars, bicycles and a greater patronage of public transit. Several analysts interviewed pointed to a strong link between potential misinformation about financing of a house, the increasing burden of student debt and continuing uncertainty about the recovery of the job market. This group s participation in the housing market will be key to a return to more normal market. The Housing Market Current Condition In September, sales and median housing prices in Illinois and the Chicago PMSA both experienced milder annual changes compared to last month. 12,879 houses were sold in Illinois, 4.4% less than a year ago. In the Chicago PMSA, 9,117 houses were sold, 6.4% less than last September. The median price was $161,900 in Illinois, up 4.5% from September last year; the comparable figure for the Chicago PMSA was $195,000, up 5.4% from this time last year. (Reference: Illinois and Chicago PMSA Total Home Sales and Median Home Sales Price figures; Forecast for October 2014 report table) In September Chicago PMSA, the percentage of foreclosed sales (e.g. REOs) among the total sales increased to 16.2%, the second lowest since Oct ,495 regular sales were made, a small 0.9% decline from a year ago. 1,568 foreclosed properties were sold, 25.9% less than last September. The median price was $218,000 for regular property
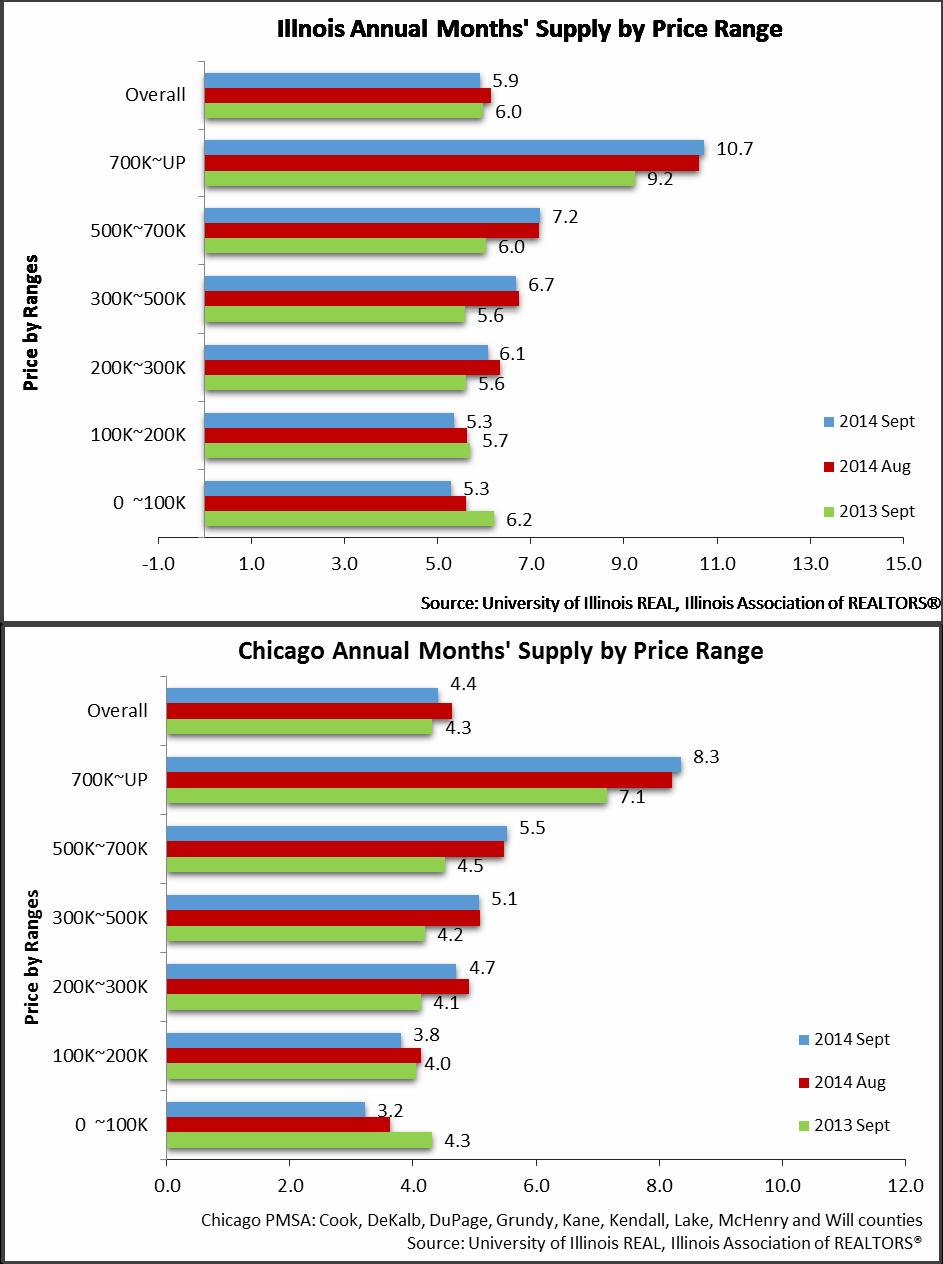
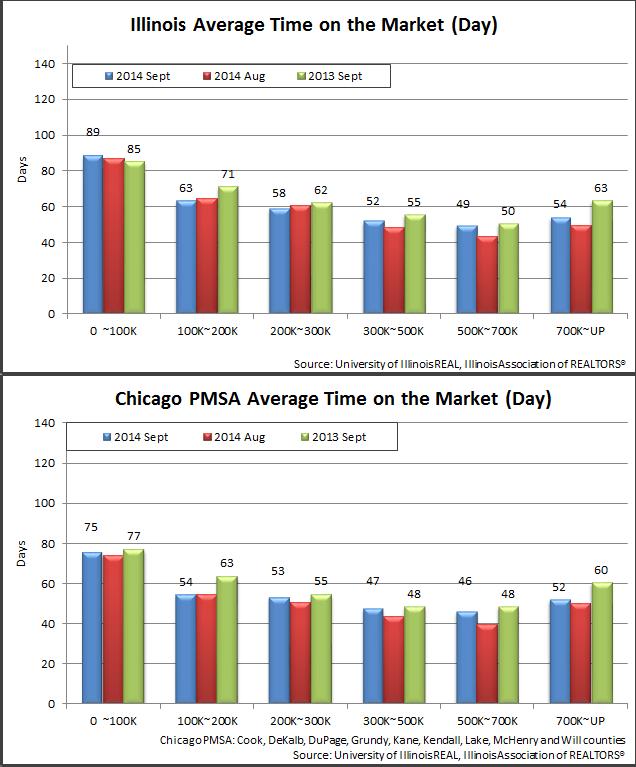
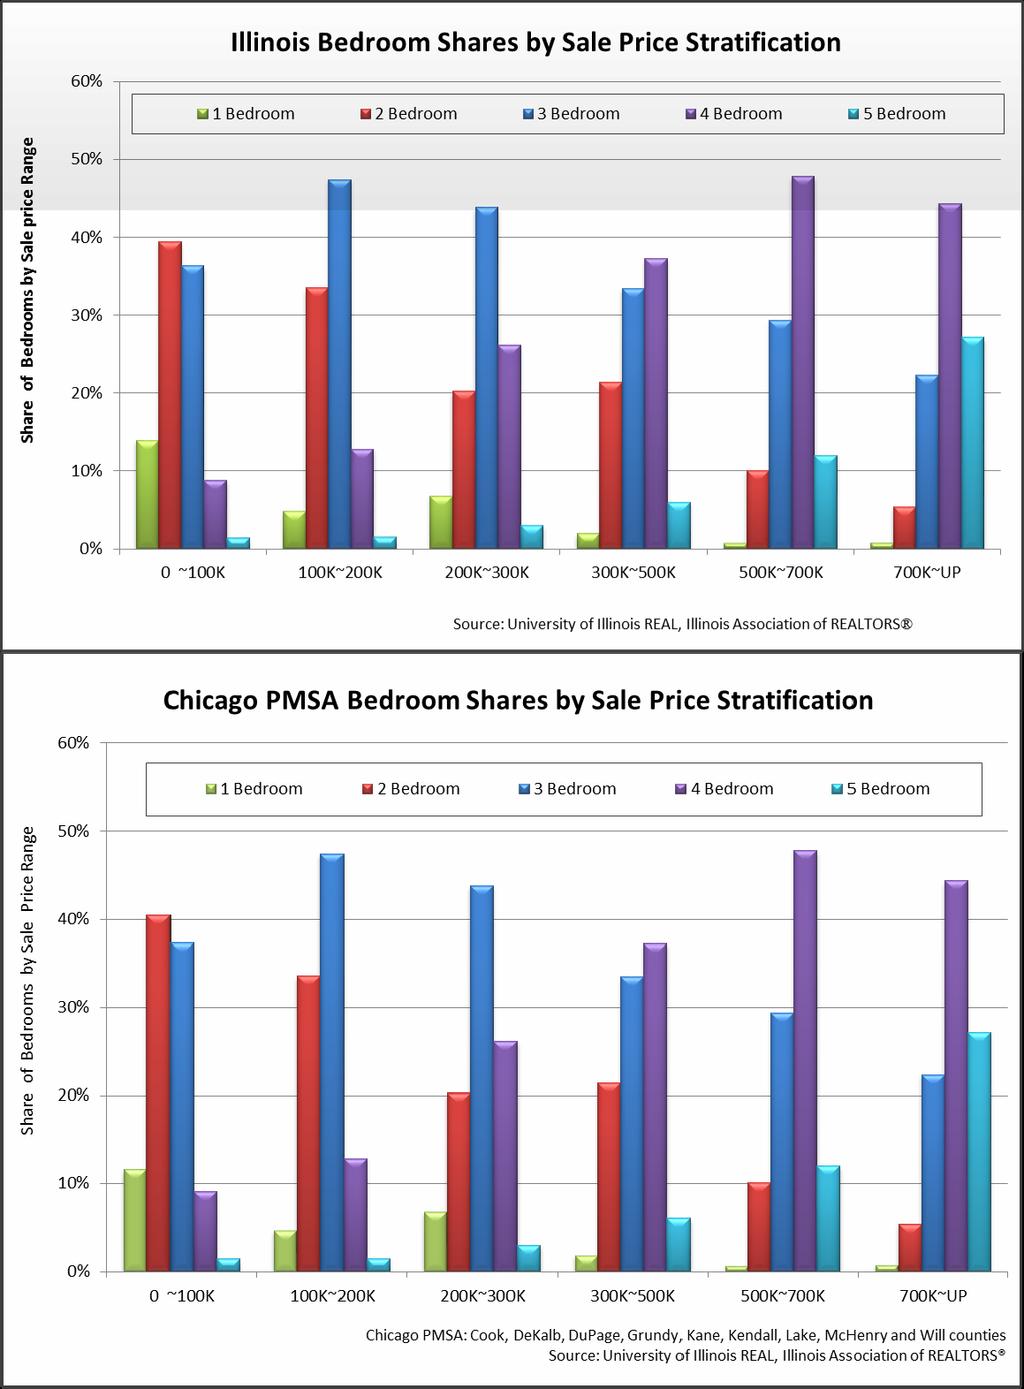
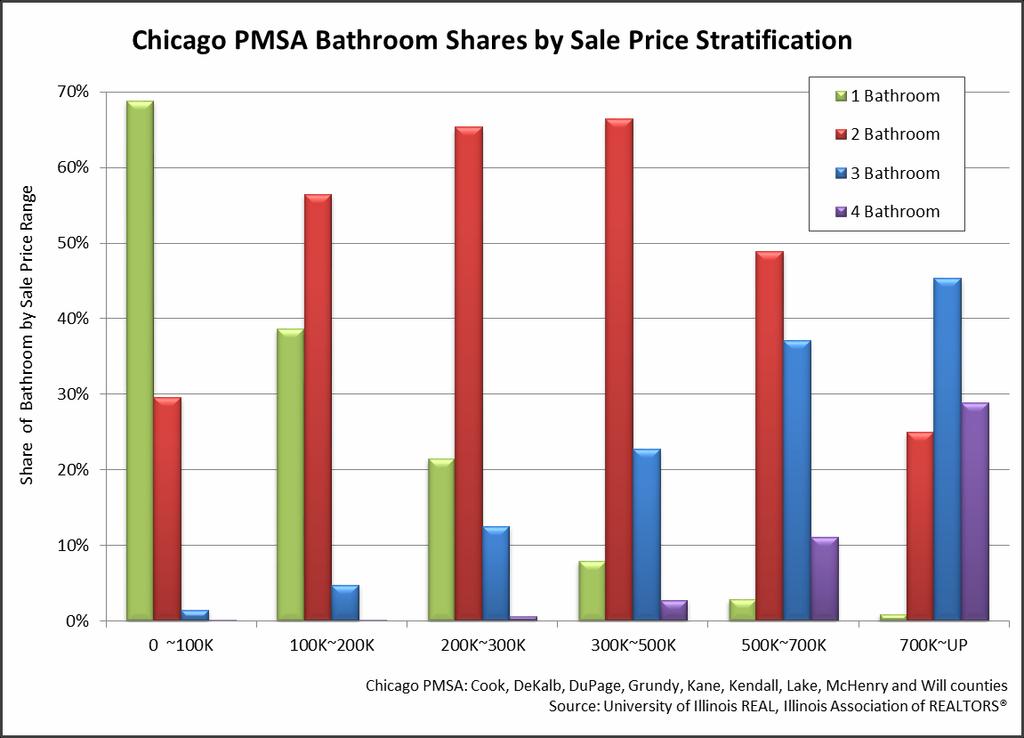
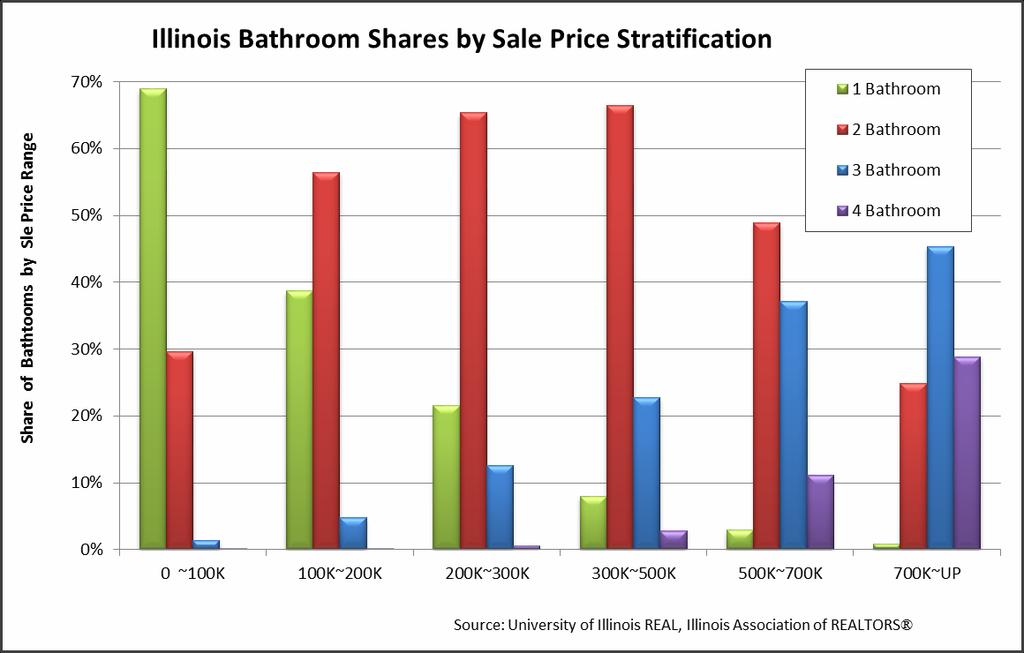
4 sales, up 2.8% from September last year; the comparable figure for the foreclosed properties was $115,500, up 5.0% from this time last year. (Reference: Sales and Median Sales Price for Chicago PMSA: Foreclosed vs. Regular) In September, at the latest average annual pending sales rate, Illinois had enough housing inventory for 5.9 months 3 (down from 6.0 months a year ago). In the Chicago PMSA, the comparable figure was 4.4 months (up from 4.3 months a year ago). Months of supply are increasing for homes in all price ranges above $200K and decreasing for homes below $200K in both Illinois and the Chicago PMSA. However in Illinois, the overall trend of the months inventory was dominated by the decreasing trend for homes priced at the lower end in contrast to the Chicago PMSA which was dominated by increases for more expensive homes. (Reference: Illinois and Chicago PMSA Annual Months Supply by Price Range figures) In September, homes priced below $100K held a smaller market share compared to a year ago, while homes at other higher price ranges either received increases in market shares or were little changed. For Illinois, homes priced below $100K held a market share that decreased to 26.8% from 29.3% a year ago. The comparable figure for the Chicago PMSA was 18.8% decreasing from 22.4% recorded in September (Reference: Illinois and Chicago PMSA Price Stratification figures) The Housing Market Forecast and Future Condition The median price forecast indicates moderate annual increases in median prices for October, November and December compared to a year ago. In Illinois, the median price is forecast to rise by 4.6% in October, 7.0% in November and 4.1% in December. For the Chicago PMSA, the comparable figures are 7.8% in October, 8.8% in November and 5.9% in December. (Reference: Forecast for October 2014 report table) As a complement to the median housing price index (HPI), the REAL HPI 4 forecast a more robust growth trend for Illinois and the Chicago PMSA. In Illinois, the REAL HPI (Jan 2008=1) is forecast to rise by 7.8% in October, 8.0% in November and 5.2% in December. The comparable figures for the Chicago PMSA are 10.1% in October, 12.4% in November and 9.7% in December. REAL HPI takes housing characteristics into account and constructs comparable baskets of homes for each month. (Reference: Housing Price Index) The sales forecast for October, November and December 2014 suggests an uptrend on the annual basis and downtrend on the monthly basis. Annually, the three-month average forecasts point to a change of between 2.0% and 2.7% for Illinois; for the Chicago PMSA, the change will range from 1.7% to 2.3%. On a monthly basis, the three-month average sales are forecast to decrease by 2.7%-3.6% for Illinois and 2.2%- 2.9% for the Chicago PMSA. (Reference: Forecast for October 2014 report table) The pending home sales index 5 is a leading indicator based on contract signings. This September, homes put under contract decreased on the monthly basis but increased on the annual basis. The pending home sales index is (2008=100) in Illinois, down 3 Months supply of inventory is defined as inventory of homes for sale at the end of the month divided by the average monthly pending sales in the last twelve months. 4 REAL HPI was developed by Esteban Lopez and Minshu Du. Contact us for further details. 5 The base level (100) of pending home sales is the average pending home sales of year 2008.
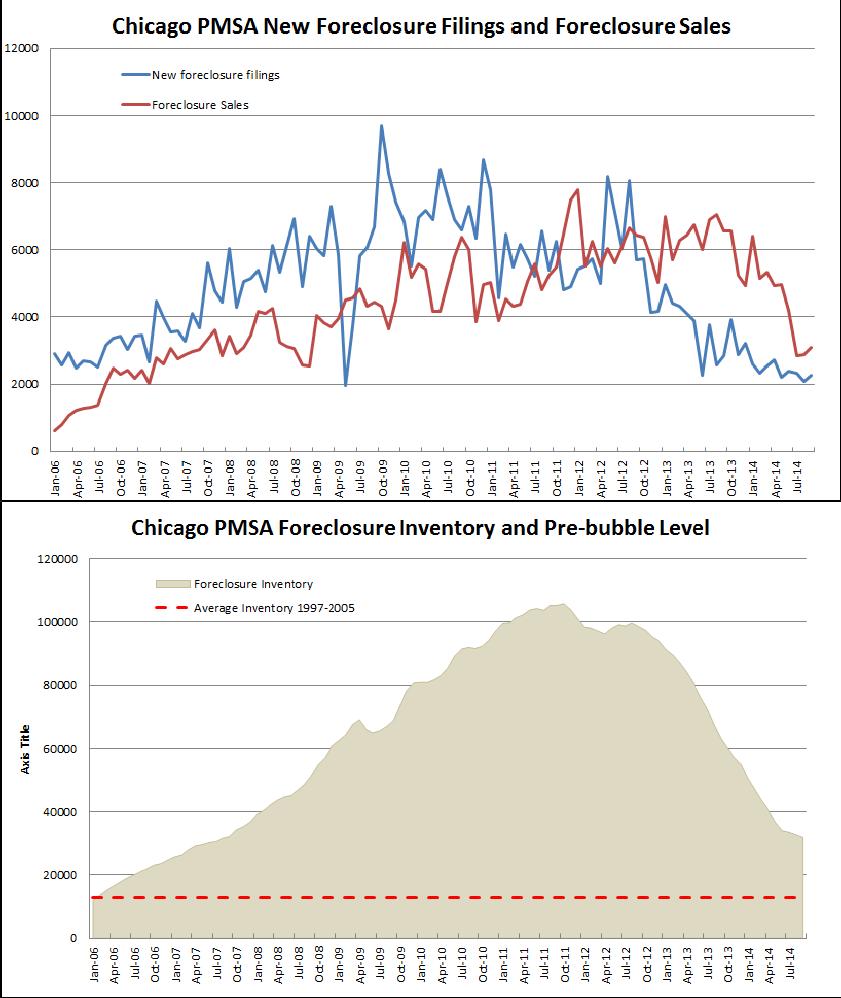
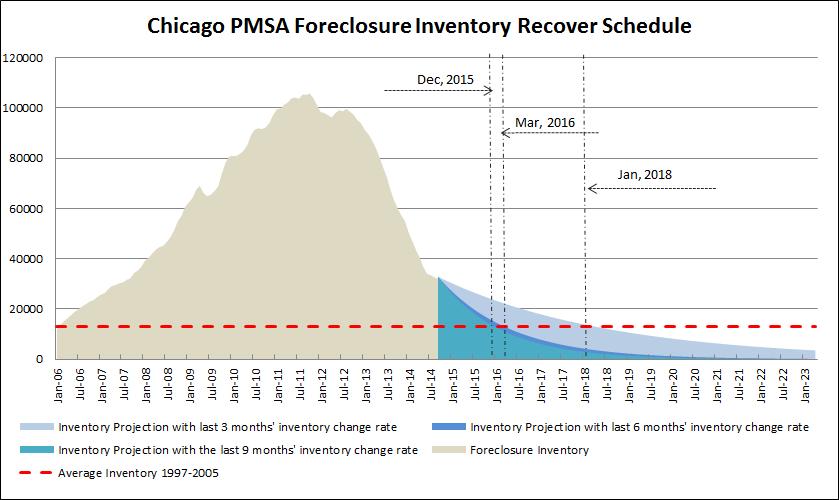
5 8.6% from last month and up 3.9% from a year ago. In the Chicago PMSA, the comparable figure is 156.4, down 4.8% from last month and up 8.5% from a year ago. (Reference: Illinois and Chicago PMSA Pending Home Sales Index figure) In September 2014, 2,250 houses were newly filed for foreclosure in the Chicago PMSA (down 21.0% and up 7.6% respectively from a year and a month ago) and 3,089 foreclosures were completed 6 (down 53.0% and up 7.0% respectively from a year ago and a month ago). Among all the completed foreclosures, 1,797 were REOs and 292 were sold through auctions. As of October 2014, there are 31,881 homes are at some stage of foreclosures the foreclosure inventory. The average inventory change rates 7 were -2.1% in the past 3 months, -5.0% in the last 6 months and -5.8% in the last 9 months. Given these rates of change, the foreclosure inventory would return to the prebubble levels 8 by Jan 2018, Mar 2016 and Dec 2015 respectively. (Reference: Chicago PMSA Foreclosure Activity and Inventory figures). The Economy In September 2014, according to the Bureau of Labor Statistics (BLS) Employment Situation report, the national unemployment rate declined to 5.9% and nonfarm payroll jobs experienced gains of 248,000 jobs. Among all industries, professional and business services added the most jobs (+81,000), followed by retail trade (+35,000). Moreover, the construction sector created 16,000 jobs, out of which 6,000 are in the residential building subsector. In August 2014, according to Illinois Department of Employment Security (IDES) news release, the Illinois unemployment rate fell to 6.7% - the lowest since July 2008 and also the largest year-over-year decline since ,800 non-farm payroll jobs were created. Through August 2014, Illinois has added 263,100 new private sector jobs since February 2010 when Illinois employment growth resumed after the national recession. In August 2014, the one-year-ahead forecast for Illinois indicates that the non-farm employment will edge up at a rate between 1.28 % and 1.80%, corresponding to job gains between 74,700 and 105,200. The total gains are forecast to be contributed by nine out of ten sectors: education and health (2.36%; 20,800), trade, transportation and utilities (1.16%; 13,500), construction (5.68%; 11,500), professional and business services (1.93%; 17,400), leisure and hospitality (1.60%; 8,800), financial activities (1.00%; 3,700), Government (0.81%; 6,800), manufacturing (0.24%; 1,400) and other services (0.52%; 1,300). Longer-term Outlook In September, two consumer confidence indices pointed in different directions for consumers sentiments. The Conference Board Consumer Confidence Index decreased for the first time after four consecutive months of increase and stands at 86.0 (1985=100); the University of Michigan Consumer Sentiment Index, however, increased to 84.6 the 6 Including estimated foreclosure completions that are missing in the data. 7 The range of months used for calculating the average change rates are modified from the 6/12/24 months scenarios to 3/6/9 months scenarios since Aug Average foreclosure inventory from
6 highest in the last seven years. While the former survey reveals a less positive consumers sentiment on the job growth, the later still highlight the favorable job market conditions in consumers evaluations. The Chicago Business Activity Index (CBAI) decreased to 98.7 in August from in July. The fall is attributed to a decrease in job growth in the nonmanufacturing sector and to a fall in retail activity in the Chicago area. As the housing market enters a normally slow season, the trend of the last few months of declining sales on a month-to-month basis is expected to continue, but with gains on a yearover-year basis for the remainder of 2014, noted Geoffrey J.D. Hewings, Director of the Regional Economics Applications Laboratory of the University of Illinois. However, prices are still forecast to increase and inventories are slowly expanding.
7 Forecast for October 2014 report PERCENTAGE CHANGE FOR THE TOTAL NUMBER OF SALES Annual Monthly Illinois Chicago PMSA Illinois Chicago PMSA Jul % -6.7% -2.2% -1.5% Aug % -12.2% -4.8% -6.8% Sep % -6.4% -13.3% -13.2% 3 Month Avg. -6.5% -8.5% -6.6% -7.0% SUMMARY OF THE FORECAST INTERVALS FOR THE TOTAL NUMBER OF SALES Annual Monthly Illinois Chicago PMSA Illinois Chicago PMSA Oct % -2.2% -4.2% -5.6% -1.2% -1.6% -1.1% -1.5% Nov % 9.0% 9.0% 12.2% -6.0% -8.1% -3.8% -5.1% Dec % 2.1% 1.6% 2.2% -0.7% -1.0% -1.6% -2.2% 3 Month Avg. 2.0% 2.7% 1.7% 2.3% -2.7% -3.6% -2.2% -2.9% SUMMARY OF THE FORECAST FOR THE MEDIAN PRICE Illinois Chicago PMSA Illinois Chicago PMSA Jul-14 $179,000 $218,000 Jul-13 $167,000 $200,000 Aug-14 $175,000 $215,000 Aug-13 $165,000 $197,000 Sep-14 $161,900 $195,000 Sep-13 $155,000 $185,000 Oct-14 $156,900 $188,708 Oct-13 $150,000 $175,000 Nov-14 $155,130 $184,371 Nov-13 $145,000 $169,500 Dec-14 $154,593 $186,910 Dec-13 $148,500 $176,500 ANNUAL PERCENTAGE CHANGE OF THE MEDIAN PRICE Illinois Chicago PMSA Illinois Chicago PMSA Jul % 9.0% Jul % 17.6% Aug % 9.1% Aug % 15.9% Sep % 5.4% Sep % 15.6% Oct % 7.8% Oct % 14.7% Nov % 8.8% Nov % 9.4% Dec % 5.9% Dec % 17.7%
8 Forecast for September 2014 report PERCENTAGE CHANGE FOR THE TOTAL NUMBER OF SALES Annual Monthly Illinois Chicago PMSA Illinois Chicago PMSA Jun % 0.7% 12.4% 14.8% Jul % -6.9% -2.3% -1.7% Aug % -13.3% -5.7% -7.9% 3 Month Avg. -4.8% -6.6% 1.1% 1.2% SUMMARY OF THE FORECAST INTERVALS FOR THE TOTAL NUMBER OF SALES Annual Monthly Illinois Chicago PMSA Illinois Chicago PMSA Sep % -5.7% -6.4% -8.7% -10.9% -14.7% -11.2% -15.2% Oct % -12.9% -5.9% -8.0% -8.6% -11.7% -1.9% -2.6% Nov % -9.9% 1.4% 1.8% -11.1% -15.0% -8.7% -11.8% 3 Month Avg. -7.0% -9.4% -4.0% -5.4% -10.2% -13.8% -7.5% -10.1% SUMMARY OF THE FORECAST FOR THE MEDIAN PRICE Illinois Chicago PMSA Illinois Chicago PMSA Jun-14 $179,900 $220,000 Jun-13 $170,000 $205,000 Jul-14 $179,000 $218,000 Jul-13 $167,000 $200,000 Aug-14 $175,000 $215,000 Aug-13 $165,000 $197,000 Sep-14 $166,086 $205,985 Sep-13 $155,000 $185,000 Oct-14 $161,086 $196,308 Oct-13 $150,000 $175,000 Nov-14 $159,342 $195,604 Nov-13 $145,000 $169,500 ANNUAL PERCENTAGE CHANGE OF THE MEDIAN PRICE Illinois Chicago PMSA Illinois Chicago PMSA Jun % 7.3% Jun % 13.0% Jul % 9.0% Jul % 17.6% Aug % 9.1% Aug % 15.9% Sep % 11.3% Sep % 15.6% Oct % 12.2% Oct % 14.7% Nov % 15.4% Nov % 9.4%
9
10
11
12
13
14
15

16
17
18
19
20
21
22
23
Housing Price Forecasts. Illinois and Chicago PMSA, December 2015
 Housing Price Forecasts Illinois and Chicago PMSA, December 2015 Presented To Illinois Association of Realtors From R E A L Regional Economics Applications Laboratory, Institute of Government and Public
Housing Price Forecasts. Illinois and Chicago PMSA, March 2016
 Housing Price Forecasts Illinois and Chicago PMSA, March 2016 Presented To Illinois Association of Realtors From R E A L Regional Economics Applications Laboratory, Institute of Government and Public Affairs
Housing Price Forecasts. Illinois and Chicago PMSA, July 2016
 Housing Price Forecasts Illinois and Chicago PMSA, July 2016 Presented To Illinois Association of Realtors From R E A L Regional Economics Applications Laboratory, Institute of Government and Public Affairs
Housing Price Forecasts. Illinois and Chicago PMSA, March 2017
 Housing Price Forecasts Illinois and Chicago PMSA, March 2017 Presented To Illinois Realtors From R E A L Regional Economics Applications Laboratory, Institute of Government and Public Affairs University
Housing Price Forecasts. Illinois and Chicago PMSA, August 2017
 Housing Price Forecasts Illinois and Chicago PMSA, August 2017 Presented To Illinois Realtors From R E A L Regional Economics Applications Laboratory, Institute of Government and Public Affairs University
Housing Price Forecasts. Illinois and Chicago PMSA, March 2018
 Housing Price Forecasts Illinois and Chicago PMSA, March 2018 Presented To Illinois Realtors From R E A L Regional Economics Applications Laboratory, Institute of Government and Public Affairs University
Housing Price Forecasts. Illinois and Chicago PMSA, January 2019
 Housing Price Forecasts Illinois and Chicago PMSA, January 2019 Presented To Illinois Realtors From R E A L Regional Economics Applications Laboratory, Institute of Government and Public Affairs University
Housing Price Forecasts. Illinois and Chicago PMSA, March 2019
 Housing Price Forecasts Illinois and Chicago PMSA, March 2019 Presented To Illinois Realtors From R E A L Regional Economics Applications Laboratory, Institute of Government and Public Affairs University
Housing Price Forecasts. Illinois and Chicago PMSA, September 2016
 Housing Price Forecasts Illinois and Chicago PMSA, September 2016 Presented To Illinois Realtors From R E A L Regional Economics Applications Laboratory, Institute of Government and Public Affairs University
Housing Price Forecasts. Illinois and Chicago PMSA, May 2018
 Housing Price Forecasts Illinois and Chicago PMSA, May 2018 Presented To Illinois Realtors From R E A L Regional Economics Applications Laboratory, Institute of Government and Public Affairs University
Housing Price Forecasts. Illinois and Chicago PMSA, January 2018
 Housing Price Forecasts Illinois and Chicago PMSA, January 2018 Presented To Illinois Realtors From R E A L Regional Economics Applications Laboratory, Institute of Government and Public Affairs University
Housing Price Forecasts. Illinois and Chicago PMSA, April 2018
 Housing Price Forecasts Illinois and Chicago PMSA, April 2018 Presented To Illinois Realtors From R E A L Regional Economics Applications Laboratory, Institute of Government and Public Affairs University
Housing Price Forecasts. Illinois and Chicago PMSA, August 2016
 Housing Price Forecasts Illinois and Chicago PMSA, August 2016 Presented To Illinois Association of Realtors From R E A L Regional Economics Applications Laboratory, Institute of Government and Public
Housing Price Forecasts. Illinois and Chicago PMSA, June 2012
 Housing Price Forecasts Illinois and Chicago PMSA, June 2012 Presented To Illinois Association of REALTORS From R E A L Regional Economics Applications Laboratory, Institute of Government and Public Affairs
Housing Price Forecasts. Illinois and Chicago PMSA, April 2013
 Housing Price Forecasts Illinois and Chicago PMSA, April 2013 Presented To Illinois Association of Realtors From R E A L Regional Economics Applications Laboratory, Institute of Government and Public Affairs
Housing and Economy Market Trends
 Housing and Economy Market Trends Mainstreet Organization Prices of single-family, detached homes in suburban Chicago increased 12.1 percent in May 2014 compared with the same period a year ago. Overall,
Housing Price Forecasts Illinois Metropolitan Statistical Areas
 Housing Price s Illinois Metropolitan Statistical Areas R E A L Regional Economics Applications Laboratory, Institute of Government and Public Affairs, University of Illinois Dr. Geoffrey J.D. Hewings,
MARKET OUTLOOK FOR SAN MATEO
 MARKET OUTLOOK FOR SAN MATEO Jonathan Smoke Chief Economist August 2, 2016 NATIONAL TRENDS 2 JOB CREATION REBOUNDED IN JUNE 229,000 jobs created by month in 2015; 172,000 average this year Employment and
Economic Highlights. Payroll Employment Growth by State 1. Durable Goods 2. The Conference Board Consumer Confidence Index 3
 August 26, 2009 Economic Highlights Southeastern Employment Payroll Employment Growth by State 1 Manufacturing Durable Goods 2 Consumer Spending The Conference Board Consumer Confidence Index 3 Real Estate
Monthly Indicators + 7.3% + 6.6% + 8.3% Single-Family Market Overview Condo Market Overview New Listings Pending Sales.
 Monthly Indicators 2018 The three most prominent national market trends for residential real estate are the ongoing lack of abundant inventory, the steadily upward movement of home prices and year-over-year
Economic and Housing Market Outlook ( ) October 31, Contra Costa AOR
 October 31, Contra Costa AOR") Economic and Housing Market Outlook (2012 2013) Contra Costa AOR October 31, 2012 Oscar Wei Senior Research Analyst California Association of REALTORS Overview US and California Economies California Housing
Economic and Housing Market Outlook (2012 2013) Contra Costa AOR October 31, 2012 Oscar Wei Senior Research Analyst California Association of REALTORS Overview US and California Economies California Housing
2017 RESIDENTIAL REAL ESTATE MARKET REPORT
 2017 RESIDENTIAL REAL ESTATE MARKET REPORT Published January 26, 2018 Our market reports have been focused on the effects of low inventory on our housing market and for good reason. December 2017 marked
THE OUTLOOK FOR HOUSING IN ILLINOIS
 THE OUTLOOK FOR HOUSING IN ILLINOIS Jonathan Smoke Chief Economist January 25, 2017 NATIONAL TRENDS 2 2000.01 2000.05 2000.09 2001.01 2001.05 2001.09 2002.01 2002.05 2002.09 2003.01 2003.05 2003.09 2004.01
San Francisco Housing Market Update
 San Francisco Housing Market Update California Economic and Housing Market Outlook The national economy maintained a healthy growth rate in the first quarter of 2005 and appeared to be settling in for
California Housing Market Update. Monthly Sales and Price Statistics November 2018
 California Housing Market Update Monthly Sales and Price Statistics November 2018 Home Sales: Largest Decline Since 2014 California, November 2018 Sales: 381,400 Units, -4.6% YTD, -13.4% YTY 700,000 600,000
CALIFORNIA ECONOMIC & MARKET OUTLOOK. October 29,2014 Contra Costa Association of REALTORS Leslie Appleton Young, Chief Economist
 2014 2015 CALIFORNIA ECONOMIC & MARKET OUTLOOK October 29,2014 Contra Costa Association of REALTORS Leslie Appleton Young, Chief Economist OVERVIEW Economic Outlook California Housing Market Outlook Housing
Housing Bulletin Monthly Report
 October 21 1 Housing Bulletin Monthly Report Housing Starts show Slight improvement in September CANADA Housing Starts 2, 15, 1, 5, Sep 8 Oct 8 Nov 8 Dec 8 Preliminary Housing Starts in Alberta and Canada
ECONOMIC CURRENTS. Vol. 3, Issue 1. THE SOUTH FLORIDA ECONOMIC QUARTERLY Introduction
 ECONOMIC CURRENTS THE SOUTH FLORIDA ECONOMIC QUARTERLY Introduction Economic Currents provides an overview of the South Florida regional economy. The report contains current employment, economic and real
ECONOMIC CURRENTS. Vol. 4, Issue 3. THE Introduction SOUTH FLORIDA ECONOMIC QUARTERLY
 ECONOMIC CURRENTS THE Introduction SOUTH FLORIDA ECONOMIC QUARTERLY Vol. 4, Issue 3 Economic Currents provides an overview of the South Florida regional economy. The report presents current employment,
Housing Bulletin Monthly Report
 January 21 1 Housing Bulletin Monthly Report Most new homes built in second half of 29 25, 2, 15, 1, 5, Dec 7 Jan 8 Feb 8 mar 8 apr 8 Alberta s 29 housing starts increased 72.8 per cent over 28, suggesting
California Housing Market Update. Monthly Sales and Price Statistics October 2018
 California Housing Market Update Monthly Sales and Price Statistics October 2018 Sales Had the 2 nd Largest Drop in the Last 6 Months California, October 2018 Sales: 397,060 Units, -3.7% YTD, -7.9% YTY
Housing and the Economy: Impacts, Forecasts and Challenges
 Presentation to the Illinois Financial Forecast Forum, Lombard, IL January 19, 2018 Housing and the Economy: Impacts, Forecasts and Challenges Geoffrey J.D. Hewings, Ph.D. Director Emeritus Regional Economics
Minneapolis St. Paul Residential Real Estate Index
 University of St. Thomas Minneapolis St. Paul Residential Real Estate Index September 2017 Welcome to the latest edition of the UST Minneapolis St. Paul Residential Real Estate Index. The University of
California Housing Market Update. Monthly Sales and Price Statistics December 2018
 California Housing Market Update Monthly Sales and Price Statistics December 2018 Sales Reached the Lowest Level since Jan 2015 California, December 2018 Sales: 372,260 Units, -5.2% YTD, -11.6% YTY 700,000
Released: May 7, 2010
 Released: May 7, 2010 Commentary 2 The Numbers That Drive Real Estate 3 Recent Government Action 9 Topics for Home Buyers, Sellers, and Owners 11 Brought to you by: KW Research Commentary The economic
Released: June 7, 2010
 Released: June 7, 2010 Commentary 2 The Numbers That Drive Real Estate 3 Recent Government Action 9 Topics for Home Buyers, Sellers, and Owners 11 Brought to you by: KW Research Commentary The housing
California Housing Market Update. Monthly Sales and Price Statistics September 2018
 California Housing Market Update Monthly Sales and Price Statistics September 2018 Sales Had the Largest Decline since March 2014 California, September 2018 Sales: 382,550 Units, -3.3% YTD, -12.4% YTY
Monthly Indicators + 4.8% - 3.5% %
 Monthly Indicators 2015 New Listings were up 45.0 percent for single family/duplex homes but decreased 44.1 percent for townhouse-condo properties. Pending Sales increased 14.3 percent for single family/duplex
Austin-area home prices set August record, outpace household income growth in August 2015
 Austin-area home prices set August record, outpace household income growth in August 2015 Market Reports Austin Board of REALTORS releases real estate statistics for August 2015 AUSTIN, Texas September
Quick Facts. For Week Ending July 14, 2018 Publish Date: July 23, 2018 All comparisons are to % - 2.7% - 14.
 Weekly Market Report A RESEARCH TOOL FROM THE SAINT PAUL AREA ASSOCIATION OF REALTORS. BROUGHT TO YOU BY THE UNIQUE DATA-SHARING TRADITIONS OF THE REALTOR COMMUNITY For Week Ending July 14, 2018 Publish
Economic Highlights. Retail Sales Components 1. University of Michigan Consumer Sentiment Index 2. Industrial Production and Capacity Utilization 3
 November 17, 2010 Economic Highlights Consumer Spending Retail Sales Components 1 University of Michigan Consumer Sentiment Index 2 Manufacturing Industrial Production and Capacity Utilization 3 Real Estate
2018 Real Estate Forecast Breakfast. Real Estate Market Update
 2018 Real Estate Forecast Breakfast Central Oregon Association of REALTORS Real Estate Market Update Paul C. Bishop, PhD, CBE Vice President, Research NATIONAL ASSOCIATION OF REALTORS February 22, 2018
California Housing Market Update. Monthly Sales and Price Statistics May 2018
 California Housing Market Update Monthly Sales and Price Statistics May 2018 Sales Lost Momentum as Mortgage Rates Continued to Climb California, May 2018 Sales: 409,270 Units, +0.3% YTD, -4.6% YTY 700,000
Weekly Market Activity Report
 X0A0T Weekly Market Report A RESEARCH TOOL FROM THE MINNEAPOLIS AREA ASSOCIATION OF REALTORS BROUGHT TO YOU BY THE UNIQUE DATA-SHARING TRADITIONS OF THE REALTOR COMMUNITY For Week Ending July 14, 2018
Housing Bulletin Monthly Report
 February 211 1 Housing Bulletin Monthly Report Alberta s preliminary housing starts declined in January 211 Canada Housing Starts 25, 2, 15, 1, 5, DEC 8 JAN 9 Preliminary Housing Starts in Alberta* and
ECONOMIC CURRENTS. Vol. 3, Issue 3 SOUTH FLORIDA ECONOMIC QUARTERLY. Introduction
 ECONOMIC CURRENTS THE Introduction SOUTH FLORIDA ECONOMIC QUARTERLY Economic Currents provides an overview of the South Florida regional economy. The report presents current employment, economic and real
Housing and Mortgage Market Update
 Housing and Mortgage Market Update Views from the Top Frank E. Nothaft Vice President and Chief Economist January 8, 2015 Summary: Housing & Mortgage Market Outlook for 2015 Interest rates expected to
2019 Housing Market Forecast. Palos Verdes Peninsula AOR January 8, 2019 Jordan G. Levine Senior Economist
 2019 Housing Market Forecast Palos Verdes Peninsula AOR January 8, 2019 Jordan G. Levine Senior Economist Overview Good News: Economic fundamentals solid Homeownership still the dream Rates might not go
Housing Bulletin Monthly Report
 February 21 1 Housing Bulletin Monthly Report Housing Starts 25, 2, 15, 1, 5, Alberta Housing Starts up 5 per cent from 29 From February 29 to 21, preliminary housing starts increased 82.7 per cent across
California Housing Market Update. Monthly Sales and Price Statistics August 2018
 California Housing Market Update Monthly Sales and Price Statistics August 2018 Sales Declined for the 4 th Consecutive Month California, August 2018 Sales: 399,600 Units, -2.1% YTD, -6.6% YTY 700,000
Monthly Market Watch for the Prescott Quad City Area. Provided by Keller Williams Check Realty Statistics from August 2012 Prescott MLS
 August 2012 Monthly Market Watch for the Prescott Quad City Area Provided by Keller Williams Check Realty Statistics from August 2012 Prescott MLS Report Overview: This report includes MLS data for the
Housing and the Economy: Impacts, Forecasts and Current Research 2018 Update
 Housing and the Economy: Impacts, Forecasts and Current Research 2018 Update Geoffrey J.D. Hewings, Ph.D. Director Emeritus Regional Economics Applications Laboratory (REAL) University of Illinois Institute
ANALYSIS OF THE CENTRAL VIRGINIA AREA HOUSING MARKET 1st quarter 2013 By Lisa A. Sturtevant, PhD George Mason University Center for Regional Analysis
 ANALYSIS OF THE CENTRAL VIRGINIA AREA HOUSING MARKET 1st quarter By Lisa A. Sturtevant, PhD George Mason University Center for Regional Analysis Economic Overview Key economic factors in the first quarter
Housing Bulletin Monthly Report
 August 21 Housing Bulletin Monthly Report 1 C a n a da s P r e li m i n a ry H o u s i n g S ta r t s s l i p i n J u ly Preliminary Housing St arts in Albert a* and Canada* July 28 to July 21 25, Canada
Phoenix, Central and Northern Arizona
 Phoenix, Central and Northern Arizona End of Year Housing Report 1-8-354-5664 LongRealty.com 217 End of Year Housing Report SALES & INVENTORY Housing market trends For the overall real estate market in
1200 Premier Drive, Suite 140 Chattanooga, TN Each office is independently owned and operated.
 THIS MONTH IN REAL ESTATE K im aulston R REALTOR 1200 Premier Drive, Suite 140 Chattanooga, TN 37421 Each office is independently owned and operated. Cell: 423-316-4022 Office: 423-664-1600 Email: kcraulston@gmail.com
Monthly Indicators % % - 3.5%
 Monthly Indicators 2017 New Listings were up 6.3 percent for the category but decreased 33.1 percent for the category. Pending Sales increased 5.0 percent for but decreased 1.3 percent for. The Median
ECONOMIC CURRENTS. Vol. 5 Issue 2 SOUTH FLORIDA ECONOMIC QUARTERLY. Key Findings, 2 nd Quarter, 2015
 ECONOMIC CURRENTS THE Introduction SOUTH FLORIDA ECONOMIC QUARTERLY Economic Currents provides an overview of the South Florida regional economy. The report presents current employment, economic and real
TEXAS HOUSING INSIGHT
 TEXAS HOUSING INSIGHT JAMES P. GAINES CHIEF ECONOMIST WAYNE DAY RESEARCH ASSOCIATE LUIS B. TORRES RESEARCH ECONOMIST TECHNICAL REPORT 2 1 2 0 OCTOBER 2016 TR Contents About this Report... 3 August 2016
INLAND EMPIRE REGIONAL INTELLIGENCE REPORT. School of Business. April 2018
 INLAND EMPIRE REGIONAL INTELLIGENCE REPORT April 2018 Key economic indicators suggest that the Inland Empire s economy will continue to expand throughout the rest of 2018, building upon its recent growth.
Real gross domestic product California vs. United States
 Real gross domestic product California vs. United States Percent change, year ago 6 4 U.S. California 2 0-2 -4-6 2001 2002 2003 2004 2005 2006 2007 2008 2009 2010 2011 Source: Bureau of Economic Analysis.
REAL ESTATE AND THE ECONOMIC OUTLOOK THROUGH 2013:
 1 1 REAL ESTATE AND THE ECONOMIC OUTLOOK THROUGH 2013: Coping With A Different Kind Of Housing Recovery A Presentation To The Commercial Real Estate Education Summit Monrovia, California July 13, 2012
Oversupply persists despite improved sales activity for affordable product Mar. 2019
 March 19 MONTHLY STATISTICS PACKAGE Oversupply persists despite improved sales activity for affordable product 19, April 1, 19 March saw a modest decline in city wide sales activity compared to last year.
RESIDENTIAL MARKET ANALYSIS
 RESIDENTIAL MARKET ANALYSIS EVAN ABRAMOWITZ Joseph Bernard Investment Real Estate Oregon Association of Realtors Student Fellow Masters of Real Estate Development Graduate Student National housing market
Quarterly Housing Market Update
 Quarterly Housing Market Update An Overview New Hampshire s current housing market performance, as well as its overall economy, is slowly improving, with positives such as increasing employment and rising
Released: September 2011
 Released: September 2011 Commentary 2 The Numbers That Drive Real Estate 3 Special Report 9 Brought to you by: KW Research Commentary The national housing market remains firmly planted in balanced territory.
Chart 1. S&P/Case-Shiller Home Price Index: U.S. National. % Change - Year to Year NSA, Q1-00=100
 Northern Trust Global Economic Research 5 South LaSalle Chicago, Illinois 3 northerntrust.com Asha G. Bangalore agb3@ntrs.com A Perspective on Home Prices August 7, 8 There has been a significant decline
Monthly Indicators % % - 9.2%
 Monthly Indicators 2016 New Listings were down 1.4 percent for single family/duplex homes and 25.0 percent for townhouse-condo properties. Pending Sales increased 58.3 percent for single family/duplex
2013 Housing Market Forecast. SILVAR: Los Gatos/Saratoga District October 10, 2012 Leslie Appleton-Young, Vice President & Chief Economist
 2013 Housing Market Forecast SILVAR: Los Gatos/Saratoga District October 10, 2012 Leslie Appleton-Young, Vice President & Chief Economist What we saw from the roof.. C.A.R. NAR THE ECONOMY Recent Housing
The Real Estate Market Report
 The Real Estate Report 3rd quarter 2011 Prepared by: Candace Adams, President, Prudential Connecticut Realty Terence Beaty, Director, New Homes & Land, Prudential Connecticut Realty Connecticut Segments
Austin-Round Rock Area Local Market Report, Fourth Quarter 2017
 -Round Rock Area Local Market Report, Fourth Quarter 2017 Today's Market $350,000 Median Price (Red Line) and One-year Price Growth 12% $300,000 $250,000 10% 8% 6% $200,000 4% $150,000 2% $100,000 $50,000
Market Trends and Outlook
 Residential Remodeling Market Trends and Outlook Kermit Baker Remodeling Futures Conference April 3, 2012 Remodeling Market Overview 1. Home improvement spending totaled an estimated $290 billion last
Monthly Indicators % + 3.1% %
 Monthly Indicators A RESEARCH TOOL PROVIDED BY NORTH TEXAS REAL ESTATE INFORMATION SYSTEMS, INC. 2018 The booming U.S. economy continues to prop up home sales and new listings in much of the nation, although
2011 SECOND QUARTER RESIDENTIAL REAL ESTATE SALES REPORT Westchester and Putnam Counties, New York
 Westchester Putnam Association of REALTORS, Inc. Empire Access Multiple Listing Service, Inc. 60 South Broadway, White Plains, NY 10601 914.681.0833 Fax: 914.681.6044 www.wpar.com Putnam Office: 155 Main
INLAND EMPIRE REGIONAL INTELLIGENCE REPORT
 INLAND EMPIRE REGIONAL INTELLIGENCE REPORT June 2016 EMPLOYMENT After a slow start to 2016, the Inland Empire s labor market returned to form, in recent job figures. Seasonally adjusted nonfarm employment
Young-Adult Housing Demand Continues to Slide, But Young Homeowners Experience Vastly Improved Affordability
 Young-Adult Housing Demand Continues to Slide, But Young Homeowners Experience Vastly Improved Affordability September 3, 14 The bad news is that household formation and homeownership among young adults
This Month in Real Estate
 Keller Williams Research This Month in Real Estate Released: September 14, 2009 Commentary. The Numbers That Drive Real Estate Recent Government Action. Research for Buyers and Sellers. 2 4 10 14 1 Green
1 June FNB House Price Index - Real and Nominal Growth MAY FNB HOUSE PRICE INDEX FINDINGS
 1 June 2016 MARKET ANALYTICS AND SCENARIO FORECASTING UNIT JOHN LOOS: HOUSEHOLD AND PROPERTY SECTOR STRATEGIST 087-328 0151 john.loos@fnb.co.za THEO SWANEPOEL: PROPERTY MARKET ANALYST 087-328 0157 tswanepoel@fnb.co.za
Minneapolis St. Paul Residential Real Estate Index
 University of St. Thomas Minneapolis St. Paul Residential Real Estate Index Welcome to the latest edition of the UST Minneapolis St. Paul Residential Real Estate Index. The University of St Thomas Residential
DATA FOR JANUARY Published Feburary 16, Sales are down -14.0% month-over-month. The year-over-year comparison is up +2.5%.
 Permission is granted only to ARMLS Subscribers for reproduction with attribution on to ARMLS COPYRIGHT 2018. For questions regarding this publication contact Brand@ARMLS.com. DATA FOR JANUARY 2018 - Published
CALIFORNIA ECONOMIC & MARKET OUTLOOK. October 29,2014 SILVAR Leslie Appleton-Young, Chief Economist
 2014-2015 CALIFORNIA ECONOMIC & MARKET OUTLOOK October 29,2014 SILVAR Leslie Appleton-Young, Chief Economist OVERVIEW Economic Outlook California Housing Market Outlook Housing Affordability Regional Market
September bounce in house price sentiment
 Knight Frank/Markit House Price Sentiment Index (HPSI) SEPTEMBER 2012 September bounce in house price sentiment Key headlines for September UK households perceive that the value of their home declined
2018 Housing Market Outlook. Central Coast Realty Group Business Symposium February 22, 2018 Oscar Wei Senior Economist
 2018 Housing Market Outlook Central Coast Realty Group Business Symposium February 22, 2018 Oscar Wei Senior Economist Overview Economic Update California Housing Market Outlook Regional Housing Market
Housing Bulletin Monthly Report
 December 21 1 Housing Bulletin Monthly Report Alberta Housing Starts Fall in November 21 Canada Housing Starts 25 2 15 1 5 8 NOV 8 DEC 8 Preliminary Housing Starts in Alberta* and Canada* November 28 to
Greater Lansing Association of REALTORS Regional Economic Update HOUSING MARKET OUTLOOK FOR 2018
 Greater Lansing Association of REALTORS Regional Economic Update HOUSING MARKET OUTLOOK FOR 2018 Paul C. Bishop, PhD, CBE Vice President, Research NATIONAL ASSOCIATION OF REALTORS January 11, 2018 Today
Minneapolis St. Paul Residential Real Estate Index
 University of St. Thomas Minneapolis St. Paul Residential Real Estate Index Welcome to the latest edition of the UST Minneapolis St. Paul Residential Real Estate Index. The University of St Thomas Residential
Released: June Commentary 2. The Numbers That Drive Real Estate 3. Recent Government Action 9. Topics for Home Buyers, Sellers, and Owners 11
 Released: June 2011 Commentary 2 The Numbers That Drive Real Estate 3 Recent Government Action 9 Topics for Home Buyers, Sellers, and Owners 11 Brought to you by: KW Research Commentary The U.S. housing
TUCSON and SOUTHERN ARIZONA
 TUCSON and SOUTHERN ARIZONA End of Year Housing Report (52) 818-454 Stephen@TeamWoodall.com 217 End of Year Housing Report SALES & INVENTORY Housing market trends For the overall real estate market in
National Housing Trends
 National Housing Trends 34% America s Choice of Best Long Term Investment 26% 17% 15% 6% Real Estate Stocks / Mutual Funds Gold Savings Accounts / CDs Bonds Gallup 2018 Housing Affordability 197 Index
Changing Economic Times. Market Pulse. Dr. Gary Jackson Director, Regional Economic Research Institute Florida Gulf Coast University April 8, 2008
 Changing Economic Times Presented to: Market Pulse Bonita Springs Area Chamber of Commerce Bonita Springs-Estero Association of REALTORS, Inc. Dr. Gary Jackson Director, Regional Economic Research Institute
MLS of Greater Cincinnati - Charts for the Month: November 2017
 MLS of Greater Cincinnati - Charts for the Month: November 2017 The following charts provide an overview of what has occurred in the MLS over the past month. Each chart provides a historical trend. The
Sonoma County Business Barometer Q1 CY 2007
 EDB Sonoma County Economic Development Board economy Sonoma County Business Barometer Q1 CY 2007 Economic Development Board 401 College Avenue Suite D Santa Rosa CA 95401 707.565.7170 EDB Sonoma County
Pikes Peak area housing Market Statistics (As of: 2/28/2018)
") Jan-1-1 -1-1 Jan-2-2 -2-2 Jan-3-3 -3-3 -4-4 -4-5 -5-5 -6-6 -6-7 -7-7 -8-8 -8-9 -9-9 -1-1 -1-11 -11-11 -12-12 -12-13 -13-13 -14-14 -14-15 -15-15 -16-16 -16-17 -17-17 Jan-1-1 -1-1 Jan-2-2 -2-2 Jan-3-3 -3-3
Jan-1-1 -1-1 Jan-2-2 -2-2 Jan-3-3 -3-3 -4-4 -4-5 -5-5 -6-6 -6-7 -7-7 -8-8 -8-9 -9-9 -1-1 -1-11 -11-11 -12-12 -12-13 -13-13 -14-14 -14-15 -15-15 -16-16 -16-17 -17-17 Jan-1-1 -1-1 Jan-2-2 -2-2 Jan-3-3 -3-3
TEXAS HOUSING INSIGHT
 TEXAS HOUSING INSIGHT JAMES P. GAINES CHIEF ECONOMIST WESLEY MILLER RESEARCH ASSISTANT BAILEY CUADRA RESEARCH ASSISTANT LUIS B. TORRES RESEARCH ECONOMIST TECHNICAL REPORT 2 1 2 0 OCTOBER 2017 TR Contents
OCTOBER 2018 Harrisonburg & Rockingham County Real Estate Market Report
 OCTOBER 218 Real Estate Market Report An analysis of real estate activity through September 3, 218 provided courtesy of Scott P. Rogers, Funkhouser Real Estate Group Five Bedroom City Home with Finished
With last month's gain, sales are now up 4.5% from May 2015 and are at their highest annual pace since February 2007.
 JULY 2016 With last month's gain, sales are now up 4.5% from May 2015 and are at their highest annual pace since February 2007. - Lawrence Yun NAR s Chief Economist Now in its seventh year, the US economic
Provided by Keller Williams Realty Professional Partners Statistics from September 2010 MLS
 Monthly Market Watch for Maricopa County An overview of what is happening in the Maricopa County real estate market (using September 2010 statistics) Report overview: This report includes MLS data for
Jim & Jim McKenna LBA & LSA TheJims.com
 Jim & Jim McKenna LBA & LSA 631-974-9151 TheJims.com Return on Investment January 2000 March 2013 MSN Money.com, Case Shiller Pending Home Sales 110 105 100 95 90 Jan Feb Mar Apr May Jun Jul Aug Sep Oct
Metropolitan Indianapolis Board of REALTORS. Broker/Owner Meeting March 14, 2007
 Metropolitan Indianapolis Board of REALTORS Broker/Owner Meeting March 14, 2007 Tom Renkert Information Services Director MIBOR PropertyLinx 2 Implementation Time Line February 1-28 March 1 June 30 July
SE Michigan Residential Real Estate Recovery Are we there yet or is it over?
 SE Michigan Residential Real Estate Recovery Are we there yet or is it over? Changing View of Residential Transactions Changing View of Residential Transactions 2015 Short Sales 3% Leases Bank 11% Owned