September 2012 Housing Commentary
|
|
|
- Allyson Dennis
- 5 years ago
- Views:
Transcription

1 September 2012 Housing Commentary Delton Alderman USDA Forest Service NRS-01 Forestry Sciences Laboratory Princeton, WV Urs Buehlmann Department of Sustainable Biomaterials Virginia Tech Blacksburg, VA
2 Executive Summary September was an interesting month, with most housing related data increasing - - indicating a healing housing market. Yet, concerns about the sustainability of this healing remain due to several macro factors that could derail housing s recuperation process. September 2012 s report covers housing data, demographics, and macro factors influencing the United States housing market. This report also includes data for new housing starts, new and existing sales, building permits, housing completions, and construction spending. Also, the report contains comments concerning delinquencies, foreclosures, shadow inventory, and underwater homes; housing prices; demographics and economics. September s housing data indicated an increase in total starts, single-family starts and multifamily starts. Total building permits increased and housing completions increased month-overmonth. Private construction spending also increased month-over-month. Existing house sales and prices declined; new house sales increased but prices declined. The number of available existing and new houses for sale decreased. Private investors remained key purchasers of existing, foreclosed, and bank-owned (REO) homes. The Case-Shiller indices, and other indices, reported house values increased as well. Lastly, several financial and banking regulations are to be implemented in the near future. Many suspect that these regulations could possibly have a negative influence on the housing market.
3 Table of Contents Slide 2: Executive Summary Slide 4: Opening Comments Slide 5: Housing Scorecard Slide 6: Housing Starts Slide 8: Housing Permits Slide 9: Housing Completions Slide 13: Data Convergence Slide 14: New and Existing House Sales Slide 16: Manufactured Housing Slide 17: Construction Spending Slide 20: Residential Remodeling Slide 22: Architectural Billing Index Slide 23: Housing Barometer Slide 26: Housing Prices and Indices Slide 28: Delinquencies, Foreclosures, and Shadow Inventory Slide 30: Housing and Economics Slide 31: Demographics and Economics Slide 32: Economics Slide 33: Demographics and Renting Slide 35: Future Banking regulations Slide 36: Conclusions
4 September 2012 Housing Commentary Opening Comments United States and European economic conditions are unchanged Personal debt Americans are starting to leverage up again: Revolving debt up 5.9% and non-revolving debt up 9.0% in August (both at a seasonally adjusted annual rate). 1 Government debt: Federal, state, and local still problematic Europe All is quiet on the news front for now; however, Greece and Spain still are in dire straits. Obviously, what happens to these countries will impact world finances. It s [housing] starting to recover, but we re a long way away from true recovery. This housing market s been very, very bad and it s going to take some time to recover. The way we look at it is there s going to be a period of a workout, a fine period of one to two years and then you re going to get a more robust recovery. We ve had head fakes on the housing market coming back, so you always worry that this is a little bit of a head fake Frank Blake, Chief Executive Officer, Home Depot Source: /5/12; /11/12
5 September 2012 Housing Scorecard M/M Y/Y Housing Starts A 15.0% 34.8% Housing Permits A 11.6% 45.1% Housing Completions A 0.4% 13.8% New Single-Family House Sales A 5.7% 27.1% Existing House Sales B 1.7% 11.0% Remodeling Permits C 3.0% 5.0% Private Construction Spending A 1.3% 20.9% M/M = month-over-month; Y/Y = year-over-year Source: A U.S. Department of Commerce-Construction ; B National Association of Realtors ; C BuildFax
6 New Housing Starts Total Starts* Single- Family Starts Multi-Family 2-4 unit Starts Multi-Family 5 or more unit Starts September 872, ,000 9, ,000 August 758, ,000 7, , , ,000 6, ,000 M/M change +15.0% +11.0% +28.6% +25.0% Y/Y change +34.8% +42.9% +50.0% +18.7% * All start data are presented at a seasonally adjusted annual rate (SAAR) September 2012: Total starts Spiked upward Sustainability is a frequently used term in several spheres today; our question and concern - - is September s spike sustainable? We would like to believe that it will be; but, and it is a BIG but, we are apprehensive because of the wall of potential macro factors that can halt or delay the healing process underway in housing. While we have seen many dramatic headlines touting the housing recovery over the past 3.5 years, these headlines and the analysts who author them have been over predicting changes in the housing market Laurie Goodman, Analyst, Amherst Securities Source: U.S. Department of Commerce-Construction, /11/2012
7 New Housing Starts September 2012 s starts Muddling along at a higher level Average total non-farm housing starts from 1946: 1,493,945 units September s starts: 58% of the long-term average Average total non-farm single-family starts from 1946: 1,116,006 units September s starts: 54% of the long-term average Average total multi-family starts from 1946: 377,971 units September s starts: 71% of the long-term average though it s improving, the housing market is far from healthy. This recovery doesn t look like 2006, because 2006 was a bubble. Recovery looks like 2002 or People think recovery is when we get back to our high water mark, but that will be another decade Ron Florance, Managing Director of Investment Strategy, Wells Fargo Private Bank Source: U.S. Department of Commerce-Construction, /20/2012
8 New Housing Permits Total Permits * Single-Family Permits Multi-Family 2-4 unit Permits Multi-Family 5 or more unit Permits September 894, ,000 26, ,000 August 801, ,000 27, , , ,000 21, ,000 M/M change +11.6% +6.7% -3.7% +22.8% Y/Y change +45.1% +27.3% +23.8% +93.4% * All permit data are SAAR Commentary on Permits On a Y/Y basis, in all permit categories, permit activity is rebounding. The biggest gainer and the principal driver for the healing housing market, is multi-family housing. Here, permits have increased more than 93% since September of Single-family permits are improving too, and for the wood products industry this is crucial. Single-family permit growth has generally been highest in metros that have experienced the strongest job growth Adam Artunian, Senior Research Analyst, John Burns Real Estate Consulting, LLC Source: U.S. Department of Commerce-Construction; /18/2012
9 New Housing Completions Total Completions* Single-Family Completions Multi-Family 2-4 unit Completions Commentary on Completions Multi-Family 5 or more unit Completions September 872, ,000 9, ,000 August 758, ,000 7, , , ,000 6, ,000 M/M change +15.0% +11.0% +28.6% +25.0% Y/Y change +18.2% +42.9% +50.0% +18.7% * All completion data are SAAR Completions, similar to permits and starts, have registered clear improvement on a Y/Y basis. Singlefamily and 2-4 unit multi-family completions are the drivers in the completion category. Going back to the third quarter of 2011, the multi-family residential sector has been the best performing segment of the construction field. With high foreclosure levels in recent years, more stringent mortgage approvals and fewer people in the market to buy homes there has been a surge in demand for rental housing. The upturn in residential activity will hopefully spur more nonresidential construction Kermit Baker, Director of the Remodeling Futures Program, Joint Center for Housing Studies at Harvard University Source: U.S. Department of Commerce-Construction; /18/2012
10 Total Permits, Starts, and Completions 2,500 2,300 2,100 in thousands, SAAR 1,900 1,700 1,500 1,300 1, Total Permits Total Starts Total Completions : in thousands, NOT seasonally adjusted Total Permits Total Starts Total Completions Jan Feb Mar Apr May Jun Jul Aug Sep Clearly, aggregate numbers have registered nice gains in Yet, viewing unadjusted monthly data, both permits and completions are declining. While the last quarter of the year traditionally exhibits this behavior - - this decline is somewhat early for these two segments. Source: U.S. Department of Commerce-Construction
11 Total SF Permits, Starts, and Completions 1,750 1,650 1,550 1,450 1,350 1,250 1,150 1, in thousands, SAAR SF Permits SF Starts SF Completions Single-family aggregate data have registered notable gains in 2012 too : in thousands, NOT seasonally adjusted SF Permits SF Starts SF Completions Jan Feb Mar Apr May Jun Jul Aug Sep Again, viewing unadjusted monthly data, permits are declining. This bears watching during the upcoming months. Source: U.S. Department of Commerce-Construction
12 Total MF Permits, Starts, and Completions 1,250 1,150 1, in thousands, SAAR MF Permits MF Starts MF Completions : in thousands, NOT seasonally adjusted MF Permits MF Starts MF Completions Jan Feb Mar Apr May Jun Jul Aug Sep Multi-family aggregate data has been relatively stable in Looking at unadjusted monthly data, completions declined precipitously. This may be due to a heated sector needing a brief respite, financing, or workers we do not know. Source: U.S. Department of Commerce-Construction
13 A Note on Housing Data Convergence 1. Starts and completions in non-permit areas are estimated 2. Changes after the issuance of permits Why do these data never seem to converge? Reclassification: Townhouses are classified as single-family houses according to Census definitions; however, permit offices frequently classify them as multifamily structures. This reclassification results in significantly more single-family starts and completions (and less multifamily) than are shown in the permit data. Abandons: Construction is sometimes abandoned after permits are issued but before construction is started, affecting the permit-to-start relationship, or after construction is started, affecting the start-to-completion relationship. Abandon rates can fluctuate over time due to conditions in the economy. Design Changes: Builders also can make design changes after the issuance of the original permits. This is more common with the construction of apartment buildings where the final number of units may be more or less than originally planned. Misclassification: Permit offices sometimes incorrectly classify permits as new residential construction when the permits are actually for home improvements 3. Permit revisions not applied to starts and completions 4. Change in inventories between time periods On average Starts versus Permits Total Units: Starts were 2.5% less than Permits Single-family units: Starts were 2.5% greater than Permits Multifamily Units: Starts were 22.5% less than Permits Completions versus Starts Total Units: Completions were 4.0% less than Starts Single-family units: Completions were 3.5% less than Starts Multifamily Units: Completions were 7.5% less than Starts Source: U.S. Department of Commerce-Construction
14 New and Existing House Sales New Single-Family Sales* Median Price Month s Supply Existing House Sales 8* Median Price 8 Month s Supply 8 September 389,000 $242, ,750,000 $183, August 368,000 $250, ,830,000 $184, ,000 $227, ,280,000 $233, M/M change +5.7% -3.2% -4.3% -1.7% -0.5% -1.6% Y/Y change +27.1% +6.7% -28.6% +11.0% +11.3% -20.0% * All sales data are SAAR Commentary on Housing Sales New single-family house sales indicated a modest increase, while existing house sales registered a slight decrease. the housing market is still coping with the large inventory overhang that remains from the prerecession boom. This sector has begun to show some encouraging signs, with home prices and construction improving this year. But housing investment is still quite low relative to historical norms, and it will continue to underperform until the demand for housing makes more progress catching up to the existing housing stock Jeffrey Lacker, President, The Federal Reserve Bank of Richmond Source: U.S. Department of Commerce-Construction; 8 National Association of Realtors, 10/24/2012; 9 0/12/2012
15 New and Existing House Sales September 2012 New SF House Sales: Average September house sale price: $292,400 vs. $255,400 in September 2011 National Association of Realtors (NAR) 8 September 2012 sales data: Distressed houses: 24% of sales (13% foreclosures and 11% short-sales) Distressed house sales: 22% in August and were 30% in September 2011 All-cash sales: remained at 28% 27% in August Investors are still purchasing a substantial portion of all cash sale houses 18%; 27% in August 2012 and 30% in September 2011 First-time buyers: increased to 32% from 31% in August 2012 and were 32% in September Source: U.S. Department of Commerce-Construction; /18/2012
16 Manufactured Housing * Manufactured Housing Grows From Industry Low Point Manufactured home building projected to be a top-growing industry in 2013 Output for manufactured housing projected to increase16%, compared to 2012 Shipments and sales are still nowhere near pre-recession numbers: 1999: > 372,000 homes shipped 2005: > 146,000 homes shipped 2010: > 50,000 homes shipped 2011: > 51,600 homes shipped Affordability one of the main drivers for demand average sales price for a manufactured home in the US is $60,600 manufactured homes can cost 10-20% less per sq. ft. vs. site-built Laura Huchzermeyer, Industry Editor, First Research at Hoover's and Bizmology * This does not include modular housing. Source: /8/2012
17 September 2012 Construction Spending Private Construction: $ billion (SAAR) 2.8% above the revised August estimate of $ billion (SAAR) 20.9% above the August 2011 estimate of $ billion (SAAR) September SF construction: $ billion (SAAR) 25.7% above September 2011: $ billion (SAAR) September MF construction: $22.58 billion (SAAR) 48.9% above September 2011: $15.17 billion (SAAR) September Improvement A construction: $ billion (SAAR) 15.6% above September 2011: $ billion (SAAR) Private residential construction spending has increased 23% from 2010 and is 60% less than early 2006 s peak. A The US DOC does not report improvements directly, this is an estimation. Source: U.S. Department of Commerce-C30 Construction
18 September 2012 Construction Spending September Construction Jumps 16 Percent New construction starts in September climbed 16% to a SAAR of $507.2 billion. The nonbuilding construction sector (public works and electric utilities) led the way, helped in particular by a massive natural gas plant and several very large electric utility projects. Meanwhile, nonresidential building retreated after its improved performance in August, and residential building eased back slightly. Through the first nine months of 2012, total construction starts on an unadjusted basis came in at $349.6 billion, up 5% compared to the same period a year ago. If electric utilities and gas plants are excluded, the level of construction starts in 2012 would be up 2% year-to-date, helped by this year's further growth for multifamily housing and the emerging recovery for single family housing. As for the other construction sectors, commercial building has shown some strengthening during 2012 while its dollar amount has grown less than 1% year-to-date, square footage is up 16%. However, decreased activity continues to be reported in 2012 for institutional building, manufacturing plants, and public works. Going into 2013, it's not expected that electric utilities will be able to maintain the record pace witnessed in 2011 and 2012, and tight government budgets will restrain the institutional building and public works sectors. It will be up to housing and commercial building to provide upward momentum, and the impending fiscal cliff' makes continued growth for these sectors less certain Robert Murray, Vice President, Economic Affairs, McGraw-Hill Construction Source: /17/2012

19 September 2012 Construction Spending Residential building in September slipped 1% to $170.3 billion (SAAR). Multifamily housing retreated 10% after its 43% jump in August, which though down for the month still maintains the broader upward trend for this project type Single family housing maintained its gradual upward movement that's been present throughout much of 2012, growing 2% in September. The pace for single family housing in September was 23% higher than what was reported back in January. The 5% increase for total construction on an unadjusted basis during the January-September period of 2012 was the result of heightened activity for two of the three main construction groups. Residential building climbed 26%, with year-to-date gains of 25% for single family housing and 30% for multifamily housing Robert Murray, Vice President, Economic Affairs, McGraw-Hill Construction September 2012 Construction Starts Source: /17/2012
20 Residential Remodeling August 2012 August Residential Remodeling Permits: 3,204,000 (SAAR) 3% above the revised July estimate of 3,112,000 and 5% above August 2011 s 3,053,000 permits 8/2012 US BFRI 3,204,000 remodeling across the country in August 2012: Northeast: 895,000 (-4% from July and +20% from August 2011); South, 1,302,000 (-3% from July and +21% from August 2011); Midwest, 588,000 (+5% from June and -7% from August 2011); and West, 832,000 (+3% from July and +4% from August 2011) (all SAAR). The number of residential remodeling projects in August was the most permitted since April 2008 on a seasonally-adjusted basis Joe Emison, VP-R&D, BuildFax Source: /16//2012
21 Residential Remodeling 2013 LIRA is projecting an acceleration in market activity beginning this quarter, and strengthening as we move into the New Year. LIRA predicts a jump to more than $130 billion in home improvement spending by Q2 2013, a significant increase from Q s $115 billion. While the housing market has faced some unique challenges in recent years, this combination is expected to produce a favorable outlook for home improvement spending over the coming months Eric Belsky, Managing Director, Joint Center for Housing, Harvard U. The Remodeling Market Index climbed five points to 50 in Q3 2012, according to the National Association of Home Builders. It s good to be up to 50 and over 50 in current conditions is sort of a break-even point when equal numbers of remodelers report better than worse conditions Paul Emrath, Vice President. Survey and Housing Policy Research, National Association of Home Builders Homeowners growing preference for using luxury home products is a noteworthy trend, which indicates a top-down recovery for the remodeling industry, with higher-end products disproportionately increasing in use compared with the use of average-price and economy products. Other findings from the report indicating that the use of luxury products is a growing trend in home remodeling: Homeowners describe materials they will use in their remodels as expensive at the highest rate since 2008 The scope and scale of remodeling projects is the largest since 07, with an average remodeling cost estimated to be $100,000 35% of respondents reported that the economy is not affecting their plans to remodel the highest number since % are planning to hire a general contractor the highest percentage since the report started in As the scale of the projects increase, the use of a general contractor typically increases as well Nina Patel, Senior Editor, Remodeling Source: /18/2012; /25/2012; /3/2012

22 Architectural Billing Indicators Architecture firms reported an improvement in business conditions for the second consecutive month in September, as the Architecture Billings Index climbed to a score of 51.6, reflecting the strongest growth in nearly two years. With the general economy continuing to show signs of improvement, there is hope for a more sustained period of recovery for the profession. Inquiries into new work remained strong this month, and fewer firms reported a decline in the value of new design contracts. Just like last month, firms in the South and West regions are reporting growth, while firms in the Northeast and Midwest are reporting weaker firm billings. After nearly five years of declining billings, firms in the West not only reported billings growth for the second month in a row in September, but also had the highest score of all four regions. Firms with a residential specialization recorded their highest scores in nearly seven years, as the demand for rental housing is increasing, interest rates continue to fall, and the mortgage crisis recedes further into the background. Commercial buildings are overbuilt in many areas, and firms specializing in that sector may still see some softness until they are filled Jennifer Riskus, Manager of Economic Research, The American Institute of Architects Source: /24, 2012
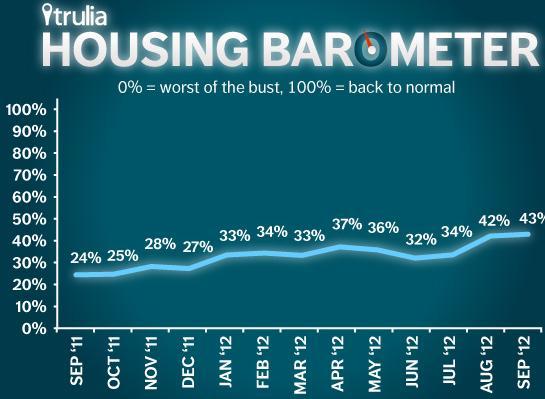
23 Housing Market 43% Back to Normal Latest Trulia Housing Barometer Hits New High in September In September 2012, construction starts surged. However, existing home sales fell slightly, and the delinquency + foreclosure rate unexpectedly jumped. Construction starts held roughly steady. Starts in September were at an 872,000 annualized rate, up 15% month over month and up 35% year over year. Construction activity in September was at its highest level since July Nationally, construction starts are 39% of the way back to normal. Existing home sales slipped a bit in September. After a big increase in August, existing home sales fell 1.7% month over month to 4.75 million in September but that s still a respectable 11% increase from one year ago. Sales are 57% back to normal, which is more than halfway. The delinquency + foreclosure rate jumped back up. In September, 11.27% of mortgages were delinquent or in foreclosure, up from 10.91% in August due to an unexpected increase in the share of delinquent loans. The combined delinquency + foreclosure rate is at its highest level in seven months and is 34% back to normal. Averaging these three back-to-normal percentages together, the housing market is now 43% of the way back to normal compared with 42% in August and 24% in September For the second month in a row, the Housing Barometer is at a post-crisis high Jeff Kolko, Chief Economist, Trulia Housing Research Source: /24/2012


24 Housing Market 43% Back to Normal Source: /24/2012


25 Shiller and Whalen Speak on Housing Robert Shiller Case-Shiller Indices and Professor of Economics, Yale University Why Bernanke Can t Fix the Housing Market on His Own Chris Whalen Senior Managing Director, Tangent Capital Partners LLC U.S. Housing Market is Not in a Real Recovery Audio only Robert Shiller Case-Shiller Indices and Professor of Economics, Yale University Housing Market Could Take 50 Years to Fully Recover Audio only Double click on the photo for the link
26 Standard & Poor s/case-shiller August Home Price Indices As of August 2012, average home prices across the U.S. are back to their summer/autumn 2003 levels for the 10- City and 20-City Composites...from their June/July 2006 peaks, the decline for both Composites is about 30% through August 2012 and approximately 35% from the June / July 2006 peak values. 20-City Composite The 10- and 20-City Composites annual returns of +1.3% and +2.0% in August 2012 an improvement over the +0.6% and +1.2% respective annual rates posted for July of the 20 cities and both Composites posted better annual returns in August compared to July Home prices continued climbing across the country in August 19 of the 20 cities and both Composites showed monthly gains in August. Seventeen cities and both Composites posted positive annual returns in August In 18 cities and both Composites annual rates improved in August versus July. The sustained good news in home prices over the past five months makes us optimistic for continued recovery in the housing market David Blitzer, Chairman of the Index Committee at S&P Dow Jones Indices Source: 17 Case-Shiller and Case-Shiller Indexes and Fiserv; 10/30/2012
27 September 2012 Home Prices Again this month prices rose on a year-over-year basis and our expectation is for that to continue in September based on our pending HPI forecast. The housing markets gains are increasingly geographically diverse with only six states continuing to show declining prices Mark Fleming, Chief Economist, CoreLogic While the housing recovery has been hyper-local, we are now seeing a more bipolar market. Markets where we have seen inventory shortages and that have been extremely affordable due to steep declines in home values are seeing strong appreciation and are also forecasted to continue appreciating over the next year Stan Humphries, Chief Economist, Zillow Real Estate Research Despite the recent trend in home price increases, the average price of a residential property nationwide has decreased 20% over the past four years leaving more than 12 million homeowners owing more than their property is worth, according to RealtyTrac data Daren Blomquist, Vice President, RealtyTrac U.S. M/M Change CoreLogic HPI Index % LPS $205, % NAR $183, % RealtyTrac $260, % Zillow $193, % Source: 18 October ; /22/ 2012; 20 www2.marketwire.com/mw/frame_multimedia?prid=641471&attachid= ; 10/22/2012
28 Delinquencies, Foreclosures, Negative Equity, and Shadow Inventory Delinquent September 2012 Foreclosures Negative Equity Shadow Inventory CoreLogic D 2.7 million 57, million 2.3 million LPS E 3.5 million 201, RealtyTrac F - 180, million - Zillow G per 10,000 homes 15.5 million - Each firm has different estimating methods thus the discrepancy in the data. Source: D 9/13/12; E 8/2012; F www2.marketwire.com: 8/13/12
29 Delinquencies, Foreclosures, Negative Equity, and Shadow Inventory September Commentary Underwater homeowners and unemployed homeowners represent two significant threats for another round of U.S. foreclosures underwater homeowners are lacking in their motivation to keep making mortgage payments, and unemployed homeowners are lacking in their ability to keep making mortgage payments Daren Blomquist, Vice President, RealtyTrac Approximately 1.4 million homes (3.3% of all homes with a mortgage) were in the national foreclosure inventory as of September 2012 compared to 1.5 million (3.5%) in September M/M, the national foreclosure inventory was down 1.1% from August 2012 to September Homes lost to foreclosure in September 2012 are down 50% since the peak month in September 2010 and 22% less than the beginning of the year. While there is significant progress to be made before returning to pre-crisis levels, the trend is in the right direction as short-sales, up 27% year over year in August, continue to gain popularity Mark Fleming, Chief Economist, CoreLogic Source: 20 www2.marketwire.com/mw/frame_multimedia?prid=641471&attachid= ; 10/22/2012; /31/2012

30 Housing and Economics 21 Goldman Sachs ECS Research Housing s Contribution to GDP The direct GDP contribution from residential investment, which includes construction of new homes, improvements and alterations, and broker commissions on sales of new and existing homes. 2. The consumption impact of changes in housing wealth and active mortgage equity withdrawal (MEW), defined as cash-out refinancing and home equity borrowing. 3. Multiplier effects from changes in residential investment or housing wealth/mew via the labor market, bank balance sheets, consumer confidence, and adjacent sectors such as furniture purchases. 1. The impact of housing is shifting into positive territory. The overall impact averaged around -1/4 percentage point in , stands at around +1/4 point now, and is likely to increase to +1/2 point in These numbers are equivalent to a move from a depressed housing market to a normal expansion as we defined it late last year, although they still fall well short of a boom. 2. Most of the positive contribution to growth has so far come from the direct impact of residential investment, which we expect to contribute around 0.3 percentage points to growth next year. 3. It is important to keep the improvement in perspective. Housing is likely to remain less important from a macroeconomic perspective than in the prior cycle, when the combined impact of residential investment and the wealth/mew effect on consumption ranged from +1 percentage point in to -2.5 points in Source: /18/2012

31 Demographics and Economics Median Household Income Index and Unemployment Rate by Month: Jan 2000 to Sep real median annual household income increased by 1.0% ($534) between Aug and Sep. 2012, from $50,904 to $51,438. It is noteworthy that real median annual household income showed an increase of 1.0% between August 2012 and September 2012 despite an increase in the Consumer Price Index of 0.4% during the same time period. The September level of real median annual household income is moderately higher than in January 2012 ($51,067), although there is evidence that the economy continues to struggle. Even though we are technically in an economic recovery, real median annual household income is still having a difficult time recovering. As we have noted in our previous reports, we are watching this household income series closely for signs of any sustained directional movement Dr. Gordon Green, Sentier Research Source: /24/12
32 Economics What Makes This Economic Recovery So Difficult For The U.S. Consumer? Why is it that this economic recovery feels so sluggish to US consumers relative to previous recessions? One answer is that growth in disposable income has been horrible. It explains the relatively weak consumer sentiment and anemic growth in consumer spending. That is why this sudden increase in food and fuel prices is an unwelcome development. With low personal income growth, the US consumer is now far more sensitive to these shocks than during the previous recoveries SoberLook Source: /9/2012
33 Demographics and Renting From 1997 to 2007, the country created about 1.5 million new households a year. In the three years after the Great Recession hit, that number fell to an average of 500,000 Things have turned around a bit, with 1.1 million households formed in By many accounts the behavioral changes wrought by the Great Recession may be here to stay. That s why in recent years, demand for rental housing has left single-family homes in the dust. At Morgan Stanley, analysts expect that preference for renting, coupled with tight lending standards at banks, will keep construction of multi-family rental buildings up. With homeownership rates declining and with household formations beginning to see some cyclical improvement, multi-family starts could run at levels well above the historic norm in coming years and make up a higher share of total starts, wrote Morgan analysts recently. So if you re living in a big old moth-eaten house that your grandparents left you, now is the time to max out some credit cards and convert it into apartments Matt Phillips, Freelance Reporter, The Atlantic Source: /23/2012


34 Renting Trends Source: 10/2012
35 Future Banking Regulations and The Housing Market Mortgage Lenders of All Stripes Paralyzed by Flurry of New Rules The Dodd-Frank Act qualified residential mortgage rule requirement that lenders ensure a borrower has the ability-to-repay a loan essentially requires higher down payments from borrowers Basel III capital standards -- dictates how much risk-based capital banks must hold against certain assets including residential mortgages Banks also are facing higher guarantee fees by Fannie Mae and Freddie Mac and higher premiums for Federal Housing Administration loans In the current environment, all of these rules are going to restrict product and the availability of credit to the credit-impaired. The result is going to be fewer and more expensive loans to lower- and moderate-income and minority borrowers. There are better ways to ensure against predatory lending states attorney Andy Sandler Kate Berry, Reporter, National Mortgage News Source: /23/2012
36 Conclusions September housing construction data surged will seasonal adjustment factors temper this reporting? Possibly, but it appears that starts are catching up with previous month s permit issues. The bigger concern, as written earlier, concerns the sustainability of the increases; indeed, the healing process in housing overall. New and existing house sales, housing starts, and permits are at higher levels however, they are significantly below long-term averages. The number of available new and existing houses for sale currently continue to decline and are at historically low-levels. This also is a positive for the construction market. Interest rates also are at historically low-levels but stricter lending standards inhibit some potential buyers. The remodeling sector continues to be promising; nearly all analysts project a steadily increasing remodeling market. As reported in Slide 21, respondents to a private survey indicated increasing preferences for luxury items in remodeling and more expensive remodels. The proposed finance and banking regulations Dodd-Frank, Basel III, and the Federal Housing Administration bear watching. These in sum or separately, may hinder the housing market though Basel III regulations were recently delayed. Basel III regulations were originally proposed to be implemented in 2015.
37 Conclusions Recent housing data is heartening, but our near-term outlook on the U.S. housing market remains unchanged there remain too many potential negative macro-factors at this point in time for a robust housing recovery. Why? 1) Consumer confidence while rising, most report it is fragile, 2) a lack of well-paying jobs, 3) a sluggish economy 4) declining real median annual household incomes, 5) strict home loan lending standards, and 6) new financing and banking regulations to be implemented in the near future. Until next month. For those of you in the United Sates, we wish you a Happy Thanksgiving.
38 Disclaimer of Non-endorsement Reference herein to any specific commercial products, process, or service by trade name, trademark, manufacturer, or otherwise, does not necessarily constitute or imply its endorsement, recommendation, or favoring by the United States Government. The views and opinions of authors expressed herein do not necessarily state or reflect those of the United States Government, and shall not be used for advertising or product endorsement purposes. Disclaimer of Liability With respect to documents available from this server, neither the United States Government nor any of its employees, makes any warranty, express or implied, including the warranties of merchantability and fitness for a particular purpose, or assumes any legal liability or responsibility for the accuracy, completeness, or usefulness of any information, apparatus, product, or process disclosed, or represents that its use would not infringe privately owned rights. Disclaimer for External Links The appearance of external hyperlinks does not constitute endorsement by the U.S. Department of Agriculture of the linked web sites, or the information, products or services contained therein. Unless otherwise specified, the Department does not exercise any editorial control over the information you may find at these locations. All links are provided with the intent of meeting the mission of the Department and the Forest Service web site. Please let us know about existing external links you believe are inappropriate and about specific additional external links you believe ought to be included. Nondiscrimination Notice The U.S. Department of Agriculture (USDA) prohibits discrimination in all its programs and activities on the basis of race, color, national origin, age, disability, and where applicable, sex, marital status, familial status, parental status, religion, sexual orientation, genetic information, political beliefs, reprisal, or because all or a part of an individual's income is derived from any public assistance program. (Not all prohibited bases apply to all programs.) Persons with disabilities who require alternative means for communication of program information (Braille, large print, audiotape, etc.) should contact USDA's TARGET Center at (voice and TDD). To file a complaint of discrimination write to USDA, Director, Office of Civil Rights, 1400 Independence Avenue, S.W., Washington, D.C or call (voice) or (TDD). The USDA is an equal opportunity provider and employer.
United States Housing Market and Hardwoods
 United States Housing Market and Hardwoods The Future of the Hardwood Lumber Industry Wood Education Resource Center Princeton, WV November 3, 2016 Delton Alderman Forest Products Marketing Unit Forest
November 2018 Housing Commentary
 November 2018 Housing Commentary Urs Buehlmann Department of Sustainable Biomaterials Virginia Tech Blacksburg, VA 540.231.9759 buehlmann@gmail.com and Al Schuler Economist (retired) Princeton, WV Table
United States Housing, 2012
 United States Department of Agriculture United States Housing, 2012 Delton Alderman ABSTRACT Provides current and historical information on housing market in the United States. Information includes trends
The Virginia Tech U.S. Forest Service January 2016 Housing Commentary: Section I
 The Virginia Tech U.S. Forest Service January 2016 Housing Commentary: Section I Urs Buehlmann Department of Sustainable Biomaterials College of Natural Resources & Environment Virginia Tech Blacksburg,
Housing and Economy Market Trends
 Housing and Economy Market Trends Mainstreet Organization Prices of single-family, detached homes in suburban Chicago increased 12.1 percent in May 2014 compared with the same period a year ago. Overall,
The Virginia Tech U.S. Forest Service January 2016 Housing Commentary: Section I
 The Virginia Tech U.S. Forest Service January 2016 Housing Commentary: Section I Urs Buehlmann Department of Sustainable Biomaterials College of Natural Resources & Environment Virginia Tech Blacksburg,
Analysis of Current and Forecasted Demand for Housing in North America
 Analysis of Current and Forecasted Demand for Housing in North America TIMBER MEASUREMENT SOCIETY Central Meeting April 9, 2015 Coeur d Alene, Idaho Delton Alderman Forest Products Marketing Unit Forest
Housing Price Forecasts. Illinois and Chicago PMSA, December 2015
 Housing Price Forecasts Illinois and Chicago PMSA, December 2015 Presented To Illinois Association of Realtors From R E A L Regional Economics Applications Laboratory, Institute of Government and Public
January 2012 Housing Notes
 January 2012 Housing Notes Delton Alderman USDA Forest Service NRS 01 Forestry Sciences Laboratory Princeton, WV 304.431.2734 dalderman@fs.fed.us Urs Buehlmann Department of Sustainable Biomaterials Virginia
By several measures, homebuilding made a comeback in 2012 (Figure 6). After falling another 8.6 percent in 2011, single-family
. After falling another 8.6 percent in 2011, single-family") 2 Housing Markets With sales picking up, low inventories of both new and existing homes helped to firm prices and spur new single-family construction in 212. Multifamily markets posted another strong year,
2 Housing Markets With sales picking up, low inventories of both new and existing homes helped to firm prices and spur new single-family construction in 212. Multifamily markets posted another strong year,
October 2012 Housing Commentary
 October 2012 Housing Commentary Delton Alderman USDA Forest Service NRS-01 Forestry Sciences Laboratory Princeton, WV 304.431.2734 dalderman@fs.fed.us Urs Buehlmann Department of Sustainable Biomaterials
Housing Price Forecasts. Illinois and Chicago PMSA, May 2018
 Housing Price Forecasts Illinois and Chicago PMSA, May 2018 Presented To Illinois Realtors From R E A L Regional Economics Applications Laboratory, Institute of Government and Public Affairs University
The Virginia Tech U.S. Forest Service June 2016 Housing Commentary: Section I
 The Virginia Tech U.S. Forest Service June Housing Commentary: Section I Urs Buehlmann Department of Sustainable Biomaterials College of Natural Resources & Environment Virginia Tech Blacksburg, VA 540.231.9759
Housing Price Forecasts. Illinois and Chicago PMSA, January 2018
 Housing Price Forecasts Illinois and Chicago PMSA, January 2018 Presented To Illinois Realtors From R E A L Regional Economics Applications Laboratory, Institute of Government and Public Affairs University
Economic Highlights. Payroll Employment Growth by State 1. Durable Goods 2. The Conference Board Consumer Confidence Index 3
 August 26, 2009 Economic Highlights Southeastern Employment Payroll Employment Growth by State 1 Manufacturing Durable Goods 2 Consumer Spending The Conference Board Consumer Confidence Index 3 Real Estate
The Virginia Tech U.S. Forest Service April 2016 Housing Commentary: Section I
 The Virginia Tech U.S. Forest Service April Housing Commentary: Section I Urs Buehlmann Department of Sustainable Biomaterials College of Natural Resources & Environment Virginia Tech Blacksburg, VA 54.231.9759
With last month's gain, sales are now up 4.5% from May 2015 and are at their highest annual pace since February 2007.
 JULY 2016 With last month's gain, sales are now up 4.5% from May 2015 and are at their highest annual pace since February 2007. - Lawrence Yun NAR s Chief Economist Now in its seventh year, the US economic
Housing Price Forecasts. Illinois and Chicago PMSA, October 2014
 Housing Price Forecasts Illinois and Chicago PMSA, October 2014 Presented To Illinois Association of Realtors From R E A L Regional Economics Applications Laboratory, Institute of Government and Public
Housing Price Forecasts. Illinois and Chicago PMSA, April 2018
 Housing Price Forecasts Illinois and Chicago PMSA, April 2018 Presented To Illinois Realtors From R E A L Regional Economics Applications Laboratory, Institute of Government and Public Affairs University
REAL ESTATE AND THE ECONOMIC OUTLOOK THROUGH 2013:
 1 1 REAL ESTATE AND THE ECONOMIC OUTLOOK THROUGH 2013: Coping With A Different Kind Of Housing Recovery A Presentation To The Commercial Real Estate Education Summit Monrovia, California July 13, 2012
Housing Price Forecasts. Illinois and Chicago PMSA, August 2017
 Housing Price Forecasts Illinois and Chicago PMSA, August 2017 Presented To Illinois Realtors From R E A L Regional Economics Applications Laboratory, Institute of Government and Public Affairs University
MARKET OUTLOOK FOR SAN MATEO
 MARKET OUTLOOK FOR SAN MATEO Jonathan Smoke Chief Economist August 2, 2016 NATIONAL TRENDS 2 JOB CREATION REBOUNDED IN JUNE 229,000 jobs created by month in 2015; 172,000 average this year Employment and
2013 Housing Market Forecast. SILVAR: Los Gatos/Saratoga District October 10, 2012 Leslie Appleton-Young, Vice President & Chief Economist
 2013 Housing Market Forecast SILVAR: Los Gatos/Saratoga District October 10, 2012 Leslie Appleton-Young, Vice President & Chief Economist What we saw from the roof.. C.A.R. NAR THE ECONOMY Recent Housing
Housing Price Forecasts. Illinois and Chicago PMSA, June 2012
 Housing Price Forecasts Illinois and Chicago PMSA, June 2012 Presented To Illinois Association of REALTORS From R E A L Regional Economics Applications Laboratory, Institute of Government and Public Affairs
CONTENTS. Executive Summary 1. Southern Nevada Economic Situation 2 Household Sector 5 Tourism & Hospitality Industry
 CONTENTS Executive Summary 1 Southern Nevada Economic Situation 2 Household Sector 5 Tourism & Hospitality Industry Residential Trends 7 Existing Home Sales 11 Property Management Market 12 Foreclosure
This Month in Real Estate
 Keller Williams Research This Month in Real Estate Released: September 14, 2009 Commentary. The Numbers That Drive Real Estate Recent Government Action. Research for Buyers and Sellers. 2 4 10 14 1 Green
Owner spending on improvements to existing homes also rose over the past year. Benefiting from strengthening house sales, CONSTRUCTION RECOVERY
 2 Housing Markets After another year of healthy growth in 213, the housing market paused in the first quarter of 214. The renewed weakness in residential construction, sales, and prices raised fears that
Housing Price Forecasts. Illinois and Chicago PMSA, March 2018
 Housing Price Forecasts Illinois and Chicago PMSA, March 2018 Presented To Illinois Realtors From R E A L Regional Economics Applications Laboratory, Institute of Government and Public Affairs University
Housing Price Forecasts. Illinois and Chicago PMSA, March 2016
 Housing Price Forecasts Illinois and Chicago PMSA, March 2016 Presented To Illinois Association of Realtors From R E A L Regional Economics Applications Laboratory, Institute of Government and Public Affairs
Released: June Commentary 2. The Numbers That Drive Real Estate 3. Recent Government Action 9. Topics for Home Buyers, Sellers, and Owners 11
 Released: June 2011 Commentary 2 The Numbers That Drive Real Estate 3 Recent Government Action 9 Topics for Home Buyers, Sellers, and Owners 11 Brought to you by: KW Research Commentary The U.S. housing
MARKET STRATEGY VIEWPOINT U.S. Housing Decelerating
 Jan-01 Oct-01 Jul-02 Apr-03 Jan-0 Oct-0 Jul-05 Apr-0 Jan-07 Oct-07 Jul-08 Apr-09 Jan-10 Oct-10 Jul-11 Apr-12 Jan-13 Oct-13 Jul-1 Apr-15 Jan-1 Oct-1 Jul-17 Apr-18 U.S. Housing Decelerating August 27, 2018
DETACHED MULTI-UNIT APPROVALS
 HIA New Home Sales DETACHED MULTI-UNIT APPROVALS SALES MULTI-UNIT DETACHED A monthly update on the sales of new homes December 217 TAX BURDEN TAKES TOLL ON New Home Sales during 217 Sales still post modest
HOUSING MARKETS CONSTRUCTION GAINING MOMENTUM JOINT CENTER FOR HOUSING STUDIES OF HARVARD UNIVERSITY
 2 HOUSING MARKETS After a mixed year in 214, the national housing recovery gained traction in 215. Residential construction continued to climb as single-family starts revived. Sales of both new and existing
The Virginia Tech U.S. Forest Service February 2016 Housing Commentary: Section I
 The Virginia Tech U.S. Forest Service February 2016 Housing Commentary: Section I Urs Buehlmann Department of Sustainable Biomaterials College of Natural Resources & Environment Virginia Tech Blacksburg,
Housing Price Forecasts. Illinois and Chicago PMSA, July 2016
 Housing Price Forecasts Illinois and Chicago PMSA, July 2016 Presented To Illinois Association of Realtors From R E A L Regional Economics Applications Laboratory, Institute of Government and Public Affairs
Minneapolis St. Paul Residential Real Estate Index
 University of St. Thomas Minneapolis St. Paul Residential Real Estate Index Welcome to the latest edition of the UST Minneapolis St. Paul Residential Real Estate Index. The University of St Thomas Residential
Market Trends and Outlook
 Residential Remodeling Market Trends and Outlook Kermit Baker Remodeling Futures Conference April 3, 2012 Remodeling Market Overview 1. Home improvement spending totaled an estimated $290 billion last
1200 Premier Drive, Suite 140 Chattanooga, TN Each office is independently owned and operated.
 THIS MONTH IN REAL ESTATE K im aulston R REALTOR 1200 Premier Drive, Suite 140 Chattanooga, TN 37421 Each office is independently owned and operated. Cell: 423-316-4022 Office: 423-664-1600 Email: kcraulston@gmail.com
The State of the Nation s Housing
 The State of the Nation s Housing Eric S. Belsky Remodeling Futures Conference April 13, 21 www.jchs.harvard.edu Existing Home Sales Improved then Retracted, While New Home Sales Are Still in the Basement
Remodeling Trends and Outlook
 Remodeling Trends and Outlook Kermit Baker Remodeling Futures Conference October 16, 2007 www.jchs.harvard.edu Recent Remodeling Trends Growth in remodeling spending began to ease in Q3-2006. After Strong
State of the Nation s Housing 2008: A Preview
 State of the Nation s Housing 28: A Preview Eric S. Belsky Remodeling Futures Conference April 15, 28 www.jchs.harvard.edu The Housing Market Has Suffered Steep Declines Percent Change Median Existing
Nothing Draws a Crowd Like a Crowd: The Outlook for Home Sales
 APRIL 2018 Nothing Draws a Crowd Like a Crowd: The Outlook for Home Sales The U.S. economy posted strong growth with fourth quarter 2017 Real Gross Domestic Product (real GDP) growth revised upwards to
Connecticut First Nine Months Housing Report 2014
 Connecticut First Nine Months Housing Report 2014 First Nine Months of 2014 Highlight Positive Outlook for Multi-family Home Construction Millennial buyers are finally increasing their rate of household
OBSERVATION. TD Economics IS THE AMERICAN HOUSING REBOUND SUSTAINABLE?
 OBSERVATION TD Economics IS THE AMERICAN HOUSING REBOUND SUSTAINABLE? Highlights 2012 was a very good year for the U.S. housing market. Home prices were up almost 8% and housing starts by close to 30%.
RESIDENTIAL MARKET ANALYSIS
 RESIDENTIAL MARKET ANALYSIS CLANCY TERRY RMLS Student Fellow Master of Real Estate Development Candidate Oregon and national housing markets both demonstrated shifting trends in the first quarter of 2015
Housing Price Forecasts. Illinois and Chicago PMSA, January 2019
 Housing Price Forecasts Illinois and Chicago PMSA, January 2019 Presented To Illinois Realtors From R E A L Regional Economics Applications Laboratory, Institute of Government and Public Affairs University
Jim & Jim McKenna LBA & LSA TheJims.com
 Jim & Jim McKenna LBA & LSA 631-974-9151 TheJims.com Return on Investment January 2000 March 2013 MSN Money.com, Case Shiller Pending Home Sales 110 105 100 95 90 Jan Feb Mar Apr May Jun Jul Aug Sep Oct
} Construction jobs have
 Texas Housing Market Finally Building a Solid Recovery By D Ann Petersen } Construction jobs have contributed to total employment consistently beginning this year, making construction the last of the major
THE OUTLOOK FOR HOUSING IN ILLINOIS
 THE OUTLOOK FOR HOUSING IN ILLINOIS Jonathan Smoke Chief Economist January 25, 2017 NATIONAL TRENDS 2 2000.01 2000.05 2000.09 2001.01 2001.05 2001.09 2002.01 2002.05 2002.09 2003.01 2003.05 2003.09 2004.01
CONTENTS. Executive Summary. Southern Nevada Economic Situation 1 Household Sector 4 Tourism & Hospitality Industry
 CONTENTS Executive Summary Southern Nevada Economic Situation 1 Household Sector 4 Tourism & Hospitality Industry Residential Trends 6 Existing Home Sales 10 Property Management Market 11 Foreclosure Situation
Understanding and Utilizing Today s Real Estate Data
 Understanding and Utilizing Today s Real Estate Data MATT Dollinger Why Matt? KCM Divided into Three Sections Existing Home Sales S&P Case Shiller 10/2013 Pending Home Sales 100 = Historically Healthy
The state of the nation s Housing 2011
 The state of the nation s Housing 2011 Fact Sheet PURPOSE The State of the Nation s Housing report has been released annually by Harvard University s Joint Center for Housing Studies since 1988. Now in
Released: June 7, 2010
 Released: June 7, 2010 Commentary 2 The Numbers That Drive Real Estate 3 Recent Government Action 9 Topics for Home Buyers, Sellers, and Owners 11 Brought to you by: KW Research Commentary The housing
The Virginia Tech U.S. Forest Service August 2017 Housing Commentary: Section I
 The Virginia Tech U.S. Forest Service August 2017 Housing Commentary: Section I Urs Buehlmann Department of Sustainable Biomaterials College of Natural Resources & Environment Virginia Tech Blacksburg,
Housing Price Forecasts. Illinois and Chicago PMSA, August 2016
 Housing Price Forecasts Illinois and Chicago PMSA, August 2016 Presented To Illinois Association of Realtors From R E A L Regional Economics Applications Laboratory, Institute of Government and Public
Young-Adult Housing Demand Continues to Slide, But Young Homeowners Experience Vastly Improved Affordability
 Young-Adult Housing Demand Continues to Slide, But Young Homeowners Experience Vastly Improved Affordability September 3, 14 The bad news is that household formation and homeownership among young adults
Released: May 7, 2010
 Released: May 7, 2010 Commentary 2 The Numbers That Drive Real Estate 3 Recent Government Action 9 Topics for Home Buyers, Sellers, and Owners 11 Brought to you by: KW Research Commentary The economic
DETACHED MULTI-UNIT APPROVALS
 HIA New Home Sales DETACHED MULTI-UNIT APPROVALS SALES MULTI-UNIT DETACHED A monthly update on the sales of new homes September 214 MULTI-UNIT SALES REACH New Cyclical Peak The HIA New Home Sales Report
San Francisco Bay Area to Napa County Housing and Economic Outlook
 San Francisco Bay Area to 019 Napa County Housing and Economic Outlook Bay Area Economic Forecast Summary Presented by Pacific Union International, Inc. and John Burns Real Estate Consulting, LLC On Nov.
The Virginia Tech U.S. Forest Service December 2017 Housing Commentary: Section I
 The Virginia Tech U.S. Forest Service December 2017 Housing Commentary: Section I Urs Buehlmann Department of Sustainable Biomaterials College of Natural Resources & Environment Virginia Tech Blacksburg,
2017 MORTGAGE MARKET OUTLOOK: EXECUTIVE HOUSING REPORT JANUARY 2017
 2017 MORTGAGE MARKET OUTLOOK: EXECUTIVE HOUSING REPORT JANUARY 2017 1 2017 FORECAST OVERVIEW For the 2017 housing market, the outlook is generally positive. The long recovery from the elevated delinquency
2013 Arizona Housing Market Mid-Year Report
 2013 Arizona Housing Market Mid-Year Report This mid-year market report outlines the latest trends in Arizona real estate. The housing market hit bottom in mid to late 2011, and has been in recovery mode
Housing Price Forecasts. Illinois and Chicago PMSA, April 2013
 Housing Price Forecasts Illinois and Chicago PMSA, April 2013 Presented To Illinois Association of Realtors From R E A L Regional Economics Applications Laboratory, Institute of Government and Public Affairs
2017 RESIDENTIAL REAL ESTATE MARKET REPORT
 2017 RESIDENTIAL REAL ESTATE MARKET REPORT Published January 26, 2018 Our market reports have been focused on the effects of low inventory on our housing market and for good reason. December 2017 marked
Presented to Membership of the Lake Gaston Association. Christine Thompson. June 10, 2014
 Presented to Membership of the Lake Gaston Association Christine Thompson June 10, 2014 About your speaker Christine Thompson Real Estate Sales & Service at Lake Gaston for 13+ years Advanced training
The Impact of Distressed Properties on Neighboring Values... 8
 why now is a great time to sell 2nd QUARTER 2011 table of contents 5 Reasons You Should Consider Selling Now... 1 Will I Get More Money If I Wait?... 3 Almost 14,000 Houses Sold Yesterday... 4 What Exactly
STRENGTHENING RENTER DEMAND
 5 Rental Housing Rental housing markets experienced another strong year in 2012, with the number of renter households rising by over 1.1 million and marking a decade of unprecedented growth. New construction
HOUSING MARKETS. Strength in Early 2005 Pushed Most National Housing Indicators into Record Territory
 HOUSING MARKETS Despite another record-setting performance, housing markets showed clear signs of cooling late in 2005. As mortgage interest rates moved up and house prices soared, home sales turned down
CONTINUED STRONG DEMAND
 Rental Housing Although slowing, renter household growth continued to soar in 13. The strength of demand has kept rental markets tight across the country, pushing up rents and spurring new construction.
2018 Real Estate Forecast Breakfast. Real Estate Market Update
 2018 Real Estate Forecast Breakfast Central Oregon Association of REALTORS Real Estate Market Update Paul C. Bishop, PhD, CBE Vice President, Research NATIONAL ASSOCIATION OF REALTORS February 22, 2018
Characteristics of Recent Home Buyers
 Characteristics of Recent Home Buyers Special Studies, February 1, 2019 By Carmel Ford Economics and Housing Policy National Association of Home Builders Introduction To analyze home buyers NAHB uses the
Housing Price Forecasts. Illinois and Chicago PMSA, March 2017
 Housing Price Forecasts Illinois and Chicago PMSA, March 2017 Presented To Illinois Realtors From R E A L Regional Economics Applications Laboratory, Institute of Government and Public Affairs University
M A R K E T W A T C H
 This is a periodic communication from Cartus intended to keep you informed about the current property market trends and conditions in the United States. There is good news in the recovering real estate
Released: February 8, 2011
 Released: February 8, 2011 Commentary 2 The Numbers That Drive Real Estate 3 Recent Government Action 10 Topics for Home Buyers, Sellers, and Owners 13 Brought to you by: KW Research Commentary Gradual
Linkages Between Chinese and Indian Economies and American Real Estate Markets
 Linkages Between Chinese and Indian Economies and American Real Estate Markets Like everything else, the real estate market is affected by global forces. ANTHONY DOWNS IN THE 2004 presidential campaign,
The Profile for Residential Building Approvals by Type and Geography
 The Profile for Residential Building Approvals by Type and Geography Key Points: ABS Building Approvals for Australia peaked back in October 2015. As we have frequently highlighted, approvals have subsequently
Residential Real Estate Market Overview: September 2017 Data
 Residential Real Estate Market Overview: September 2017 Data 2017 Mark A. Melikian Chief Valuation Officer mark.melikian@summitvaluations.com 2800 River Road, Suite 460 The following is a market data summary
This Month in Real Estate
 Keller Williams Research This Month in Real Estate Released: June 11, 2009 Commentary. The Numbers That Drive Real Estate Recent Government Action. Research for Buyers and Sellers. 2 4 10 13 1 Green Shoots
INLAND EMPIRE REGIONAL INTELLIGENCE REPORT
 INLAND EMPIRE REGIONAL INTELLIGENCE REPORT June 2016 EMPLOYMENT After a slow start to 2016, the Inland Empire s labor market returned to form, in recent job figures. Seasonally adjusted nonfarm employment
Real gross domestic product California vs. United States
 Real gross domestic product California vs. United States Percent change, year ago 6 4 U.S. California 2 0-2 -4-6 2001 2002 2003 2004 2005 2006 2007 2008 2009 2010 2011 Source: Bureau of Economic Analysis.
The Virginia Tech U.S. Forest Service October 2016 Housing Commentary: Section I
 The Virginia Tech U.S. Forest Service October 2016 Housing Commentary: Section I Urs Buehlmann Department of Sustainable Biomaterials College of Natural Resources & Environment Virginia Tech Blacksburg,
Median Income and Median Home Price
 Homeownership Remains Unaffordable; Rental Affordability Showing Signs of Improvement Richard E. Taylor, Research Manager at MaineHousing MaineHousing has released the 217 Maine Homeownership and Rental
San Francisco Bay Area to Marin, San Francisco, and San Mateo Counties Housing and Economic Outlook
 San Francisco Bay Area to 019 Marin, San Francisco, and San Mateo Counties Housing and Economic Outlook Bay Area Economic Forecast Summary Presented by Pacific Union International, Inc. and John Burns
LANDLORDS CAUTIOUS AHEAD OF TAX CHANGES
 FEBRUARY 2017 Q4 2016 LANDLORDS CAUTIOUS AHEAD OF TAX CHANGES Despite turbulence in the Private Rented Sector (PRS) dating back to the Government s 2015 Summer Budget, Paragon Mortgages latest PRS Trends
Minneapolis St. Paul Residential Real Estate Index
 University of St. Thomas Minneapolis St. Paul Residential Real Estate Index September 2017 Welcome to the latest edition of the UST Minneapolis St. Paul Residential Real Estate Index. The University of
Economic and Housing Update
 Economic and Housing Update Mark Palim Vice President, Applied Economic and Housing Research Fannie Mae January 14, 2015 2012 Fannie Mae. Trademarks of Fannie Mae. Economic Activity Rebounding Solidly
Economic Highlights. Retail Sales Components 1. University of Michigan Consumer Sentiment Index 2. Industrial Production and Capacity Utilization 3
 November 17, 2010 Economic Highlights Consumer Spending Retail Sales Components 1 University of Michigan Consumer Sentiment Index 2 Manufacturing Industrial Production and Capacity Utilization 3 Real Estate
Annual Report On Our National Real Estate Market
 A TWINCITIESPROPERTYFINDER.COM RESOURCE Annual Report On Our National Real Estate Market 1 Contents Industry Facts 3 Mortgage Stats 4 Distressed Properties & Price Information 5 Today s Buyer 6 First-Time
San Francisco Bay Area to Santa Clara & San Benito Counties Housing and Economic Outlook
 San Francisco Bay Area to 019 Santa Clara & San Benito Counties Housing and Economic Outlook Bay Area Economic Forecast Summary Presented by Pacific Union International, Inc. and John Burns Real Estate
The supply of single-family homes for sale remains
 Oh Give Me a (Single-Family Rental) Home Harold D. Hunt and Clare Losey December, 18 Publication 2218 The supply of single-family homes for sale remains tight in many markets across the United States.
Minneapolis St. Paul Residential Real Estate Index
 University of St. Thomas Minneapolis St. Paul Residential Real Estate Index Welcome to the latest edition of the UST Minneapolis St. Paul Residential Real Estate Index. The University of St Thomas Residential
Housing Price Forecasts. Illinois and Chicago PMSA, March 2019
 Housing Price Forecasts Illinois and Chicago PMSA, March 2019 Presented To Illinois Realtors From R E A L Regional Economics Applications Laboratory, Institute of Government and Public Affairs University
Housing Price Forecasts. Illinois and Chicago PMSA, September 2016
 Housing Price Forecasts Illinois and Chicago PMSA, September 2016 Presented To Illinois Realtors From R E A L Regional Economics Applications Laboratory, Institute of Government and Public Affairs University
Estimating National Levels of Home Improvement and Repair Spending by Rental Property Owners
 Joint Center for Housing Studies Harvard University Estimating National Levels of Home Improvement and Repair Spending by Rental Property Owners Abbe Will October 2010 N10-2 2010 by Abbe Will. All rights
Economic and Housing Market Outlook ( ) October 31, Contra Costa AOR
 October 31, Contra Costa AOR") Economic and Housing Market Outlook (2012 2013) Contra Costa AOR October 31, 2012 Oscar Wei Senior Research Analyst California Association of REALTORS Overview US and California Economies California Housing
Economic and Housing Market Outlook (2012 2013) Contra Costa AOR October 31, 2012 Oscar Wei Senior Research Analyst California Association of REALTORS Overview US and California Economies California Housing
Housing Market Update
 Housing Market Update March 2017 New Hampshire s Housing Market and Challenges Market Overview Dean J. Christon Executive Director, New Hampshire Housing Finance Authority New Hampshire s current housing
Blackstone-Fueled Single-Family Home Boom Lifts Chicago
 ESTM1998 MACK INVESTMENTS Blackstone-Fueled Single-Family Home Boom Lifts Chicago By: Bloomberg February 14, 2014 The tan, three-bedroom house on Chicago s North Side sits half a block from a Family Dollar
Metropolitan Indianapolis Board of REALTORS. Broker/Owner Meeting March 14, 2007
 Metropolitan Indianapolis Board of REALTORS Broker/Owner Meeting March 14, 2007 Tom Renkert Information Services Director MIBOR PropertyLinx 2 Implementation Time Line February 1-28 March 1 June 30 July
TUCSON and SOUTHERN ARIZONA
 TUCSON and SOUTHERN ARIZONA End of Year Housing Report (52) 818-454 Stephen@TeamWoodall.com 217 End of Year Housing Report SALES & INVENTORY Housing market trends For the overall real estate market in
FOR IMMEDIATE RELEASE Contact: David B. Bennett President & CEO Phone:
 FOR IMMEDIATE RELEASE Contact: David B. Bennett President & CEO Phone: 727-216-32 Email: dbennett@tampabayrealtor.com Real Estate Statistics for September 217 September s numbers are out, and it comes