The Virginia Tech U.S. Forest Service October 2016 Housing Commentary: Section I
|
|
|
- Drusilla Crawford
- 5 years ago
- Views:
Transcription


1 The Virginia Tech U.S. Forest Service October 2016 Housing Commentary: Section I Urs Buehlmann Department of Sustainable Biomaterials College of Natural Resources & Environment Virginia Tech Blacksburg, VA buehlmann@gmail.com Delton Alderman Forest Products Marketing Unit Forest Products Laboratory U.S. Forest Service Madison, WI dalderman@fs.fed.us 2016 Virginia Polytechnic Institute and State University ANR-237NP Virginia Cooperative Extension programs and employment are open to all, regardless of age, color, disability, gender, gender identity, gender expression, national origin, political affiliation, race, religion, sexual orientation, genetic information, veteran status, or any other basis protected by law. An equal opportunity/affirmative action employer. Issued in furtherance of Cooperative Extension work, Virginia Polytechnic Institute and State University, Virginia State University, and the U.S. Department of Agriculture cooperating. Edwin J. Jones, Director, Virginia Cooperative Extension, Virginia Tech, Blacksburg; M. Ray McKinnie, Interim Administrator, 1890 Extension Program, Virginia State University, Petersburg.
2 Table of Contents Slide 3: Summary Slide 4: Housing Scorecard Slide 5: Wood Use in Construction Slide 7: New Housing Starts Slide 9: Regional Housing Starts Slide 20: New Housing Permits Slide 22: Regional New Housing Permits Slide 27: Housing Under Construction Slide 29: Regional Under Construction Slide 36: Housing Completions Slide 38: Regional Housing Completions Slide 43: New Single-Family House Sales Slide 46: New Sales-Population Ratio Slide 47: Regional SF House Sales & Price Slide 55: Construction Spending Slide 58: Construction Spending Shares Slide 62: Existing House Sales Slide 63: Existing Sales by Price & Region Slide 75: First-Time Purchasers Slide 79: Affordability Slide 80: Summary Slide 81: Virginia Tech Disclaimer Slide 82: USDA Disclaimer This report is a free monthly service of Virginia Tech. Past issues can be found at: To request the report, please buehlmann@gmail.com
3 Summary In October, aggregate monthly housing data, based on a month-over-month comparison, were decidedly positive. New housing starts rebounded sharply from September. Yet, new singlefamily house sales were negative on a month-over-month and single-family construction spending was negative year-over-year. New single-family sales have been mixed for the past few months. The December 9th Atlanta Fed GDPNow model projects aggregate residential investment spending to increase at a 10.7 percent seasonally adjusted annual rate; new residential investment spending was estimated to rise 12.4 percent; and improvements were projected to increase 4.3 percent in Regionally, data were mixed across all sectors. In the heyday of , the [housing] sector contributed, on average, 33.4 percent to nominal fixed investment in the economy and 6.3 percent to nominal gross domestic product (GDP). Those figures fell sharply after 2008 before edging up to 23.3 percent and 3.8 percent, respectively, this year, still lower than the average for the last 35 years. The failure of these figures to reach pre-recession levels, however, is likely due more to the scale of the housing bubble leading up to the Great Recession than to an unnaturally slow pace of recovery. That said, not everything is going back to the way it was. Two trends have emerged that differentiate the current situation from the pre-bubble period: Homeownership rates remain on the decline, and new construction is more heavily weighted toward multifamily buildings. If they continue, these trends could influence the outcome of important policy discussions on topics as diverse as tax reform and transportation planning. 2 Dr. Patricia Buckley, Managing Director for Economics, and Akrur Barua, Economist, Deloitte Services LP. This month s commentary contains pertinent housing data; data exploration; new and existing single-family housing; economics; and demographics. Section I contains data and commentary and Section II includes Federal Reserve analysis; private indicators; and demographic commentary. We hope you find this commentary beneficial. Sources: /9/ /6/16
4 October 2016 Housing Scorecard M/M Y/Y Housing Starts 25.5% 23.3% Single-Family Starts 10.7% 21.7% Housing Permits 0.3% 4.6% Single-Family Permits 2.7% 5.1% Housing Completions 5.5% 7.2% New Single-Family House Sales 1.9% 17.8% Private Residential Construction Spending 1.6% 4.7% Single-Family Construction Spending 2.8% 1.6% Existing House Sales 1 2.0% 5.9% M/M = month-over-month; Y/Y = year-over-year; NC = no change Source: U.S. Department of Commerce-Construction; 1 National Association of Realtors (NAR )
5 New Construction s Percentage of Wood Products Consumption 22% Non-structural panels: New Housing Structural panels: New housing 78% Other markets 64% 36% Other markets 29% All Sawnwood: New housing 71% Other markets Source: U.S. Forest Service. Howard, J. and D. McKeever U.S. Forest Products Annual Market Review and Prospects,
6 Repair and Remodeling s Percentage of Wood Products Consumption 14% Non-structural panels: Remodeling 22% Structural panels: Remodeling Other markets Other markets 86% 78% 23% All Sawnwood: Remodeling Other markets 77% Source: U.S. Forest Service. Howard, J. and D. McKeever U.S. Forest Products Annual Market Review and Prospects,
7 New Housing Starts Total Starts SF Starts MF 2-4 Starts MF 5 Starts October 1,323, ,000 9, ,000 September 1,054, ,000 14, , ,073, ,000 11, ,000 M/M change 25.5% 10.7% -35.7% 74.5% Y/Y change 23.3% 21.7% -18.2% 28.2% * All start data are presented at a seasonally adjusted annual rate (SAAR). ** US DOC does not report 2 to 4 multifamily starts directly, this is an estimation ((Total starts (SF + 5 unit MF)). Source: 11/17/16
8 Total Housing Starts 2,000 1,750 1,500 SAAR = Seasonally adjusted annual rate; in thousands Total starts 57-year average: 1,443 mm units SF starts 57-year average: 1,025 mm units MF starts 52-year average: 420 m units 1,250 1,000 Total October Starts: 1,323 mm units SF Starts 2-4 MF Starts 5 MF Starts Source: 11/17/16
9 New Housing Starts by Region NE Total NE SF NE MF** October 139,000 69,000 70,000 September 96,000 62,000 34, ,000 59,000 77,000 M/M change 44.8% 11.3% 105.9% Y/Y change 2.2% 16.9% -9.1% MW Total MW SF MW MF October 219, ,000 96,000 September 152, ,000 36, , ,000 60,000 M/M change 44.1% 6.0% 166.7% Y/Y change 24.4% 6.0% 60.0% All data are SAAR; NE = Northeast and MW = Midwest. ** US DOC does not report multifamily starts directly, this is an estimation (Total starts SF starts). Source: 11/17/16
10 New Housing Starts by Region S Total S SF S MF** October 620, , ,000 September 526, , , , , ,000 M/M change 17.9% 7.3% 61.2% Y/Y change 20.4% 21.4% 17.7% W Total W SF W MF October 345, , ,000 September 280, ,000 96, , ,000 81,000 M/M change 23.2% 21.2% 27.1% Y/Y change 40.2% 35.2% 50.6% All data are SAAR; S = South and W = West. ** US DOC does not report multifamily starts directly, this is an estimation (Total starts SF starts). Source: 11/17/16
11 Total Housing Starts by Region 1,100 SAAR; in thousands 1, Total NE Starts NE MF Starts Total S Starts Total W Starts Source: 11/17/16
12 SF Housing Starts by Region 900 SAAR; in thousands Jan 2016 Feb Mar Apr May Jun 2016 Jul Aug Sep Oct 2016 NE SF Starts MW SF Starts S SF Starts W SF Starts Source: 11/17/16
13 Nominal & SAAR SF Housing Starts Jul Aug 2015 Sep 2015 Oct 2015 Nov 2015 Dec 2015 Jan 2016 Feb Mar 2016 Apr 2016 May 2016 Jun 2016 Jul 2016 Aug 2016 Sep 2016 Oct New SF Starts (adj) Apparent Expansion Factor New SF Starts (non-adj) Nominal and Adjusted New SF Monthly Sales Presented above is nominal (non-adjusted) new SF start data contrasted against SAAR data. The apparent expansion factor is the ratio of the unadjusted number of houses started in the US to the seasonally adjusted number of houses started in the US (i.e., to the sum of the seasonally adjusted values for the four regions). U.S. DOC-Construction Source: 11/17/16
14 MF Housing Starts by Region 250 SAAR; in thousands NE MF Starts MW MF Starts S MF Starts W MF Starts Source: 11/17/16
15 Housing Starts by Percent 100.0% 90.0% 80.0% 70.0% 78.5% 60.0% 65.7% 50.0% 40.0% 34.3% 30.0% 20.0% 21.5% 10.0% 0.0% Jan Feb Mar Apr May Jun Jul Aug Sep Oct Single-Family Starts - % Multi-Family Starts - % Source: 11/17/16
16 Railroad Lumber & Wood Shipments vs. U.S. SF Housing Starts 10,000 9,000 8,000 LHS: Lumber shipments in thousands RHS: SF Starts 1,400 1,200 7,000 1,000 6, ,000 4, , ,000 1,000 - Data are average weekly originations for each month, are not seasonally adjusted, and do not include intermodal. AAR Lumber & Wood Shipments (U.S. + Canada) SF Starts Sources: Association of American Railroads (AAR), Rail Time Indicators report 10/7/16; U.S. DOC-Construction; 11/17/16 Return Return to TOC TOC
17 Railroad Lumber & Wood Shipments vs. U.S. SF Housing Starts: 6-month Offset 10,000 9,000 8,000 7,000 6,000 5,000 4,000 3,000 2,000 1,000 - LHS: Lumber shipments in thousands RHS: SF Starts Data are average weekly originations for each month, are not seasonally adjusted, and do not include intermodal. AAR 1,400 1,200 1, Lumber & Wood Shipments (U.S. + Canada) SF Starts (6-mo. offset) In this graph, January 2007 lumber shipments are contrasted with October 2007 SF starts, and continuing through October 2016 SF starts. The purpose is to discover if lumber shipments relate to future singlefamily starts. Also, it is realized that lumber and wood products are trucked; however, to our knowledge comprehensive trucking data is not available. Sources: Association of American Railroads (AAR), Rail Time Indicators report 10/7/16; U.S. DOC-Construction; 11/17/16 Return Return to TOC TOC

18 Single-Family Built-for-Rent Construction The number of single-family homes built-for-rent posted gains over the last year. However, the built-forrent market is a small portion of the total single-family development, so care must be taken when identifying trends. For the last four quarters, single-family built-for-rent starts totaled 34,000 homes. This marks positive growth over the 28,000 estimated for the four quarters prior. This class of single-family construction excludes homes that are sold to another party for rental purposes. It only includes homes built and held for rental purposes. Robert Dietz, Chief Economist and Senior Vice President for Economics and Housing Policy, NAHB Sources: 11/28/16 Return Return to TOC TOC
19 Single-Family Built-for-Rent Construction According to data from the Census Bureau s Quarterly Starts and Completions by Purpose and Design and NAHB analysis, the market share of single-family homes built-for-rent, as measured on a one-year moving average, stood at 4.4% of total starts as of the third quarter of Given the small size of the market segment, the quarter-to-quarter movements are not typically statistically significant. The current market share remains higher than the historical average of 2.8% but is down from the 5.8% reading registered at the start of With the onset of the Great Recession and the ongoing declines in the homeownership rate, the share of built-for-rent homes rose. Despite the current elevated market concentration, the total number of single-family starts built-for-rent remains low in terms of the total building market. However, after falling during 2013, the market share has grown over the past year. Of course, the built-for-rent share of single-family homes is considerably smaller than the singlefamily home portion of the rental housing stock, which is 35% according to the 2013 American Community Survey. As homes age, they are more likely to be rented. Thus, the primary source of single-family rental homes is not construction but the existing housing stock. Robert Dietz, Chief Economist and Senior Vice President for Economics and Housing Policy, NAHB Sources: 11/28/16 Return Return to TOC TOC
20 New Housing Permits Total Permits* SF Permits * All permit data are presented at a seasonally adjusted annual rate (SAAR). MF 2-4 unit Permits MF 5 unit Permits October 1,229, ,000 28, ,000 September 1,225, ,000 36, , ,175, ,000 35, ,000 M/M change Y/Y change Source: 11/17/16
21 Total New Housing Permits 2,200 2,000 SAAR; in thousands 1,800 1,600 Total October Permits: 1,229 mm units 1,400 1,200 1, SF Permits 2-4 MF Permits 5 MF Permits Source: 11/17/16
22 New Housing Permits by Region NE Total NE SF NE MF October 105,000 57,000 48,000 September 133,000 53,000 80, ,000 54,000 76,000 M/M change Y/Y change MW Total MW SF MW MF October 204, ,000 90,000 September 182, ,000 66, , ,000 69,000 M/M change Y/Y change * All data are SAAR. Source: 11/17/16
23 New Housing Permits by Region S Total S SF S MF October 576, , ,000 September 590, , , , , ,000 M/M change Y/Y change W Total W SF W MF October 344, , ,000 September 320, , , , , ,000 M/M change Y/Y change * All data are SAAR. Source: 11/17/16
24 Total Housing Permits by Region 1,200 SAAR; in thousands 1, Total NE Permits Total MW Permits Total S Permits Total W Permits Source: 11/17/16
25 SF Housing Permits by Region 900 SAAR; in thousands NE SF Permits MW SF Permits S SF Permits W SF Permits Source: 11/17/16
26 MF Housing Permits by Region 225 SAAR; in thousands NE MF Permits MW MF Permits S MF Permits W MF Permits Source: 11/17/16
27 New Housing Under Construction Total Under Construction* SF Under Construction All housing under construction data are presented at a seasonally adjusted annual rate (SAAR). ** US DOC does not report 2-4 multifamily units under construction directly, this is an estimation ((Total under construction (SF + 5 unit MF)). MF 2-4 unit** Under Construction MF? 5 unit Under Construction October 1,049, ,000 11, ,000 September 1,035, ,000 11, , , ,000 11, ,000 M/M change 1.4% 2.3% 0.0% 0.7% Y/Y change 11.2% 9.2% 0.0% 13.1% Source: 11/17/16
28 Total Housing Under Construction 1,100 1,000 SAAR; in thousands Total October Under Construction: 1,038 mm units SF Under Construction 2-4 MF Under Construction =5 MF Under Construction Source: 11/17/16
29 New Housing Under Construction by Region NE Total NE SF NE MF** October 191,000 51, ,000 September 190,000 49, , ,000 47, ,000 M/M change 0.5% 4.1% -0.7% Y/Y change 11.0% 8.5% 12.0% MW Total MW SF MW MF October 143,000 72,000 71,000 September 141,000 72,000 69, ,000 66,000 57,000 M/M change 1.4% 0.0% 2.9% Y/Y change 16.3% 9.1% 24.6% All data are SAAR; NE = Northeast and MW = Midwest. ** US DOC does not report multifamily units under construction directly, this is an estimation (Total under construction SF under construction). Source: 11/17/16
30 Railroad Lumber & Wood Shipments vs. U.S. SF Housing Permits 10,000 9,000 8,000 LHS: Lumber shipments in thousands RHS: SF Permits ,000 6,000 5, ,000 3, ,000 1,000 - Data are average weekly originations for each month, are not seasonally adjusted, and do not include intermodal. AAR Lumber & Wood Shipments (U.S. + Canada) SF Permits Sources: Association of American Railroads (AAR), Rail Time Indicators report 10/7/16; U.S. DOC-Construction; 11/17/16 Return Return to TOC TOC
31 Railroad Lumber & Wood Shipments vs. U.S. SF Housing Permits: 3-month Offset 10,000 9,000 8,000 7,000 6,000 5,000 4,000 3,000 2,000 1,000 - LHS: Lumber shipments in thousands RHS: SF Permits Data are average weekly originations for each month, are not seasonally adjusted, and do not include intermodal. AAR Lumber & Wood Shipments (U.S. + Canada) SF Permits (3-mo. offset) In this graph, January 2007 lumber shipments are contrasted with March 2007 SF permits, and continuing through October 2016 SF permits. The purpose is to discover if lumber shipments relate to future single-family building permits. Also, it is realized that lumber and wood products are trucked; however, to our knowledge comprehensive trucking data is not available. Sources: Association of American Railroads (AAR), Rail Time Indicators report 10/7/16; U.S. DOC-Construction; 11/17/16 Return Return to TOC TOC
32 New Housing Under Construction by Region S Total S SF S MF** October 449, , ,000 September 443, , , , , ,000 M/M change 1.4% 1.4% 1.3% Y/Y change 9.2% 5.4% 12.9% W Total W SF W MF October 266, , ,000 September 261, , , ,000 89, ,000 M/M change 1.9% 5.0% 0.0% Y/Y change 12.2% 18.0% 8.8% All data are SAAR; S = South and W = West. ** US DOC does not report multifamily units under construction directly, this is an estimation (Total under construction SF under construction). Source: 11/17/16
33 Total Housing Under Construction by Region 700 SAAR; in thousands Jan Feb Mar Apr May Jun Jul Aug Sep Oct Total NE Under Construction Total MW Under Construction Total S Under Construction Total W Under Construction Source: 11/17/16
34 SF Housing Under Construction by Region 450 SAAR; in thousands Jan 2016 Feb Mar Apr May Jun 2016 Jul Aug Sep Oct 2016 NE SF Under Construction MW SF Under Construction S SF Under Construction W SF Under Construction Source: 11/17/16
35 MF Housing Under Construction by Region SAAR; in thousands Jan 2016 Feb Mar Apr May Jun 2016 Jul Aug Sep 2016 Oct 2016 NE MF Under Construction MW MF Under Construction S MF Under Construction W MF Under Construction Source: 11/17/16
36 New Housing Completions Total Completions* SF Completions All completion data are presented at a seasonally adjusted annual rate (SAAR). MF 2-4 unit** Completions ** US DOC does not report multifamily completions directly, this is an estimation ((Total completions (SF + 5 unit MF)). MF 5 unit Completions October 1,055, ,000 6, ,000 September 1,000, ,000 13, , , ,000 9, ,000 M/M change 5.5% 3.9% -53.8% 12.8% Y/Y change 7.2% 17.0% -33.3% -10.4% Source: 11/17/16
37 Total Housing Completions 1,800 SAAR; in thousands 1,600 1,400 1,200 Total October Completions: 1,055 mm units 1, Total SF Completions Total 2-4 MF Completions Total 5 MF Completions Source: 11/17/16
38 New Housing Completions by Region 1,000 SAAR; in thousands Total NE Completions Total MW Completions Total S Completions Total W Completions All data are SAAR; NE = Northeast and MW = Midwest. ** US DOC does not report multifamily completions directly, this is an estimation (Total completions SF completions). Source: 11/17/16
39 Total Housing Completions by Region NE Total NE SF NE MF** October 78,000 49,000 29,000 September 97,000 56,000 41, ,000 48,000 68,000 M/M change -19.6% -12.5% -29.3% Y/Y change -32.8% 2.1% -57.4% MW Total MW SF MW MF October 187, ,000 65,000 September 121, ,000 14, , ,000 54,000 M/M change 54.5% 14.0% 364.3% Y/Y change 21.4% 22.0% 20.4% Source: 11/17/16
40 New Housing Completions by Region S Total S SF S MF** October 536, , ,000 September 525, , , , , ,000 M/M change 2.1% 10.3% -19.2% Y/Y change 10.1% 21.9% -18.1% W Total W SF W MF October 254, ,000 94,000 September 257, ,000 78, , ,000 78,000 M/M change -1.2% -10.6% 20.5% Y/Y change 11.9% 7.4% 20.5% All data are SAAR; S = South and W = West. ** US DOC does not report multi-family completions directly, this is an estimation (Total completions SF completions). Source: 11/17/16
41 SF Housing Completions by Region 900 SAAR; in thousands Jan Feb Mar Apr May Jun Jul Aug Sep Oct NE SF Completions MW SF Completions S SF Completions W SF Completions Source: 11/17/16
42 MF Housing Completions by Region 180 SAAR; in thousands NE MF Completions MW MF Completions S MF Completions W MF Completions Source: 11/17/16
43 New Single-Family House Sales New SF Sales* Median Price Mean Price Month's Supply October 563,000 $295,000 $355, September 574,000 $314,100 $364, ,000 $304,500 $354, M/M change -1.9% 6.5% 2.6% -2.0% Y/Y change 17.8% 2.1% -1.0% -13.8% * All sales data are presented at a seasonally adjusted annual rate (SAAR). Source: 11/23/16
44 New SF House Sales 1,400 SAAR; in thousands 1,200 1, average: 652,679 units average: 633,895 units October 2016: 563, Jan 2016 Total SF Sales Feb Mar Apr May Jun 2016 Jul Aug Sep 2016 Oct 2016 Source: 11/23/16
45 New SF House Sales 800 LHS: Nominal & Expansion Factors Nominal & SF data, in thousands RHS: New SF SAAR New SF sales (adj) Apparent Expansion Factor New SF sales (non-adj) Nominal and Adjusted New SF Monthly Sales Presented above is nominal (non-adjusted) new SF sales data contrasted against SAAR data. The apparent expansion factor is the ratio of the unadjusted number of houses sold in the US to the seasonally adjusted number of houses sold in the US (i.e., to the sum of the seasonally adjusted values for the four regions). U.S. DOC-Construction Source: 11/23/16
46 New SF House Sales Ratio of New SF Sales/Civilian Noninstitutional Population 1/1/63 to 3/31/08 ratio: /23/2016 ratio: New SF sales adjusted for the US population From January 1963 to December 2007, the long-term ratio of new house sales to the US population was in October 2016 it was a minimal decrease from September. From a population viewpoint, construction is less than what is necessary for changes in population (i.e., under-building). Sources: and The Federal Reserve Bank of St. Louis; 11/23/16
47 New SF House Sales by Region and Price Category All data are SAAR. 1 Houses for which sales price were not reported have been distributed proportionally to those for which sales price was reported; 2 Detail June not add to total because of rounding. NE SF Sales MW SF Sales S SF Sales W SF Sales October 30,000 63, , ,000 September 33,000 73, , , ,000 58, , ,000 M/M change -9.1% -13.7% -3.0% 8.8% Y/Y change -6.3% 8.6% 17.9% 28.7% $150m $150 - $199.9m $ m $300 - $399.9m $400 - $499.9m $500 - $749.9m $750m October 1,2 2,000 8,000 12,000 12,000 5,000 4,000 2,000 September 1,000 5,000 13,000 12,000 6,000 5,000 2, ,000 4,000 13,000 8,000 5,000 5,000 2,000 M/M change 100.0% 60.0% -7.7% 0.0% -16.7% -20.0% 0.0% Y/Y change 0.0% 100.0% -7.7% 50.0% 0.0% -20.0% 0.0% Source: 11/23/16
48 SAAR; in thousands New SF House Sales by Region NE SF Sales MW SF Sales S SF Sales W SF Sales Source: 11/23/16
49 New SF House Sales by Price Category ; in thousands, and thousands of dollars; SAAR Total New SF Sales*: 501 mm units < $150 $150-$199.9 $ $300-$399.9 $400-$499.9 $500-$749.9 > $750 * Sales tallied by price category. Source: 8/23/16
50 New SF House Sales by Price Category 18 in thousands and thousands of dollars; SAAR Jan 2016 Feb 2016 Mar 2016 Apr 2016 May 2016 Jun 2016 Jul 2016 Aug 2016 Sep 2016 Oct < $150 $150-$199.9 $ $300-$399.9 $400-$499.9 $500-$749.9 > $750 Source: 11/23/16


51 New SF House Sales October SF Sales $500-$749.9m, 4,000, 9% $750m, 2,000, 4% $150m, 2,000, 4% $150-$199.9m, 8,000, 18% $400-$499.9m, 5,000, 11% $ m, 12,000, 27% $300-$399.9m, 12,000, 27% $150m $150-$199.9m $ m $300-$399.9m $400-$499.9m $500-$749.9m $750m Source: 11/23/16
52 New SF House Sales 100.0% 90.0% 80.0% 92.4% 75.6% 70.0% 60.0% 50.0% 40.0% 30.0% 20.0% 10.0% 7.6% 24.4% 0.0% % of Sales: < $400m % of Sales: > $400 New SF Sales: 2002 October 2016 The sales share of $400 thousand plus SF houses is presented above. Since the beginning of 2012, the upper priced houses have and are garnering a greater percentage of sales. Several reasons are offered by industry analysts; 1) builders can realize a profit on higher priced houses; 2) historically low interest rates have indirectly resulted in increasing house prices; and 3) purchasers of upper end houses fared better financially coming out of the Great Recession. Source: 11/23/16
53 Railroad Lumber & Wood Shipments vs. U.S. New SF House Sales 10,000 LHS: Lumber shipments in thousands RHS: SF Sales 900 9, , , , ,000 4, , ,000 1,000 Data are average weekly originations for each month, are not seasonally adjusted, and do not include intermodal. AAR Lumber & Wood Shipments (U.S. + Canada) New SF Sales Sources: Association of American Railroads (AAR), Rail Time Indicators report 10/7/16; U.S. DOC-Construction; 11/23/16 Return Return to TOC TOC
54 Railroad Lumber & Wood Shipments vs. U.S. New SF House Sales: 1-year offset 10,000 LHS: Lumber shipments in thousands RHS: SF Sales 900 9, , , , ,000 4, , , ,000 - Data are average weekly originations for each month, are not seasonally adjusted, and do not include intermodal. AAR Lumber & Wood Shipments (U.S. + Canada) New SF Sales (1-yr. offset) In this graph, initially January 2007 lumber shipments are contrasted with January 2008 new SF sales through October 2016 new SF sales. The purpose is to discover if lumber shipments relate to future new SF house sales. Also, it is realized that lumber and wood products are trucked; however, to our knowledge comprehensive trucking data is not available. Sources: Association of American Railroads (AAR), Rail Time Indicators report 10/7/16; U.S. DOC-Construction; 11/23/16 Return Return to TOC TOC
55 October 2016 Construction Spending 2016 October Total Private Residential Construction: $466.2 billion (SAAR) 1.6% more than the revised September estimate of $458.8 billion (SAAR) 4.7% greater than the October 2015 estimate of $445.4 billion (SAAR) October SF construction: $243.5 billion (SAAR) 2.8% more than September: $236.8 billion (SAAR) -1.6% less than October 2015: $243.5 billion (SAAR) October MF construction: $63.7 billion (SAAR) 2.8% more than September: $61.9 billion (SAAR) 11.4% greater than October 2015: $57.2 billion (SAAR) October Improvement C construction: $159.1 billion (SAAR) -0.6% less than September: $159.9 billion (SAAR) 13.0% more than October 2015: $140.7 billion (SAAR) C The US DOC does not report improvement spending directly, this is a monthly estimation for 2016: ((Total Private Spending (SF spending + MF spending)). All data are SAARs and reported in nominal US$. Source: 11/30/16
56 Total Construction Spending (nominal): 1993 October 2016 $500,000 $450,000 $400,000 SAAR; in millions of US dollars Total Private Nominal Construction Spending: $466,238 bil $350,000 $300,000 $250,000 $200,000 $150,000 $100,000 $50, , ,059 63,696 $0 SF Spending (nominal) MF Spending (nominal) Remodeling Spending (nominal) Reported in nominal US$. The US DOC does not report improvement spending directly, this is a monthly estimation for Source: 11/30/16
57 Total Construction Spending (adjusted): * $800,000 $700,000 $600,000 Total Private Adjusted Construction Spending SAAR; in millions of US dollars $500,000 $400,000 $300,000 $200, , ,059 $100,000 $0 63,696 Total Residential Spending (adj.) SF Spending (adj.) MF Spending (adj.) Remodeling Spending (adj.) Reported in adjusted US$: (adjusted for inflation, BEA Table 1.1.9); *January-October 2016 reported in nominal US$. Source: 10/1/16
58 Construction Spending Shares: 1993 to October SF, MF, & RR: Percent of Total Residential Spending SF % MF % RR % Total Residential Spending: 1993 through 2006 SF spending average: 69.2 % MF spending average: 7.5 %; Residential remodeling (RR) spending average: 23.3 % (SAAR). Note: 1993 to 2015 (adjusted for inflation, BEA Table 1.1.9); January-October 2016 reported in nominal US$. Source: and 12/30/16
59 Construction Spending & Starts: 2010 to October 2016 $260,000 LHS: New SF spending, SAAR; in millions of U.S. dollars RHS: New SF starts, SAAR; in thousands 1000 $250, $240, $230,000 $243, $220, $210, $200, $190,000 Jan 2015 Feb 2015 Mar 2015 Apr 2015 May 2015 Jun 2015 Jul 2015 Aug 2015 Sep 2015 Oct 2015 Nov 2015 Dec 2015 Jan 2016 Feb 2016 Mar 2016 Apr 2016 May 2016 Jun 2016 Jul 2016 Aug 2016 Sep 2016 Oct New SF Spending New SF Starts New SF Residential contrasted against New SF Starts: 2010 through 2016 In the above graph, new SF construction spending is compared to new SF starts. Generally, as SF starts increase so does spending. However, there are other factors involved: house size, amenities, lot price, location, etc. Note that 2016 spending is reported in nominal dollars. Source: and : 11/17/16-11/30/16
60 Construction Spending & Starts: 2016 $260,000 LHS: New SF spending, SAAR; in millions of U.S. dollars RHS: New SF starts, SAAR; in thousands 1, $255, $250, $245,000 $243, $240, $235, $230,000 Jan 2016 Feb 2016 Mar 2016 Apr 2016 May 2016 Jun 2016 Jul 2016 Aug 2016 Sep 2016 Oct New SF Spending New SF Starts New SF Residential contrasted against New SF Starts: 2016 As presented above, the decline in spending decoupled from starts in October. Given that it is one-month of data, we should pay attention to this relationship going forward. Note that 2016 spending is reported in nominal dollars. Source: and : 11/17/16-11/30/16
61 Remodeling 123 Million Home Improvement Projects American homeowners tackled 123 million home improvement projects in the past two years, according to the 2015 American Housing Survey. The 62 percent majority of projects were done by professionals (median expense $2,000) and 38 percent were do-it-yourselfers (median expense $600). These are the 10 most common projects and their median expense.... Cheryl Russell, Editorial Director, New Strategist Press Number of professional home improvement projects (and median expense) 3. Flooring/carpeting: 7.2 million ($2,246) 5. Windows/doors: 5.6 million ($2,000) 7. Bath remodel: 3.4 million ($5,000) Number of do-it-yourself home improvement projects (and median expense) 2. Flooring/carpeting: 4.8 million ($800) 5. Bath remodel: 3.1 million ($1,500) 6. Windows/doors: 3.1 million ($600) 7. Kitchen remodel: 2.1 million ($3,000) 8. Fencing/walls: 2.1 million($600) Source: 11/18/16
62 Existing House Sales National Association of Realtors (NAR ) October 2016 sales: million houses sold (SAAR) Distressed house sales: 5% of total sales (4% foreclosures and 1% short-sales); 4% in August and 6% in October All-cash sales: 22% and 21% in September, and 24% (October 2015). Individual investors still purchase a considerable portion of all cash sale houses 13% in October; 14% in August and 13% in October % of investors paid cash in October. Source: NAR 11/22/16
63 * All sales data: SAAR Existing House Sales Existing Sales* Median Price Mean Price Month's Supply October 5,600,000 $232,200 $274, September 5,490,000 $235,300 $277, ,290,000 $219,100 $262, M/M change 2.0% -1.3% -1.0% -2.3% Y/Y change 5.9% 6.1% 4.4% -10.4% NE Sales MW Sales S Sales W Sales September 750,000 1,360,000 2,220,000 1,270,000 August 740,000 1,330,000 2,160,000 1,260, ,000 1,280,000 2,120,000 1,150,000 M/M change 1.4% 2.3% 2.8% 0.8% Y/Y change 1.4% 6.3% 4.7% 10.4% Source: NAR 11/22/16
64 Total Existing House Sales SAAR; in thousands U.S. NE MW S W Source: NAR 11/22/16

65 Total Existing House Sales Source: 11/22/16
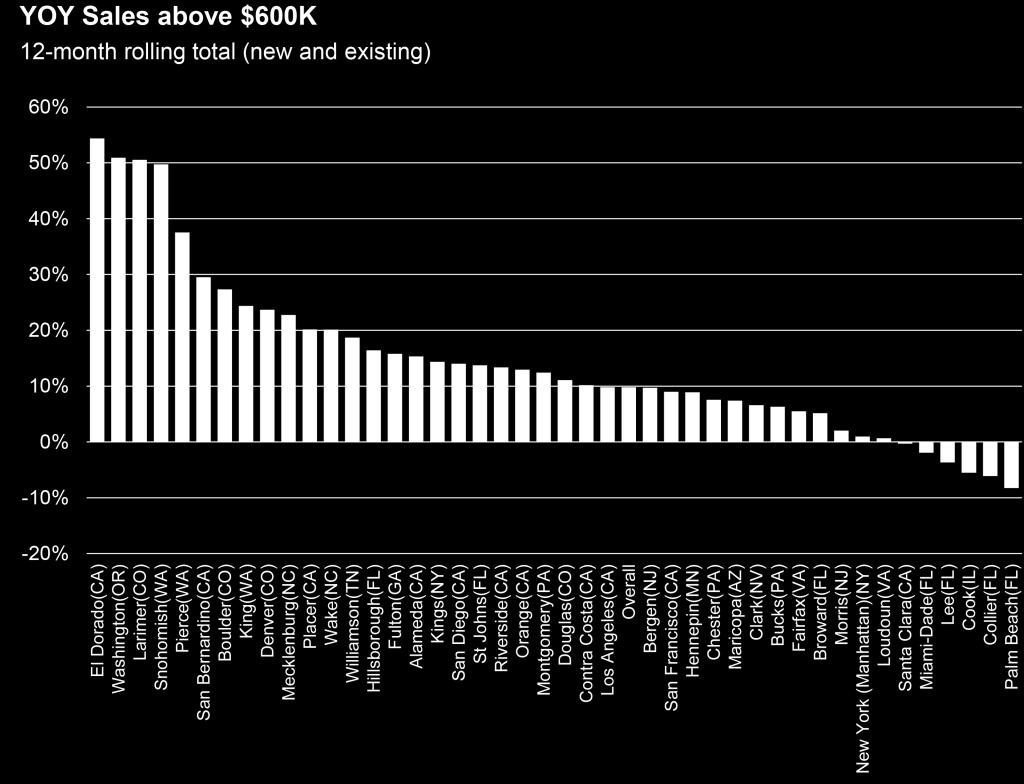
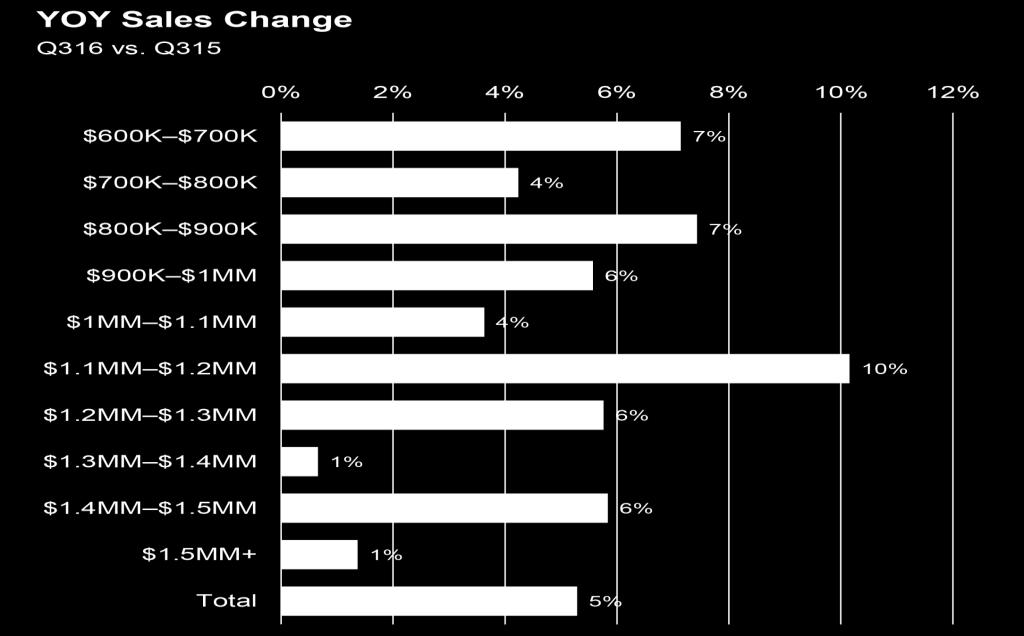
66 House Sales Wall Street Has It Wrong: Luxury Home Sales Increasing Luxury home sales have increased, contrary to the opinions of most Wall Street analysts and press reports. Here are the facts: Sales of homes priced above $600,000 have risen in 37 of the 43 counties where we purchased the data. Home sales above $600,000 in the last 12 months exceed sales in the prior 12 months by 10%. Home sales in Q exceeded sales in Q by 5%. Sales have increased in every price increment from $600,000 to $1.5 million+. See the charts below and then our explanation of why Wall Street has it wrong. John Burns, CEO, John Burns Real Estate Consulting LLC Source: 12/5/16

67 House Sales Source: 12/5/16
68 House Sales Why Is the Common Perception Wrong? A confluence of five high-profile events has conspired to give the wrong perception: 1. New disclosure laws. Foreign-buyer activity has slowed in two high-profile markets, Manhattan and Miami, due to threat of enforcement of new disclosure laws that began in High-profile Florida second-home markets. High-priced homes have indeed slowed in two of the highest-profile second home markets in the country, Naples (Collier County) and Palm Beach. These are two of the six counties where sales have declined. 3. Fortune article on Greenwich, CT. The sales slowdown in high-profile Greenwich, CT, was featured in Fortune magazine. The article included some very misleading headlines about a national luxury slowdown that were supported only by the fact that prices have appreciated 5% at the high end compared to more appreciation at lower prices. 4. Increased $1 million new-home supply. New-home sales have slowed in a few new-home markets due to a surge in competitive supply. Coupling this surge in supply, builders have pushed prices too high in comparison to the resale competition due to rising costs. 5. Improving entry-level sales. Entry-level sales are also improving at a faster rate than higherpriced home sales. Indeed, the market for lower-priced homes is stronger, but that does not mean that luxury sales are struggling. Summary In conclusion, luxury home sales continue to increase. Entry-level home sales continue to increase even faster. John Burns, CEO, John Burns Real Estate Consulting LLC Source: 12/5/16

69 Current Housing Market Source: 11/16/16

70 Current Housing Market Source: 11/16/16
71 2017 Outlook The Outlook for 2017 In 2017, we expect to see some additional interest rate increases following the recent movements. Much like in 2013, we expect housing markets to respond negatively to higher rates. Higher mortgage rates will drive down homebuyer affordability, dampening demand and weakening home sales, softening house price growth, and slowing the growth in new home construction. Mortgage market activity will be significantly reduced by higher rates. Exhibit 2 below summarizes our forecast for 2016 and 2017: Freddie Mac Economic & Housing Research, Economic & Housing Research Group Source: 11/30/16
72 2017 Outlook The Outlook for 2017 Housing market activity cools off Rising interest rates will exacerbate growing affordability challenges in many markets. Even prior to the recent interest rate movements, we've seen housing market activity start to level off, with single-family housing starts flat lining for most of 2016 and existing home sales starting to lose some momentum. Regardless, 2016 will still end up being the best year for home sales in a decade, but 2017 will be hard pressed to match those levels. With limited new supply coming online, new home sales will only increase slightly, and existing home sales are likely to decline next year as affordability becomes a challenge. We expect total housing starts will reach 1.16 million in For 2017, higher mortgage rates will slow the pace to about 1.26 million starts, still far short of long-run demand of 1.6 to 1.7 million units. Total home sales will decline about 220,000 units from 2016 to New homes sales will rise, but not enough to offset declines in existing home sales. Home price momentum keeps price growth in 2017 Home prices have been rising at about a 6 percent annual pace for the past two years. Higher mortgage rates will contribute to moderation in house price growth. We expect to see house price appreciation rise at about a 4.7 percent annual rate in Freddie Mac Economic & Housing Research, Economic & Housing Research Group Source: 11/30/16
73 2017 Outlook The Outlook for 2017 Housing market activity cools off Rising interest rates will exacerbate growing affordability challenges in many markets. Even prior to the recent interest rate movements, we've seen housing market activity start to level off, with single-family housing starts flat lining for most of 2016 and existing home sales starting to lose some momentum. Regardless, 2016 will still end up being the best year for home sales in a decade, but 2017 will be hard pressed to match those levels. With limited new supply coming online, new home sales will only increase slightly, and existing home sales are likely to decline next year as affordability becomes a challenge. We expect total housing starts will reach 1.16 million in For 2017, higher mortgage rates will slow the pace to about 1.26 million starts, still far short of long-run demand of 1.6 to 1.7 million units. Total home sales will decline about 220,000 units from 2016 to New homes sales will rise, but not enough to offset declines in existing home sales. Home price momentum keeps price growth in 2017 Home prices have been rising at about a 6 percent annual pace for the past two years. Higher mortgage rates will contribute to moderation in house price growth. We expect to see house price appreciation rise at about a 4.7 percent annual rate in Freddie Mac Economic & Housing Research, Economic & Housing Research Group Source: 11/30/16

74 2017 Outlook The Outlook for 2017 Mortgage originations get crushed While housing market activity will be able to weather slightly higher rates without a major correction, mortgage activity will be dramatically impacted by higher rates, particularly refinance originations. From 2013 to 2014, single-family refinance mortgage originations declined 54 percent following the Taper Talk rate increases. This time around, we anticipate refinance originations will decline by 53 percent from 2016 to Total mortgage originations will equal $1.5 trillion in 2017, down from $1.7 trillion in our October forecast. Freddie Mac Economic & Housing Research, Economic & Housing Research Group Source: 11/30/16

75 First-Time Purchasers National Association of Realtors (NAR ) 33% of sales in October % in September 2016 and 31% in October American Enterprise Institute International Center on Housing Risk Contrary to news reports, the first-time buyer is alive and well in today s home purchase market. Over the past year, first-time buyer share eased slightly, accounting for 56.2 percent of primary owner-occupied home purchase mortgages with a government guarantee, down from 56.7 percent in August This is due to even faster volume growth from repeat buyers. The First-Time Buyer Mortgage Risk Index (FBMRI) for Agency purchase loans stood at 15.6% in August, unchanged from a year earlier. The Agency FBMRI is 6.4 ppts. higher than the repeat buyer MRI, up 6.0 ppts. from a year earlier. Setting a series high, FHA s First-Time Buyer NMRI stood at 24.8% in July, up 1.0 ppt. from a year earlier. Edward Pinto, Codirector, Tobias Peter, Scholar, American Enterprise Institute International Center on Housing Risk Sources: 11/22/16; 11/29/16
76 First-Time Purchasers Urban Institute In August 2016, the first-time homebuyer share of GSE purchase loans continued to decline to 42.7 percent. The FHA has always been more focused on first-time homebuyers, with its first-time homebuyer share hovering around 80 percent and now stood at 82.0 percent in August 2016, down from the peak of 83.3 percent in May The bottom table shows that based on mortgages originated in August 2016, the average first-time homebuyer was more likely than an average repeat buyer to take out a smaller loan and have a lower credit score and higher LTV and DTI, thus requiring a higher interest rate. Laurie Goodman et al., Codirector, Housing Finance Policy Center Inside Mortgage Finance: Campbell/Inside Mortgage Finance HousingPulse Tracking Survey First-time homebuyers had a 34.8 percent share of purchases in October, based on a three-month moving average. That was the lowest share for first-timers since August Moreover, the firsttime homebuyer share has declined for four consecutive months. Back in May, the reading was 40.4 percent. Brandon Ivey, Editor, Inside Mortgage Finance Sources: 11/21/16; 10/24/16
77 United States House Sales As expected, appraisal volume plummets after Thanksgiving holiday Housing market moves into the holidays Appraisal volume, to no surprise, tumbled in the latest report due to the Thanksgiving holiday. For the week of Nov. 20, appraisal volume plummeted 30.3%, according to the latest National Appraisal Volume Index from a la mode, which is provided exclusively to HousingWire. However, to put this in perspective, a la mode noted that appraisal volume averages a 30.6% drop for the week, so this year is right in line with expectations. The significant decline comes after last week s positive report when appraisal volume finally posted an increase after weeks of decline. The holiday did skew the 4-week average down to -8.3%, which will take a month to drop off. Brena Swanson, Digital Reporter, HousingWire.com Source: 11/28/16
78 Mortgage Credit Availability Higher Index = More Credit Available Lower Index = Less Credit Available Mortgage Credit Availability Increases in November The MCAI increased 1.6 percent to in November. A decline in the MCAI indicates that lending standards are tightening, while increases in the index are indicative of loosening credit. The index was benchmarked to 100 in March Of the four component indices, the Conforming MCAI saw the greatest increase in availability over the month (up 2.2 percent), followed by the Government MCAI (up 1.8 percent), the Conventional MCAI (up 1.5 percent), and the Jumbo MCAI (up 0.8 percent). Mortgage credit availability increased for the third consecutive month in November, driven by increased availability of conventional low down payment and streamlined refinance loan programs. Lynn Fisher, Vice President of Research and Economics, Mortgage Bankers Association (MBA) Source: 12/5/16

 as compared to the production nonsupervisory sector (bottom).")
79 Housing Affordability Average Hourly Earnings & Purchase Only House Price Index For the every day American, housing affordability is problematic. As presented above, affordability is much better for the professional business sector (top) as compared to the production nonsupervisory sector (bottom). Source: 11/28/16
The Virginia Tech U.S. Forest Service August 2017 Housing Commentary: Section I
 The Virginia Tech U.S. Forest Service August 2017 Housing Commentary: Section I Urs Buehlmann Department of Sustainable Biomaterials College of Natural Resources & Environment Virginia Tech Blacksburg,
The Virginia Tech U.S. Forest Service December 2017 Housing Commentary: Section I
 The Virginia Tech U.S. Forest Service December 2017 Housing Commentary: Section I Urs Buehlmann Department of Sustainable Biomaterials College of Natural Resources & Environment Virginia Tech Blacksburg,
The Virginia Tech U.S. Forest Service June 2016 Housing Commentary: Section I
 The Virginia Tech U.S. Forest Service June Housing Commentary: Section I Urs Buehlmann Department of Sustainable Biomaterials College of Natural Resources & Environment Virginia Tech Blacksburg, VA 540.231.9759
The Virginia Tech U.S. Forest Service June 2017 Housing Commentary: Section I
 The Virginia Tech U.S. Forest Service June 2017 Housing Commentary: Section I Urs Buehlmann Department of Sustainable Biomaterials College of Natural Resources & Environment Virginia Tech Blacksburg, VA
The Virginia Tech U.S. Forest Service January 2017 Housing Commentary: Section I
 The Virginia Tech U.S. Forest Service January 2017 Housing Commentary: Section I Urs Buehlmann Department of Sustainable Biomaterials College of Natural Resources & Environment Virginia Tech Blacksburg,
The Virginia Tech U.S. Forest Service August 2016 Housing Commentary: Section I
 The Virginia Tech U.S. Forest Service August Housing Commentary: Section I Urs Buehlmann Department of Sustainable Biomaterials College of Natural Resources & Environment Virginia Tech Blacksburg, VA 540.231.9759
The Virginia Tech U.S. Forest Service January 2016 Housing Commentary: Section I
 The Virginia Tech U.S. Forest Service January 2016 Housing Commentary: Section I Urs Buehlmann Department of Sustainable Biomaterials College of Natural Resources & Environment Virginia Tech Blacksburg,
The Virginia Tech U.S. Forest Service January 2016 Housing Commentary: Section I
 The Virginia Tech U.S. Forest Service January 2016 Housing Commentary: Section I Urs Buehlmann Department of Sustainable Biomaterials College of Natural Resources & Environment Virginia Tech Blacksburg,
The Virginia Tech U.S. Forest Service April 2016 Housing Commentary: Section I
 The Virginia Tech U.S. Forest Service April Housing Commentary: Section I Urs Buehlmann Department of Sustainable Biomaterials College of Natural Resources & Environment Virginia Tech Blacksburg, VA 54.231.9759
The Virginia Tech U.S. Forest Service February 2016 Housing Commentary: Section I
 The Virginia Tech U.S. Forest Service February 2016 Housing Commentary: Section I Urs Buehlmann Department of Sustainable Biomaterials College of Natural Resources & Environment Virginia Tech Blacksburg,
Analysis of Current and Forecasted Demand for Housing in North America
 Analysis of Current and Forecasted Demand for Housing in North America TIMBER MEASUREMENT SOCIETY Central Meeting April 9, 2015 Coeur d Alene, Idaho Delton Alderman Forest Products Marketing Unit Forest
United States Housing, 2012
 United States Department of Agriculture United States Housing, 2012 Delton Alderman ABSTRACT Provides current and historical information on housing market in the United States. Information includes trends
Economic Highlights. Payroll Employment Growth by State 1. Durable Goods 2. The Conference Board Consumer Confidence Index 3
 August 26, 2009 Economic Highlights Southeastern Employment Payroll Employment Growth by State 1 Manufacturing Durable Goods 2 Consumer Spending The Conference Board Consumer Confidence Index 3 Real Estate
United States Housing Market and Hardwoods
 United States Housing Market and Hardwoods The Future of the Hardwood Lumber Industry Wood Education Resource Center Princeton, WV November 3, 2016 Delton Alderman Forest Products Marketing Unit Forest
THE OUTLOOK FOR HOUSING IN ILLINOIS
 THE OUTLOOK FOR HOUSING IN ILLINOIS Jonathan Smoke Chief Economist January 25, 2017 NATIONAL TRENDS 2 2000.01 2000.05 2000.09 2001.01 2001.05 2001.09 2002.01 2002.05 2002.09 2003.01 2003.05 2003.09 2004.01
Nothing Draws a Crowd Like a Crowd: The Outlook for Home Sales
 APRIL 2018 Nothing Draws a Crowd Like a Crowd: The Outlook for Home Sales The U.S. economy posted strong growth with fourth quarter 2017 Real Gross Domestic Product (real GDP) growth revised upwards to
With last month's gain, sales are now up 4.5% from May 2015 and are at their highest annual pace since February 2007.
 JULY 2016 With last month's gain, sales are now up 4.5% from May 2015 and are at their highest annual pace since February 2007. - Lawrence Yun NAR s Chief Economist Now in its seventh year, the US economic
This Month in Real Estate
 Keller Williams Research This Month in Real Estate Released: September 14, 2009 Commentary. The Numbers That Drive Real Estate Recent Government Action. Research for Buyers and Sellers. 2 4 10 14 1 Green
MARKET OUTLOOK FOR SAN MATEO
 MARKET OUTLOOK FOR SAN MATEO Jonathan Smoke Chief Economist August 2, 2016 NATIONAL TRENDS 2 JOB CREATION REBOUNDED IN JUNE 229,000 jobs created by month in 2015; 172,000 average this year Employment and
Released: May 7, 2010
 Released: May 7, 2010 Commentary 2 The Numbers That Drive Real Estate 3 Recent Government Action 9 Topics for Home Buyers, Sellers, and Owners 11 Brought to you by: KW Research Commentary The economic
Released: June 7, 2010
 Released: June 7, 2010 Commentary 2 The Numbers That Drive Real Estate 3 Recent Government Action 9 Topics for Home Buyers, Sellers, and Owners 11 Brought to you by: KW Research Commentary The housing
Economic Spotlight September 1, 2009
 Economic Spotlight September 1, 29 Update on Alberta s Housing Market Summary Alberta s housing market is beginning to show signs of recovery. Housing starts have rebounded from March lows and activity
Housing Price Forecasts. Illinois and Chicago PMSA, January 2018
 Housing Price Forecasts Illinois and Chicago PMSA, January 2018 Presented To Illinois Realtors From R E A L Regional Economics Applications Laboratory, Institute of Government and Public Affairs University
Released: June Commentary 2. The Numbers That Drive Real Estate 3. Recent Government Action 9. Topics for Home Buyers, Sellers, and Owners 11
 Released: June 2011 Commentary 2 The Numbers That Drive Real Estate 3 Recent Government Action 9 Topics for Home Buyers, Sellers, and Owners 11 Brought to you by: KW Research Commentary The U.S. housing
2019 Housing Market Forecast. Palos Verdes Peninsula AOR January 8, 2019 Jordan G. Levine Senior Economist
 2019 Housing Market Forecast Palos Verdes Peninsula AOR January 8, 2019 Jordan G. Levine Senior Economist Overview Good News: Economic fundamentals solid Homeownership still the dream Rates might not go
1200 Premier Drive, Suite 140 Chattanooga, TN Each office is independently owned and operated.
 THIS MONTH IN REAL ESTATE K im aulston R REALTOR 1200 Premier Drive, Suite 140 Chattanooga, TN 37421 Each office is independently owned and operated. Cell: 423-316-4022 Office: 423-664-1600 Email: kcraulston@gmail.com
MARKET STRATEGY VIEWPOINT U.S. Housing Decelerating
 Jan-01 Oct-01 Jul-02 Apr-03 Jan-0 Oct-0 Jul-05 Apr-0 Jan-07 Oct-07 Jul-08 Apr-09 Jan-10 Oct-10 Jul-11 Apr-12 Jan-13 Oct-13 Jul-1 Apr-15 Jan-1 Oct-1 Jul-17 Apr-18 U.S. Housing Decelerating August 27, 2018
The state of the nation s Housing 2011
 The state of the nation s Housing 2011 Fact Sheet PURPOSE The State of the Nation s Housing report has been released annually by Harvard University s Joint Center for Housing Studies since 1988. Now in
Housing Price Forecasts. Illinois and Chicago PMSA, December 2015
 Housing Price Forecasts Illinois and Chicago PMSA, December 2015 Presented To Illinois Association of Realtors From R E A L Regional Economics Applications Laboratory, Institute of Government and Public
State of the Nation s Housing 2008: A Preview
 State of the Nation s Housing 28: A Preview Eric S. Belsky Remodeling Futures Conference April 15, 28 www.jchs.harvard.edu The Housing Market Has Suffered Steep Declines Percent Change Median Existing
Housing Bulletin Monthly Report
 October 21 1 Housing Bulletin Monthly Report Housing Starts show Slight improvement in September CANADA Housing Starts 2, 15, 1, 5, Sep 8 Oct 8 Nov 8 Dec 8 Preliminary Housing Starts in Alberta and Canada
Remodeling Trends and Outlook
 Remodeling Trends and Outlook Kermit Baker Remodeling Futures Conference October 16, 2007 www.jchs.harvard.edu Recent Remodeling Trends Growth in remodeling spending began to ease in Q3-2006. After Strong
Housing Price Forecasts. Illinois and Chicago PMSA, May 2018
 Housing Price Forecasts Illinois and Chicago PMSA, May 2018 Presented To Illinois Realtors From R E A L Regional Economics Applications Laboratory, Institute of Government and Public Affairs University
Economic Highlights. Retail Sales Components 1. University of Michigan Consumer Sentiment Index 2. Industrial Production and Capacity Utilization 3
 November 17, 2010 Economic Highlights Consumer Spending Retail Sales Components 1 University of Michigan Consumer Sentiment Index 2 Manufacturing Industrial Production and Capacity Utilization 3 Real Estate
Rapid recovery from the Great Recession, buoyed
 Game of Homes The Supply-Demand Struggle Laila Assanie, Sarah Greer, and Luis B. Torres October 4, 2016 Publication 2143 Rapid recovery from the Great Recession, buoyed by the shale oil boom, has fueled
November 2018 Housing Commentary
 November 2018 Housing Commentary Urs Buehlmann Department of Sustainable Biomaterials Virginia Tech Blacksburg, VA 540.231.9759 buehlmann@gmail.com and Al Schuler Economist (retired) Princeton, WV Table
Housing Market Cycles
 MEGA AGENT Market Update Gary Keller and Jay Papasan 2 The U.S. Housing Market Keller Williams Realty, Inc. Housing Market Cycles 4 The U.S. Housing Market Housing Market Cycles 5 The U.S. Housing Market
This Month in Real Estate
 Keller Williams Research This Month in Real Estate Released: June 11, 2009 Commentary. The Numbers That Drive Real Estate Recent Government Action. Research for Buyers and Sellers. 2 4 10 13 1 Green Shoots
Housing Price Forecasts. Illinois and Chicago PMSA, October 2014
 Housing Price Forecasts Illinois and Chicago PMSA, October 2014 Presented To Illinois Association of Realtors From R E A L Regional Economics Applications Laboratory, Institute of Government and Public
AAug ugust 2017
 August 17 17 Housing recovery a balancing act Growth in new listings outpaced sales preventing inventory declines City of Calgary, September 1, 17 Sales posted a modest gain in August, but a rise in new
Housing Price Forecasts. Illinois and Chicago PMSA, August 2017
 Housing Price Forecasts Illinois and Chicago PMSA, August 2017 Presented To Illinois Realtors From R E A L Regional Economics Applications Laboratory, Institute of Government and Public Affairs University
Oversupply persists despite improved sales activity for affordable product Mar. 2019
 March 19 MONTHLY STATISTICS PACKAGE Oversupply persists despite improved sales activity for affordable product 19, April 1, 19 March saw a modest decline in city wide sales activity compared to last year.
Patience required in Calgary's housing market recovery Jul. 2018
 July 18 MONTHLY STATISTICS PACKAGE City of Calgary Patience required in Calgary's housing market recovery 18 City of Calgary, August 1, 18 Recent struggles in the job market, accompanied by yet another
Released: February 8, 2011
 Released: February 8, 2011 Commentary 2 The Numbers That Drive Real Estate 3 Recent Government Action 10 Topics for Home Buyers, Sellers, and Owners 13 Brought to you by: KW Research Commentary Gradual
Metropolitan Indianapolis Board of REALTORS. Broker/Owner Meeting March 14, 2007
 Metropolitan Indianapolis Board of REALTORS Broker/Owner Meeting March 14, 2007 Tom Renkert Information Services Director MIBOR PropertyLinx 2 Implementation Time Line February 1-28 March 1 June 30 July
San Francisco Bay Area to Santa Clara & San Benito Counties Housing and Economic Outlook
 San Francisco Bay Area to 019 Santa Clara & San Benito Counties Housing and Economic Outlook Bay Area Economic Forecast Summary Presented by Pacific Union International, Inc. and John Burns Real Estate
CALIFORNIA ECONOMIC & MARKET OUTLOOK. October 29,2014 Contra Costa Association of REALTORS Leslie Appleton Young, Chief Economist
 2014 2015 CALIFORNIA ECONOMIC & MARKET OUTLOOK October 29,2014 Contra Costa Association of REALTORS Leslie Appleton Young, Chief Economist OVERVIEW Economic Outlook California Housing Market Outlook Housing
Housing Bulletin Monthly Report
 February 21 1 Housing Bulletin Monthly Report Housing Starts 25, 2, 15, 1, 5, Alberta Housing Starts up 5 per cent from 29 From February 29 to 21, preliminary housing starts increased 82.7 per cent across
Weak sales persist in Calgary and beyond Jun. 2018
 June 218 MONTHLY STATISTICS PACKAGE City of Calgary Weak sales persist in Calgary and beyond 218 City of Calgary, July 3, 218 Many Canadian energyrelated municipalities within Alberta and Saskatchewan
CALGARY REGIONAL HOUSING MARKET STATISTICS 12.14
 CALGARY REGIONAL HOUSING MARKET STATISTICS 12.14 Yearly records set as monthly sales see slight decline Condominium and townhouse sales set a new record for 214 Calgary, January 2, 215 It was a record
The State of the Nation s Housing
 The State of the Nation s Housing Eric S. Belsky Remodeling Futures Conference April 13, 21 www.jchs.harvard.edu Existing Home Sales Improved then Retracted, While New Home Sales Are Still in the Basement
COMMERCIAL PROPERTY PRICES REMAIN IN SLOWDOWN PATTERN AS MARKET REACTS TO INVESTOR PULLBACK
 CCRSI RELEASE MARCH 2016 (With data through February 2016) COMMERCIAL PROPERTY PRICES REMAIN IN SLOWDOWN PATTERN AS MARKET REACTS TO INVESTOR PULLBACK DESPITE DECLINE IN PROPERTY PRICING, LEASING ACTIVITY
2013 San Diego Economic Outlook. 29 th Annual Economic Roundtable Marney Cox Chief Economist San Diego Association of Governments January 25, 2013
 213 San Diego Economic Outlook 29 th Annual Economic Roundtable Marney Cox Chief Economist San Diego Association of Governments January 25, 213 US The Problem Slow Economic Growth Gross Domestic Product
San Francisco Bay Area to Napa County Housing and Economic Outlook
 San Francisco Bay Area to 019 Napa County Housing and Economic Outlook Bay Area Economic Forecast Summary Presented by Pacific Union International, Inc. and John Burns Real Estate Consulting, LLC On Nov.
2017 RESIDENTIAL REAL ESTATE MARKET REPORT
 2017 RESIDENTIAL REAL ESTATE MARKET REPORT Published January 26, 2018 Our market reports have been focused on the effects of low inventory on our housing market and for good reason. December 2017 marked
2013 Arizona Housing Market Mid-Year Report
 2013 Arizona Housing Market Mid-Year Report This mid-year market report outlines the latest trends in Arizona real estate. The housing market hit bottom in mid to late 2011, and has been in recovery mode
DETACHED MULTI-UNIT APPROVALS
 HIA New Home Sales DETACHED MULTI-UNIT APPROVALS SALES MULTI-UNIT DETACHED A monthly update on the sales of new homes December 217 TAX BURDEN TAKES TOLL ON New Home Sales during 217 Sales still post modest
National Housing Trends
 National Housing Trends 34% America s Choice of Best Long Term Investment 26% 17% 15% 6% Real Estate Stocks / Mutual Funds Gold Savings Accounts / CDs Bonds Gallup 2018 Housing Affordability 197 Index
STRENGTHENING RENTER DEMAND
 5 Rental Housing Rental housing markets experienced another strong year in 2012, with the number of renter households rising by over 1.1 million and marking a decade of unprecedented growth. New construction
Metropolitan Area Statistics
 Metropolitan Area Statistics Apartment Completions 1Q 2011 1Q 2012 % Chg Atlanta - - n/a Boston 133 39-71% Chicago - 20 n/a Cleveland - - n/a Columbus - 272 n/a Dallas-Ft. Worth 604 1,059 75% Denver 328
ECONOMIC CURRENTS. Vol. 3, Issue 1. THE SOUTH FLORIDA ECONOMIC QUARTERLY Introduction
 ECONOMIC CURRENTS THE SOUTH FLORIDA ECONOMIC QUARTERLY Introduction Economic Currents provides an overview of the South Florida regional economy. The report contains current employment, economic and real
Austin-Round Rock Area Local Market Report, Fourth Quarter 2017
 -Round Rock Area Local Market Report, Fourth Quarter 2017 Today's Market $350,000 Median Price (Red Line) and One-year Price Growth 12% $300,000 $250,000 10% 8% 6% $200,000 4% $150,000 2% $100,000 $50,000
S Sep eptember 2016
 September Detached prices stabilize in soft market, October, The segment of Calgary s housing market with the greatest influence on the overall market is showing signs of pricing stability. The detached
Housing Price Forecasts. Illinois and Chicago PMSA, January 2019
 Housing Price Forecasts Illinois and Chicago PMSA, January 2019 Presented To Illinois Realtors From R E A L Regional Economics Applications Laboratory, Institute of Government and Public Affairs University
Changing Economic Times. Market Pulse. Dr. Gary Jackson Director, Regional Economic Research Institute Florida Gulf Coast University April 8, 2008
 Changing Economic Times Presented to: Market Pulse Bonita Springs Area Chamber of Commerce Bonita Springs-Estero Association of REALTORS, Inc. Dr. Gary Jackson Director, Regional Economic Research Institute
Looking Ahead to 2019: Crosscurrents in the Housing Market
 Looking Ahead to 2019: Crosscurrents in the Housing Market Gay Cororaton Research Economist, National Association of REALTORS Virginia Peninsula Association of REALTORS, Inc. General Membership Meeting
Housing and Economy Market Trends
 Housing and Economy Market Trends Mainstreet Organization Prices of single-family, detached homes in suburban Chicago increased 12.1 percent in May 2014 compared with the same period a year ago. Overall,
MONTHS OF SUPPLY AND PRICE CHANGES. Home improvement November marks a rise in sales. MONTHLY STATISTICS PACKAGE City of Calgary. Nov.
 November 17 17 Home improvement November marks a rise in sales. City of Calgary, December 1, 17 The November housing market was spurred by a rise in sales, particularly in the lower price ranges. Sales
Housing and Mortgage Market Update
 Housing and Mortgage Market Update Views from the Top Frank E. Nothaft Vice President and Chief Economist January 8, 2015 Summary: Housing & Mortgage Market Outlook for 2015 Interest rates expected to
September bounce in house price sentiment
 Knight Frank/Markit House Price Sentiment Index (HPSI) SEPTEMBER 2012 September bounce in house price sentiment Key headlines for September UK households perceive that the value of their home declined
Housing Bulletin Monthly Report
 January 21 1 Housing Bulletin Monthly Report Most new homes built in second half of 29 25, 2, 15, 1, 5, Dec 7 Jan 8 Feb 8 mar 8 apr 8 Alberta s 29 housing starts increased 72.8 per cent over 28, suggesting
ECONOMIC CURRENTS. Vol. 4, Issue 3. THE Introduction SOUTH FLORIDA ECONOMIC QUARTERLY
 ECONOMIC CURRENTS THE Introduction SOUTH FLORIDA ECONOMIC QUARTERLY Vol. 4, Issue 3 Economic Currents provides an overview of the South Florida regional economy. The report presents current employment,
San Francisco Bay Area to Marin, San Francisco, and San Mateo Counties Housing and Economic Outlook
 San Francisco Bay Area to 019 Marin, San Francisco, and San Mateo Counties Housing and Economic Outlook Bay Area Economic Forecast Summary Presented by Pacific Union International, Inc. and John Burns
Residential Real Estate, Demographics, and the Economy
 Residential Real Estate, Demographics, and the Economy Presented to: Regional & Community Bankers Conference Yolanda K. Kodrzycki Senior Economist and Policy Advisor Federal Reserve Bank of Boston October
ECONOMIC CURRENTS. Vol. 5 Issue 2 SOUTH FLORIDA ECONOMIC QUARTERLY. Key Findings, 2 nd Quarter, 2015
 ECONOMIC CURRENTS THE Introduction SOUTH FLORIDA ECONOMIC QUARTERLY Economic Currents provides an overview of the South Florida regional economy. The report presents current employment, economic and real
2017 MORTGAGE MARKET OUTLOOK: EXECUTIVE HOUSING REPORT JANUARY 2017
 2017 MORTGAGE MARKET OUTLOOK: EXECUTIVE HOUSING REPORT JANUARY 2017 1 2017 FORECAST OVERVIEW For the 2017 housing market, the outlook is generally positive. The long recovery from the elevated delinquency
REGIONAL. Rental Housing in San Joaquin County
 Lodi 12 EBERHARDT SCHOOL OF BUSINESS Business Forecasting Center in partnership with San Joaquin Council of Governments 99 26 5 205 Tracy 4 Lathrop Stockton 120 Manteca Ripon Escalon REGIONAL analyst april
By several measures, homebuilding made a comeback in 2012 (Figure 6). After falling another 8.6 percent in 2011, single-family
. After falling another 8.6 percent in 2011, single-family") 2 Housing Markets With sales picking up, low inventories of both new and existing homes helped to firm prices and spur new single-family construction in 212. Multifamily markets posted another strong year,
2 Housing Markets With sales picking up, low inventories of both new and existing homes helped to firm prices and spur new single-family construction in 212. Multifamily markets posted another strong year,
Demand down with net migration
 July 1 Demand down with net migration City of Calgary, August, 1 In step with City census data on declining net migration levels, housing sales activity totaled 1,71 units in July, a 1. per cent decrease
HOUSING MARKETS. Strength in Early 2005 Pushed Most National Housing Indicators into Record Territory
 HOUSING MARKETS Despite another record-setting performance, housing markets showed clear signs of cooling late in 2005. As mortgage interest rates moved up and house prices soared, home sales turned down
Housing Market Update
 Housing Market Update September 2017 EXECUTIVE SUMMARY TIGHT HOUSING MARKET CONTINUES, REFLECTS LOW INVENTORY AND HIGHER PRICES Dean J. Christon, Executive Director September 2017 The trend continues in
Housing Health Report Housing supply outlook suggests market high is leveling off
 November 2018 Housing Health Report Housing supply outlook suggests market high is leveling off For the first time since 2011, new and existing housing supply experiences blanket declines. 2018 activity
NOVEMBER 2018 Harrisonburg & Rockingham County Real Estate Market Report
 NOVEMBER 218 Real Estate Market Report An analysis of real estate activity through October 31, 218 provided courtesy of Scott P. Rogers, Funkhouser Real Estate Group Custom-Built Highland Park Home with
The Florida Housing Market
 Florida International University FIU Digital Commons Economics Research Occasional Paper Series Department of Economics 1-2007 The Florida Housing Market Jorge Salazar-Carrillo Department of Economics,
NATIONAL ASSOCIATION of REALTORS RESEARCH DIVISION. Prepared for Florida REALTORS
 NATIONAL ASSOCIATION of REALTORS RESEARCH DIVISION Prepared for Florida REALTORS NATIONAL ASSOCIATION OF REALTORS RESEARCH DIVISION Page 1 Page 3 Page 4 Page 6 Page 7 Page 8 Page 9 Page 10 Page 11 Page
Cycle Monitor Real Estate Market Cycles Third Quarter 2017 Analysis
 Cycle Monitor Real Estate Market Cycles Third Quarter 2017 Analysis Real Estate Physical Market Cycle Analysis of Five Property Types in 54 Metropolitan Statistical Areas (MSAs). Income-producing real
Housing Price Forecasts. Illinois and Chicago PMSA, June 2012
 Housing Price Forecasts Illinois and Chicago PMSA, June 2012 Presented To Illinois Association of REALTORS From R E A L Regional Economics Applications Laboratory, Institute of Government and Public Affairs
Aug. Aug 2018 ust 2018
 August 18 MONTHLY STATISTICS PACKAGE City of Calgary Unemployment rate slows housing market recovery 18 City of Calgary, September, 18 Easing sales, gains in new listings and elevated inventory levels
1 June FNB House Price Index - Real and Nominal Growth MAY FNB HOUSE PRICE INDEX FINDINGS
 1 June 2016 MARKET ANALYTICS AND SCENARIO FORECASTING UNIT JOHN LOOS: HOUSEHOLD AND PROPERTY SECTOR STRATEGIST 087-328 0151 john.loos@fnb.co.za THEO SWANEPOEL: PROPERTY MARKET ANALYST 087-328 0157 tswanepoel@fnb.co.za
Housing market feels the chill as oversupply continues Feb. 2019
 February 19 19 MONTHLY STATISTICS PACKAGE Housing market feels the chill as oversupply continues 19, March 1, 19 The effects of Calgary s economic climate continue to create weak sales activity and elevated
Housing Bulletin Monthly Report
 August 21 Housing Bulletin Monthly Report 1 C a n a da s P r e li m i n a ry H o u s i n g S ta r t s s l i p i n J u ly Preliminary Housing St arts in Albert a* and Canada* July 28 to July 21 25, Canada
O O ct ct ober 2017
 October Status Quo for Calgary's Housing Market Prices remain similar to last year, but ease in October., November 1, 17 October s housing market conditions closely echoed previous month s trends with
California Housing Market Update. Monthly Sales and Price Statistics November 2018
 California Housing Market Update Monthly Sales and Price Statistics November 2018 Home Sales: Largest Decline Since 2014 California, November 2018 Sales: 381,400 Units, -4.6% YTD, -13.4% YTY 700,000 600,000
REAL ESTATE MARKET OVERVIEW 1 st Half of 2015
 REAL ESTATE MARKET OVERVIEW 1 st Half of 2015 With Comparisons to the 2 nd Half of 2014 September 4, 2015 Prepared for: First Bank of Wyoming Prepared by: Ken Markert, AICP MMI Planning 2319 Davidson Ave.
California Housing Market Update. Monthly Sales and Price Statistics October 2018
 California Housing Market Update Monthly Sales and Price Statistics October 2018 Sales Had the 2 nd Largest Drop in the Last 6 Months California, October 2018 Sales: 397,060 Units, -3.7% YTD, -7.9% YTY
2018 Real Estate Forecast Breakfast. Real Estate Market Update
 2018 Real Estate Forecast Breakfast Central Oregon Association of REALTORS Real Estate Market Update Paul C. Bishop, PhD, CBE Vice President, Research NATIONAL ASSOCIATION OF REALTORS February 22, 2018
Sep September 2018
 18 September 18 MONTHLY STATISTICS PACKAGE City of Calgary Persistent buyers market continues 18 City of Calgary, October 1, 18 With no change in the economic climate, Calgary s sales activity totaled
Residential December 2009
 Residential December 2009 Karl L. Guntermann Fred E. Taylor Professor of Real Estate Adam Nowak Research Associate Year End Review The dramatic decline in Phoenix house prices caused by an unprecedented
CONTINUED STRONG DEMAND
 Rental Housing Although slowing, renter household growth continued to soar in 13. The strength of demand has kept rental markets tight across the country, pushing up rents and spurring new construction.
2018 Housing Market Outlook. Central Coast Realty Group Business Symposium February 22, 2018 Oscar Wei Senior Economist
 2018 Housing Market Outlook Central Coast Realty Group Business Symposium February 22, 2018 Oscar Wei Senior Economist Overview Economic Update California Housing Market Outlook Regional Housing Market