Metropolitan Indianapolis Board of REALTORS. Broker/Owner Meeting March 14, 2007
|
|
|
- Kathlyn Poole
- 5 years ago
- Views:
Transcription

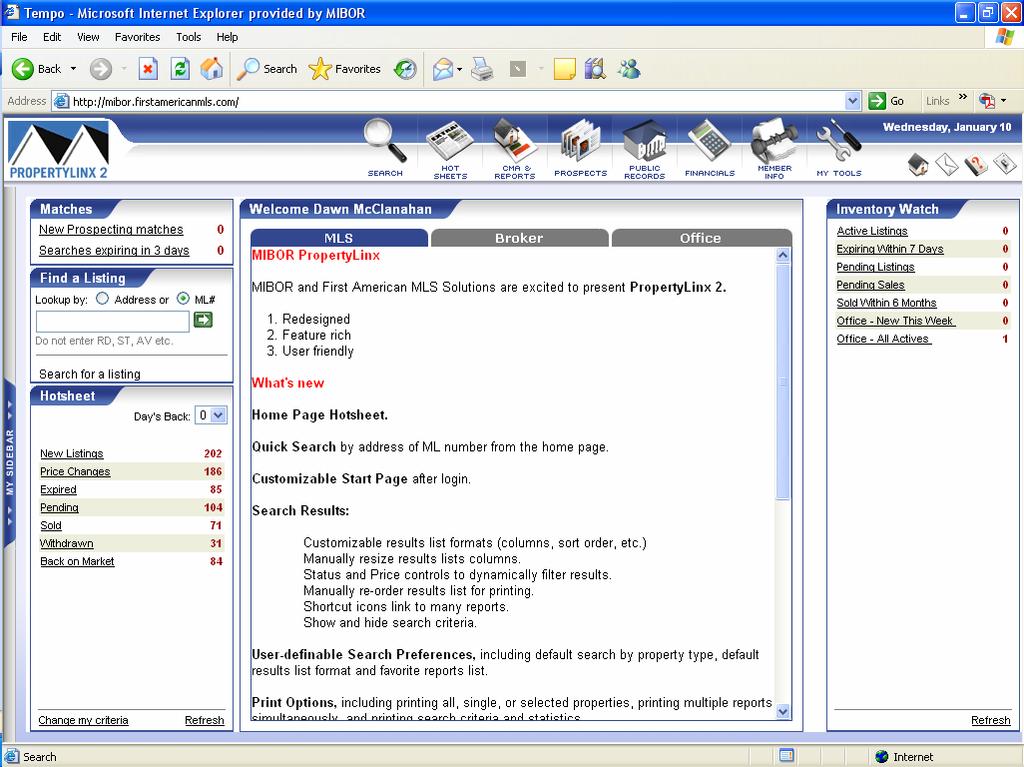
1 Metropolitan Indianapolis Board of REALTORS Broker/Owner Meeting March 14, 2007

2
3 Tom Renkert Information Services Director MIBOR
4
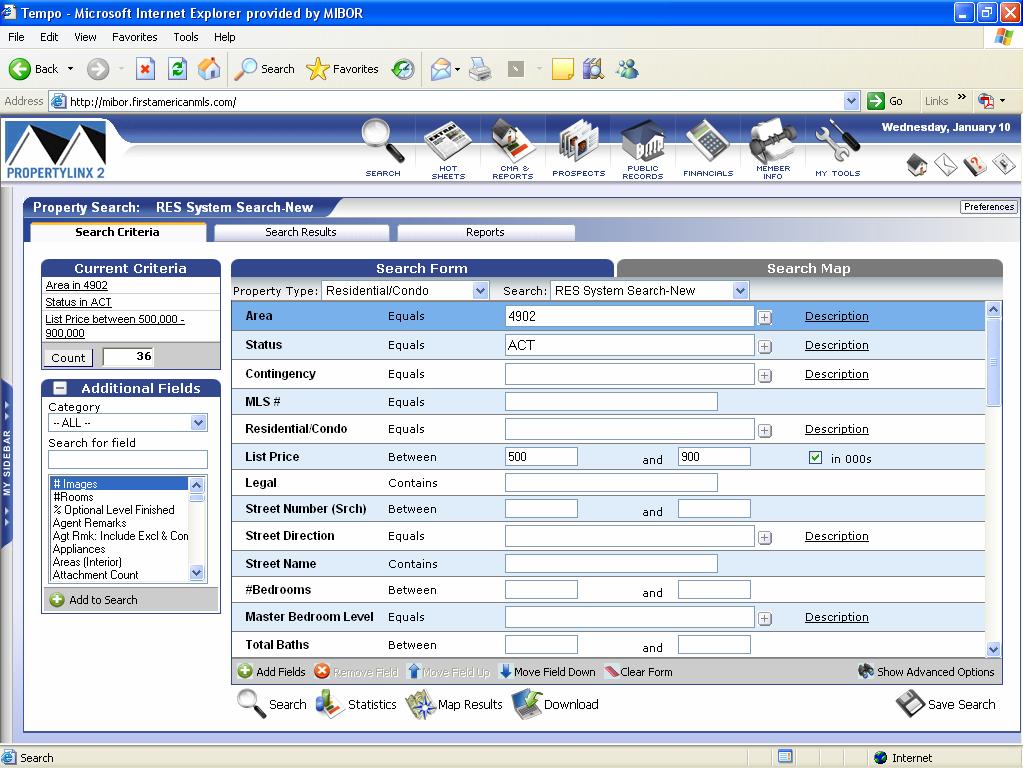
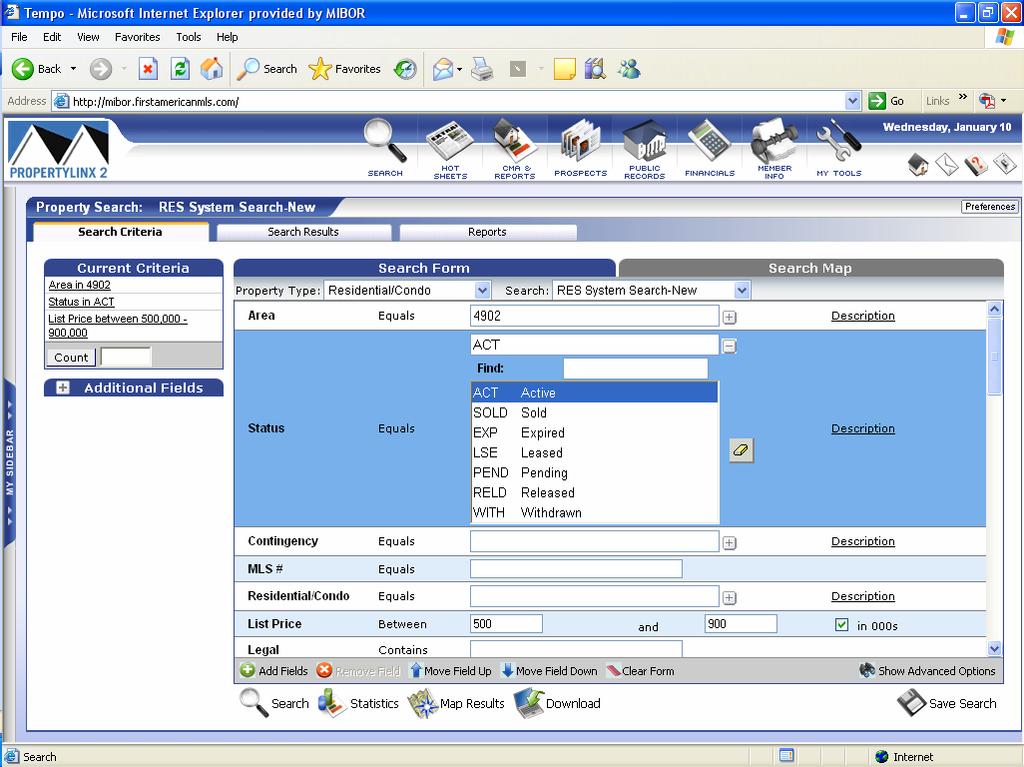
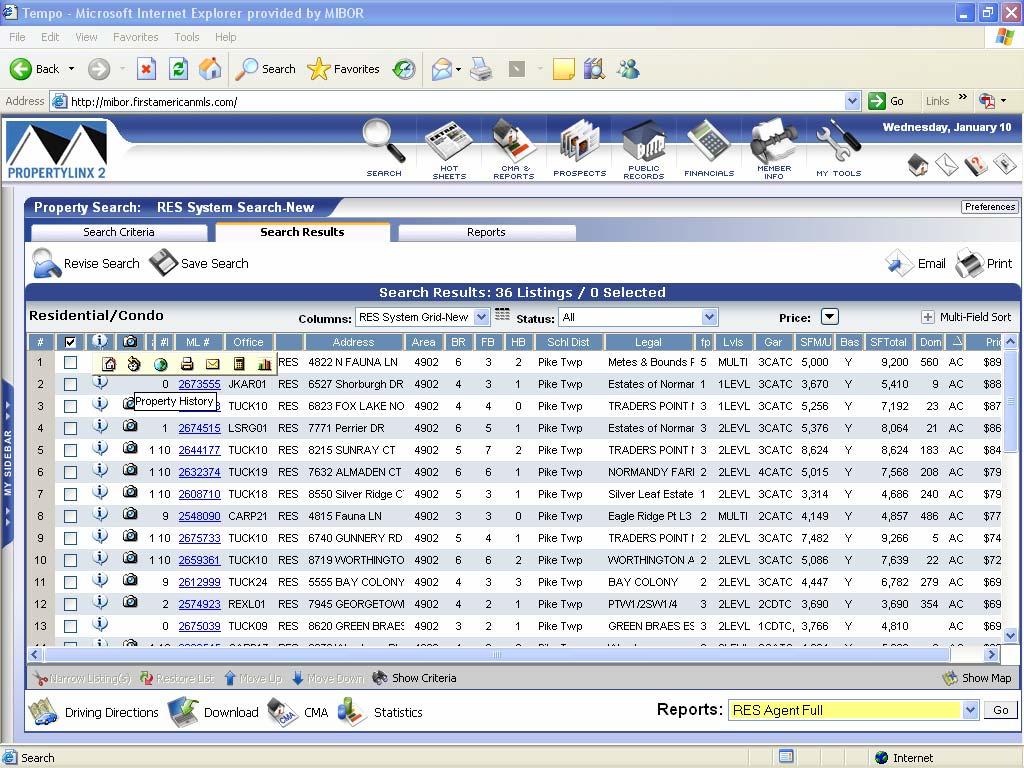
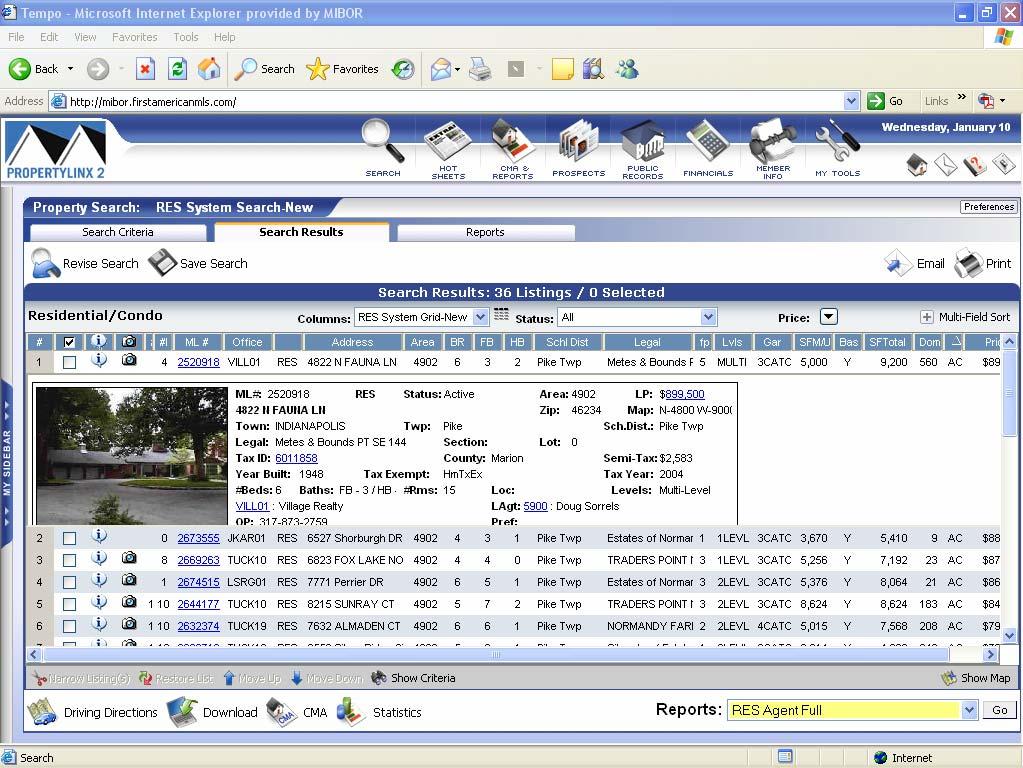
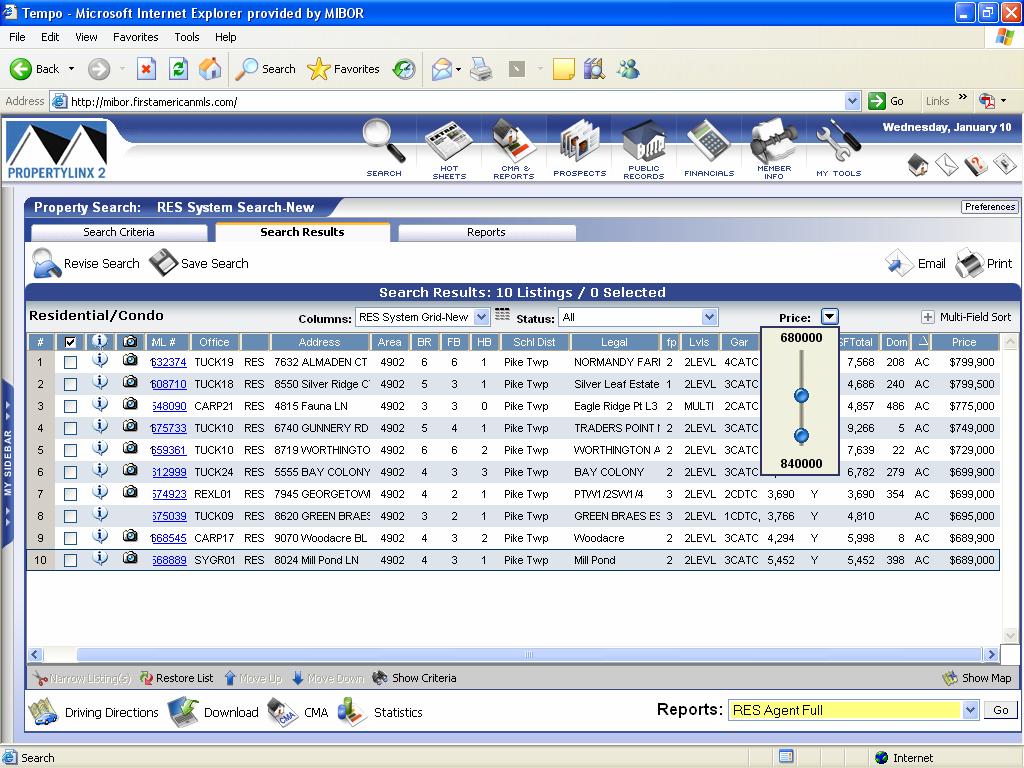
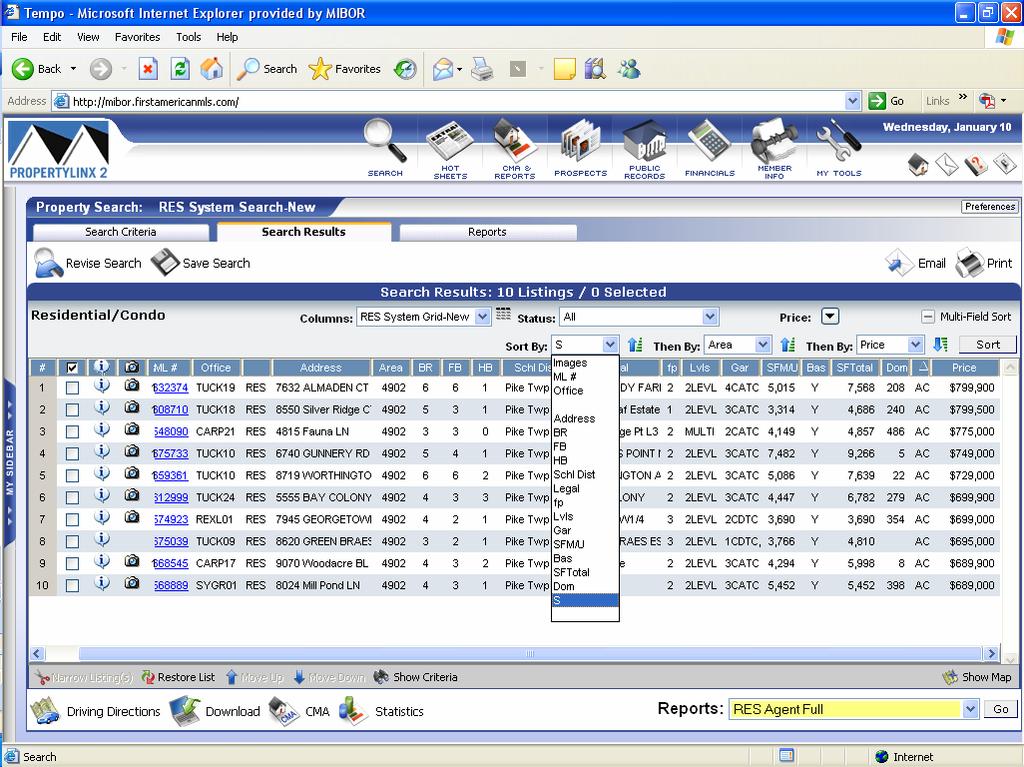
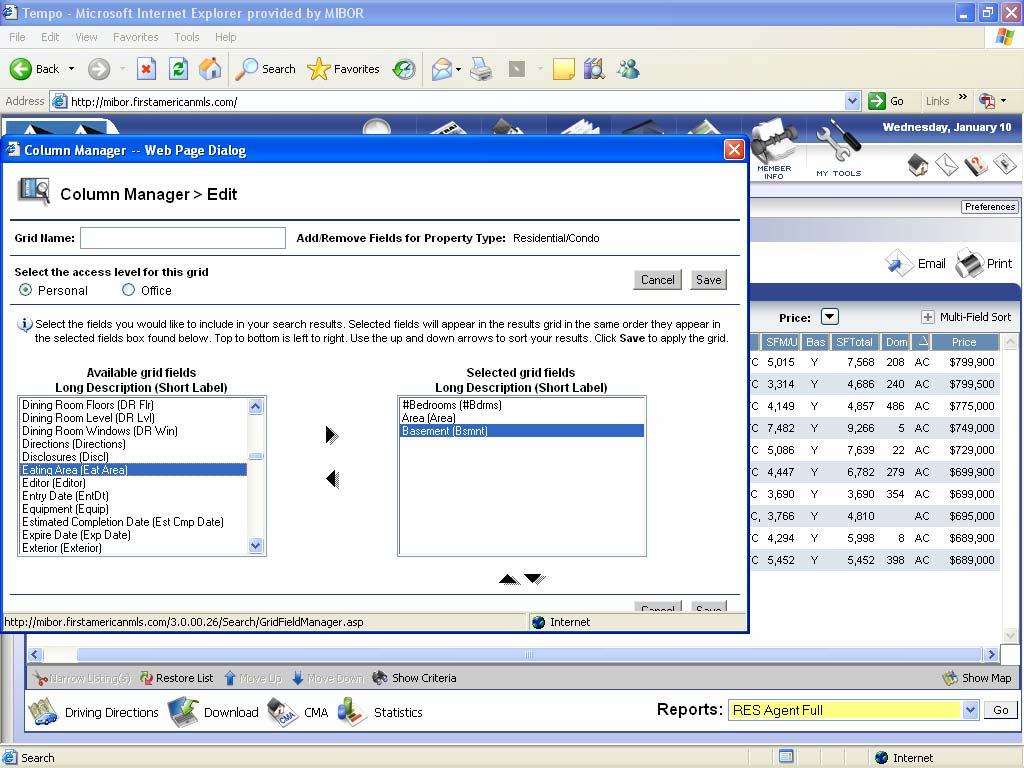
5 PropertyLinx 2 Implementation Time Line February 1-28 March 1 June 30 July 1 August 31 REVIEW PERIOD MLS Committee Training Functionality Testing PROMOTE & DEMO Division Meetings Office Sales Meetings MEMBER TRAINING Presentation style and hands-on training September 5 PropertyLinx 2 Fully Operational Review & Testing Office & Division Demonstrations Member Training
6
7
8
9
10
11
12
13
14
15
16
17
18
19

20

21

22
23
24
25
26

27
28 Training begins in July. Watch Fast Track for updates!
29 PropertyLinx 2 Implementation Time Line February 1-28 March 1 June 30 July 1 August 31 REVIEW PERIOD MLS Committee Training Functionality Testing PROMOTE & DEMO Division Meetings Office Sales Meetings MEMBER TRAINING Presentation style and hands-on training September 5 PropertyLinx 2 Fully Operational Review & Testing Office & Division Demonstrations Member Training
30
31 REALTOR Political Action Committee (RPAC) Larry Mitchell MPAC Trustee

32

33 What If REALTORS never have an opportunity for affordable health care A 17% tax is charged on all real estate transactions Additional fees are charged on housing Property taxes (enough said)
34 Why PAC s Exist? Committees (PAC) exist because of election funding laws that limit an organization s ability to contribute to political campaigns. Because MIBOR does not use dues dollars to support candidates, the PAC is its vehicle to do so.
 A voluntary fund that allows")
35 What exactly is RPAC? I think I know, but 100% of contributions go to candidates (none is used for administration or staff) A voluntary fund that allows only members of MIBOR to pool money together to endorse candidates. MIBOR members make all decisions on endorsements

36 Efforts in Washington, DC Affordable health care for REALTORS 1 in 4 REALTORS have no health insurance (1,825 MIBOR members have no insurance) REALTOR groups and agents should be able to band together to negotiate lower premiums Can you put a price on the ease of mind for health care?

37 Efforts in Indiana Defeated a 17% transfer tax Reducing Indiana s reliance on property taxes. Fighting a $40 fee/tax on housing
38 Efforts at Local Level Zoning in Montgomery County Sign Ordinance Deregulation Private Property Rights Economic Development Recruiting high paying jobs Building roads and infrastructure Smart growth

39 Brokers: RPAC Needs Your Leadership 1. Talk about RPAC to your agents 2. Make a $99 contribution 3. Help us reach our $109,000 goal by June 30 th
40 Why? What if we didn t participate?
41
42 Tom Renkert Information Services Director MIBOR
43 Direct Soliciting by Seller New Statement of NAR MLS Policy related to types of listings that will appear on MIBOR website publications such as REALTOR.com and MIBOR.com.
44 Direct Soliciting by Seller Is there a for sale by owner or other sign or notice on the property indicating that the seller is soliciting direct contact from buyers? If Yes, MIBOR will not include property in MIBOR website publications such as MIBOR.com & REALTOR.com All listings will be available in IDX database. Brokers independently make choices for which listings will appear on their site.
45
46 David Berson Vice President & Chief Economist Fannie Mae
47 Economic, Housing & Mortgage Market Outlook March 14, 2007 David W. Berson Vice President & Chief Economist
48 What You Want to Know: We expect economic growth modestly below trend in The Fed has probably finished tightening, and may ease later this year. Long-term rates should be little changed from current levels. Home sales should drop again in 2007, but the worst declines are likely behind us. Home price gains are slowing sharply, with price declines in some areas. Purchase originations should drop in 2007, while refinancings are projected to slip modestly.
49 GDP Growth At a Slightly Below-Trend Pace 8% 6% Trend Growth % 4% 2% 0% -2% -4% Q1:90 Q1:92 Q1:94 Q1:96 Q1:98 Q1:00 Q1:02 Q1:04 Q1:06 Q1:08 Source: Bureau of Economic Analysis, Fannie Mae forecast
50 Payroll Employment Growth: National vs. Indiana 4% 3% 2% 1% 0% -1% -2% -3% Q1:90 Q1:91 Q1:92 Q1:93 Q1:94 Q1:95 Q1:96 Q1:97 Q1:98 Q1:99 Q1:00 Q1:01 Q1:02 Q1:03 Q1:04 Q1:05 Q1:06 Year/Year National Indiana Source: Bureau of Labor Statistics
51 Payroll Employment Growth: National vs. Indianapolis 6% 4% 2% 0% -2% -4% -6% Q1:90 Q1:91 Q1:92 Q1:93 Q1:94 Q1:95 Q1:96 Q1:97 Q1:98 Q1:99 Q1:00 Q1:01 Q1:02 Q1:03 Q1:04 Q1:05 Q1:06 Year/Year Indianapolis National Source: Bureau of Labor Statistics
52 Consumer Sentiment Will the Bounce in Sentiment Hold? Index 66Q1 = Good Time to Buy = Good Time Bad Time +100 Good Time to Buy a Home (left axis) Consumer Sentiment (right axis) Jan- 90 Jan- 91 Jan- 92 Jan- 93 Jan- 94 Jan- 95 Jan- 96 Jan- 97 Jan- 98 Jan- 99 Jan- 00 Jan- 01 Jan- 02 Jan- 03 Jan- 04 Jan- 05 Jan- Jan Source: University of Michigan Consumer Sentiment Survey
53 Inflation* Will Core Inflation Drop Into the Fed s Target Range? 7% 6% Year-Ago Percent Change History Forecast 5% Q1:90 Q1:91 Q1:92 Q1:93 Q1:94 Q1:95 Q1:96 Q1:97 Q1:98 Q1:99 Q1:00 Q1:01 Q1:02 Q1:03 Q1:04 Q1:05 Q1:06 Q1:07 Q1:08 4% 3% 2% 1% 0% *Consumer Price Index Source: Bureau of Labor Statistics CPI Core Rate CPI
54 Federal Funds Rate Fed Done for Now May Ease Later in % 8% 7% 6% 5% 4% 3% 2% 1% 0% History Forecast Q1:90 Q1:92 Q1:94 Q1:96 Q1:98 Q1:00 Q1:02 Q1:04 Q1:06 Q1:08 Source: Federal Reserve Board, Fannie Mae forecast
55 11% 10% 9% 8% 7% 6% 5% 4% 3% Long-Term Interest Rates Not Much Change 30-Year FRM 10-Year Treasury History Forecast Q1:90 Q3:91 Q1:93 Q3:94 Q1:96 Q3:97 Q1:99 Q3:00 Q1:02 Q3:03 Q1:05 Q3:06 Q1:08 Source: Freddie Mac, Federal Reserve Board, Fannie Mae forecast
56 Homeownership Rate No Longer Rising as Affordability Falls 70% 69% 68% 67% 66% 65% 64% 63% 62% Q1:80 Q1:82 Q1:84 Q1:86 Q1:88 Q1:90 Q1:92 Q1:94 Q1:96 Q1:98 Q1:00 Q1:02 Q1:04 Q1:06 Source: Bureau of the Census
57 1.4 Millions of Units New Home Sales Down Again in Source: Bureau of the Census, Fannie Mae forecast
58 New Home Inventories Still High Suggests Weakness in Prices Thousands Months Supply at Current Rate (right axis) Homes for Sale at End of Month (left axis) 200 Months Jan:1990 Jan:1991 Jan:1992 Jan:1993 Jan:1994 Jan:1995 Jan:1996 Jan:1997 Jan:1998 Jan:1999 Jan:2000 Jan:2001 Jan:2002 Jan:2003 Jan:2004 Jan:2005 Jan:2006 Jan:2007 Source: Bureau of the Census
59 2,400 2,100 1,800 1,500 1, Thousands of Units Housing Starts Down Again in 2007 Multifamily Single-family Source: Bureau of the Census, Fannie Mae forecast
60 Millions of Units Existing Home Sales Down Again in Source: National Association of Realtors, Fannie Mae forecast
61 Existing Single-Family Home Inventories Inventories Still High Thousands Months Supply At Current Sales Rate (right axis) Homes for Sale at End of Month (left axis) Months Jan:1990 Jan:1991 Jan:1992 Jan:1993 Jan:1994 Jan:1995 Jan:1996 Jan:1997 Jan:1998 Jan:1999 Jan:2000 Jan:2001 Jan:2002 Jan:2003 Jan:2004 Jan:2005 Jan:2006 Jan:2007 Source: National Association of Realtors
62 Dec-05 Sep-06 Jun-04 Mar-05 Investor Share Falling But Still High 25% 20% 15% 10% Investor & Second Home 5% 0% Investor Sep-91 Jun-92 Mar-93 Dec-93 Sep-94 Jun-95 Mar-96 Dec-96 Sep-97 Jun-98 Mar-99 Dec-99 Sep-00 Jun-01 Mar-02 Dec-02 Sep-03 Note: Shares are based upon number of Prime Conventional Conforming Purchase loans Source: LoanPerformance September 2006 data
63 14% 12% 10% 8% 6% Home Price Gains Slowing Sharply, Will They Decline? Year-Ago Percent Change Purchase Only House Price Index House Price Index 4% 2% 0% Q1:87 Q1:89 Q1:91 Q1:93 Q1:95 Q1:97 Q1:99 Q1:01 Q1:03 Q1:05 Source: OFHEO
64 OFHEO Home Price Index: National vs. Indiana 16% 14% 12% 10% 8% 6% 4% 2% 0% Q1:90 Q1:91 Q1:92 Q1:93 Q1:94 Q1:95 Q1:96 Q1:97 Q1:98 Q1:99 Q1:00 Q1:01 Q1:02 Q1:03 Q1:04 Q1:05 Q1:06 Year/Year National Indiana Source: Office of Federal Housing Enterprise Oversight
65 OFHEO Home Price Index: National vs. Indianapolis 16% 14% 12% 10% 8% 6% 4% 2% 0% Q1:90 Q1:91 Q1:92 Q1:93 Q1:94 Q1:95 Q1:96 Q1:97 Q1:98 Q1:99 Q1:00 Q1:01 Q1:02 Q1:03 Q1:04 Q1:05 Q1:06 Year/Year National Indianapolis Source: Office of Federal Housing Enterprise Oversight
66 Five-Year House Price Growth, Single Family 2001 Q Q4 Canada Mexico Below 25% 25% - 50% 50% - 75% 75% - 100% Above 100% Source: Fannie Mae
67 One-Year House Price Growth, Single Family 2005 Q Q4 Canada Mexico Source: Fannie Mae Below 0% 0% - 5% 5% - 10% 10% - 15% Above 15%
68 Serious Delinquency Rates National vs. Indiana Q1:90 Q1:91 Q1:92 Q1:93 Q1:94 Q1:95 Q1:96 Q1:97 Q1:98 Q1:99 Q1:00 Q1:01 Q1:02 Q1:03 Q1:04 Q1:05 Q1:06 Indiana National Source: Mortgage Bankers Association *90 days past due and foreclosures started
69 Jan-06 Jan-07 Jan-04 Jan Index, 16-Mar-90 =100, SA MBA Purchase Index Up, Down, or Sideways? March 2 Jan-90 Jan-91 Jan-92 Jan-93 Jan-94 Jan-95 Jan-96 Jan-97 Jan-98 Jan-99 Jan-00 Jan-01 Jan-02 Jan-03 Source: Mortgage Bankers Association of America Weekly Mortgage Application Survey
70 Jan-07 Jan-04 Jan-05 Jan-06 10,000 9,000 8,000 7,000 6,000 5,000 4,000 3,000 2,000 1,000 0 Index, 16-Mar-90 =100, SA MBA Refinance Index Stable March 2 Jan-90 Jan-91 Jan-92 Jan-93 Jan-94 Jan-95 Jan-96 Jan-97 Jan-98 Jan-99 Jan-00 Jan-01 Jan-02 Jan-03 Source: Mortgage Bankers Association of America Weekly Mortgage Application Survey
71 Percent ARM Share of Mortgage Applications* Falling March 2 Jan-90 Jan-91 Jan-92 Jan-93 Jan-94 Jan-95 Jan-96 Jan-97 Jan-98 Jan-99 Jan-00 Jan-01 Jan-02 Jan-03 Jan-04 Jan-05 Jan-06 Jan-07 *By number of loans Source: Mortgage Bankers Association of America Weekly Mortgage Application Survey
72 4,000 3,500 3,000 2,500 2,000 1,500 1, Mortgage Originations Pulled Down by Purchases Billions of Dollars Refis Purchase Source: HUD, Fannie Mae estimates (1998 forward), Fannie Mae forecast
73 16% 14% 12% 10% 8% 6% 4% 2% 0% Mortgage Debt Outstanding Finally Slowing Year/Year Percent Change Q1:90 Q1:91 Q1:92 Q1:93 Q1:94 Q1:95 Q1:96 Q1:97 Q1:98 Q1:99 Q1:00 Q1:01 Q1:02 Q1:03 Q1:04 Q1:05 Q1:06 Q1:07 Q1:08 Source: Federal Reserve Board, Fannie Mae forecast
74 Things to Take Away: Economic activity slightly below trend through Odds of a downturn are still low. Fed tightening likely done easing later in 2007? Long-term rates should be little changed. Housing activity down again in 2007, but by less than in Regional home price weakness could cause a national price decline. Originations should fall in Pulled down by purchases, with refis down a bit.
75 Opinions, analyses, estimates, forecasts and other views of Fannie Mae's Economics & Mortgage Market Analysis (EMMA) group included in these materials should not be construed as indicating Fannie Mae's business prospects or expected results, and are subject to change without notice. Although the EMMA group bases its opinions, analyses, estimates, forecasts and other views on information it considers reliable, it does not guarantee that the information provided in these materials is accurate, current or suitable for any particular purpose. The analyses, opinions, estimates, forecasts and other views published by the EMMA group represent the views of that group as of the date indicated and do not necessarily represent the views of Fannie Mae or its management.
76
Housing and Mortgage Market Update
 Housing and Mortgage Market Update Views from the Top Frank E. Nothaft Vice President and Chief Economist January 8, 2015 Summary: Housing & Mortgage Market Outlook for 2015 Interest rates expected to
Housing Price Forecasts. Illinois and Chicago PMSA, May 2018
 Housing Price Forecasts Illinois and Chicago PMSA, May 2018 Presented To Illinois Realtors From R E A L Regional Economics Applications Laboratory, Institute of Government and Public Affairs University
THE OUTLOOK FOR HOUSING IN ILLINOIS
 THE OUTLOOK FOR HOUSING IN ILLINOIS Jonathan Smoke Chief Economist January 25, 2017 NATIONAL TRENDS 2 2000.01 2000.05 2000.09 2001.01 2001.05 2001.09 2002.01 2002.05 2002.09 2003.01 2003.05 2003.09 2004.01
MARKET OUTLOOK FOR SAN MATEO
 MARKET OUTLOOK FOR SAN MATEO Jonathan Smoke Chief Economist August 2, 2016 NATIONAL TRENDS 2 JOB CREATION REBOUNDED IN JUNE 229,000 jobs created by month in 2015; 172,000 average this year Employment and
Housing and Economy Market Trends
 Housing and Economy Market Trends Mainstreet Organization Prices of single-family, detached homes in suburban Chicago increased 12.1 percent in May 2014 compared with the same period a year ago. Overall,
Housing Price Forecasts. Illinois and Chicago PMSA, January 2018
 Housing Price Forecasts Illinois and Chicago PMSA, January 2018 Presented To Illinois Realtors From R E A L Regional Economics Applications Laboratory, Institute of Government and Public Affairs University
Housing Price Forecasts. Illinois and Chicago PMSA, June 2012
 Housing Price Forecasts Illinois and Chicago PMSA, June 2012 Presented To Illinois Association of REALTORS From R E A L Regional Economics Applications Laboratory, Institute of Government and Public Affairs
State of the Nation s Housing 2008: A Preview
 State of the Nation s Housing 28: A Preview Eric S. Belsky Remodeling Futures Conference April 15, 28 www.jchs.harvard.edu The Housing Market Has Suffered Steep Declines Percent Change Median Existing
Economic and Housing Update
 Economic and Housing Update Mark Palim Vice President, Applied Economic and Housing Research Fannie Mae January 14, 2015 2012 Fannie Mae. Trademarks of Fannie Mae. Economic Activity Rebounding Solidly
2018 Real Estate Forecast Breakfast. Real Estate Market Update
 2018 Real Estate Forecast Breakfast Central Oregon Association of REALTORS Real Estate Market Update Paul C. Bishop, PhD, CBE Vice President, Research NATIONAL ASSOCIATION OF REALTORS February 22, 2018
CALIFORNIA ECONOMIC & MARKET OUTLOOK. October 29,2014 Contra Costa Association of REALTORS Leslie Appleton Young, Chief Economist
 2014 2015 CALIFORNIA ECONOMIC & MARKET OUTLOOK October 29,2014 Contra Costa Association of REALTORS Leslie Appleton Young, Chief Economist OVERVIEW Economic Outlook California Housing Market Outlook Housing
Released: June Commentary 2. The Numbers That Drive Real Estate 3. Recent Government Action 9. Topics for Home Buyers, Sellers, and Owners 11
 Released: June 2011 Commentary 2 The Numbers That Drive Real Estate 3 Recent Government Action 9 Topics for Home Buyers, Sellers, and Owners 11 Brought to you by: KW Research Commentary The U.S. housing
2019 Housing Market Forecast. Palos Verdes Peninsula AOR January 8, 2019 Jordan G. Levine Senior Economist
 2019 Housing Market Forecast Palos Verdes Peninsula AOR January 8, 2019 Jordan G. Levine Senior Economist Overview Good News: Economic fundamentals solid Homeownership still the dream Rates might not go
The State of the Nation s Housing
 The State of the Nation s Housing Eric S. Belsky Remodeling Futures Conference April 13, 21 www.jchs.harvard.edu Existing Home Sales Improved then Retracted, While New Home Sales Are Still in the Basement
Housing Price Forecasts. Illinois and Chicago PMSA, July 2016
 Housing Price Forecasts Illinois and Chicago PMSA, July 2016 Presented To Illinois Association of Realtors From R E A L Regional Economics Applications Laboratory, Institute of Government and Public Affairs
Housing Price Forecasts. Illinois and Chicago PMSA, October 2014
 Housing Price Forecasts Illinois and Chicago PMSA, October 2014 Presented To Illinois Association of Realtors From R E A L Regional Economics Applications Laboratory, Institute of Government and Public
Housing Price Forecasts. Illinois and Chicago PMSA, August 2017
 Housing Price Forecasts Illinois and Chicago PMSA, August 2017 Presented To Illinois Realtors From R E A L Regional Economics Applications Laboratory, Institute of Government and Public Affairs University
Housing Price Forecasts. Illinois and Chicago PMSA, December 2015
 Housing Price Forecasts Illinois and Chicago PMSA, December 2015 Presented To Illinois Association of Realtors From R E A L Regional Economics Applications Laboratory, Institute of Government and Public
1200 Premier Drive, Suite 140 Chattanooga, TN Each office is independently owned and operated.
 THIS MONTH IN REAL ESTATE K im aulston R REALTOR 1200 Premier Drive, Suite 140 Chattanooga, TN 37421 Each office is independently owned and operated. Cell: 423-316-4022 Office: 423-664-1600 Email: kcraulston@gmail.com
Remodeling Trends and Outlook
 Remodeling Trends and Outlook Kermit Baker Remodeling Futures Conference October 16, 2007 www.jchs.harvard.edu Recent Remodeling Trends Growth in remodeling spending began to ease in Q3-2006. After Strong
2013 Housing Market Forecast. SILVAR: Los Gatos/Saratoga District October 10, 2012 Leslie Appleton-Young, Vice President & Chief Economist
 2013 Housing Market Forecast SILVAR: Los Gatos/Saratoga District October 10, 2012 Leslie Appleton-Young, Vice President & Chief Economist What we saw from the roof.. C.A.R. NAR THE ECONOMY Recent Housing
Housing Price Forecasts. Illinois and Chicago PMSA, March 2018
 Housing Price Forecasts Illinois and Chicago PMSA, March 2018 Presented To Illinois Realtors From R E A L Regional Economics Applications Laboratory, Institute of Government and Public Affairs University
Nothing Draws a Crowd Like a Crowd: The Outlook for Home Sales
 APRIL 2018 Nothing Draws a Crowd Like a Crowd: The Outlook for Home Sales The U.S. economy posted strong growth with fourth quarter 2017 Real Gross Domestic Product (real GDP) growth revised upwards to
Economic and Housing Market Outlook ( ) October 31, Contra Costa AOR
 October 31, Contra Costa AOR") Economic and Housing Market Outlook (2012 2013) Contra Costa AOR October 31, 2012 Oscar Wei Senior Research Analyst California Association of REALTORS Overview US and California Economies California Housing
Economic and Housing Market Outlook (2012 2013) Contra Costa AOR October 31, 2012 Oscar Wei Senior Research Analyst California Association of REALTORS Overview US and California Economies California Housing
Released: April 8, 2011
 Released: April 8, 2011 Commentary 2 The Numbers That Drive Real Estate 3 Special Report 9 Brought to you by: KW Research Commentary The housing market continues on a relatively stable and balanced track.
Austin-Round Rock Area Local Market Report, Fourth Quarter 2017
 -Round Rock Area Local Market Report, Fourth Quarter 2017 Today's Market $350,000 Median Price (Red Line) and One-year Price Growth 12% $300,000 $250,000 10% 8% 6% $200,000 4% $150,000 2% $100,000 $50,000
Released: June 7, 2010
 Released: June 7, 2010 Commentary 2 The Numbers That Drive Real Estate 3 Recent Government Action 9 Topics for Home Buyers, Sellers, and Owners 11 Brought to you by: KW Research Commentary The housing
Real gross domestic product California vs. United States
 Real gross domestic product California vs. United States Percent change, year ago 6 4 U.S. California 2 0-2 -4-6 2001 2002 2003 2004 2005 2006 2007 2008 2009 2010 2011 Source: Bureau of Economic Analysis.
With last month's gain, sales are now up 4.5% from May 2015 and are at their highest annual pace since February 2007.
 JULY 2016 With last month's gain, sales are now up 4.5% from May 2015 and are at their highest annual pace since February 2007. - Lawrence Yun NAR s Chief Economist Now in its seventh year, the US economic
Housing Price Forecasts. Illinois and Chicago PMSA, March 2016
 Housing Price Forecasts Illinois and Chicago PMSA, March 2016 Presented To Illinois Association of Realtors From R E A L Regional Economics Applications Laboratory, Institute of Government and Public Affairs
2017 RESIDENTIAL REAL ESTATE MARKET REPORT
 2017 RESIDENTIAL REAL ESTATE MARKET REPORT Published January 26, 2018 Our market reports have been focused on the effects of low inventory on our housing market and for good reason. December 2017 marked
Housing Market Cycles
 MEGA AGENT Market Update Gary Keller and Jay Papasan 2 The U.S. Housing Market Keller Williams Realty, Inc. Housing Market Cycles 4 The U.S. Housing Market Housing Market Cycles 5 The U.S. Housing Market
STRENGTHENING RENTER DEMAND
 5 Rental Housing Rental housing markets experienced another strong year in 2012, with the number of renter households rising by over 1.1 million and marking a decade of unprecedented growth. New construction
Young-Adult Housing Demand Continues to Slide, But Young Homeowners Experience Vastly Improved Affordability
 Young-Adult Housing Demand Continues to Slide, But Young Homeowners Experience Vastly Improved Affordability September 3, 14 The bad news is that household formation and homeownership among young adults
Real estate prices bottom, but remain stagnant
 Real estate prices bottom, but remain stagnant United States Index 2000Q4 = 100 200 180 Commercial RE prices 160 140 House prices 120 100 2001 2002 2003 2004 2005 Sources: Standard & Poor's and Fiserv,
Housing Price Forecasts. Illinois and Chicago PMSA, April 2018
 Housing Price Forecasts Illinois and Chicago PMSA, April 2018 Presented To Illinois Realtors From R E A L Regional Economics Applications Laboratory, Institute of Government and Public Affairs University
Commercial Real Estate Outlook
 Commercial Real Estate Outlook By Lawrence Yun, Ph.D. Chief Economist, National Association of REALTORS Presentation at Annual Conference of National Association of REALTORS Chicago, IL November 3, 2017
Housing Price Forecasts. Illinois and Chicago PMSA, January 2019
 Housing Price Forecasts Illinois and Chicago PMSA, January 2019 Presented To Illinois Realtors From R E A L Regional Economics Applications Laboratory, Institute of Government and Public Affairs University
MARKET STRATEGY VIEWPOINT U.S. Housing Decelerating
 Jan-01 Oct-01 Jul-02 Apr-03 Jan-0 Oct-0 Jul-05 Apr-0 Jan-07 Oct-07 Jul-08 Apr-09 Jan-10 Oct-10 Jul-11 Apr-12 Jan-13 Oct-13 Jul-1 Apr-15 Jan-1 Oct-1 Jul-17 Apr-18 U.S. Housing Decelerating August 27, 2018
Economic and Market Watch Report
 Economic and Watch Report 3rd Quarter, 2008 *Click on a County to view economic and real estate information at the county and zip code level 20087 The Northern Nevada Regional MLS and NATIONAL ASSOCIATION
Economic and Housing Market OUTLOOK. Lawrence Yun, Ph.D. Chief Economist NATIONAL ASSOCIATION OF REALTORS
 Economic and Housing Market OUTLOOK Lawrence Yun, Ph.D. Chief Economist NATIONAL ASSOCIATION OF REALTORS Presentation at New Canaan Board of REALTORS and Mid-Fairfield County Association of REALTORS January
Residential Real Estate, Demographics, and the Economy
 Residential Real Estate, Demographics, and the Economy Presented to: Regional & Community Bankers Conference Yolanda K. Kodrzycki Senior Economist and Policy Advisor Federal Reserve Bank of Boston October
Announcement July 13, Collateral Valuation Practices and Declining Markets
 Announcement 07-11 July 13, 2007 Amends these Guides: Selling Collateral Valuation Practices and Declining Markets Introduction An accurate value for the property securing a mortgage loan is important
Changing Economic Times. Market Pulse. Dr. Gary Jackson Director, Regional Economic Research Institute Florida Gulf Coast University April 8, 2008
 Changing Economic Times Presented to: Market Pulse Bonita Springs Area Chamber of Commerce Bonita Springs-Estero Association of REALTORS, Inc. Dr. Gary Jackson Director, Regional Economic Research Institute
Economic and Market Watch Report
 Economic and Market Watch Report 1st Quarter, 2005 *Click on a County to view economic and real estate information at the county and zip code level 2005 Greater Las Vegas Association of REALTORS and NATIONAL
Re-benchmarking of Existing Home Sales. December 21, 2011
 Re-benchmarking of Existing Home Sales December 21, 2011 What is Getting Revised? No Revision to Median Home Price No Revision to Months Supply of Inventory Local MLS data converted to months supply Downward
Housing Price Forecasts. Illinois and Chicago PMSA, March 2017
 Housing Price Forecasts Illinois and Chicago PMSA, March 2017 Presented To Illinois Realtors From R E A L Regional Economics Applications Laboratory, Institute of Government and Public Affairs University
2016 MID-YEAR MARKET UPDATE June 23, Breanna Vanstrom, MBA, RCE Chief Executive Officer
 2016 MID-YEAR MARKET UPDATE June 23, 2016 Breanna Vanstrom, MBA, RCE Chief Executive Officer In 2015, Ada County surpassed $2 billion in total dollar volume sold. The first year since 2006. In May 2016,
Metropolitan Area Statistics
 Metropolitan Area Statistics Apartment Completions 1Q 2011 1Q 2012 % Chg Atlanta - - n/a Boston 133 39-71% Chicago - 20 n/a Cleveland - - n/a Columbus - 272 n/a Dallas-Ft. Worth 604 1,059 75% Denver 328
Abilene Area Local Market Report, First Quarter 2017
 Area Local Market Report, First Quarter 217 Today's Market $18, Median Price (Red Line) and One-year Price Growth 2% $16, $14, 15% $12, $1, 1% $8, $6, 5% $4, $2, % $ 28 29 21 211 212 213 214 215 216 217-5%
Greater Lansing Association of REALTORS Regional Economic Update HOUSING MARKET OUTLOOK FOR 2018
 Greater Lansing Association of REALTORS Regional Economic Update HOUSING MARKET OUTLOOK FOR 2018 Paul C. Bishop, PhD, CBE Vice President, Research NATIONAL ASSOCIATION OF REALTORS January 11, 2018 Today
Statement of. Peter A. Tatian Senior Research Associate, Urban Institute
 Statement of Peter A. Tatian Senior Research Associate, Urban Institute Before the Council of the District of Columbia, Committee on Housing and Urban Affairs and Committee on Public Services and Consumer
Houston-Baytown-Sugar Land Area Local Market Report, First Quarter Median Price (Red Line) and One-year Price Growth 2016 Q1. Local Price Trends
 and One-year Price Growth 2016 Q1. Local Price Trends") -Baytown-Sugar Land Area Local Market Report, First Quarter 2016 Today's Market $250,000 Median Price (Red Line) and One-year Price Growth 15% $200,000 10% $150,000 5% $100,000 0% $50,000-5% $0 2007 2008
-Baytown-Sugar Land Area Local Market Report, First Quarter 2016 Today's Market $250,000 Median Price (Red Line) and One-year Price Growth 15% $200,000 10% $150,000 5% $100,000 0% $50,000-5% $0 2007 2008
Housing Price Forecasts. Illinois and Chicago PMSA, March 2019
 Housing Price Forecasts Illinois and Chicago PMSA, March 2019 Presented To Illinois Realtors From R E A L Regional Economics Applications Laboratory, Institute of Government and Public Affairs University
2018 Housing Market Outlook. Central Coast Realty Group Business Symposium February 22, 2018 Oscar Wei Senior Economist
 2018 Housing Market Outlook Central Coast Realty Group Business Symposium February 22, 2018 Oscar Wei Senior Economist Overview Economic Update California Housing Market Outlook Regional Housing Market
REALTOR.COM MARKET OUTLOOK
 REALTOR.COM MARKET OUTLOOK Realtor.com Economics January 2019 2019 Move, Inc. All rights reserved. Do not copy or distribute. AGENDA Economic and housing data and insights from realtor.com National Forecast
2016 ECONOMIC AND HOUSING MARKET FORECAST
 2016 ECONOMIC AND HOUSING MARKET FORECAST April 06, 2016 San Francisco Association of REALTORS Oscar Wei, Senior Economist of C.A.R. OVERVIEW Economic Outlook California Housing Market Outlook Regional
Economic Highlights. Payroll Employment Growth by State 1. Durable Goods 2. The Conference Board Consumer Confidence Index 3
 August 26, 2009 Economic Highlights Southeastern Employment Payroll Employment Growth by State 1 Manufacturing Durable Goods 2 Consumer Spending The Conference Board Consumer Confidence Index 3 Real Estate
TREND Economic and Market Watch Report
 TREND Economic and Watch Report TREND is the Multiple Listing Service (MLS) for more than 32,000 real estate professionals in and around the Philadelphia metropolitan region. TREND s 13-county primary
Market Trends and Outlook
 Residential Remodeling Market Trends and Outlook Kermit Baker Remodeling Futures Conference April 3, 2012 Remodeling Market Overview 1. Home improvement spending totaled an estimated $290 billion last
Atlanta Housing Economic Trends
 Atlanta Housing Economic Trends October 2011 Note: This information is deemed accurate but not guaranteed. It is intended for the personal use of HBA members only. Market Update With Smart Numbers Steve
San Antonio-New Braunfels Area Local Market Report, First Quarter 2017
 -New Braunfels Area Local Market Report, First Quarter 2017 Today's Market $250,000 Median Price (Red Line) and One-year Price Growth 10% 8% $200,000 6% $150,000 4% 2% $100,000 0% -2% $50,000-4% -6% $0
UDIA WA PROPERTY MARKET STATISTICS
 UDIA WA PROPERTY MARKET STATISTICS OCTOBER 217 1 IN THIS ISSUE KEY TRENDS INDUSTRY UPDATE 3 4 ECONOMY RESIDENTIAL LAND DEVELOPMENT RESIDENTIAL PROPERTY SETTLEMENTS RESIDENTIAL PROPERTY MARKET RESIDENTIAL
Multifamily Market Commentary February 2018
 Multifamily Market Commentary February 2018 2018 Multifamily Affordable Market Outlook A Long Way to Go Momentum in the overall multifamily sector will likely slow in 2018 due to elevated levels of new
Released: November 2011
 Released: November 2011 Commentary 2 The Numbers That Drive Real Estate 3 This Month in Washington 8 Topics for Home Buyers, Sellers, and Owners 11 Brought to you by: KW Research Commentary While home
Beaumont-Port Arthur Area Local Market Report, First Quarter 2017
 -Port Arthur Area Local Market Report, First Quarter 2017 Today's Market $180,000 Median Price (Red Line) and One-year Price Growth 20% $160,000 $140,000 $120,000 15% 10% $100,000 5% $80,000 0% $60,000
El Paso Area Local Market Report, First Quarter 2017
 Area Local Market Report, First Quarter 2017 Today's Market $155,000 Median Price (Red Line) and One-year Price Growth 10% $150,000 8% $145,000 $140,000 $135,000 $130,000 $125,000 6% 4% 2% 0% -2% -4% $120,000-6%
Economic and Market Watch Report
 Economic and Market Watch Report 2nd Quarter, 2006 *Click on a County to view economic and real estate information at the county and zip code level 2006 Greater Las Vegas Association of REALTORS and NATIONAL
Multifamily Market Commentary February 2017
 Multifamily Market Commentary February 2017 Affordable Multifamily Outlook Incremental Improvement Expected in 2017 We expect momentum in the overall multifamily sector to slow in 2017 due to elevated
Understanding and Utilizing Today s Real Estate Data
 Understanding and Utilizing Today s Real Estate Data MATT Dollinger Why Matt? KCM Divided into Three Sections Existing Home Sales S&P Case Shiller 10/2013 Pending Home Sales 100 = Historically Healthy
Zillow Group Uncovers
 Zillow Group Uncovers Economic Trends in MF Housing Svenja Gudell, Zillow Chief Economist @SvenjaGudell svenjag@zillow.com June 15-18, 2016 Moscone Convention Center San Francisco Rents continue to grow,
By several measures, homebuilding made a comeback in 2012 (Figure 6). After falling another 8.6 percent in 2011, single-family
. After falling another 8.6 percent in 2011, single-family") 2 Housing Markets With sales picking up, low inventories of both new and existing homes helped to firm prices and spur new single-family construction in 212. Multifamily markets posted another strong year,
2 Housing Markets With sales picking up, low inventories of both new and existing homes helped to firm prices and spur new single-family construction in 212. Multifamily markets posted another strong year,
Looking Ahead to 2019: Crosscurrents in the Housing Market
 Looking Ahead to 2019: Crosscurrents in the Housing Market Gay Cororaton Research Economist, National Association of REALTORS Virginia Peninsula Association of REALTORS, Inc. General Membership Meeting
Atlanta Housing Economic Trends
 Atlanta Housing Economic Trends August 2013 Note: This information is deemed accurate but not guaranteed. It is intended for the personal use of HBA members only. Atlanta Employment Pace of Employment
TREND Economic and Market Watch Report
 TREND Economic and Watch Report TREND is the Multiple Listing Service (MLS) for more than 32,000 real estate professionals in and around the Philadelphia metropolitan region. TREND s 13-county primary
Rental Housing: Poised for a Return to Growth
 Rental Housing: Poised for a Return to Growth Christopher Herbert Remodeling Futures Conference November 9, 21 www.jchs.harvard.edu Summary of Ongoing Joint Center Research on The Rental Housing Market
NATIONAL ASSOCIATION of REALTORS RESEARCH DIVISION. Prepared for Florida REALTORS
 NATIONAL ASSOCIATION of REALTORS RESEARCH DIVISION Prepared for Florida REALTORS NATIONAL ASSOCIATION OF REALTORS RESEARCH DIVISION Page 1 Page 3 Page 4 Page 6 Page 7 Page 8 Page 9 Page 10 Page 11 Page
Economics Group. Special Commentary. February 29, Sales and new home construction have both increased modestly and prices for nondistressed
 February 29, 212 Economics Group Special Commentary Mark Vitner, Senior Economist mark.vitner@wellsfargo.com (74) 383-5635 Anika R. Khan, Economist anika.khan@wellsfargo.com (74) 715-575 Joe Seydl, Economic
Released: May 7, 2010
 Released: May 7, 2010 Commentary 2 The Numbers That Drive Real Estate 3 Recent Government Action 9 Topics for Home Buyers, Sellers, and Owners 11 Brought to you by: KW Research Commentary The economic
2013 CALIFORNIA HOUSING MARKET OUTLOOK. Santa Barbara AOR February 6, Leslie Appleton-Young, C.A.R. Chief Economist
 2013 CALIFORNIA HOUSING MARKET OUTLOOK Santa Barbara AOR February 6, 2013. Leslie Appleton-Young, C.A.R. Chief Economist 2013 New Member Benefit: 12 FREE Hours Online CE Courses C.A.R. s newest member
TREND Economic and Market Watch Report. Index
 TREND Economic and Watch Report TREND is the Multiple Listing Service (MLS) for more than 32,000 real estate professionals in and around the Philadelphia metropolitan region. TREND s 13-county primary
Released: February 8, 2011
 Released: February 8, 2011 Commentary 2 The Numbers That Drive Real Estate 3 Recent Government Action 10 Topics for Home Buyers, Sellers, and Owners 13 Brought to you by: KW Research Commentary Gradual
Provided by Keller Williams Realty Professional Partners Statistics from September 2010 MLS
 Monthly Market Watch for Maricopa County An overview of what is happening in the Maricopa County real estate market (using September 2010 statistics) Report overview: This report includes MLS data for
The State of the Nation s Housing 2007: A Sneak Peek
 The State of the Nation s Housing 2007: A Sneak Peek Eric Belsky Remodeling Futures Conference April 10, 2007 Do Not Distribute Embargoed Until June 11, 2007 www.jchs.harvard.edu The Homebuilding Correction
Economic Highlights. Retail Sales Components 1. University of Michigan Consumer Sentiment Index 2. Industrial Production and Capacity Utilization 3
 November 17, 2010 Economic Highlights Consumer Spending Retail Sales Components 1 University of Michigan Consumer Sentiment Index 2 Manufacturing Industrial Production and Capacity Utilization 3 Real Estate
Analyst s Handbook: Real Estate
 Analyst s Handbook: Real Estate December 22, 217 Dr. Edward Yardeni 16-972-7683 eyardeni@ Mali Quintana 4-664-1333 aquintana@ Please visit our sites at www. blog. thinking outside the box Table Of Contents
November 1, 2016 Sacramento AOR Membership Meeting Oscar Wei, Senior Economist of C.A.R.
 November 1, 2016 Sacramento AOR Membership Meeting Oscar Wei, Senior Economist of C.A.R. Overview Economic Outlook California Housing Market Outlook Regional Housing Market Outlook 2017 Forecast Economic
Atlanta Housing Economic Trends
 Atlanta Housing Economic Trends February 2015 Note: This information is deemed accurate but not guaranteed. It is intended for the personal use of HBA members only. Atlanta Employment Pace of Employment
STATPAK MARKET IN A MINUTE A SUMMARY OF MARKET CONDITIONS FOR AUGUST McEnearney.com CONTRACTS URGENCY INDEX INVENTORY INTEREST RATES
 STATPAK WASHINGTON, DC SEPTEMBER 2017 McEnearney.com MARKET IN A MINUTE A SUMMARY OF MARKET CONDITIONS FOR AUGUST 2017 Contract activity in August 2017 was up 4.9% from August 2016, and there were increases
Metropolitan Area Statistics (1Q 2013)
") Metropolitan Area Statistics (1Q 2013) Apartment Completions 1Q 2012 1Q 2013 % Chg Atlanta 487 1,460 200% Boston 360 373 4% Chicago 611 92-85% Cleveland 7 54 671 Columbus - 459 n/a Dallas-Ft. Worth 1,327
Metropolitan Area Statistics (1Q 2013) Apartment Completions 1Q 2012 1Q 2013 % Chg Atlanta 487 1,460 200% Boston 360 373 4% Chicago 611 92-85% Cleveland 7 54 671 Columbus - 459 n/a Dallas-Ft. Worth 1,327
CALIFORNIA ECONOMIC & MARKET OUTLOOK. October 29,2014 SILVAR Leslie Appleton-Young, Chief Economist
 2014-2015 CALIFORNIA ECONOMIC & MARKET OUTLOOK October 29,2014 SILVAR Leslie Appleton-Young, Chief Economist OVERVIEW Economic Outlook California Housing Market Outlook Housing Affordability Regional Market
Home Price Monitor August 2012 National Association of REALTORS
 Home Price Monitor August 2012 National Association of REALTORS Research Division Cutting Through the Noise: Various Home Price Measure Highlights Case Shiller data showed the first annual increase in
State of the Nation s Housing 2011: A Preview
 State of the Nation s Housing 2011: A Preview Christopher Herbert Remodeling Futures Conference April 5, 2011 www.jchs.harvard.edu No Signs of a Recovery Yet % Change % Change Description: 2008 2009 2010
Atlanta Housing Economic Trends
 Atlanta Housing Economic Trends September 2011 Note: This information is deemed accurate but not guaranteed. It is intended for the personal use of HBA members only. Market Update With Smart Numbers Steve
Economic Outlook in Uncertain Times
 Economic Outlook in Uncertain Times Lawrence Yun, Ph.D. Chief Economist NATIONAL ASSOCIATION OF REALTORS Presentation to Silicon Valley Association of REALTORS October 11, 2010 Federal Reserve FOMC Ben
Housing Price Forecasts. Illinois and Chicago PMSA, April 2013
 Housing Price Forecasts Illinois and Chicago PMSA, April 2013 Presented To Illinois Association of Realtors From R E A L Regional Economics Applications Laboratory, Institute of Government and Public Affairs
RESIDENTIAL MARKET ANALYSIS
 RESIDENTIAL MARKET ANALYSIS EVAN ABRAMOWITZ RMLS Student Fellow Master of Real Estate Development Graduate Student September existing-home sales declined modestly, but inventory continued to tighten and
Housing Price Forecasts. Illinois and Chicago PMSA, August 2016
 Housing Price Forecasts Illinois and Chicago PMSA, August 2016 Presented To Illinois Association of Realtors From R E A L Regional Economics Applications Laboratory, Institute of Government and Public
National Housing Trends
 National Housing Trends 34% America s Choice of Best Long Term Investment 26% 17% 15% 6% Real Estate Stocks / Mutual Funds Gold Savings Accounts / CDs Bonds Gallup 2018 Housing Affordability 197 Index
Aug. Aug 2018 ust 2018
 August 18 MONTHLY STATISTICS PACKAGE City of Calgary Unemployment rate slows housing market recovery 18 City of Calgary, September, 18 Easing sales, gains in new listings and elevated inventory levels