Understanding and Utilizing Today s Real Estate Data
|
|
|
- Octavia Fisher
- 5 years ago
- Views:
Transcription
1 Understanding and Utilizing Today s Real Estate Data

2 MATT Dollinger Why Matt?

3


4 KCM Divided into Three Sections
5
6 Existing Home Sales S&P Case Shiller 10/2013

7 Pending Home Sales 100 = Historically Healthy Level NAR 10/2013
 FHFA 2013 2Q")
8 Regional Home Prices (year-over-year) FHFA Q HPI Report
 FHFA 2013")
9 State Home Prices (year-over-year) FHFA Q HPI Report
10 The emerging slowdown in home purchases appears to be largely seasonal. Thomas Popik Research Director for the HousingPulse survey

11 Months Inventory of Homes for Sale 5-6 Months = Normal Market Inventory NAR 10/2013
12 Year-over-Year Inventory Levels NAR 10/2013

13 Year-over-Year Change in Prices S&P Case Shiller 10/2013
14 Asking home prices give us the first look at where home sale prices are headed, and they point to a slowdown. After rising rapidly in the first half of 2013, asking Affordability prices is still in good two compared thirds to of any the time largest over the metros last 50 years. are cooling. In fact, asking prices are falling not just rising more slowly in 11 of the 100 largest metros, the most markets to see prices slip in six months. Jed Kolko Trulia s Chief Economist
15 The rapid price gains of the last year cannot be sustained and we expect the pace to decline substantially A Affordability is still good compared slower to pace any time is over a the positive last 50 years. for housing demand and will help to keep affordability from further eroding. Moody s Analytics
16 If home values continued to rise as they have, relatively unchecked, we would almost certainly be headed into another bubble cycle, and nobody Affordability wants is still good that This compared to any moderation time over the last 50 should years. help consumers feel more at ease in their decisions to buy and sell, and will help keep the market balanced. Stan Humphries Chief Economist for Zillow
17 "I define a bubble as a time when people have extravagant expectations, and the expectations are driving home price increases. We don't have Affordability the is still mindset good compared of earlier to any time this over the century last 50 years. Affordability is still good compared to any time over the last 50 years." Robert Shiller Nobel Prize Winning Economist

18 ta per ˈtāpər/ Verb to diminish or reduce

19 Rate Movement 30 Year Fixed Rate Fed announces not to taper bond purchases Decrease in mortgage rates since Fed announcement Freddie Mac 10/2013


20 The MBA believes rates will keep pushing upward, going well above 5%. HousingWire 10/2013

21 Mortgage Rate Projections Analyst Projected Rate 4Q 2014 Fannie Mae 5.0% National Assoc of Realtors 5.4% Freddie Mac 5.1% Mortgage Bankers Assoc 5.0%


22 RATE Buyer s Purchasing Power 6.00 $ 2,158 $ 2,218 $ 2,278 $ 2,338 $ 2, $ 2,100 $ 2,160 $ 2,218 $ 2,276 $ 2, $ 2,044 $ 2,100 $ 2,158 $ 2,214 $ 2, $ 1,988 $ 2,044 $ 2,098 $ 2,154 $ 2, $ 1,932 $ 1,986 $ 2,040 $ 2,094 $ 2, $ 1,878 $ 1,930 $ 1,982 $ 2,034 $ 2, $ 1,824 $ 1,874 $ 1,926 $ 1,976 $ 2,026 $ 360,000 $ 370,000 $ 380,000 $ 390,000 $ 400,000-10% -7.5% -5% -2.5% Principal and Interest Payments rounded to the nearest dollar amount.
23

24 30 Year Fixed Rate Mortgage History January 2012 November 2013 Federal Reserve 11/2013


25 RETURN ON INVESTMENT January 2000 November 2013 MSN Money.com, Case Shiller

26 Home Price Expectation Survey A nationwide panel of over one hundred economists, real estate experts and investment & market strategists.

27 Average Annual Appreciation Home Price Expectation Survey Q


28 Home Price Expectation Survey Projected Percentage Increase Home Price Expectation Survey Q

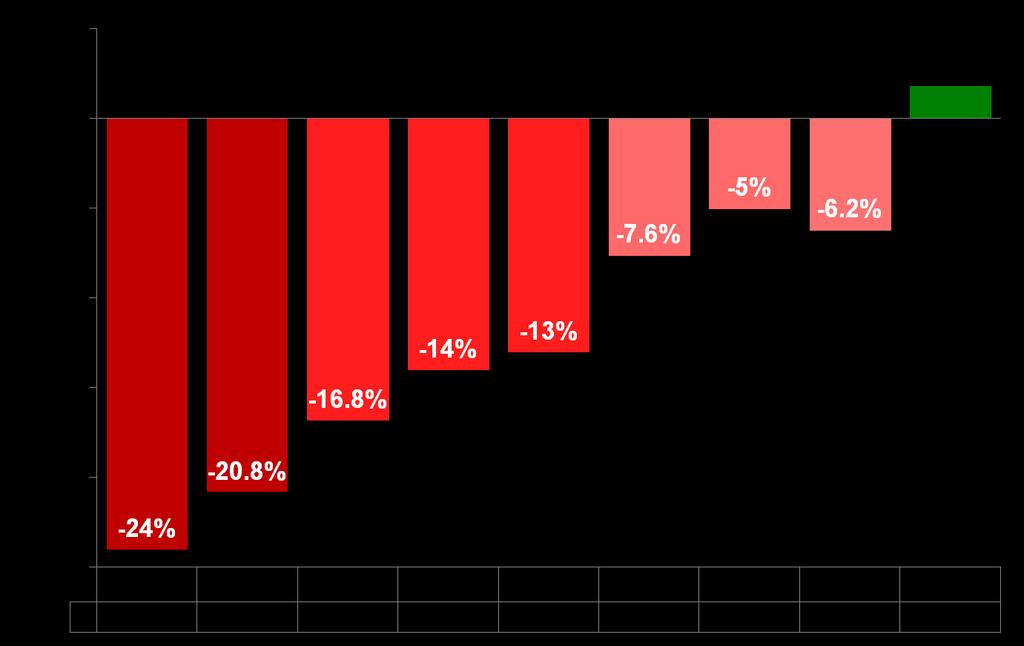
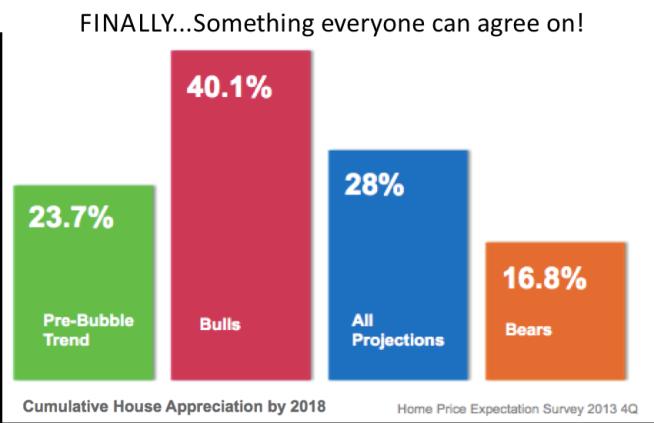
29 Cumulative Appreciation by 2018 Home Price Expectation Survey Q


30 Thinking about moving up to the home of your dreams?
31 The Move-Up Seller Comparison Next Year Current Home Move-up Home Current Price $240,000 $360,000 Future Price (+5%) $252,000 $378,000 Future Gain $12,000 $18,000 Total Gain $6,000


32 The Move-Up Seller Price Rate P&I Today 360, , End of Year 378, Monthly Savings $205.12

33

34
35 You can have brilliant ideas, but if you can't get them across, your Affordability is still good compared to any time over the last 50 years. ideas won't get you anywhere. Lee Iacocca


36 7.9% Average Annual APPRECIATION 3.6% 5.1% 4.2% Pre-BUBBLE BUBBLE RECOVERY TO DATE BUST -5.9% PROJECTED NOW to 2018 Home Price Expectation Survey Q

37 PROJECTED Percentage Appreciation Home Price Expectation Survey Q

38 Cumulative House Appreciation by % 23.7% 28% 16.8% Pre-Bubble Trend Bulls All Projections Bears Home Price Expectation Survey Q


39 Typical Sold Price* FSBO vs. Agent $215K $175K By FSBO By AGENT *The typical price is actually the average price in the survey. However, studies have shown that people are more likely to FSBO in markets with lower price points.

40


41 In my opinion, Keeping Current Matters is THE easiest, most reliable Affordability is still good compared to any time over the last 50 years. and comprehensive source for national real estate data today.


42

43

44


45

46
47 Understanding and Utilizing Today s Real Estate Data
By attending this webinar, you will be able to:
 By attending this webinar, you will be able to: 1.) Simply and effectively demonstrate that home prices are not at balloon levels 2.) Easily explain that housing affordability is at a far better level
Jim & Jim McKenna LBA & LSA TheJims.com
 Jim & Jim McKenna LBA & LSA 631-974-9151 TheJims.com Return on Investment January 2000 March 2013 MSN Money.com, Case Shiller Pending Home Sales 110 105 100 95 90 Jan Feb Mar Apr May Jun Jul Aug Sep Oct
Monthly Indicators + 5.7% % % Market Overview New Listings Pending Sales. Closed Sales. Days on Market Until Sale. Median Sales Price
 Monthly Indicators 2018 The three most prominent national market trends for residential real estate are the ongoing lack of abundant inventory, the steadily upward movement of home prices and year-over-year
THINGS TO CONSIDER WHEN BUYING A HOME
 THINGS TO CONSIDER WHEN BUYING A HOME SPRING 2014 edition TABLE OF CONTENTS 1 HARVARD: 5 FINANCIAL REASONS TO BUY A HOME 3 HOMEOWNERSHIP S IMPACT ON NET WORTH 4 EXPERTS PREDICT INTEREST RATES WILL INCREASE
Housing and Economy Market Trends
 Housing and Economy Market Trends Mainstreet Organization Prices of single-family, detached homes in suburban Chicago increased 12.1 percent in May 2014 compared with the same period a year ago. Overall,
HOME PRICES OVER THE LAST YEAR
 HOME PRICES OVER THE LAST YEAR Every quarter, the Federal Housing Finance Agency (FHFA) reports on the year-over-year changes in home prices. Below, you will see that prices are up year-over-year in every
Housing Price Forecasts. Illinois and Chicago PMSA, May 2018
 Housing Price Forecasts Illinois and Chicago PMSA, May 2018 Presented To Illinois Realtors From R E A L Regional Economics Applications Laboratory, Institute of Government and Public Affairs University
National Housing Trends
 National Housing Trends 34% America s Choice of Best Long Term Investment 26% 17% 15% 6% Real Estate Stocks / Mutual Funds Gold Savings Accounts / CDs Bonds Gallup 2018 Total Existing Home Sales in thousands
With last month's gain, sales are now up 4.5% from May 2015 and are at their highest annual pace since February 2007.
 JULY 2016 With last month's gain, sales are now up 4.5% from May 2015 and are at their highest annual pace since February 2007. - Lawrence Yun NAR s Chief Economist Now in its seventh year, the US economic
Monthly Indicators + 7.3% + 6.6% + 8.3% Single-Family Market Overview Condo Market Overview New Listings Pending Sales.
 Monthly Indicators 2018 The three most prominent national market trends for residential real estate are the ongoing lack of abundant inventory, the steadily upward movement of home prices and year-over-year
Housing Price Forecasts. Illinois and Chicago PMSA, January 2018
 Housing Price Forecasts Illinois and Chicago PMSA, January 2018 Presented To Illinois Realtors From R E A L Regional Economics Applications Laboratory, Institute of Government and Public Affairs University
Housing and Mortgage Market Update
 Housing and Mortgage Market Update Views from the Top Frank E. Nothaft Vice President and Chief Economist January 8, 2015 Summary: Housing & Mortgage Market Outlook for 2015 Interest rates expected to
Housing Supply Overview
 Housing Supply Overview A RESEARCH TOOL PROVIDED BY SOUTH CAROLINA REALTORS September 2018 According to a recent study by Fannie Mae, 24 percent of Americans feel that now is a good time to buy a house.
Weekly Market Activity Report A RESEARCH TOOL FROM MINNEAPOLIS AREA REALTORS
 Weekly Market Report A RESEARCH TOOL FROM MINNEAPOLIS AREA REALTORS For Week Ending November 3, 2018 Publish Date: November 12, 2018 All comparisons are to 2017 According to Freddie Mac, the 30-year fixed
MARKET OUTLOOK FOR SAN MATEO
 MARKET OUTLOOK FOR SAN MATEO Jonathan Smoke Chief Economist August 2, 2016 NATIONAL TRENDS 2 JOB CREATION REBOUNDED IN JUNE 229,000 jobs created by month in 2015; 172,000 average this year Employment and
Residential Real Estate Market Overview: September 2017 Data
 Residential Real Estate Market Overview: September 2017 Data 2017 Mark A. Melikian Chief Valuation Officer mark.melikian@summitvaluations.com 2800 River Road, Suite 460 The following is a market data summary
Monthly Indicators. September Monthly Snapshot + 2.0% + 7.4% %
 Monthly Indicators For residential real estate activity by members of the Florida REALTORS 2012 Most housing metrics should follow their usual, autumnal movements higher inventory and days on market, fewer
Housing Price Forecasts. Illinois and Chicago PMSA, December 2015
 Housing Price Forecasts Illinois and Chicago PMSA, December 2015 Presented To Illinois Association of Realtors From R E A L Regional Economics Applications Laboratory, Institute of Government and Public
Housing Price Forecasts. Illinois and Chicago PMSA, August 2017
 Housing Price Forecasts Illinois and Chicago PMSA, August 2017 Presented To Illinois Realtors From R E A L Regional Economics Applications Laboratory, Institute of Government and Public Affairs University
Housing Price Forecasts. Illinois and Chicago PMSA, October 2014
 Housing Price Forecasts Illinois and Chicago PMSA, October 2014 Presented To Illinois Association of Realtors From R E A L Regional Economics Applications Laboratory, Institute of Government and Public
Economic Highlights. Payroll Employment Growth by State 1. Durable Goods 2. The Conference Board Consumer Confidence Index 3
 August 26, 2009 Economic Highlights Southeastern Employment Payroll Employment Growth by State 1 Manufacturing Durable Goods 2 Consumer Spending The Conference Board Consumer Confidence Index 3 Real Estate
National Housing Trends
 National Housing Trends 34% America s Choice of Best Long Term Investment 26% 17% 15% 6% Real Estate Stocks / Mutual Funds Gold Savings Accounts / CDs Bonds Gallup 2018 Housing Affordability 197 Index
1200 Premier Drive, Suite 140 Chattanooga, TN Each office is independently owned and operated.
 THIS MONTH IN REAL ESTATE K im aulston R REALTOR 1200 Premier Drive, Suite 140 Chattanooga, TN 37421 Each office is independently owned and operated. Cell: 423-316-4022 Office: 423-664-1600 Email: kcraulston@gmail.com
Zillow Group Uncovers
 Zillow Group Uncovers Economic Trends in MF Housing Svenja Gudell, Zillow Chief Economist @SvenjaGudell svenjag@zillow.com June 15-18, 2016 Moscone Convention Center San Francisco Rents continue to grow,
Metropolitan Indianapolis Board of REALTORS. Broker/Owner Meeting March 14, 2007
 Metropolitan Indianapolis Board of REALTORS Broker/Owner Meeting March 14, 2007 Tom Renkert Information Services Director MIBOR PropertyLinx 2 Implementation Time Line February 1-28 March 1 June 30 July
NAR Realtors Conference & Expo Saturday November 4, :30am
 House Prices in Local Real Estate Markets: New Trends, Free Data, and Research Nuggets William Doerner Federal Housing Finance Agency (FHFA) based on a series of co-authored papers with Alexander Bogin
Housing Supply Overview
 Housing Supply Overview A RESEARCH TOOL PROVIDED BY SOUTH CAROLINA REALTORS April 2016 We should see a healthy number of sales in most categories for the next few months, yet there is still some lingering
Housing Price Forecasts. Illinois and Chicago PMSA, March 2017
 Housing Price Forecasts Illinois and Chicago PMSA, March 2017 Presented To Illinois Realtors From R E A L Regional Economics Applications Laboratory, Institute of Government and Public Affairs University
Housing Price Forecasts. Illinois and Chicago PMSA, March 2018
 Housing Price Forecasts Illinois and Chicago PMSA, March 2018 Presented To Illinois Realtors From R E A L Regional Economics Applications Laboratory, Institute of Government and Public Affairs University
THE OUTLOOK FOR HOUSING IN ILLINOIS
 THE OUTLOOK FOR HOUSING IN ILLINOIS Jonathan Smoke Chief Economist January 25, 2017 NATIONAL TRENDS 2 2000.01 2000.05 2000.09 2001.01 2001.05 2001.09 2002.01 2002.05 2002.09 2003.01 2003.05 2003.09 2004.01
Housing Market Cycles
 MEGA AGENT Market Update Gary Keller and Jay Papasan 2 The U.S. Housing Market Keller Williams Realty, Inc. Housing Market Cycles 4 The U.S. Housing Market Housing Market Cycles 5 The U.S. Housing Market
2017 MORTGAGE MARKET OUTLOOK: EXECUTIVE HOUSING REPORT JANUARY 2017
 2017 MORTGAGE MARKET OUTLOOK: EXECUTIVE HOUSING REPORT JANUARY 2017 1 2017 FORECAST OVERVIEW For the 2017 housing market, the outlook is generally positive. The long recovery from the elevated delinquency
The State of the Nation s Housing
 The State of the Nation s Housing Eric S. Belsky Remodeling Futures Conference April 13, 21 www.jchs.harvard.edu Existing Home Sales Improved then Retracted, While New Home Sales Are Still in the Basement
2013 Housing Market Forecast. SILVAR: Los Gatos/Saratoga District October 10, 2012 Leslie Appleton-Young, Vice President & Chief Economist
 2013 Housing Market Forecast SILVAR: Los Gatos/Saratoga District October 10, 2012 Leslie Appleton-Young, Vice President & Chief Economist What we saw from the roof.. C.A.R. NAR THE ECONOMY Recent Housing
Housing Price Forecasts. Illinois and Chicago PMSA, April 2018
 Housing Price Forecasts Illinois and Chicago PMSA, April 2018 Presented To Illinois Realtors From R E A L Regional Economics Applications Laboratory, Institute of Government and Public Affairs University
Released: June Commentary 2. The Numbers That Drive Real Estate 3. Recent Government Action 9. Topics for Home Buyers, Sellers, and Owners 11
 Released: June 2011 Commentary 2 The Numbers That Drive Real Estate 3 Recent Government Action 9 Topics for Home Buyers, Sellers, and Owners 11 Brought to you by: KW Research Commentary The U.S. housing
HOUSING MARKETS. Strength in Early 2005 Pushed Most National Housing Indicators into Record Territory
 HOUSING MARKETS Despite another record-setting performance, housing markets showed clear signs of cooling late in 2005. As mortgage interest rates moved up and house prices soared, home sales turned down
THINGS TO CONSIDER WHEN SELLING YOUR HOUSE FALL 2017 EDITION
 THINGS TO CONSIDER WHEN SELLING YOUR HOUSE FALL 2017 EDITION 3 TABLE OF CONTENTS 5 Reasons To Sell This Fall WHAT'S HAPPENING IN THE HOUSING MARKET? 5 Buyer Demand Continues To Outpace Inventory Of Homes
The Greater Reno-Tahoe Real Estate Report
 February, 2018February, 2018 February, 2018 Issue The Greater Reno-Tahoe Real Estate Report Housing Market Trends for: Reno, Sparks, Carson City, Carson Valley, Lake Tahoe, Dayton, and Fernley A FREE monthly
Owner spending on improvements to existing homes also rose over the past year. Benefiting from strengthening house sales, CONSTRUCTION RECOVERY
 2 Housing Markets After another year of healthy growth in 213, the housing market paused in the first quarter of 214. The renewed weakness in residential construction, sales, and prices raised fears that
Monthly Indicators. Activity Snapshot % + 8.0% % Activity Overview New Listings Pending Sales. Closed Sales. Days on Market Until Sale
 Monthly Indicators 2018 Many sellers and builders are in a good position for financial gains, as the economy continues to favor putting existing homes on the market and building new homes for sale. While
Quick Facts. For Week Ending July 14, 2018 Publish Date: July 23, 2018 All comparisons are to % - 2.7% - 14.
 Weekly Market Report A RESEARCH TOOL FROM THE SAINT PAUL AREA ASSOCIATION OF REALTORS. BROUGHT TO YOU BY THE UNIQUE DATA-SHARING TRADITIONS OF THE REALTOR COMMUNITY For Week Ending July 14, 2018 Publish
Housing Price Forecasts. Illinois and Chicago PMSA, August 2016
 Housing Price Forecasts Illinois and Chicago PMSA, August 2016 Presented To Illinois Association of Realtors From R E A L Regional Economics Applications Laboratory, Institute of Government and Public
Residential Real Estate Market Overview: April 2017 Data
 Residential Real Estate Market Overview: April 2017 Data 2017 Mark A. Melikian Chief Valuation Officer mark.melikian@summitvaluations.com 2800 River Road, Suite 460 The following is a market data summary
Nothing Draws a Crowd Like a Crowd: The Outlook for Home Sales
 APRIL 2018 Nothing Draws a Crowd Like a Crowd: The Outlook for Home Sales The U.S. economy posted strong growth with fourth quarter 2017 Real Gross Domestic Product (real GDP) growth revised upwards to
Housing Price Forecasts. Illinois and Chicago PMSA, March 2016
 Housing Price Forecasts Illinois and Chicago PMSA, March 2016 Presented To Illinois Association of Realtors From R E A L Regional Economics Applications Laboratory, Institute of Government and Public Affairs
Monthly Indicators - 8.1% + 3.6% - 0.6% Activity Overview New Listings Pending Sales. Closed Sales. Days on Market Until Sale. Median Sales Price
 Monthly Indicators 2019 In addition to ongoing housing price increases and affordability concerns in the state of New York, the first quarter of 2019 saw a fair share of adverse weather as well. Sales
Quick Facts. For Week Ending October 27, 2018 Publish Date: November 5, 2018 All comparisons are to % - 9.1% - 1.
 Weekly Market Report A RESEARCH TOOL FROM THE SAINT PAUL AREA ASSOCIATION OF REALTORS. BROUGHT TO YOU BY THE UNIQUE DATA-SHARING TRADITIONS OF THE REALTOR COMMUNITY For Week Ending October 27, 2018 Publish
Denver Realtor Reviews: Denver Real Estate Market Statistics August 2016
 Denver Realtor Reviews: Denver Real Estate Market Statistics August 2016 The average price for a home in Denver was $400,524 at the end of August 2016. The median price for a home in Denver was $350,000
Monthly Indicators. August Quick Facts + 7.0% + 7.3% %
 Monthly Indicators 2018 Indiana REALTORS have closed the books on, releasing their summary of existing-home sales from last month. All metrics are up on a statewide basis except inventory, which is certainly
Weekly Market Activity Report
 X0A0T Weekly Market Report A RESEARCH TOOL FROM THE MINNEAPOLIS AREA ASSOCIATION OF REALTORS BROUGHT TO YOU BY THE UNIQUE DATA-SHARING TRADITIONS OF THE REALTOR COMMUNITY For Week Ending July 14, 2018
Monthly Indicators % % %
 ly Indicators A RESEARCH TOOL PROVIDED BY THE HILTON HEAD AREA ASSOCIATION OF REALTORS 2013 Quick Facts The S&P/Case-Shiller Home Price Index recently showed that home prices in 20 major metropolitan areas
ASSOCIATION OF REGINA REALTORS INC.
 ASSOCIATION OF REGINA REALTORS INC. 1854 McIntyre Street Regina, Sask. S4P P9 Ph: 791-7 Fax: 781-794 www.reginarealtors.com For immediate release November 5, OCTOBER RESIDENTIAL SALES YIELD MIXED RESULTS
Monthly Indicators - 6.4% % + 5.2%
 ly Indicators A RESEARCH TOOL PROVIDED BY THE GREENWOOD ASSOCIATION OF REALTORS 2013 Quick Facts The S&P/Case-Shiller Home Price Index recently showed that home prices in 20 major metropolitan areas had
2019 Housing Market Forecast. Palos Verdes Peninsula AOR January 8, 2019 Jordan G. Levine Senior Economist
 2019 Housing Market Forecast Palos Verdes Peninsula AOR January 8, 2019 Jordan G. Levine Senior Economist Overview Good News: Economic fundamentals solid Homeownership still the dream Rates might not go
Monthly Indicators % % - 1.1%
 ly Indicators A RESEARCH TOOL PROVIDED BY NORTH TEXAS REAL ESTATE INFORMATION SYSTEMS, INC. 2012 Quick Facts Most housing metrics should follow their usual, autumnal movements higher inventory and days
Monthly Indicators % + 4.4% %
 ly Indicators A RESEARCH TOOL PROVIDED BY THE CHARLOTTE REGIONAL REALTOR ASSOCIATION FOR MORE INFORMATION CONTACT A REALTOR 2013 The S&P/Case-Shiller Home Price Index recently showed that home prices in
Single Family Sales Maine: Units
 Maine Home Connection 19 Commercial St Portland, Maine 04101 MaineHomeConnection.com Office: (207) 517-3100 Email: Info@MaineHomeConnection.com For the fourth consecutive year, Maine home sales set a new
Released: May 7, 2010
 Released: May 7, 2010 Commentary 2 The Numbers That Drive Real Estate 3 Recent Government Action 9 Topics for Home Buyers, Sellers, and Owners 11 Brought to you by: KW Research Commentary The economic
Housing Price Forecasts. Illinois and Chicago PMSA, July 2016
 Housing Price Forecasts Illinois and Chicago PMSA, July 2016 Presented To Illinois Association of Realtors From R E A L Regional Economics Applications Laboratory, Institute of Government and Public Affairs
Housing Market Update
 Housing Market Update September 2017 EXECUTIVE SUMMARY TIGHT HOUSING MARKET CONTINUES, REFLECTS LOW INVENTORY AND HIGHER PRICES Dean J. Christon, Executive Director September 2017 The trend continues in
Housing Supply Overview
 Housing Supply Overview A RESEARCH TOOL PROVIDED BY SOUTH CAROLINA REALTORS May 2016 Sellers are getting more of their asking price, meaning higher sales prices in most categories. The overall inventory
Quick Facts. For Week Ending August 13, 2016 Publish Date: August 22, 2016 All comparisons are to % - 2.8% - 17.
 Weekly Market Report A RESEARCH TOOL FROM THE SAINT PAUL AREA ASSOCIATION OF REALTORS. BROUGHT TO YOU BY THE UNIQUE DATA-SHARING TRADITIONS OF THE REALTOR COMMUNITY For Week Ending August 13, 2016 Publish
Monthly Indicators + 5.8% 0.0% % 2 New Listings. 3 Pending Sales. 4 5 Days on Market Until Sale. 6 7 Average Sales Price
 Monthly Indicators 2013 As potentially the brightest sun in the current economic recovery, housing activity has followed the mercury higher this summer. Interest rates and new construction activity have
FOR IMMEDIATE RELEASE Contact: Bobette Banks Director of Communications Greater Capital Area Association of REALTORS
 FOR IMMEDIATE RELEASE Contact: Bobette Banks 301-590-8764 Director of Communications Greater Capital Area Association of REALTORS bbanks@gcaar.com April 2016 Washington, DC Market Trends Report Sales and
Housing Price Forecasts. Illinois and Chicago PMSA, January 2019
 Housing Price Forecasts Illinois and Chicago PMSA, January 2019 Presented To Illinois Realtors From R E A L Regional Economics Applications Laboratory, Institute of Government and Public Affairs University
An Introduction to RPX INTRODUCTION
 An Introduction to RPX INTRODUCTION Radar Logic is a real estate information company based in New York. We convert public residential closing data into information about the state and prospects for the
THINGS TO CONSIDER WHEN SELLING YOUR HOUSE SPRING 2017 EDITION
 THINGS TO CONSIDER WHEN SELLING YOUR HOUSE SPRING 2017 EDITION TABLE OF CONTENTS 3 5 REASONS TO SELL THIS SPRING WHAT S HAPPENING IN THE HOUSING MARKET? 5 LACK OF LISTINGS SLOWING DOWN THE HOUSING MARKET
2016 MID-YEAR MARKET UPDATE June 23, Breanna Vanstrom, MBA, RCE Chief Executive Officer
 2016 MID-YEAR MARKET UPDATE June 23, 2016 Breanna Vanstrom, MBA, RCE Chief Executive Officer In 2015, Ada County surpassed $2 billion in total dollar volume sold. The first year since 2006. In May 2016,
Housing Bulletin Monthly Report
 August 21 Housing Bulletin Monthly Report 1 C a n a da s P r e li m i n a ry H o u s i n g S ta r t s s l i p i n J u ly Preliminary Housing St arts in Albert a* and Canada* July 28 to July 21 25, Canada
DATA FOR NOVEMBER Published December 20, Sales are down -9.3% month-overmonth. comparison is down -7.9%. ARMLS STAT NOVEMBER 2018
 Permission is granted only to ARMLS Subscribers for reproduction with attribution on to ARMLS COPYRIGHT 2018. For questions regarding this publication contact Brand@ARMLS.com. DATA FOR NOVEMBER 2018 -
Housing Supply Overview
 Housing Supply Overview A RESEARCH TOOL PROVIDED BY SOUTH CAROLINA REALTORS October 2018 Although every community is different, a general analysis of all housing markets across the country reveals that
End in sight for housing troubles?
 End in sight for housing troubles? D. L. Chertok September 19, 2011 Abstract A historical relationship between home prices and family income is examined based on more than 40 s of data. A new home affordability
Released: June 7, 2010
 Released: June 7, 2010 Commentary 2 The Numbers That Drive Real Estate 3 Recent Government Action 9 Topics for Home Buyers, Sellers, and Owners 11 Brought to you by: KW Research Commentary The housing
Summary Statistics. Closed Sales. Paid in Cash. Median Sale Price. Average Sale Price. Dollar Volume. Median Time to Sale.
 ly Market Detail - December 16 Summary Statistics December 16 December 1 Paid in Cash 1.% N/A $6, $67, -3.7% Average Sale Price Dollar Volume $18,1 $67, 89.8% $6, $13, 37.% Median Percent of Original List
Summary Statistics. Closed Sales. Paid in Cash. Median Sale Price. Average Sale Price. Dollar Volume. Median Time to Sale.
 Summary Statistics July 216 July 215 Paid in Cash 24,83 26,165-8.% 6,48 8,533-24.9% $223,238 $199,999 11.6% Average Sale Price Dollar Volume $299,292 $277,17 8.% $7.2 Billion $7.3 Billion -.6% Median Percent
Summary Statistics. Closed Sales. Paid in Cash. Median Sale Price. Average Sale Price. Dollar Volume. Median Time to Sale.
 ly Market Detail - January 217 Summary Statistics January 217 January 216 Paid in Cash 7,29 6,791 6.2% 4,298 4,28 2.1% $161, $151, 6.6% Average Sale Price Dollar Volume $244,52 $235,221 4.% $1.8 Billion
Summary Statistics. Closed Sales. Paid in Cash. Median Sale Price. Average Sale Price. Dollar Volume. Median Time to Sale.
 Summary Statistics November 216 November 215 Paid in Cash 19,763 17,523 12.8% 5,827 6,65-11.8% $22, $199,99 1.% Average Sale Price Dollar Volume $29,49 $273,155 6.2% $5.7 Billion $4.8 Billion 19.8% Median
TEXAS HOUSING INSIGHT
 TEXAS HOUSING INSIGHT JAMES P. GAINES CHIEF ECONOMIST WESLEY MILLER RESEARCH ASSOCIATE PAIGE WOODSON RESEARCH INTERN LUIS B. TORRES RESEARCH ECONOMIST 2 1 2 0 REPORTING AUGUST 2018 DATA TECHNICAL REPORT
The Canadian Real Estate Association News Release
 The Canadian Real Estate Association News Release Canadian home sales push higher in February Ottawa, ON, March 15, 2016 According to statistics 1 released today by The Canadian Real Estate Association
THINGS TO CONSIDER WHEN SELLING YOUR HOUSE
 THINGS TO CONSIDER WHEN SELLING YOUR HOUSE SPRING 2017 EDITION TABLE OF CONTENTS 3 5 REASONS TO SELL THIS SPRING WHAT S HAPPENING IN THE HOUSING MARKET? 5 LACK OF LISTINGS SLOWING DOWN THE HOUSING MARKET
Summary Statistics. Closed Sales. Paid in Cash. Median Sale Price. Average Sale Price. Dollar Volume. Median Time to Sale.
 ly Market Detail - September 217 Summary Statistics September 217 September 216 Paid in Cash 18,3 22,653-2.4% 4,698 6,344-25.9% $239,9 $223, 7.6% Average Sale Price Dollar Volume $36,77 $289,781 5.9% $5.5
Summary Statistics. Closed Sales. Paid in Cash. Median Sale Price. Average Sale Price. Dollar Volume. Median Time to Sale.
 ly Market Detail - March 217 Summary Statistics March 217 March 216 Paid in Cash 25,921 23,714 9.3% 7,567 7,594 -.4% $231,9 $29,969 1.4% Average Sale Price Dollar Volume $318,115 $285,868 11.3% $8.2 Billion
Summary Statistics. Closed Sales. Paid in Cash. Median Sale Price. Average Sale Price. Dollar Volume. Median Time to Sale.
 Summary Statistics January 219 January 218 Paid in Cash 15,526 16,561-6.2% 4,556 5,34-9.5% $249,9 $24, 4.1% Average Sale Price Dollar Volume $34,241 $334,381 1.8% $5.3 Billion $5.5 Billion -4.6% Median
Summary Statistics. Closed Sales. Paid in Cash. Median Sale Price. Average Sale Price. Dollar Volume. Median Time to Sale.
 ly Market Detail - January 218 Summary Statistics January 218 January 217 Paid in Cash 7,634 7,29 5.9% 4,328 4,298.7% $179,9 $161, 11.7% Average Sale Price Dollar Volume $286,44 $244,52 17.1% $2.2 Billion
News Release. Canadian home sales slip further in January Ottawa, ON, February 17, The Canadian Real Estate Association
 Canadian home sales slip further in January Ottawa, ON, February 17, 2015 According to statistics 1 released today by The Canadian Real Estate Association (CREA), national home sales activity was down
Weekly Market Activity Report
 Weekly Market Report A RESEARCH TOOL FROM THE MINNEAPOLIS AREA ASSOCIATION OF REALTORS BROUGHT TO YOU BY THE UNIQUE DATA-SHARING TRADITIONS OF THE REALTOR COMMUNITY For Week Ending June 30, 2018 Publish
May 2016 Washington, DC Market Trends Report Listings continue to move quickly as sales climb nearly 14 percent
 FOR IMMEDIATE RELEASE Contact: Bobette Banks 301-590-8764 Director of Communications Greater Capital Area Association of REALTORS bbanks@gcaar.com May 2016 Washington, DC Market Trends Report Listings
CONSUMER CONFIDENCE AND REAL ESTATE MARKET PERFORMANCE GO HAND-IN-HAND
 CONSUMER CONFIDENCE AND REAL ESTATE MARKET PERFORMANCE GO HAND-IN-HAND The job market, mortgage interest rates and the migration balance are often considered to be the main determinants of real estate
Summary Statistics. Closed Sales. Paid in Cash. Median Sale Price. Average Sale Price. Dollar Volume. Median Time to Sale.
 Summary Statistics November 218 November 217 Paid in Cash 2,578 19,983 3.% 5,338 5,372 -.6% $255, $24, 6.3% Average Sale Price Dollar Volume $331,711 $314,76 5.4% $6.8 Billion $6.3 Billion 8.5% Median
THINGS TO CONSIDER WHEN SELLING YOUR HOUSE WINTER 2019 EDITION
 THINGS TO CONSIDER WHEN SELLING YOUR HOUSE WINTER 2019 EDITION TABLE OF CONTENTS 3 5 Reasons To Sell This Winter WHAT'S HAPPENING IN THE HOUSING MARKET? 5 Home Prices Over The Last Year 6 26% Of Homes
Summary Statistics. Closed Sales. Paid in Cash. Median Sale Price. Average Sale Price. Dollar Volume. Median Time to Sale.
 Summary Statistics February 8 February 7 Paid in Cash 8.%.% $8, $8, -6.8% Average Sale Price Dollar Volume $9,76 $7, -.7% $79,68 $9, 6.% Median Percent of Original List Price Received 97.% 9.%.% Median
Summary Statistics. Closed Sales. Paid in Cash. Median Sale Price. Average Sale Price. Dollar Volume. Median Time to Sale.
 ly Market Detail - May 218 Summary Statistics May 218 May 217 Paid in Cash 12,25 11,551 4.1% 6,24 6,285-1.3% $188, $177,6 5.9% Average Sale Price Dollar Volume $282,262 $261,48 7.9% $3.4 Billion $3. Billion
Monthly Indicators - 3.6% + 8.3% %
 ly Indicators A RESEARCH TOOL PROVIDED BY THE WESTERN UPSTATE ASSOCIATION OF REALTORS 2013 Quick Facts The S&P/Case-Shiller Home Price Index recently showed that home prices in 20 major metropolitan areas
July 2016 Washington, DC Market Trends Report July home prices remain at record highs in the District
 FOR IMMEDIATE RELEASE Contact: Bobette Banks 301-590-8764 Director of Communications Greater Capital Area Association of REALTORS bbanks@gcaar.com July 2016 Washington, DC Market Trends Report July home
Summary Statistics. Closed Sales. Paid in Cash. Median Sale Price. Average Sale Price. Dollar Volume. Median Time to Sale.
 Summary Statistics November 8 November 7 Paid in Cash 8.% 66.7% $,7 $7, -6.% Average Sale Price Dollar Volume $6,87 $8,7-7.% $8, $, 66.% Median Percent of Original List Price Received 8.6% 9.% -.% Median
Monthly Indicators + 3.5% + 3.0% % Activity Overview New Listings Pending Sales. Closed Sales. Days on Market Until Sale. Median Sales Price
 Monthly Indicators 218 Housing price bubble chatter has increased this summer, as market observers attempt to predict the next residential real estate shift. It is too early to predict a change from higher
By several measures, homebuilding made a comeback in 2012 (Figure 6). After falling another 8.6 percent in 2011, single-family
. After falling another 8.6 percent in 2011, single-family") 2 Housing Markets With sales picking up, low inventories of both new and existing homes helped to firm prices and spur new single-family construction in 212. Multifamily markets posted another strong year,
2 Housing Markets With sales picking up, low inventories of both new and existing homes helped to firm prices and spur new single-family construction in 212. Multifamily markets posted another strong year,
Summary Statistics. Closed Sales. Paid in Cash. Median Sale Price. Average Sale Price. Dollar Volume. Median Time to Sale.
 ly Market Detail - Q1 216 Summary Statistics Q1 216 Q1 215 Paid in Cash 57,913 57,742.3% 2,133 23,724-15.1% $23,5 $182, 11.8% Average Sale Price Dollar Volume $285,447 $266,453 7.1% $16.5 Billion $15.4
Released: February 8, 2011
 Released: February 8, 2011 Commentary 2 The Numbers That Drive Real Estate 3 Recent Government Action 10 Topics for Home Buyers, Sellers, and Owners 13 Brought to you by: KW Research Commentary Gradual