October 2012 Housing Commentary
|
|
|
- Donald Summers
- 5 years ago
- Views:
Transcription

1 October 2012 Housing Commentary Delton Alderman USDA Forest Service NRS-01 Forestry Sciences Laboratory Princeton, WV Urs Buehlmann Department of Sustainable Biomaterials Virginia Tech Blacksburg, VA
2 Executive Summary October housing data revealed continued healing in the housing market, albeit incrementally. Even so, many industry gurus and the main stream media continue to proclaim that housing is have our concerns and doubts. We get an eerie feeling that one or more of the economic macro factors are going to hinder the healing process. This report covers housing data, demographics, and macro factors influencing the United States housing data indicated an increase in total starts, including multifamily starts. Total building permits and new house sales decreased month-over-month. Private construction spending and housing completions increased month-over-month Existing house sales increased with prices declining again; new house sales and prices declined month-over-month. The number of available existing and new houses available for sale decreased; with that stated, in the judicial states there a large quantity of distressed homes that will be put on the market sometime in the future. Private investors remain key purchasers of existing, foreclosed, and bank-owned (REO) homes. The Case-Shiller indices, and other private indices, reported house values increased as well. Lastly, household formations increased which could bode well for housing people have to live Research unit projects information on the housing market for the next five years, including new single-family construction. In three different economic scenarios, multifamily housing is forecast to remain strong new single-family construction is not projected to return to historic norms until 2017, even in the best economic scenario.
3 Table of Contents Slide 2: Executive Summary Slide 4: Opening Comments Slide 5: Housing Scorecard Slide 6: Housing Starts Slide 9: Housing Permits and Completions Slide 10: New and Existing House Sales Slide 11: Existing House Sales Slide 14: Vacancies and Homeownership Slide 15: Construction Spending Slide 19: Residential Remodeling Slide 20: Architectural Billing Index Slide 21: Housing Barometer Slide 24: Housing Prices and Indices Slide 26: U.S. and World Housing Prices Slide 27: Delinquencies, Foreclosures, and Shadow Inventory Slide 29: Demographics and Economics Slide 31: Demographics Slide 32: Housing Market Outlook Slide 34: Renter Nation Slide 35: Future Building Multifamily Slide 43: Future Building Mapping Slide 44: Conclusions
4 October 2012 Housing Commentary Opening Comments Western world economic conditions remain unchanged increasing personal debt Revolving debt increased 6.2% and non-revolving debt decreased by 6.9% in August (both at a seasonally adjusted annual rate). Student debt is nearly 20% ($0.52 trillion) of Federal debt holdings (funded liabilities) Government debt: Federal, state, and local increasing very problematic Europe along with Portugal, Italy, and Britain, and also including France President and the members of Congress. That level of uncertainty is behind us, but I do think this spending Robert Niblock, Chief Executive Officer, Lowes Source: /20/12
5 October 2012 Housing Scorecard M/M Y/Y Housing Starts A 3.6% 41.9% Housing Permits A 2.7% 29.8% Housing Completions A 14.5% 33.6% New Single-Family House Sales A 0.3% 17.2% Existing House Sales B 2.1% 10.9% Remodeling Permits C 12.0% 5.0% Private Construction Spending A 1.3% 20.9% M/M = month-over-month;; Y/Y = year-over-year Source: A U.S. Department of Commerce-Construction ; B National Association of Realtors ; C BuildFax
6 New Housing Starts Total Starts* Single- Family Starts Multi-Family 2-4 unit Starts Multi-Family 5 or more unit Starts October 894, ,000 15, ,000 September 863, ,000 9, , , ,000 16, ,000 M/M change +3.6% -0.2% +66.7% +10.0% Y/Y change +41.9% +35.3% -6.2% +62.9% * All start data are presented at a seasonally adjusted annual rate (SAAR) October 2012: Total starts Spiked upward.is the housing market ready to return to historic norms? I potential layoffs in a number of industries, especially the defense Donald Tomnitz, Chief Executive Officer, D.R. Horton Homes Source: U.S. Department of Commerce-Construction, 2 ww.builderonline.com/blogs/postdetails.aspx?blogid=mcmanus_blog&postid=108336&utm_source=newsletter&utm _content=jump&utm_medium= &utm_campaign=bp_111312&day= ; 11/13/12
7 New Housing Starts Single Family Housing Starts as a Percent of Total Starts spite of the report, one complaint regarding the report was that multi-family units made up an increasingly large share of total starts. In the October report, single family units dropped to 66.4% of total starts, bringing the 12-month average down to 69.2%. The small share of single family starts even prompted Goldman Sachs to lower GDP forecasts for the fourth quarter. While single family housing unit starts are more beneficial to the economy than multi-family units, the current breakdown between single and multifamily unit starts is not way out of line with the historical range. As shown in the chart, the average level going back to 1960 has been 71.8%. Although the current level of 69.2% is only modestly below average, the share of single family units has widely fluctuated over time. Going back to just 1990, the current level is on the low side of the range. From 1960 to 1990, though, single family units as a share of total starts was typically much lower 3 -- Bespoke Investment Group Source: 3 ttp://seekingalpha.com/article/ single-family-housing-starts-as-a-percent-of-total-starts?source= _macro_view&ifp=0; 11/21/12


8 New Housing Starts Apartment Construction Booming! metro areas which will double their multifamily construction this year. Among the major markets, the growth is staggering. Despite the boom, many of these markets are far from their peak levels of construction, and we think further increases can easily be absorbed in a growing economy. There is now more multifamily construction than single-family construction in 36 of the 183 MSAs we forecast. The surge in multifamily construction has extended beyond the coastal markets to such inland areas The growth in multifamily construction is contributing to rising labor and materials costs for builders of all homes. At some point, the multifamily market is likely to get overbuilt too, which always seems to coincide with a recession. Right now, the outlook for the apartment market looks bright 4 -- Lesley Deutch, Vice President, John Burns Real Estate Consulting LLC Source: /15/12
9 New Housing Permits and Completions Total Permits * Single-Family Permits Multi-Family 2-4 unit Permits Multi-Family 5 or more unit Permits October 866, ,000 24, ,000 September 890, ,000 27, , , ,000 24, ,000 M/M change -2.7% +2.2% -11.1% -10.5% Y/Y change +29.8% +26.6% 0.0% +40.7% Total Completions* Single-Family Completions Multi-Family 2-4 unit Completions Multi-Family 5 or more unit Completions October 772, ,000 4, ,000 September 674, ,000 5, , , ,000 7, ,000 M/M change +14.5% +3.4% -20.0% +55.9% Y/Y change +33.6% +21.8% -42.8% +79.4% Source: U.S. Department of Commerce-Construction * All data are SAAR
10 New and Existing House Sales New Single-Family Sales* Commentary on Housing Sales New single-family house sales -- a substantial downward revision from Existing house sales -- a slight increase from September sales volumes remain low with distressed transactions at historic highs. Over the prior 12 months there were 4.07 million total transactions: REOs = 16.1% (656k) and short-sales = 16.2% 661k) for about 1.31 million distressed sales. For comparison, there were 8.2 million sales from November 2004 to November 2005, with 226,000 distressed sales Lender Processing Services Median Price Supply Existing House Sales 5* Median Price 5 Supply 5 October 368,000 $237, ,790,000 $178, September 369,000 $248, ,690,000 $178, ,000 $224, ,320,000 $233, M/M change -0.3% -3.2% +2.1% +2.1% -0.5% -3.6% Y/Y change +17.2% +6.7% -21.3% +10.9% +11.0% -28.9% * All sales data are SAAR Source: U.S. Department of Commerce-Construction; 5 National Association of Realtors, /12; /4/12
11 Existing House Sales National Association of Realtors (NAR) 8 October 2012 sales data: Distressed houses: 24% of sales (12% foreclosures and 12% short-sales) Distressed house sales: 24% in September and 28% in October 2011 All-cash sales: increased to 29% 28% in August 20%; 18% in September 2012 and 18% in October 2011 First-time buyers: decreased to 31% from 32% in September 2012 and were 34% in October Source: /20/12
12 New and Existing House Sales More and more are asking, if this is a robust recovery Where A re The First-time Homebuyers? watched S&P/Case-Shiller index report on Tuesday noted home prices over the summer posted its biggest percentage gain in more than two years. This is good news, but a crucial segment is missing out on better days: First Nin-Hai Tseng, Writer, Fortune First-time Buyers Continue To Fade -time home buyer. Instead, first- What happened? First-time buyers normally account for 40% of all sales, have now tied the record low of 8 -- Steve Cook, Executive Vice President, Reecon Advisors The Vanishing First-time Homebuyer -time homebuyer who may have a solid credit history and a good job, but lacks a 20% down payment. The reality is they are 9 -- Kerri Ann Panchuk, Reporter, HousingWire Sources: /27/12; /20/12; /26/12
13 Existing and New Housing Sales Challenges in Housing and Mortgage Markets mortgage rates and house prices that are 30% or more below their peaks in many areas. To be sure, the housing sector is far from being out of the woods. Construction activity, sales, and prices remain much lower than they were before the crisis. About 20% of mortgage borrowers remain underwater -- that is, they owe more than their homes are worth. Despite marked improvements in overall credit quality, 7% of mortgages are either more than 90 days overdue or in the process of foreclosure. And, although the number of homes in foreclosure has edged down since cresting in 2010, that number remains in excess of 2 million, three times the historical norm. Meanwhile, the national homeownership rate has slipped nearly 4 percentage points from its 2004 high of 69%, and it now stands at a 15-year low. So, although there are good reasons to be encouraged by the recent direction of the housing market, we should Dr. Ben Bernanke, Chairman, The Federal Reserve Bank Big Money Bets on a Housing Rebound flurry of private-equity giants and hedge funds have spent billions of dollars to buy thousands of foreclosed SF homes. They are purchasing them on the cheap through bank auctions, multiple listing services, short-sales, and bulk purchases from local investors in need of cash, with plans to fix up the properties, rent them out and watch their. Some firms involved: -family homes so far this year. Two Harbors had acquired 2,200 houses. Sylvan Road Capital owns between 200 and 500 homes in the Atlanta area and has a $20 million commitment from Carlyle Group 11 Source: /15/12; /8/12


14 Vacancies and Homeownership National vacancy rates in the 3 rd quarter 2012 were 8.6% for rental housing and 1.9% for homeowner housing. Both the rates were lower than the 3 rd quarter 2011 rate, and lower than last quarter (2.1%). The homeownership rate of 65.5% was lower than the 3 rd quarter 2011 rate (66.3%) and about the same as the rate last quarter. Source: 10/30/2012
15 October 2012 Construction Spending Private Construction: $ billion (SAAR) 3.0% above the revised September estimate of $ billion (SAAR) 20.7% above the September 2011 estimate of $ billion (SAAR) October SF construction: $ billion (SAAR) 28.9% above October 2011: $ billion (SAAR) October MF construction: $23.83 billion (SAAR) 53.2% above October 2011: $15.56 billion (SAAR) October Improvement A construction: $ billion (SAAR) 26.4% above October 2011: $ billion (SAAR) Private residential construction spending increased slightly from September, but one important thing to keep in mind these numbers are reported in nominal dollars and not adjusted for inflation. A The US DOC does not report improvements directly, this is an estimation. Source: U.S. Department of Commerce-C30 Construction
16 Construction Spending 650, , ,000 in millions of US$ dollars SAAR Data from July to October 2012 are in nominal dollars 500, , , , , , , , ,000 50,000 - Private Residental New Single-family New Multi-family Improvements Improvement and new SF house construction spending has been roughly equivalent since Historically, this has not been the case. A future indicator of a robust SF construction market would indicate a widening divergence between the two. However, this future spread may not be as wide as between the years 1993 and 2009 due to an increase in aging homes and an aging population, and decreased SF construction. This would indicate more money being spent on improvements). Source: U.S. Department of Commerce-C30 Construction
17 October 2012 Construction Spending October Construction Drops 14 Percent The value of new construction starts retreated 14% in October to $434.9 The 4% pickup for total construction on an unadjusted basis during the first ten months of 2012 was the result of increases for two of the three main construction groups. Residential building advanced 28%, with year-to-date gains of 27% for single-family housing and 30% for multi-family housing. Nonbuilding construction grew 3% year-to- Nonresidential building continued to be the one major construction group to register a year-todate decline, falling 14%. The nonresidential building decline was due to this behavior by segment commercial building, up 2%; institutional building, down 15%; and manufacturing building, down 47%. On a square footage basis, nonresidential building in the first ten months of 2012 was up 1% compared to a year ago. Nonresidential building, at $131.6 billion (SAAR), decreased 4% in October. The manufacturing plant category plunged 73%, continuing to pull back from the improved activity that was reported earlier in Warehouse construction also weakened substantially in October, falling 33%. Office construction in October slipped 3%.... the result of the uncertainty created by the looming fiscal cliff, manufacturers have increasingly held back on investment as 2012 has Robert Murray, Vice President, Economic Affairs, McGraw-Hill Construction Source: /20/12


18 October 2012 Construction Spending in October dropped 2% to $169.9 billion (SAAR). The downward pull came from multifamily housing, which retreated 7% from September. During 2012, multifamily housing has fluctuated around an upward trend, and the pace for multi-family housing in October was still 23% above the level reported at the start of the year. October 2012 Construction Starts Single-family housing in October was unchanged from September, maintaining the enhanced activity that's been established over the course of The October singlefamily amount was up 25% from the level reported at the start of the year, and this project type had earlier shown gains in seven out of the nine preceding months. During the January-October period of 2012, the regional pattern for single-family housing showed the largest increase in the West, up 39%; followed by the Midwest, up 28%; the South Atlantic, up 26%; the South Central, up 22%; and the Northeast, up Robert Murray, Vice President, Economic Affairs, McGraw-Hill Construction Source: /20/12
19 Residential Remodeling August 2012 September Residential Remodeling Permits: 2,701,000 (SAAR) 12% below the revised August estimate of 3,063,000 and 5% below 9/2012 US BFRI 2,701,000, 647,000 (down 17% from August and down 3% from September 2011); South, 1,121,000 (down 12% from August and up 12% from September 2011); Midwest, 474,000 (down 12% from August and down 24% from September 2011); West, 727,000 (down 10% from August and down 10% from September 2011 all SAAR. September was a rough month for residential remodeling, but early returns from October appear to show an unusual jump, so we may just be seeing a significant percentage of deferred jobs Joe Emison, Vice President-R&D, BuildFax Source: /21/12

20 Architectural Billing Indicators ABI Reflects Strongest Billings in Nearly Two Years Architecture firms reported an improvement in business conditions for the second consecutive month in September, as the Architecture Billings Index climbed to a score of 51.6, reflecting the strongest growth in nearly two years. With the general economy continuing to show signs of improvement, there is hope for a more sustained period of recovery for the profession. Inquiries into new work remained strong this month, and fewer firms reported a decline in the value of new design contracts. However, architecture firm billings are not improving in all regions of the country. Just like last month, firms in the South and West regions are reporting growth, while firms in the Northeast and Midwest are reporting weaker firm billings. After nearly 5 years of declining billings, firms in the West not only reported billings growth for the second month in a row in September, but also had the highest score of all four regions. Firms with a residential specialization recorded their highest scores in nearly seven years, as the demand for rental housing is increasing, interest rates continue to fall, and the mortgage crisis recedes further into the background. Commercial buildings are overbuilt in many areas, and firms specializing in that sector may still see some softness until they are Jennifer Riskus, Manager of Economic Research, The American Institute of Architects Source: /20/12
21 Housing Market 47% Housing Market Recovery Accelerating In October 2012, all three housing measures improved: construction starts increased again, existing-home sales rose, and the delinquency + foreclosure rate dropped considerably. Even though construction and sales declined month-over-month in the Northeast region, stronger activity in the rest of the country outweighed the impact of Hurricane Sandy.. Starts in October were at an 894,000 annualized rate, up 4% month-over-month after a big jump in September and up 42% year-overyear. Nationally, construction starts are 41% of the way back to normal. Existing-home sales recovered in October. After slipping in September, existing home sales rose 2% month-over-month to 4.79 million in October and are now just a bit below their post-crisis high of 4.83 million in August. Sales are 59% back to normal more than halfway. The delinquency + foreclosure rate dropped to a post-crisis low. In October, 10.64% of mortgages were delinquent or in foreclosure, down sharply from 11.27% in September and from 11.88% in October The combined delinquency + foreclosure rate is at its lowest level in four years and is 41% back to normal Jed Kolko, Chief Economist, Trulia Housing Research Source: /28/12


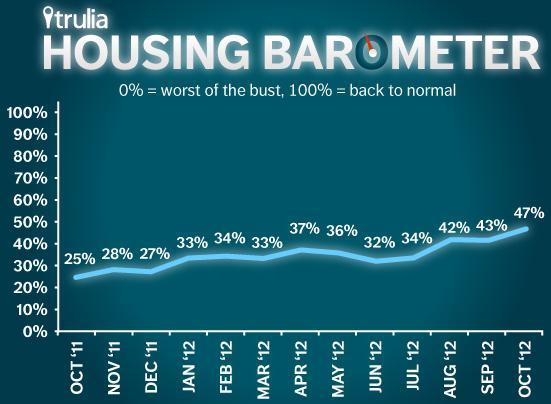
22 Housing Market 47% Source: /28/12


23 Shiller, Gross, and Jurow Speak on Housing Robert Shiller Case-Shiller Indices and Professor of Economics, Yale University Housing Recovery Bill Gross Managing Director and Co-CIO, PIMCO Keith Jurow Economics Journalist, Minyanville House Prices A re Nowhere Near A Bottom Double click on the photo for the link
24 S&P/Case-Shiller August Home Price Indices Nationally, home prices are at 2003 levels Annual returns: U.S. National, 10-City Composite and 20-City Composite Home Price Indices. The S&P/Case-Shiller U.S. National Home Price Index recorded a 3.6% gain in the 3 rd qtr of 2012 over the 3 rd qtr of In September 2012, the 10- and 20-City Composites posted annual increases of 2.1% and 3.0%, respectively. prices rose in the 3 rd qtr, marking the 6 th 3 headline composites and 17 of the 20 cities gained over their levels of a year ago. M/M, 13 cities and both Composites posted positive monthly gains. The National Composite increased by 3.6% from the same qtr in 2011 and by 2.2% from the 2 nd qtr of The 10- and 20-City Composites have posted positive annual returns for 4 consecutive months with a +2.1% and +3.0% annual change in September, respectively. M/M, both Composites have recorded increases for 6 consecutive months, with the most recent monthly gain being +0.3% for each Composite. We are entering the seasonally weak part of the year. The headline figures, which are not seasonally adjusted, showed five cities with lower prices in September versus only one in August; in the seasonally adjusted data the pattern was reversed: one city fell in September versus two in August. Despite the seasons, housing continues to improve. With six months of consistently rising home prices, it is safe to say that we are now in the midst of a recovery in the housing market David Blitzer, Chairman of the Index Committee at S&P Dow Jones Indices Source: 16 Case-Shiller and Case-Shiller Indexes and Fiserv; 11/27/12
25 October 2012 Home Prices While the housing market is now a significant contributing factor to economic growth, it will take much more time before the housing market sees a full recovery. Short- to medium-term factors driving this recovery are fueled by an investor-based demand for rental properties, combined with rising home prices and a decline in the number of underequitied households. A full housing recovery will be driven by a healthier economy, fundamental gains in income growth and consumption, and an ongoing increase in home prices Mark Fleming, Chief Economist, CoreLogic U.S. The past year has seen consistent price increases, but a number of factors continue to affect the recovery in home prices such as stagnant income growth, high unemployment levels, lingering uncertainty about the macro economy, and the large number of homes in the foreclosure pipeline Andrew Leventis, Principal Economist, Federal Housing Finance Agency M/M Change CoreLogic HPI % Clear Capital HDI TM +1.0% LPS $ % Federal Housing Finance Agency HPI % FNC RPI TM Zillow $153, % Source: 17 October ; /27/ /22/ 2012; 11/10/ /16/ /4/12
26 U.S. and World Housing Prices Estate in Need of Maintenance Is Recent Weakness Just a Blackspot, or Blight? Real house price indices vs. dependency ratios l estate prices has coincided give or take literally a couple of years with the peak in the inverse dependency ratio (the proportion of population of working age relative to old and young). In the past, we all levered up, bought a big house, enjoyed capital gains tax-free, lived in the thing, and then, when the kids grew up and left home, we sold it to someone in our children's generation. Unfortunately, that doesn't work so well when there start to be more pensioners than workers Matt King, Global Head of Credit Strategy, Citi Bank Source: /6/12
27 Delinquencies, Foreclosures, Negative Equity, and Shadow Inventory October 2012 Delinquent Foreclosure Negative Equity Shadow Inventory CoreLogic D 58,000 foreclosures 2.7 million 1.3 million 10.8 million 1.5 million LPS E 203,000 starts 3.5 million 2.03 million million RealtyTrac F 89,209 starts - 186,455 notices +12 million - Zillow G per 10,000 homes +14 million - Each firm has different estimating methods thus the discrepancy in the data. Source: D 12/3/12; E 12/10/12; F www2.marketwire.com, 12/13/12; G 12/10/12
28 Delinquencies, Foreclosures, Negative Equity, and Shadow Inventory October Commentary Negative equity is impacting the real estate market. In total, underwater homeowners owe $1.02 trillion more than More than 42% of underwater homeowners (11.9% of all homeowners with a mortgage), owe 20% or less than their home is worth. On average, U.S. homeowners in negative equity owe $73,163 more than what their house is worth or 42.5% more Daren Blomquist, Vice President, RealtyTrac As a result of completed foreclosures and alternative disposition methods, the foreclosure inventory has declined by 9% year-to-date. This is good news for housing markets as we look forward to Mark Fleming, Chief Economist, CoreLogic However, Reworked Mortgage Delinquencies Jumped in October Modified-Mortgage Defaults Soar 24% in Looming Housing Challenge - J.P. Morgan analysts said. wave should last through Source: 20 www2.marketwire.com/mw/frame_multimedia?prid=641471&attachid= ; 10/22/2012; /31/ /19/12
 for October 23 - - Dr.")
29 Demographics and Economics Median Household Income Index and Unemployment Rate by Month: Jan 2000 to Oct 2012 economy that continues to struggle. Even though we are technically in an economic recovery, real median annual statistically unchanged from the September 2012 median of $51,418. The Household Income Index (HII) for October Dr. Gordon Green, Sentier Research Source: /21/12

30 Median Household Income Index, Percent Unemployed, Marginally attached or Working Part-time for Economic Reasons: January 2000 to October 2012 October 2012 can be put into broader perspective by a comparison with previous levels of household income dating back to the start of the last decade. The October 2012 median annual household income of $51,378 was 4.7% lower than the 2012 median was 7.2% lower than the median of $55,356 in December 2007, the beginning month of the recession that occurred more than four years ago. And the October 2012 median was 8.1% lower than the median of $55,914 in January 2000, the beginning of this statistical series. These comparisons demonstrate how significantly real median annual household income has fallen over the past decade, Dr. Gordon Green, Sentier Research Source: /21/12

31 Demographics More New Households Sprouting are setting up house at the fastest rate in more than six years, an indication that recession anxiety, which prompted adult children to move in with their parents and single people to postpone marriage, is starting to ease. Source: SoberLook The nation added 1.15 million households in the 12 months that ended in September, according to the most recent Census Bureau data. That is a significant rise from the past four years when an average of 650,000 households were formed annually. While what economists call is running a little lower than the average 1.25 million added annually during the boom years, the latest data nevertheless represent an important shift. happen said Ara Hovnanian, chief executive of Hovnanian Enterprises Inc., one of the nation's largest builders of single-family homes. is destiny, in the end Robbie Whelan, Reporter, Wall Street Journal Source: /7/ /8/2012
32 November 2012 U.S. Economic and Housing Market Outlook What a healthy housing market should look like will dismay those who keep comparing housing to what it was during its peak years. However, taking into account recent trends, key housing indicators and the shifting demographic patterns that will define a new and realistic trajectory toward a healthy housing market, the long-term prognosis is promising just don't expect the housing market to wake up at 98.6 degrees tomorrow -- Frank Nothaft, Vice President and Chief Economist, Freddie Mac 98.6 DEGREES Housing starts increasing to about 1.7 to 1.8 million dwellings per year compared with 2.1 million in Home sales increasing to about 5% of the housing stock, or about 6.5 to 7.0 million homes per year, compared with sales of 7% of the stock in U.S. house price appreciation rising gradually to about 3% per year compared to 11% of Vacancy rates easing further to about 1.7% on for-sale homes and 8% for rental homes, down from peaks of about 3% in 2008 and 11% in 2009, respectively. Serious delinquency rates nearing 2%, down from a peak of 9.5% in early Source: /23/2012

33 Future Building To sum up: taking into account recent trends, key housing indicators and the shifting demographic patterns that will define a new and realistic trajectory toward a healthy housing market, the longterm prognosis is promising. In tempered by continued high unemployment, modest income growth, and a subdued pace of household formations. In housing market to wake up at 98.6 degrees tomorrow morning Frank Nothaft, Vice President and Chief Economist, Freddie Mac Source: /14/12
34 Renter Nation: Single-Family Rentals Rental Rental demand outstrips rental supply Roll Tide, or The Rise of the SF Rental Market -years -- 1 million new renters were added in Traditionally, analysts have segmented the U.S. residential RE market into SF homes for sale (primarily owner occupies) and MF rental. While SF rentals (SFR) have always been an important segment of the rental housing stock 21 mm units (52% of the rental stock), about 1/3 of the 40 million households that rent live in SF units, and the lack of data on SFR properties has resulted in very little research or analytical understanding. More than 80% SF rentals are owned by SF investors. In the last 2-years, an average of 42,000 rentals have been added monthly to the stock of rental homes. This is more than twice the average flow the country was experiencing prior to the Sam Khater, Senior Economist, and Thomas Vitlo, Research Analyst, CoreLogic Source: 26 ; 11/13/12
35 Future Building: Multi-Family Market To Remain Strong Through 2015 With 1.7 Million New The research supports the optimism that currently pervades the multifamily market. It confirms that multifamily is a bright spot in in the real estate market and the economy more broadly, and it will likely continue to shine for quite some time. The economic data indicates that current rental markets are very strong with low vacancy rates, rising rents and solid demographic trends. What this research demonstrates is that these conditions are likely to remain in place for several years to come David Brickman, Senior Vice President, Freddie Mac Multifamily F reddie Mac Multifamily Research G roup Forecast Highlights: Recent declines in homeownership related to economic stress and high foreclosures in the singlefamily housing market have benefited the multifamily market. The homeownership rate will drop 1 to 2 percentage points if the current slow recovery continues. The single-family rental market, a growing and distinct market from multifamily, has expanded 16% (about 3 million units) since Multifamily market demand is expected to be strong through 2015 primarily due to demographic trends and a decreasing national homeownership rate. Rental demand will continue to grow faster than historical averages. Multifamily demand is likely to be 1.7 million new renter households between now and 2015 (slow growth prediction). If the economic recovery accelerates, demand will be in 1 million new renter range; and if no recovery, then in the 1.6 million range for new renters. 27 Source: /14/12
36 Future Building: Multi-Family F reddie Mac Multifamily Research G roup Demand Forecast: Recent declines in homeownership related to economic stress and high foreclosures in the singlefamily housing market have benefited the multifamily market. The homeownership rate will drop 1-2 percentage points if the current slow recovery continues. The single-family rental market, a growing and distinct market from multifamily, has expanded 16% (about 3 million units) since Multifamily market demand is expected to be strong through 2015 primarily due to demographic trends and shift in homeownership preference. Test Scenarios 1. Base Scenario: given assumptions consistent with economic growth slightly slower than long run averages, multifamily demand is likely to be in the range of 1.7 million net new renter households between now and Accelerated Recovery Scenario: if the economy recovers more quickly than expected together with current homeownership affordability multifamily rental demand will be healthy but more muted because of competition from the owner market. With relative strength in the economy, there are 1.0 million new multifamily renters over the same period. 3. No Recovery Scenario: in a stalled economy, households are more likely to choose to rent despite continued high ownership affordability, a scenario nearly as favorable to the multifamily market as our base scenario. The increase in multifamily renters is 1.6 million. 27 Source: /14/12
37 Future Building: Multi-Family are becoming a bigger share of the residential housing market and the share of renters in residential homes is approaching levels that were typical in the 1980s and 1990s (Figure 1). generally make up more than 20% of the single-family space. This number dropped below 20% when the ownership market was at its peak. Since that time, the renter proportion of the residential market has been increasing towards historical norms 27 Source: /14/12

38 Future Building: Multi-Family Demographic Trends A key driver of household formation and rental demand is demographic trends. U.S. population growth leads to an increase in the number of households. Reviewing data going back to World War II, the U.S. population average growth rate is 1.2% annually. During the last recession, population growth dropped to its lowest rate in five decades. However, the slowdown has not caused a contraction, just a slower rate of growth. The U.S. population still grew by 2.26 million in 2011 or 0.7% according to the U.S. Census. International migration is a key element to overall population growth. Net migration is influenced by economic growth. Without a strong economy, immigration also slows dramatically. Population Forecast Forecast Scenarios Population Increase Zero International Migration 5.6M Constant International Migration 10.6M High International Migration 13.3M In our slow recovery scenario assuming constant migration in population, we expect approximately 1.2 million new households annually from 2011 to In the accelerated growth scenario, the economy will grow at a healthy pace and young adults, as well as new immigrants, will form more households. This will contribute substantially to overall household formation and increase the demand for rental units. 27 Source: /14/12
39 Future Building: Multi-Family Housing Supply Housing supply relative to demand determines house price and rent levels, which impact homeownership and new development. In 2011, single-family builders delivered 455,000 new units, which is a fraction of the 1.7 million new units delivered in With some increase in the demand for housing, the number of vacant units declined despite a high number of distressed properties for sale. About 440,000 new 1-4 unit building permits were issued in 2011, which is far below the 30-year average of 1.0 million permits. Multifamily development also dropped dramatically during the recession, but has since become the leading source of residential construction. New construction starts in the multifamily sector jumped 60% from 2010 to Even with the jump, starts are still below average over the last two decades, 260,000 units. Considering the lag between construction start and completion, delivery of new multifamily housing will remain at a relatively low level in the short-term. It will take time for single-family construction to catch up with the long run average of 1 million new units per year. For our forecasting and scenario analysis, we assume the following new single-family housing supply volumes from 2012 to 2015: 1. No recovery scenario: a constant 450,000 new single-family units. 2. Slow recovery scenario: new single-family units rising from the current level of 450,000 units to 750,000 units in 2015, with an average of 600,000 units per year from 2012 to Accelerated growth scenario: new single-family units rising from the current level of 450,000 units to 1,000,000 units in 2015, with an average of 750,000 units per year from 2012 to Source: /14/12
40 Future Building: Multi-Family Housing Affordability Generally, higher owner affordability pushes up homeownership and decreases demand in the rental market. However, the relationship between economic growth and affordability (and then the multifamily market) is complicated. An improving economy could cause increased house prices, a higher inflation rate, and higher mortgage rates all of which then lower affordability in the owner market and lead to increased rental demand. On the other hand, a deteriorating economy will likely increase affordability, but weakness in the economy can slow the decision to buy and, all else equal, increase rental demand. This is why it is important to consider this joint interaction between employment and affordability to provide a comprehensive view when analyzing the future rental market. In our scenario analysis, we try to capture future housing affordability with assumptions regarding employment, mortgage rates, and household income: 1. No recovery scenario: the unemployment rate stays at a high level of 8.3% and housing price does not increase. In this scenario there is no change in the mortgage rate from 2012 to 2015 and there is also no household income growth. 2. Slow recovery scenario: the unemployment rate gradually declines from 8.2% to 6.5% with a mortgage rate increase of 1.7% from 2012 to The single-family housing prices growth also gradually rises to 3% in 2015 with 1% annual household income growth. 3. Accelerated growth scenario: the unemployment rate declines rapidly from 8% in 2012 to 5.5% in 2015 with a higher mortgage rate growth of 2.7% during the same period. The house price growth rises to 4% in 2015 with a constant income growth of 3% per year. 27 Source: /14/12

41 Future Building: Multi-Family U.S. Homeownership Rate and New Multifamily Demand Currently, most industry practitioners, including us, expect overall economic growth to be slower than the long-run average. Given this outlook, we forecast that the homeownership rate will continue to decline to around 65% level, which implies 3.1 million new families or more than half of total new households will move into rental units. Consequently, multifamily demand will be solid with a total of 1.7 million net new renters from 2011 to Source: /14/12
42 Future Building: Multi-Family Household Distribution Increase by Scenario: Increase of Increase of Single- Increase of Scenarios Homeowners Family Renters Multifamily Renters Base Scenario 1.7M 1.4M 1.7M No Recovery - 0.1M 1.7M 1.6M Accelerated Recovery 4.0M 0.8M 1.0M In the relatively pessimistic scenario, homeownership will dip from 65.5% (2012 Q2) to 64.1% in The multifamily market will benefit from this trend despite continued economic stress and lower new household formation. In this scenario, the single-family rental sector is relatively competitive with the multifamily sector due to low house prices and the high foreclosure rate. Total new multifamily demand will still reach 1.6 million from 2011 to If the overall economy strengthens quickly, a more optimistic scenario, there will be a rebound in home ownership. In 2015 it will rise to the level. With expected high population growth, we foresee a modest increase of on average 250,000 units annually in multifamily renters. Unless there is a major jump in multifamily new construction, the multifamily market will still be balanced. However, the single-family rental market will see a significantly smaller increase of an estimated 800,000 households compared to 4 million growth in the ownership market. Summary The analysis considers the impact of single-family rental units on the multifamily rental demand. Under three economic scenarios: slow growth, no growth, and accelerated growth we find the multifamily market will remain solid and healthy through at least Source: /14/12

43 Future Building Where to Build Although construction of both homes and apartments is gaining steam, multifamily construction once again far outpaced single-family housing starts this month, in every U.S. region except California, where there are low inventories of single-family homes for sale. Builders are rushing to figure out where to place their chips when it comes to starting new communities and putting shovels in the ground. Pitney Bowes found that while most of the top 20 places expected to grow fastest in the next five years are the same ones that grew the most last decade. Houston and Atlanta lead the list from both 2000 to 2010 and are expected to top it again for 2012 to Other areas set to continue seeing big gains are Dallas, Washington, Phoenix, Riverside-San Bernardino, Austin, Orlando, San Antonio and Charlotte. Just six of the top 50 projected growth markets are in the Northeast, the region that showed the weakest construction growth in the latest Census figures, while 16 of them are in the West, the region that has seen the most single-family construction growth. If projections like these are right, they could be a helpful road map for builders Robbie Whelan, Reporter, Wall Street Journal Source: /26/12
44 Conclusions October housing construction data moderated, which typically begins this time of year. All of the major indicators: Permits, new and existing house sales, housing starts, and completions are at higher levels nonetheless, they are substantially below long-term averages. The numbers of new and existing houses for sale continue to decline and are at historically low-levels. Interest rates are at historically low-levels these also are a positives for the housing market. permits decline, appears to be a promising and steadily increasing market. are concerned about their retirement as they have their children (some even with their parents) living with them. It is projected that many Boomers will - home. 29 Potentially, these Boomers could opt to remodel their home to accommodate aging, or 30 Apparently, first time buyers are a decreasing entity in home purchases this possibly can be attributed to: 1) strict lending standards (and they are becoming more stern 31 ) and 2) those time buyers are confronted with affordability and home ownership costs. 32 There are some who disagree with these assessments, as the findings from a recent survey of Millennials indicated their desire to own a house. 33 Source: /14/12; /29/ /20/ /15/12; /26/2012
45 Conclusions Freddie Mac projected multi-family starts under three different economic conditions in all three analyses, multi-family housing is forecast to remain strong. They also projected singlefamily starts; even in the best economic scenario single-family housing is not expected to become robust until This coincides with private economists projections that we have reviewed. So, where are we? From our viewpoint, the housing market is healing, but our near-term outlook on the U.S. housing market remains unchanged (again) there remain too many potential negative macrofactors at this point in time for a robust housing recovery. Why? 1) Consumer confidence decreased in the latest report, 2) a lack of well-paying jobs, 3) a sluggish economy 4) declining real median annual household incomes, and 5) strict home loan lending standards. We could be completely wrong Federal Reserve Bank is focusing on the housing market by providing ample liquidity via mortgage purchases and with ultra low interest rates. Until next month. We wish you all Happy Holidays.
46 Disclaimer of Non-endorsement Reference herein to any specific commercial products, process, or service by trade name, trademark, manufacturer, or otherwise, does not necessarily constitute or imply its endorsement, recommendation, or favoring by the United States Government. The views and opinions of authors expressed herein do not necessarily state or reflect those of the United States Government, and shall not be used for advertising or product endorsement purposes. Disclaimer of Liability With respect to documents available from this server, neither the United States Government nor any of its employees, makes any warranty, express or implied, including the warranties of merchantability and fitness for a particular purpose, or assumes any legal liability or responsibility for the accuracy, completeness, or usefulness of any information, apparatus, product, or process disclosed, or represents that its use would not infringe privately owned rights. Disclaimer for External Links The appearance of external hyperlinks does not constitute endorsement by the U.S. Department of Agriculture of the linked web sites, or the information, products or services contained therein. Unless otherwise specified, the Department does not exercise any editorial control over the information you may find at these locations. All links are provided with the intent of meeting the mission of the Department and the Forest Service web site. Please let us know about existing external links you believe are inappropriate and about specific additional external links you believe ought to be included. Nondiscrimination Notice The U.S. Department of Agriculture (USDA) prohibits discrimination in all its programs and activities on the basis of race, color, national origin, age, disability, and where applicable, sex, marital status, familial status, parental status, religion, sexual orientation, genetic information, political beliefs, reprisal, or because all or a part of an individual's income is derived from any public assistance program. (Not all prohibited bases apply to all programs.) Persons with disabilities who require alternative means for communication of program information (Braille, large print, audiotape, etc.) should contact USDA's TARGET Center at (voice and TDD). To file a complaint of discrimination write to USDA, Director, Office of Civil Rights, 1400 Independence Avenue, S.W., Washington, D.C or call (voice) or (TDD). The USDA is an equal opportunity provider and employer.
United States Housing Market and Hardwoods
 United States Housing Market and Hardwoods The Future of the Hardwood Lumber Industry Wood Education Resource Center Princeton, WV November 3, 2016 Delton Alderman Forest Products Marketing Unit Forest
November 2018 Housing Commentary
 November 2018 Housing Commentary Urs Buehlmann Department of Sustainable Biomaterials Virginia Tech Blacksburg, VA 540.231.9759 buehlmann@gmail.com and Al Schuler Economist (retired) Princeton, WV Table
By several measures, homebuilding made a comeback in 2012 (Figure 6). After falling another 8.6 percent in 2011, single-family
. After falling another 8.6 percent in 2011, single-family") 2 Housing Markets With sales picking up, low inventories of both new and existing homes helped to firm prices and spur new single-family construction in 212. Multifamily markets posted another strong year,
2 Housing Markets With sales picking up, low inventories of both new and existing homes helped to firm prices and spur new single-family construction in 212. Multifamily markets posted another strong year,
Housing and Economy Market Trends
 Housing and Economy Market Trends Mainstreet Organization Prices of single-family, detached homes in suburban Chicago increased 12.1 percent in May 2014 compared with the same period a year ago. Overall,
September 2012 Housing Commentary
 September 2012 Housing Commentary Delton Alderman USDA Forest Service NRS-01 Forestry Sciences Laboratory Princeton, WV 304.431.2734 dalderman@fs.fed.us Urs Buehlmann Department of Sustainable Biomaterials
United States Housing, 2012
 United States Department of Agriculture United States Housing, 2012 Delton Alderman ABSTRACT Provides current and historical information on housing market in the United States. Information includes trends
The Virginia Tech U.S. Forest Service January 2016 Housing Commentary: Section I
 The Virginia Tech U.S. Forest Service January 2016 Housing Commentary: Section I Urs Buehlmann Department of Sustainable Biomaterials College of Natural Resources & Environment Virginia Tech Blacksburg,
The Virginia Tech U.S. Forest Service January 2016 Housing Commentary: Section I
 The Virginia Tech U.S. Forest Service January 2016 Housing Commentary: Section I Urs Buehlmann Department of Sustainable Biomaterials College of Natural Resources & Environment Virginia Tech Blacksburg,
The state of the nation s Housing 2011
 The state of the nation s Housing 2011 Fact Sheet PURPOSE The State of the Nation s Housing report has been released annually by Harvard University s Joint Center for Housing Studies since 1988. Now in
Nothing Draws a Crowd Like a Crowd: The Outlook for Home Sales
 APRIL 2018 Nothing Draws a Crowd Like a Crowd: The Outlook for Home Sales The U.S. economy posted strong growth with fourth quarter 2017 Real Gross Domestic Product (real GDP) growth revised upwards to
Economic Highlights. Payroll Employment Growth by State 1. Durable Goods 2. The Conference Board Consumer Confidence Index 3
 August 26, 2009 Economic Highlights Southeastern Employment Payroll Employment Growth by State 1 Manufacturing Durable Goods 2 Consumer Spending The Conference Board Consumer Confidence Index 3 Real Estate
Owner spending on improvements to existing homes also rose over the past year. Benefiting from strengthening house sales, CONSTRUCTION RECOVERY
 2 Housing Markets After another year of healthy growth in 213, the housing market paused in the first quarter of 214. The renewed weakness in residential construction, sales, and prices raised fears that
January 2012 Housing Notes
 January 2012 Housing Notes Delton Alderman USDA Forest Service NRS 01 Forestry Sciences Laboratory Princeton, WV 304.431.2734 dalderman@fs.fed.us Urs Buehlmann Department of Sustainable Biomaterials Virginia
CONTINUED STRONG DEMAND
 Rental Housing Although slowing, renter household growth continued to soar in 13. The strength of demand has kept rental markets tight across the country, pushing up rents and spurring new construction.
STRENGTHENING RENTER DEMAND
 5 Rental Housing Rental housing markets experienced another strong year in 2012, with the number of renter households rising by over 1.1 million and marking a decade of unprecedented growth. New construction
Multifamily Market Commentary December 2015 Single-Family Rental Sector Attracting Institutional Investment
 Multifamily Market Commentary December 2015 Single-Family Rental Sector Attracting Institutional Investment Prior to the Great Recession, the cratering of single-family home prices, and declines in the
Multifamily Market Commentary February 2017
 Multifamily Market Commentary February 2017 Affordable Multifamily Outlook Incremental Improvement Expected in 2017 We expect momentum in the overall multifamily sector to slow in 2017 due to elevated
Median Income and Median Home Price
 Homeownership Remains Unaffordable; Rental Affordability Showing Signs of Improvement Richard E. Taylor, Research Manager at MaineHousing MaineHousing has released the 217 Maine Homeownership and Rental
Rapid recovery from the Great Recession, buoyed
 Game of Homes The Supply-Demand Struggle Laila Assanie, Sarah Greer, and Luis B. Torres October 4, 2016 Publication 2143 Rapid recovery from the Great Recession, buoyed by the shale oil boom, has fueled
Housing Price Forecasts. Illinois and Chicago PMSA, January 2018
 Housing Price Forecasts Illinois and Chicago PMSA, January 2018 Presented To Illinois Realtors From R E A L Regional Economics Applications Laboratory, Institute of Government and Public Affairs University
Housing Price Forecasts. Illinois and Chicago PMSA, December 2015
 Housing Price Forecasts Illinois and Chicago PMSA, December 2015 Presented To Illinois Association of Realtors From R E A L Regional Economics Applications Laboratory, Institute of Government and Public
Housing Price Forecasts. Illinois and Chicago PMSA, May 2018
 Housing Price Forecasts Illinois and Chicago PMSA, May 2018 Presented To Illinois Realtors From R E A L Regional Economics Applications Laboratory, Institute of Government and Public Affairs University
RESIDENTIAL MARKET ANALYSIS
 RESIDENTIAL MARKET ANALYSIS CLANCY TERRY RMLS Student Fellow Master of Real Estate Development Candidate Oregon and national housing markets both demonstrated shifting trends in the first quarter of 2015
Housing Price Forecasts. Illinois and Chicago PMSA, October 2014
 Housing Price Forecasts Illinois and Chicago PMSA, October 2014 Presented To Illinois Association of Realtors From R E A L Regional Economics Applications Laboratory, Institute of Government and Public
} Construction jobs have
 Texas Housing Market Finally Building a Solid Recovery By D Ann Petersen } Construction jobs have contributed to total employment consistently beginning this year, making construction the last of the major
INLAND EMPIRE REGIONAL INTELLIGENCE REPORT
 INLAND EMPIRE REGIONAL INTELLIGENCE REPORT June 2016 EMPLOYMENT After a slow start to 2016, the Inland Empire s labor market returned to form, in recent job figures. Seasonally adjusted nonfarm employment
ECONOMIC COMMENTARY. Housing Recovery: How Far Have We Come? Daniel Hartley and Kyle Fee
 ECONOMIC COMMENTARY Number 13-11 October, 13 Housing Recovery: How Far Have We Come? Daniel Hartley and Kyle Fee Four years into the economic recovery, housing markets have fi nally started to improve.
Housing Price Forecasts. Illinois and Chicago PMSA, April 2018
 Housing Price Forecasts Illinois and Chicago PMSA, April 2018 Presented To Illinois Realtors From R E A L Regional Economics Applications Laboratory, Institute of Government and Public Affairs University
HOUSING MARKETS CONSTRUCTION GAINING MOMENTUM JOINT CENTER FOR HOUSING STUDIES OF HARVARD UNIVERSITY
 2 HOUSING MARKETS After a mixed year in 214, the national housing recovery gained traction in 215. Residential construction continued to climb as single-family starts revived. Sales of both new and existing
The State of the Nation s Housing
 The State of the Nation s Housing Eric S. Belsky Remodeling Futures Conference April 13, 21 www.jchs.harvard.edu Existing Home Sales Improved then Retracted, While New Home Sales Are Still in the Basement
Annual Report On Our National Real Estate Market
 A TWINCITIESPROPERTYFINDER.COM RESOURCE Annual Report On Our National Real Estate Market 1 Contents Industry Facts 3 Mortgage Stats 4 Distressed Properties & Price Information 5 Today s Buyer 6 First-Time
The Virginia Tech U.S. Forest Service June 2016 Housing Commentary: Section I
 The Virginia Tech U.S. Forest Service June Housing Commentary: Section I Urs Buehlmann Department of Sustainable Biomaterials College of Natural Resources & Environment Virginia Tech Blacksburg, VA 540.231.9759
HOUSING MARKETS. Strength in Early 2005 Pushed Most National Housing Indicators into Record Territory
 HOUSING MARKETS Despite another record-setting performance, housing markets showed clear signs of cooling late in 2005. As mortgage interest rates moved up and house prices soared, home sales turned down
HOULIHAN LAWRENCE COMMERCIAL GROUP
 HOULIHAN LAWRENCE COMMERCIAL GROUP TH QUARTER EXECUTIVE SUMMARY FOURTH QUARTER Dear Clients, With behind us and the new year in full swing, we can now reflect, summarize and gain insight from the past
Housing Indicators in Tennessee
 Housing Indicators in l l l By Joe Speer, Megan Morgeson, Bettie Teasley and Ceagus Clark Introduction Looking at general housing-related indicators across the state of, substantial variation emerges but
REAL ESTATE AND THE ECONOMIC OUTLOOK THROUGH 2013:
 1 1 REAL ESTATE AND THE ECONOMIC OUTLOOK THROUGH 2013: Coping With A Different Kind Of Housing Recovery A Presentation To The Commercial Real Estate Education Summit Monrovia, California July 13, 2012
ECONOMIC CURRENTS. Vol. 4, Issue 3. THE Introduction SOUTH FLORIDA ECONOMIC QUARTERLY
 ECONOMIC CURRENTS THE Introduction SOUTH FLORIDA ECONOMIC QUARTERLY Vol. 4, Issue 3 Economic Currents provides an overview of the South Florida regional economy. The report presents current employment,
MARKET OUTLOOK FOR SAN MATEO
 MARKET OUTLOOK FOR SAN MATEO Jonathan Smoke Chief Economist August 2, 2016 NATIONAL TRENDS 2 JOB CREATION REBOUNDED IN JUNE 229,000 jobs created by month in 2015; 172,000 average this year Employment and
FY General Revenue Forecast Presentation
 FY 2015-2019 General Revenue Forecast Presentation Steven A. Solomon Director of Finance February 18, 2014 Overview Current Economic Outlook National State Local FY 2014 2nd Quarter Revenue Update Five
24). The weakest markets were in the West, with San Jose. Market Turmoil. The State of the Nation s Housing 2010
. The weakest markets were in the West, with San Jose. Market Turmoil. The State of the Nation s Housing 2010") 5 Rental housing Although renter household growth increased last year, rental vacancy rates climbed to a new high. Early in 21, however, occupancies in some areas appeared to be stabilizing. With multifamily
5 Rental housing Although renter household growth increased last year, rental vacancy rates climbed to a new high. Early in 21, however, occupancies in some areas appeared to be stabilizing. With multifamily
2013 Housing Market Forecast. SILVAR: Los Gatos/Saratoga District October 10, 2012 Leslie Appleton-Young, Vice President & Chief Economist
 2013 Housing Market Forecast SILVAR: Los Gatos/Saratoga District October 10, 2012 Leslie Appleton-Young, Vice President & Chief Economist What we saw from the roof.. C.A.R. NAR THE ECONOMY Recent Housing
RENTAL PRODUCTION AND SUPPLY
 RENTAL PRODUCTION AND SUPPLY Despite a sharp uptick in the number of renter households, construction of multifamily units for rent declined in 27 for the fifth straight year. Even so, growth in the rental
The supply of single-family homes for sale remains
 Oh Give Me a (Single-Family Rental) Home Harold D. Hunt and Clare Losey December, 18 Publication 2218 The supply of single-family homes for sale remains tight in many markets across the United States.
Analysis of Current and Forecasted Demand for Housing in North America
 Analysis of Current and Forecasted Demand for Housing in North America TIMBER MEASUREMENT SOCIETY Central Meeting April 9, 2015 Coeur d Alene, Idaho Delton Alderman Forest Products Marketing Unit Forest
Connecticut First Nine Months Housing Report 2014
 Connecticut First Nine Months Housing Report 2014 First Nine Months of 2014 Highlight Positive Outlook for Multi-family Home Construction Millennial buyers are finally increasing their rate of household
Housing Price Forecasts. Illinois and Chicago PMSA, August 2017
 Housing Price Forecasts Illinois and Chicago PMSA, August 2017 Presented To Illinois Realtors From R E A L Regional Economics Applications Laboratory, Institute of Government and Public Affairs University
Housing Market Update
 Housing Market Update March 2017 New Hampshire s Housing Market and Challenges Market Overview Dean J. Christon Executive Director, New Hampshire Housing Finance Authority New Hampshire s current housing
INLAND EMPIRE REGIONAL INTELLIGENCE REPORT. School of Business. April 2018
 INLAND EMPIRE REGIONAL INTELLIGENCE REPORT April 2018 Key economic indicators suggest that the Inland Empire s economy will continue to expand throughout the rest of 2018, building upon its recent growth.
U.S. Home Construction Lags Behind Broad Economic Rebound...
 This copy is for your personal, non-commercial use only. To order presentation-ready copies for distribution to your colleagues, clients or customers visit http://www.djreprints.com. http://www.wsj.com/articles/u-s-home-construction-lags-behind-broad-economic-rebound-1481914669
OBSERVATION. TD Economics IS THE AMERICAN HOUSING REBOUND SUSTAINABLE?
 OBSERVATION TD Economics IS THE AMERICAN HOUSING REBOUND SUSTAINABLE? Highlights 2012 was a very good year for the U.S. housing market. Home prices were up almost 8% and housing starts by close to 30%.
Blackstone-Fueled Single-Family Home Boom Lifts Chicago
 ESTM1998 MACK INVESTMENTS Blackstone-Fueled Single-Family Home Boom Lifts Chicago By: Bloomberg February 14, 2014 The tan, three-bedroom house on Chicago s North Side sits half a block from a Family Dollar
This Month in Real Estate
 Keller Williams Research This Month in Real Estate Released: September 14, 2009 Commentary. The Numbers That Drive Real Estate Recent Government Action. Research for Buyers and Sellers. 2 4 10 14 1 Green
Housing Price Forecasts. Illinois and Chicago PMSA, January 2019
 Housing Price Forecasts Illinois and Chicago PMSA, January 2019 Presented To Illinois Realtors From R E A L Regional Economics Applications Laboratory, Institute of Government and Public Affairs University
GROWING DIVERSITY OF RENTER HOUSEHOLDS THE STATE OF THE NATION S HOUSING 2012
 5 Housing Renter household growth surged in 11, spurred by the decline in homeownership rates across most age groups. With vacancy rates falling and rents on the rise, returns on rental property investments
With last month's gain, sales are now up 4.5% from May 2015 and are at their highest annual pace since February 2007.
 JULY 2016 With last month's gain, sales are now up 4.5% from May 2015 and are at their highest annual pace since February 2007. - Lawrence Yun NAR s Chief Economist Now in its seventh year, the US economic
OVERVIEW OF RECENT/EXPECTED ECONOMIC/ HOUSING MARKET CONDITIONS
 OVERVIEW OF RECENT/EXPECTED ECONOMIC/ HOUSING MARKET CONDITIONS STRONG ECONOMIC FUNDAMENTALS *BUT* EXTRAORDINARY SHORT-TERM FACTORS RESULTING IN MAJOR SHIFTS IN TYPES OF HOUSING PRODUCTS AND GEOGRAPHICAL
Change on the Horizon:
 Change on the Horizon: An overview of the economy and its impact on commercial real estate By Elliot M. Shirwo, Founder and Principal BridgeCore Capital, Inc. Commercial real estate is intrinsically linked
Economic and Housing Update
 Economic and Housing Update Mark Palim Vice President, Applied Economic and Housing Research Fannie Mae January 14, 2015 2012 Fannie Mae. Trademarks of Fannie Mae. Economic Activity Rebounding Solidly
Foreclosures Continue to Bring Home Prices Down * FNC releases Q Update of Market Distress and Foreclosure Discount
 Foreclosures Continue to Bring Home Prices Down * FNC releases Q4 2011 Update of Market Distress and Foreclosure Discount The latest FNC Residential Price Index (RPI), released Monday, indicates that U.S.
Young-Adult Housing Demand Continues to Slide, But Young Homeowners Experience Vastly Improved Affordability
 Young-Adult Housing Demand Continues to Slide, But Young Homeowners Experience Vastly Improved Affordability September 3, 14 The bad news is that household formation and homeownership among young adults
State of the Nation s Housing 2008: A Preview
 State of the Nation s Housing 28: A Preview Eric S. Belsky Remodeling Futures Conference April 15, 28 www.jchs.harvard.edu The Housing Market Has Suffered Steep Declines Percent Change Median Existing
ECONOMIC CURRENTS. Vol. 5 Issue 2 SOUTH FLORIDA ECONOMIC QUARTERLY. Key Findings, 2 nd Quarter, 2015
 ECONOMIC CURRENTS THE Introduction SOUTH FLORIDA ECONOMIC QUARTERLY Economic Currents provides an overview of the South Florida regional economy. The report presents current employment, economic and real
Myth Busting: The Truth About Multifamily Renters
 Myth Busting: The Truth About Multifamily Renters Multifamily Economics and Market Research With more and more Millennials entering the workforce and forming households, as well as foreclosed homeowners
Presented to Membership of the Lake Gaston Association. Christine Thompson. June 10, 2014
 Presented to Membership of the Lake Gaston Association Christine Thompson June 10, 2014 About your speaker Christine Thompson Real Estate Sales & Service at Lake Gaston for 13+ years Advanced training
CONTENTS. Executive Summary 1. Southern Nevada Economic Situation 2 Household Sector 5 Tourism & Hospitality Industry
 CONTENTS Executive Summary 1 Southern Nevada Economic Situation 2 Household Sector 5 Tourism & Hospitality Industry Residential Trends 7 Existing Home Sales 11 Property Management Market 12 Foreclosure
Monthly Market Snapshot
 SEPTEMBER 2018 Vacancy continues to fall. Nearing the end of the third quarter, the vacancy rate dropped 10 basis points to 6.4%, compared to this time last month at 6.5%. Occupancy of the 1.1 million
MARKET STRATEGY VIEWPOINT U.S. Housing Decelerating
 Jan-01 Oct-01 Jul-02 Apr-03 Jan-0 Oct-0 Jul-05 Apr-0 Jan-07 Oct-07 Jul-08 Apr-09 Jan-10 Oct-10 Jul-11 Apr-12 Jan-13 Oct-13 Jul-1 Apr-15 Jan-1 Oct-1 Jul-17 Apr-18 U.S. Housing Decelerating August 27, 2018
State of the Nation s Housing 2011: A Preview
 State of the Nation s Housing 2011: A Preview Christopher Herbert Remodeling Futures Conference April 5, 2011 www.jchs.harvard.edu No Signs of a Recovery Yet % Change % Change Description: 2008 2009 2010
Shadow inventory in Texas
 With the national and local real estate markets turning positive, questions remain about the shadow inventory that was supposed to be holding down the market. Concerns over shadow inventory re-entering
REGIONAL. Rental Housing in San Joaquin County
 Lodi 12 EBERHARDT SCHOOL OF BUSINESS Business Forecasting Center in partnership with San Joaquin Council of Governments 99 26 5 205 Tracy 4 Lathrop Stockton 120 Manteca Ripon Escalon REGIONAL analyst april
San Francisco Housing Market Update
 San Francisco Housing Market Update California Economic and Housing Market Outlook The national economy maintained a healthy growth rate in the first quarter of 2005 and appeared to be settling in for
2016 Multifamily Outlook: Another Year of Opportunity
 2016 Multifamily Outlook: Another Year of Opportunity A BERKSHIRE RESEARCH VIEWPOINT February 2016 2016 Multifamily Outlook: A Year of Opportunity A BERKSHIRE RESEARCH VIEWPOINT February 2016 2 2016 MULTIFAMILY
Housing Price Forecasts. Illinois and Chicago PMSA, August 2016
 Housing Price Forecasts Illinois and Chicago PMSA, August 2016 Presented To Illinois Association of Realtors From R E A L Regional Economics Applications Laboratory, Institute of Government and Public
4 RENTAL MARKETS. While the fundamentals remain strong for. investors, there are signs that rental markets
 4 RENTAL MARKETS While the fundamentals remain strong for investors, there are signs that rental markets are at a turning point. Real rents are still climbing, but at a slower pace now that vacancy rates
Housing Price Forecasts. Illinois and Chicago PMSA, September 2016
 Housing Price Forecasts Illinois and Chicago PMSA, September 2016 Presented To Illinois Realtors From R E A L Regional Economics Applications Laboratory, Institute of Government and Public Affairs University
Housing and Mortgage Market Update
 Housing and Mortgage Market Update Views from the Top Frank E. Nothaft Vice President and Chief Economist January 8, 2015 Summary: Housing & Mortgage Market Outlook for 2015 Interest rates expected to
Housing Price Forecasts. Illinois and Chicago PMSA, March 2018
 Housing Price Forecasts Illinois and Chicago PMSA, March 2018 Presented To Illinois Realtors From R E A L Regional Economics Applications Laboratory, Institute of Government and Public Affairs University
Rental Housing: Poised for a Return to Growth
 Rental Housing: Poised for a Return to Growth Christopher Herbert Remodeling Futures Conference November 9, 21 www.jchs.harvard.edu Summary of Ongoing Joint Center Research on The Rental Housing Market
The Virginia Tech U.S. Forest Service February 2016 Housing Commentary: Section I
 The Virginia Tech U.S. Forest Service February 2016 Housing Commentary: Section I Urs Buehlmann Department of Sustainable Biomaterials College of Natural Resources & Environment Virginia Tech Blacksburg,
Cycle Monitor Real Estate Market Cycles Third Quarter 2017 Analysis
 Cycle Monitor Real Estate Market Cycles Third Quarter 2017 Analysis Real Estate Physical Market Cycle Analysis of Five Property Types in 54 Metropolitan Statistical Areas (MSAs). Income-producing real
Multifamily Outlook 2016
 Executive Summary Demand for multifamily rental housing was higher than expected in 2015, absorbing much of the newly completed supply. Therefore, vacancy rates remained low and rents continued to rise
Rents Up, Occupancy Steady
 Rents Up, Steady Kansas City s apartment market closed 2014 with a significant increase in rents compared to the prior year. The average per-square-foot rent was $0.88. At the end of 2013 it had been $0.85.
2013 Arizona Housing Market Mid-Year Report
 2013 Arizona Housing Market Mid-Year Report This mid-year market report outlines the latest trends in Arizona real estate. The housing market hit bottom in mid to late 2011, and has been in recovery mode
Connecticut Full Year Housing Report
 Connecticut 2014 Full Year Housing Report As 2014 Closes, Increasing Market Confidence Predicts a Solid Start to 2015 With an influx of Millennial, Gen X and Baby Boomer buyers, a strong spring market
2015 First Quarter Market Report
 2015 First Quarter Market Report CAAR Member Copy Expanded Edition Charlottesville Area First Quarter 2015 Highlights: Median sales price for the region was up 5.1% over Q1-2014, rising from $244,250 to
Volume II Edition I Why This is a Once in a Lifetime Opportunity for Investors
 www.arizonaforcanadians.com Volume II Edition I Why This is a Once in a Lifetime Opportunity for Investors In This Edition How to make great investment returns in a soft market U.S. Financing for Canadians
2017 MORTGAGE MARKET OUTLOOK: EXECUTIVE HOUSING REPORT JANUARY 2017
 2017 MORTGAGE MARKET OUTLOOK: EXECUTIVE HOUSING REPORT JANUARY 2017 1 2017 FORECAST OVERVIEW For the 2017 housing market, the outlook is generally positive. The long recovery from the elevated delinquency
3 November rd QUARTER FNB SEGMENT HOUSE PRICE REVIEW. Affordability of housing
 3 November 2011 3 rd QUARTER FNB SEGMENT HOUSE PRICE REVIEW JOHN LOOS: HOUSEHOLD AND PROPERTY SECTOR STRATEGIST 011-6490125 John.loos@fnb.co.za EWALD KELLERMAN: PROPERTY MARKET ANALYST 011-6320021 ekellerman@fnb.co.za
things to consider if you are selling your house
 things to consider if you are selling your house KEEPINGCURRENTMATTERS.COM WINTER 2012 EDITION PAGE TABLE OF CONTENTS 1 3 5 7 9 House Prices: Where They Will Be in the Spring Understanding the Impact OF
Our Housing Market Turns the Corner
 Our Housing Market Turns the Corner OUR HOUSING MARKET TURNS THE CORNER After a very difficult half decade characterized by falling sales and prices, a surge in foreclosures and many underwater homeowners,
Market Trends and Outlook
 Residential Remodeling Market Trends and Outlook Kermit Baker Remodeling Futures Conference April 3, 2012 Remodeling Market Overview 1. Home improvement spending totaled an estimated $290 billion last
HOUSING MARKET OUTLOOK Calgary CMA
 H o u s i n g M a r k e t I n f o r m a t i o n HOUSING MARKET OUTLOOK Calgary CMA C a n a d a M o r t g a g e a n d H o u s i n g C o r p o r a t i o n Date Released: Fall 2011 NEW HOME MARKET Total housing
Minneapolis St. Paul Residential Real Estate Index
 University of St. Thomas Minneapolis St. Paul Residential Real Estate Index Welcome to the latest edition of the UST Minneapolis St. Paul Residential Real Estate Index. The University of St Thomas Residential
High-priced homes have a unique place in the
 Livin' Large Texas' Robust Luxury Home Market Joshua G. Roberson December 3, 218 Publication 2217 High-priced homes have a unique place in the overall housing market. Their buyer pool, home characteristics,
Multifamily Supply: Too Much or Not Enough
 Multifamily Supply: Too Much or Not Enough A BERKSHIRE RESEARCH VIEWPOINT October 2016 1 Multifamily Supply: Too Much or Not Enough A BERKSHIRE RESEARCH VIEWPOINT October 2016 SUMMARY With an expected
ANALYSIS OF THE CENTRAL VIRGINIA AREA HOUSING MARKET 1st quarter 2013 By Lisa A. Sturtevant, PhD George Mason University Center for Regional Analysis
 ANALYSIS OF THE CENTRAL VIRGINIA AREA HOUSING MARKET 1st quarter By Lisa A. Sturtevant, PhD George Mason University Center for Regional Analysis Economic Overview Key economic factors in the first quarter
Single-Family vs. Multi-Family? Dietrich Heidtmann, Managing Director
 U.S. Rented Residential Sector Single-Family vs. Multi-Family? Dietrich Heidtmann, Managing Director Demand: U.S. Household Formations Are Returning to Normalized Levels and the Entry of Millenials Continues
2017 RESIDENTIAL REAL ESTATE MARKET REPORT
 2017 RESIDENTIAL REAL ESTATE MARKET REPORT Published January 26, 2018 Our market reports have been focused on the effects of low inventory on our housing market and for good reason. December 2017 marked
Economic Highlights. Retail Sales Components 1. University of Michigan Consumer Sentiment Index 2. Industrial Production and Capacity Utilization 3
 November 17, 2010 Economic Highlights Consumer Spending Retail Sales Components 1 University of Michigan Consumer Sentiment Index 2 Manufacturing Industrial Production and Capacity Utilization 3 Real Estate
Linkages Between Chinese and Indian Economies and American Real Estate Markets
 Linkages Between Chinese and Indian Economies and American Real Estate Markets Like everything else, the real estate market is affected by global forces. ANTHONY DOWNS IN THE 2004 presidential campaign,