Recovery? Growth? Jobs? Capital Investment?
|
|
|
- Marsha Pearson
- 5 years ago
- Views:
Transcription


1 Recovery? Growth? Jobs? Capital Investment? Turning the Corner? Presented by Dr. Ivan Miestchovich, Jr., Director Institute for Economic Development & Real Estate Research The University of New Orleans
2 U.S. Economy
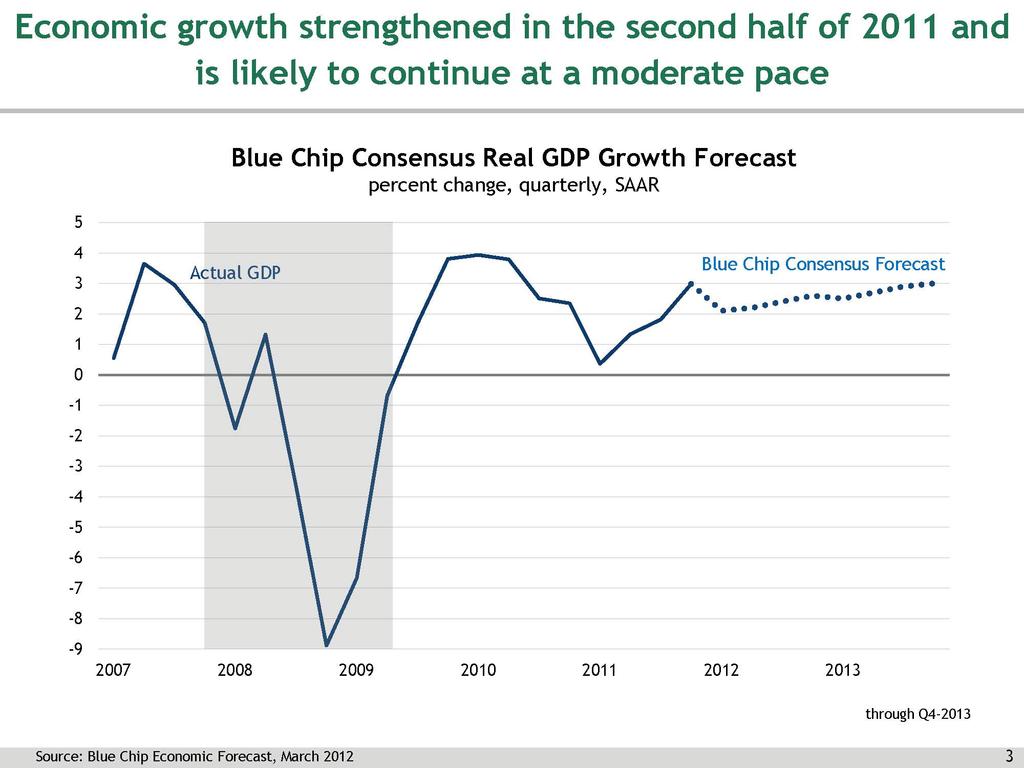
3
4
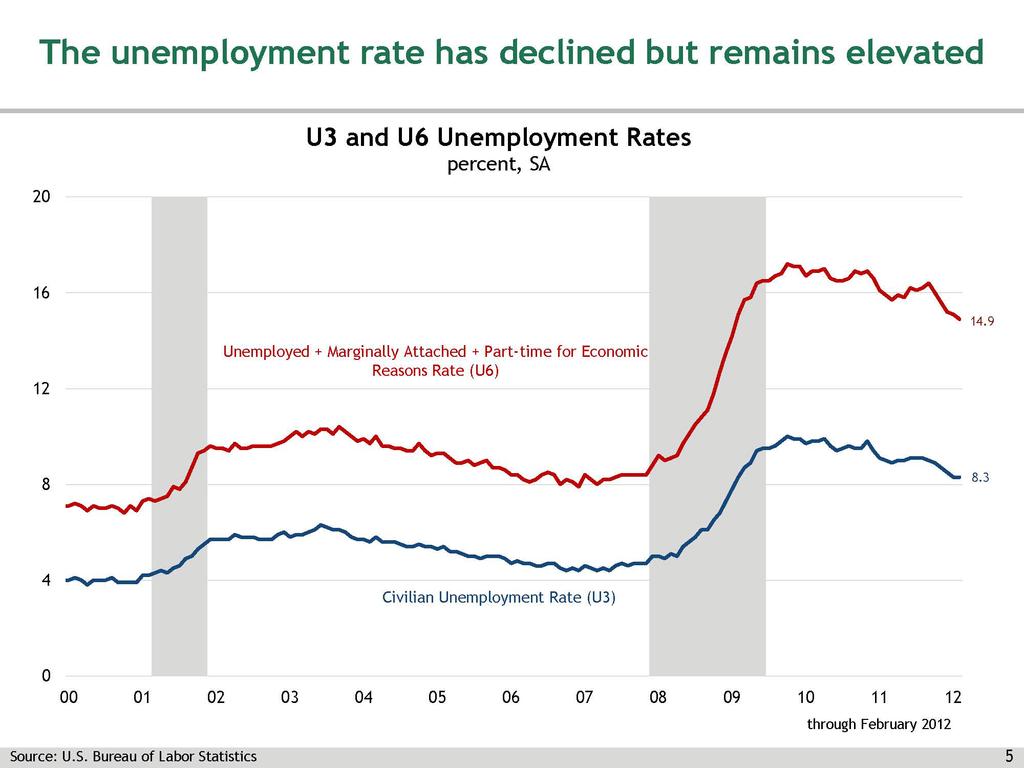
5
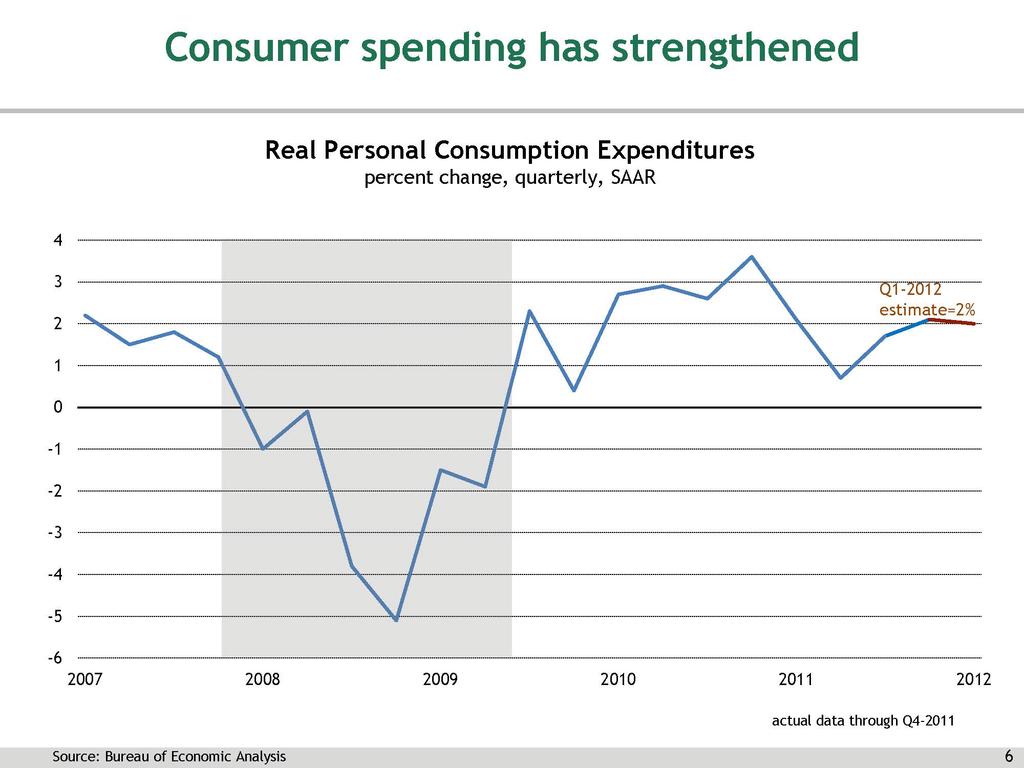
6
7
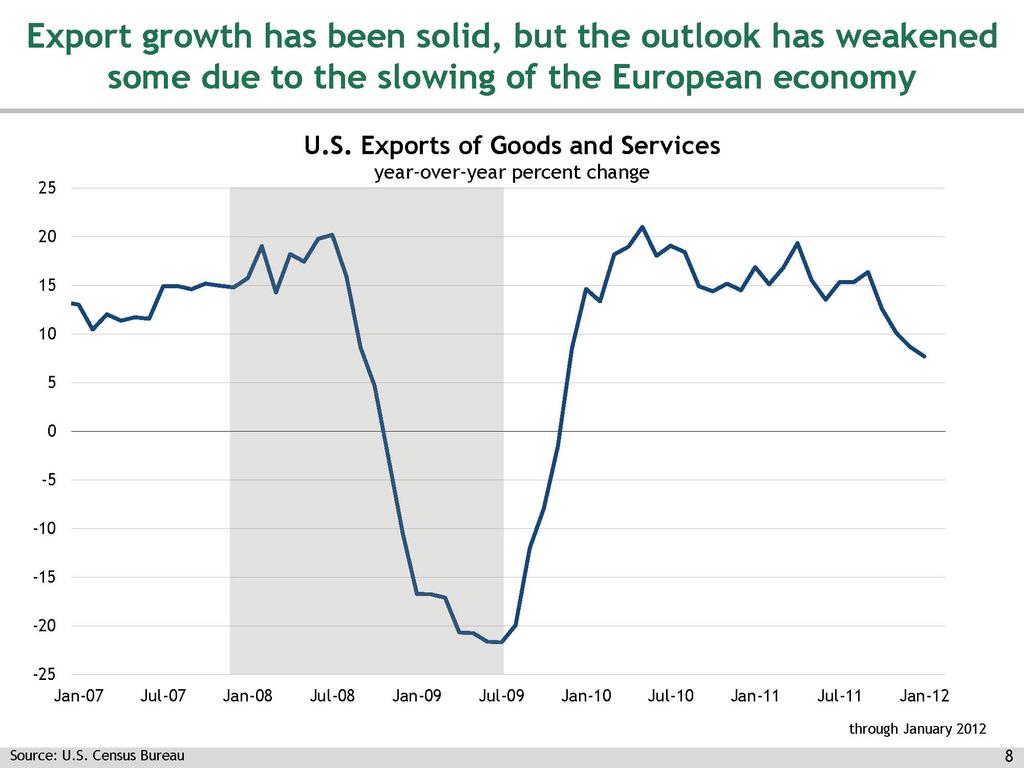
8
9 Going Forward

10 Unemployment Rates by State January 2012 ND SD NE KS TX OK MN WI AR IL IA LA MS MO WA OR ID WY MT CA NV UT AZ CO HI AK NM ME NY SC AL FL GA IN KY NC OH PA TN VA WV MI VT NH MA RI CT NJ DE MD DC 10
11 New Orleans Metro Job Overview The New Orleans metro area had 609,600 jobs in 2005 before Katrina. At the low point after the storm, the area had just 425,800 jobs (70% of pre-katrina). By October 2011, employment in New Orleans had grown to 529,300 jobs (86.8%). By the end of 2013, 531,500 jobs are forecast (87.2%). 11 Prepared by UNO Division of Business & Economic Research


12 N. O. Metro Total Employment Jobs (1000's) Jan-03 Jun-03 Nov-03 Apr-04 Sep-04 Feb-05 Jul-05 Dec-05 May-06 Oct-06 Mar-07 Aug-07 Jan-08 Jun-08 Nov-08 Apr-09 Sep-09 Feb-10 Jul-10 Dec-10 May-11 Oct-11 Mar-12 Aug-12 Jan-13 Jun-13 Nov Source: US Bureau of Labor Statistics, DBER Prepared by UNO Division of Business & Economic Research

13 New Orleans Metro Total Population 13 Sources: US Census, GCR & Assoc., System Solutions Consulting Prepared by UNO Division of Business & Economic Research

14 Employment , Quarter 3 Orleans, Jefferson and St. Tammany Parishes 300, , , , ,000 50,000 0 Q1/2001 Q1/2005 August 2005 Q1/2006 Q4/2007 Q4/2008 Q4/2009 Q3/2011 Jefferson 212, , , , , , , ,614 Orleans 261, , , , , , , ,890 St. Tammany 57,840 67,369 69,457 65,704 75,516 74,785 75,287 77, Source: Labor Market Statistics, Quarterly Census of Employment & Wages Program

15 N. O. Metro Construction Activity Per Month $ Millions pre-k 2005 post-k Non-building Non-residential Residential Source: McGraw Hill Construction, Dodge 15
16 Foreclosures per Household New Orleans Metro vs. US 0.35% 0.30% 0.25% Percentage 0.20% 0.15% 0.10% 0.05% 0.00% 2007 Avg 2008 Q Q Q Q Q Q Q Q Q Q Q Q Q1 New Orleans Metro US 16 Source: RealtyTrac Prepared by UNO Division of Business & Economic Research
17 Single Family Average Price & Units Sold Metro 2004 to 2011 $235,000 17,000 $220,000 15,500 Average Price $205,000 $190,000 $175,000 $160,000 $145,000 $130,000 14,000 12,500 11,000 9,500 8,000 Units Sold $115,000 6,500 $100, Ave Price Units Sold 5, Source: New Orleans Metropolitan Association of Realtors
18 Greater New Orleans Area Single Family- Active Listings vs. Sold Listings 1989 thru 2011 FOURTH QUARTER Source: LATTER & BLUM Research Division Numbers are in hundreds for existing residential property only. Active Sold 18 This representation is based in whole or in part on data supplied by New Orleans Metropolitan Association of Realtors, St. Tammany Association of Realtors, Tangipahoa Board of Realtors, Baton Rouge Board of Realtors or their Multiple Listing Services. Neither the Boards, Associations, nor their MLS guarantees or is in any way responsible for its accuracy. Data maintained by the Boards, Associations or their MLS may not reflect all real estate activity for all years.
19 Single Family Average Price & Units Sold Jefferson Parish 2004 to 2011 Average Price $250,000 $200,000 $150,000 $100,000 $50,000 5,000 4,500 4,000 3,500 3,000 2,500 2,000 1,500 Unit Sold $ Ave Price Units Sold 1, Source: New Orleans Metropolitan Association of Realtors
20 Metairie Area Single Family- Active Listings vs. Sold Listings 1989 thru 2011 FOURTH QUARTER Active Sold Source: LATTER & BLUM Research Division 20 This representation is based in whole or in part on data supplied by New Orleans Metropolitan Association of Realtors, St. Tammany Association of Realtors, Tangipahoa Board of Realtors, Baton Rouge Board of Realtors or their Multiple Listing Services. Neither the Boards, Associations, nor their MLS guarantees or is in any way responsible for its accuracy. Data maintained by the Boards, Associations or their MLS may not reflect all real estate activity for all years.
21 Kenner Area Single Family- Active Listings vs. Sold Listings 1989 thru 2011 FOURTH QUARTER Active Sold Source: LATTER & BLUM Research Division 21 This representation is based in whole or in part on data supplied by New Orleans Metropolitan Association of Realtors, St. Tammany Association of Realtors, Tangipahoa Board of Realtors, Baton Rouge Board of Realtors or their Multiple Listing Services. Neither the Boards, Associations, nor their MLS guarantees or is in any way responsible for its accuracy. Data maintained by the Boards, Associations or their MLS may not reflect all real estate activity for all years.
22 Single Family Average Price & Units Sold Orleans Parish 2004 to 2011 Average Price $275,000 $250,000 $225,000 $200,000 $175,000 $150,000 $125,000 $100, Ave Price Units Sold 3,500 3,000 2,500 2,000 1,500 1, Units Sold 22 Source: New Orleans Metropolitan Association of Realtors
23 Uptown Area Single Family- Active Listings vs. Sold Listings 1989 thru 2011 FOURTH QUARTER 1,400 1,200 1, Active Sold Source: LATTER & BLUM Research Division 23 This representation is based in whole or in part on data supplied by New Orleans Metropolitan Association of Realtors, St. Tammany Association of Realtors, Tangipahoa Board of Realtors, Baton Rouge Board of Realtors or their Multiple Listing Services. Neither the Boards, Associations, nor their MLS guarantees or is in any way responsible for its accuracy. Data maintained by the Boards, Associations or their MLS may not reflect all real estate activity for all years.
24 Lakefront Area Single Family- Active Listings vs. Sold Listings 1989 thru 2011 FOURTH QUARTER Active Sold Source: LATTER & BLUM Research Division 24 This representation is based in whole or in part on data supplied by New Orleans Metropolitan Association of Realtors, St. Tammany Association of Realtors, Tangipahoa Board of Realtors, Baton Rouge Board of Realtors or their Multiple Listing Services. Neither the Boards, Associations, nor their MLS guarantees or is in any way responsible for its accuracy. Data maintained by the Boards, Associations or their MLS may not reflect all real estate activity for all years.
25 Single Family Average Price & Units Sold St. Tammany Parish 2004 to 2011 Average Price $275,000 $250,000 $225,000 $200,000 $175,000 $150,000 $125,000 $100, Ave Price Units Sold 5,000 4,500 4,000 3,500 3,000 2,500 2,000 1,500 1, Units Sold 25 Source: New Orleans Metropolitan Association of Realtors
26 Mandeville Area Single Family- Active Listings vs. Sold Listings 1989 thru 2011 FOURTH QUARTER /2011 Active Sold Source: LATTER & BLUM Research Division 26 This representation is based in whole or in part on data supplied by New Orleans Metropolitan Association of Realtors, St. Tammany Association of Realtors, Tangipahoa Board of Realtors, Baton Rouge Board of Realtors or their Multiple Listing Services. Neither the Boards, Associations, nor their MLS guarantees or is in any way responsible for its accuracy. Data maintained by the Boards, Associations or their MLS may not reflect all real estate activity for all years.
27 Single Family Average Price & Units Sold St. Bernard Parish 2004 to 2011 Average Price $135,000 $120,000 $105,000 $90,000 $75,000 $60,000 $45,000 $30,000 $15,000 $ Ave Price Units Sold Units Sold 27 Source: New Orleans Metropolitan Association of Realtors
28 Single Family Average Price & Units Sold Plaquemines Parish 2004 to 2011 $325,000 $300,000 $275,000 $250,000 $225,000 $200,000 $175,000 $150,000 $125,000 $100, Ave Price Units Sold Source: New Orleans Metropolitan Association of Realtors
29 Greater New Orleans Area Months of Inventory Months Months Source: LATTER & BLUM Research Division 29 This representation is based in whole or in part on data supplied by New Orleans Metropolitan Association of Realtors, St. Tammany Association of Realtors, Tangipahoa Board of Realtors, Baton Rouge Board of Realtors or their Multiple Listing Services. Neither the Boards, Associations, nor their MLS guarantees or is in any way responsible for its accuracy. Data maintained by the Boards, Associations or their MLS may not reflect all real estate activity for all years.


30 Area by Area Months of Inventory Snapshot 2011 VS 2012 East Jefferson Garden/Uptown Metairie River Parishes Lakefront/Gentilly Historic District West Bank W. St. Tammany E. St. Tammany Source: LATTER & BLUM Research Division This representation is based in whole or in part on data supplied by New Orleans Metropolitan Association of Realtors, St. Tammany Association of Realtors, Tangipahoa Board of Realtors, Baton Rouge Board of Realtors or their Multiple Listing Services. Neither the Boards, Associations, nor their MLS guarantees or is in any way responsible for its accuracy. Data maintained by the Boards, Associations or their MLS may not reflect all real estate activity for all years.
31 Single Family Building Permits New Orleans Metro: , March 7,000 6,000 5,000 4,000 Annual Average 3,779 3,000 2,000 1, Mar 2011 Mar Source: US Census Bureau, Residential Permits

32 Single Family Building Permits St. Tammany Parish: , March 3,500 3,000 2,500 2,000 Annual Average 1,731 1,500 1, Mar 2011 Mar Source: US Census Bureau, Residential Permits
33 Macro Trends and the Apartment Market Recovering Economy Household Formations Undoubling Mortgage Market Fallout Foreclosures willful and otherwise Displaced Owners and Renters Homeownership Postponed Ramped Up Loan Qualification Housing Price Uncertainty Buy Now? Wait? Rent. 33
34 Apartment Market Select U.S. Cities Ten Highest & Lowest Occupancy Rates, N.O.: 92.6% U.S.: 90.25% 75.0 San Francisco, CA Oakland, CA Los Angeles, CA Washington, DC Denver, CO San Jose, CA New York, NY Orange County, CA Baltimore, MD Portland, OR New Orleans Metro Jacksonville, FL Kansas City, MO/KS Orlando, FL Syracuse, NY Columbus, OH Cleveland, OH Detroit, MI Houston, TX Dayton, OH Providence, RI 34 Source: Integra Realty Resources & Institute for Economic Development & Real Estate Research Surveys
35 Apartment Average Rent & Occupancy Metro 2004 to 2011 $1, % $1, % $ % $ % $ % $ % $ Pre K '05 Post K ' % Ave Rent Occupancy 35 Source: UNO Real Estate Center Surveys
36 Apartment Average Rent & Occupancy Orleans Parish 2004 to 2011 $1, % $1, % $1,000 $800 $600 $ % 85.0% 80.0% $ % $ Pre K '05 Post K ' % Ave Rent Occupancy 36 Source: UNO Real Estate Center Surveys
37 Apartment Average Rent & Occupancy Jefferson Parish 2004 to 2011 $1, % $ % $750 $600 $450 $ % 85.0% 80.0% $ % $ Pre K '05 Post K ' % Ave Rent Occupancy 37 Source: UNO Real Estate Center Surveys
38 Apartment Average Rent & Occupancy St. Tammany Parish 2004 to 2011 $1, % $1, % $ % $ % $ % $ % $ Pre K '05 Post K ' % Ave Rent Occupancy 38 Source: UNO Real Estate Center Surveys
39 Office Suburban Market Select U.S. Cities Ten Highest & Lowest Occupancy Rates, N.O.: 84.6% U.S.: 83.02% Nashville, TN Pittsburgh, PA Greenville, SC Dayton, OH Fort Worth, TX San Francisco, CA Long Island, NY Los Angeles, CA Cleveland, OH Memphis, TN New Orleans Metro Milwaukee, WI Detroit, MI Jacksonville, FL Phoenix, AZ Indianapolis, IN Tampa, FL Tulsa, OK Sacramento, CA Las Vegas NV Chicago, IL 39 * New Orleans Metro occupancy rate includes Suburban and CBD market sectors Source: Integra Realty Resources & Institute for Economic Development & Real Estate Research Surveys
40 Office CBD Market Select U.S. Cities Ten Highest & Lowest Occupancy Rates, N.O.: 84.6% U.S.: 83.41% Charlotte,NC Boise,ID Philadelphia,PA Portland,OR Washington,DC Oakland,CA New York,NY Pittsburgh,PA Fort Worth,TX Los Angeles,CA New Orleans Metro Cleveland,OH Atlanta,GA Tulsa,OK Las Vegas,NV Detroit,MI San Antonio,TX Dallas,TX Hartford,CT Dayton,OH Syracuse,NY 40 * New Orleans Metro occupancy rate includes Suburban and CBD market sectors Source: Integra Realty Resources & Institute for Economic Development & Real Estate Research Surveys
41 Office Average Rent & Occupancy Metro 2004 to 2011 $16.50 $16.25 $16.00 $15.75 $15.50 $15.25 $15.00 $14.75 $14.50 $ Pre K '05 Post K ' % 95.0% 90.0% 85.0% 80.0% 75.0% 70.0% Ave Rent Occupancy 41 Source: UNO Real Estate Center Surveys
42 Office Average Rent & Occupancy Orleans Parish 2004 to 2011 $ % $ % $15.50 $15.00 $14.50 $ % 85.0% 80.0% $ % $ Pre K '05 Post K ' % Ave Rent Occupancy 42 Source: UNO Real Estate Center Surveys


43 CBD Class A Skyline Current Class A Inventory: 9,674,351 SF in 16 buildings 61% completed between 1980 and 1985 Last addition (now Benson Tower) in


44 Major Oil/Gas Retreat from Market Covington, LA 44


45 Who has filled the space Legal Governmental Health Software/new entrepreneurial wave Shorter term special projects Katrina related (engineers, insurers, etc.) BP related (legal, research) DEPARTMENT OF HEALTH AND HOSPITALS 45
46 CBD Class A Tower Percentage Occupancy


47 But... In 2011, there was 528,375 square feet more of occupied office space in the CBD than in 2010 Benson Tower - 488,000 SF Now 93% leased Exchange Centre- 400,000 SF Now 31% leased 47

48 CBD Class A Tower Office Rental Rates $20.00 $18.00 $16.00 $14.00 $12.00 $10.00 $8.00 $6.00 $4.00 $2.00 $0.00 $18.00 $


49 No Longer in Service as Office 49
50 Office Average Rent & Occupancy Jefferson Parish 2004 to 2011 $ % $18.50 $18.00 $ % 90.0% $ % $16.50 $16.00 $ % 75.0% $ Pre K '05 Post K ' % Ave Rent Occupancy 50 Source: UNO Real Estate Center Surveys
51 Historic Metairie Class A Occupancy
52 Metairie Class A Rental Rates $25.00 $22.60 $22.50 $20.00 $15.00 $10.00 $5.00 $
53 Office Average Rent & Occupancy St. Tammany Parish 2004 to 2011 $18.00 $17.50 $17.00 $16.50 $16.00 $15.50 $15.00 $14.50 $14.00 $13.50 $ Pre K '05 Post K ' % 95.0% 90.0% 85.0% 80.0% 75.0% 70.0% Ave Rent Occupancy 53 Source: UNO Real Estate Center Surveys
54 Retail Market Select U.S. Cities Ten Highest & Lowest Occupancy Rates, N.O.: 91.6% U.S.: 90.25% San Francisco, CA Oakland, CA Los Angeles, CA Washington, DC Denver, CO San Jose, CA New York, NY Orange County, CA Baltimore, MD Portland, OR New Orleans Metro Jacksonville, FL Kansas City, MO/KS Orlando, FL Syracuse, NY Columbus, OH Cleveland, OH Detroit, MI Houston, TX Dayton, OH Providence, RI 54 Source: Integra Realty Resources & Institute for Economic Development & Real Estate Research Surveys
55 Retail Average Rent & Occupancy Metro 2004 to 2011 (Excludes Freestanding) $17.00 $16.50 $16.00 $15.50 $15.00 $14.50 $14.00 $13.50 $13.00 $ Pre K '05 Post K ' % 95.0% 90.0% 85.0% 80.0% 75.0% 70.0% Ave Rent Occupancy 55 Source: UNO Real Estate Center Surveys
56 Retail Average Rent & Occupancy Orleans Parish 2004 to 2011 (Excludes Freestanding) $ % $ % $ % $ % $ % $ % $ % $ % $ Pre K '05 Post K ' % Ave Rent Occupancy 56 Source: UNO Real Estate Center Surveys
57 Retail Average Rent & Occupancy Jefferson Parish 2004 to 2011 (Excludes Freestanding) $16.00 $15.25 $14.50 $13.75 $13.00 $12.25 $11.50 $10.75 $ Pre K '05 Post K ' % 95.0% 90.0% 85.0% 80.0% 75.0% 70.0% Ave Rent Occupancy 57 Source: UNO Real Estate Center Surveys
58 Retail Average Rent & Occupancy St. Tammany Parish 2004 to 2011 (Excludes Freestanding) $16.75 $16.00 $15.25 $14.50 $13.75 $13.00 $12.25 $11.50 $10.75 $ Pre K '05 Post K ' % 95.0% 90.0% 85.0% 80.0% 75.0% 70.0% Ave Rent Occupancy 58 Source: UNO Real Estate Center Surveys
59

60

61

62

63

64

65
66 Dr. Ivan Miestchovich, Jr., Director Institute for Economic Development & Real Estate Research The University of New Orleans 2000 Lakeshore Drive 413 Kirschman Hall New Orleans, LA Phone: Fax: Web: or
Real Estate Update. elearning series. Upcoming elearning series. Year-End Planning. September 16
 Real Estate Update Upcoming elearning series Year-End Planning September 16 Kevin Russell Senior Vice President, Sales & Account Management, Cartus Home Loans Renee Carnes-Rook Vice President, Real Estate
VSIP POSITION LISTING American Federation of Government Employees
 HQ Washington, DC Office of Public Housing Investments Public Housing Revitalization Specialist GS 15 11 Public Housing Revitalization Specialist GS 14 14 Public Housing Revitalization Specialist GS 13
NATIONAL ASSOCIATION OF REALTORS RESEARCH DIVISION
 NATIONAL ASSOCIATION OF REALTORS RESEARCH DIVISION COMMERCIAL REAL ESTATE Positive Demand Overcomes Weak Economic Performance in 2014.Q1 George Ratiu Director, Quantitative & Commercial Research First
List of 2009 Round Allocations
 List of 2009 Round Allocations CDFI 601 Thirteenth Street, NW, Suite 200, South, Washington, DC 20005 (202) 622-8662 9 10 CDFI 601 Thirteenth Street, NW, Suite 200, South, Washington, DC 20005 (202) 622-8662
RETAIL REPORT VIEWPOINT 2018 / COMMERCIAL REAL ESTATE TRENDS. By: Hugh F. Kelly, PhD, CRE IRR.COM AN INTEGRA REALTY RESOURCES PUBLICATION
 RETAIL REPORT VIEWPOINT 2018 / COMMERCIAL REAL ESTATE TRENDS By: Hugh F. Kelly, PhD, CRE Nowhere do we hear more discussion of disruption as in the retail property sector. Ecommerce has a powerful effect,
Real Estate Investor Market Research Report. Real Estate IRA Investment Trends & Insights
 2017 Real Estate Investor Market Research Report Real Estate IRA Investment Trends & Insights Contents Introduction... 2 Entrust IRA Real Estate Investment Trends... 3 Where Investors Bought Real Estate...
Rural Development Single Family Housing Guaranteed Loan Program Indiana Income Limits per Household Size
 Rural Development Single Family Housing Guaranteed Loan Program Indiana Income Limits per Household Size WA ME OR CA NV ID AZ UT MT WY CO NM ND SD NE KS MN WI IA MO OK AR IL MS MI OH IN KY TN AL GA WV
HOUSING DISCRIMINATION SURVEY
 HOUSING DISCRIMINATION SURVEY 1. Which part of the United States does your organization serve? (Feel free to check off more than one box.) Northwest (AK, WA, OR and ID). 11.7% 64 West (HI, CA, NV and AZ).
LUXURY MARKET REPORT. - May
 LUXURY MARKET REPORT - May 2018 - www.luxuryhomeing.com THIS IS YOUR LUXURY MARKET REPORT MAP OF LUXURY RESIDENTIAL MARKETS Welcome to the Luxury Report, your guide to luxury real estate market data and
Municipal Finance: Conditions, Local Responses, and Outlook for the Future
 Municipal Finance: Conditions, Local Responses, and Outlook for the Future Chris Hoene, Director, Policy & Research, National League of Cities Michael A. Pagano, Dean, College of Urban Planning & Public
STOCKTON, DETROIT, RIVERSIDE-SAN BERNARDINO POST TOP METRO FORECLOSURE RATES ACCORDING TO REALTYTRAC Q METROPOLITAN FORECLOSURE MARKET REPORT
 STOCKTON, DETROIT, RIVERSIDE-SAN BERNARDINO POST TOP METRO FORECLOSURE RATES ACCORDING TO REALTYTRAC Q3 2007 METROPOLITAN FORECLOSURE MARKET REPORT California, Florida and Ohio Cities Account for 17 of
LUXURY MARKET REPORT. - March
 LUXURY MARKET REPORT - March 2018 - www.luxuryhomeing.com THIS IS YOUR LUXURY MARKET REPORT MAP OF LUXURY RESIDENTIAL MARKETS Welcome to the Luxury Report, your guide to luxury real estate market data
Rx for Real Estate. elearning series. Upcoming elearning series
 Upcoming elearning series Kevin Russell Senior Vice President, Sales & Account Management Cartus Home Loans Donna Barber Manager, Sales/Account Management Support, Global Implementation Services, Cartus
2018 ECONOMIC OUTLOOK & REAL ESTATE FORECAST KEY POINTS LACEY MERRICK CONWAY, CCIM
 218 ECONOMIC OUTLOOK & REAL ESTATE FORECAST Presented by: LACEY MERRICK CONWAY, CCIM President/Principal Broker, Latter & Blum, Inc. KEY POINTS WHAT S DRIVING THE MARKET? REAL ESTATE TRENDLINE CURRENT
LUXURY MARKET REPORT. - March
 LUXURY MARKET REPORT - March 2018 - www.luxuryhomemarketing.com THIS IS YOUR LUXURY MARKET REPORT MAP OF LUXURY RESIDENTIAL MARKETS Welcome to the Luxury Market Report, your guide to luxury real estate
LUXURY MARKET REPORT. - February
 LUXURY MARKET REPORT - February 2018 - www.luxuryhomeing.com THIS IS YOUR LUXURY MARKET REPORT MAP OF LUXURY RESIDENTIAL MARKETS Welcome to the Luxury Report, your guide to luxury real estate market data
LUXURY MARKET REPORT. - January
 LUXURY MARKET REPORT - January 2018 - www.luxuryhomemarketing.com THIS IS YOUR LUXURY MARKET REPORT MAP OF LUXURY RESIDENTIAL MARKETS Welcome to the Luxury Market Report, your guide to luxury real estate
Hackman Chicago Infill Industrial Portfolio
 Hackman Chicago Infill Industrial Portfolio EXECUTIVE SUMMARY Robin Stolberg and Kurt Sarbaugh, licensed real estate brokers in the state of Illinois, along with Holliday Fenoglio Fowler, L.P. (collectively
U.S. Economic and Institutional Apartment Market Overview and Outlook. January 7, 2015
 U.S. Economic and Institutional Apartment Market Overview and Outlook January 7, 2015 Emerging Economic Trends Inflation Adjusted Crude Oil Prices In Alignment with Long-Term Average Price per Barrel (Nov.
Increasing Foreclosures Could Hurt Demand for Homes, Slowing Housing Recovery
 Release Date: April 22, 2010 February 2010 Quinn W. Eddins, Director of Research New Radar Logic data packages are available at /productsservices_analytics.html Increasing Foreclosures Could Hurt Demand
Pennsbury Professional Center 201 Woolston Drive Morrisville, PA
 Pennsbury Professional Center 201 Woolston Drive Morrisville, PA A VALUE-ADD MEDICAL OFFICE OPPORTUNITY WITH CONVENIENT ACCESS TO ROUTE 1 AND DENSE SURROUNDING POPULATION INVESTMENT SUMMARY Page 1 EXECUTIVE
Welcome. Introductions Nature Expectations Agenda Timing. Home Sweet Home 2
 Welcome Introductions Nature Expectations Agenda Timing Home Sweet Home 2 Objectives Role of Relocation Program Role of Housing Programs Budgeting Research Neighborhood Rent vs. Buy Decision Making Rental
OUR DETAIL IS RETAIL.
 OUR DETAIL IS RETAIL. GILBERT GROUP ADVANTAGE Rooted with local knowledge and experience strengthened by national reach. PROPERTY MANAGEMENT PROJECT LEASING TENANT REPRESENTATION GILBERT GROUP ABOUT US
National Foreclosure Report
 National Foreclosure Report FEBRUARY 2016 2.6% In February, the foreclosure inventory was down 2.6 percent from January 2016, representing 52 months of consecutive year-overyear declines. Job creation
Naturally Occurring Affordable Housing
 Naturally Occurring Affordable Housing NAAHL Annual Conference December 1, 2016 page 1 Slicing And Dicing Rental Housing U.S. Rental Housing Inventory By Units Rent Subsidized 3.3 Million 8% Market Rate
Do Family Wealth Shocks Affect Fertility Choices?
 Do Family Wealth Shocks Affect Fertility Choices? Evidence from the Housing Market Boom Michael F. Lovenheim (Cornell University) Kevin J. Mumford (Purdue University) Purdue University SHaPE Seminar January
The Subject Section. Chapter 2. Property Address
 Chapter 2 The Subject Section The SUBJECT section of the URAR introduces the appraisal assignment by presenting important information about the subject property. The SUBJECT section provides spaces for
MULTIFAMILY REPORT VIEWPOINT 2018 / COMMERCIAL REAL ESTATE TRENDS. By: Hugh F. Kelly, PhD, CRE IRR.COM AN INTEGRA REALTY RESOURCES PUBLICATION
 MULTIFAMILY REPORT VIEWPOINT 2018 / COMMERCIAL REAL ESTATE TRENDS By: Hugh F. Kelly, PhD, CRE Just when the upcycle for rental apartments seemed to be approaching its peak, along came the Tax Act of 2017,
Colliers International STUDENT HOUSING. National Sales Report Year End
 Colliers International STUDENT HOUSING National Sales Report 2016 Year End NATIONAL SALES In 2016 there were 330 recorded student housing transactions totaling over $6.6 billion in sales with an average
Metropolitan Area Statistics
 Metropolitan Area Statistics Apartment Completions 1Q 2011 1Q 2012 % Chg Atlanta - - n/a Boston 133 39-71% Chicago - 20 n/a Cleveland - - n/a Columbus - 272 n/a Dallas-Ft. Worth 604 1,059 75% Denver 328
LUXURY MARKET REPORT. - November
 LUXURY MARKET REPORT - November 2018 - www.luxuryhomeing.com THIS IS YOUR LUXURY MARKET REPORT MAP OF LUXURY RESIDENTIAL MARKETS Welcome to the Luxury Report, your guide to luxury real estate market data
August 14, Tucson s Investment Grade
 August 14, 2014 Tucson s Investment Grade Let s take a look at what Tucson features for national investors. Tucson has the large investment properties to offer. The largest transactions in the past decade
VERMONT S RENTAL HOUSING AFFORDABILITY GAP CONTINUES TO GROW The Average Vermont Renter Can t Afford a Modest 2-Bedroom Apartment
 vermont affordable housing coalition FOR IMMEDIATE RELEASE: June 13, 2016 CONTACT: Erhard Mahnke, 802.233.2902, erhardm@vtaffordablehousing.org Renée Sarao, 802.660.9484, renee.vahc@gmail.com VERMONT S
Pittsburgh Industrial Market Timeline
 INDUSTRIAL INDUSTRIAL Page 30 Pittsburgh Industrial Market Timeline 2015, 2016, 2017 2014 EXPANSION 2012, 2013 RECOVERY HYPERSUPPLY RECESSION Industrial Class A Local Markets by Vacancy TOP THREE BOTTOM
No Survey Required w/ Survey. Affidavit. Affidavit. Affidavit
 STATE Purchase Residential Refinance Residential Additional Information Survey Required: Survey Required: Alabama AL No survey required w/ Survey w/survey Alaska AK Yes Survey Required Survey required
OFFICE REPORT VIEWPOINT 2018 / COMMERCIAL REAL ESTATE TRENDS. By: Hugh F. Kelly, PhD, CRE IRR.COM AN INTEGRA REALTY RESOURCES PUBLICATION
 OFFICE REPORT VIEWPOINT 2018 / COMMERCIAL REAL ESTATE TRENDS By: Hugh F. Kelly, PhD, CRE The Office workplace is at the nexus of powerful cross-currents. Pricing has made CBD acquisitions, especially in
U.S. GDP (2012 Q Q2)
") U.S. GDP (2012 Q3 2014 Q2) U. S. Employment Employment Recovery Following the Last Two Downturns Rail Traffic: Containers Rail Traffic: Commodities Select Rail Traffic Residential Mortgages Pipeline of
U.S. GDP (2012 Q3 2014 Q2) U. S. Employment Employment Recovery Following the Last Two Downturns Rail Traffic: Containers Rail Traffic: Commodities Select Rail Traffic Residential Mortgages Pipeline of
Metropolitan Area Statistics (1Q 2013)
") Metropolitan Area Statistics (1Q 2013) Apartment Completions 1Q 2012 1Q 2013 % Chg Atlanta 487 1,460 200% Boston 360 373 4% Chicago 611 92-85% Cleveland 7 54 671 Columbus - 459 n/a Dallas-Ft. Worth 1,327
Metropolitan Area Statistics (1Q 2013) Apartment Completions 1Q 2012 1Q 2013 % Chg Atlanta 487 1,460 200% Boston 360 373 4% Chicago 611 92-85% Cleveland 7 54 671 Columbus - 459 n/a Dallas-Ft. Worth 1,327
MAMA Risk Summary Data through 2011 Q3
 MAMA Risk Summary Data through 2011 Q3 Table of Contents Report Contents... 2 Summary... 3 MAMA Risk Summary Indicators for Largest 50 Metro Areas... 4 Home Prices Risk Indicator Summary Map... 6 Employment
Winning with Foreclosures
 Buying Bank-Owned Foreclosures (REO) and Short Sales Courtesy of Name: Phone: Email: Diane Van Slyke 209.681.4275 ib4u@kw.com Terms you should know: 1. Distressed Property: This term refers to all pre-foreclosure
The Housing Market Report Card October 20, 2011 Tim Sullivan, Principal
 The Housing Market Report Card October 20, 2011 Tim Sullivan, Principal 1 The Housing Market Report Card For the School of Rock Hard Knocks October 26, 2011 Tim Sullivan, Principal 2 Agenda 1. Housing
County of Sonoma Agenda Item Summary Report
 Revision No. 20151201-1 County of Sonoma Agenda Item Summary Report Agenda Item Number: 32 (This Section for use by Clerk of the Board Only.) Clerk of the Board 575 Administration Drive Santa Rosa, CA
OCCUPIER SERVICES TEAM A SINGLE SOURCE FOR WORLD-CLASS REAL ESTATE OUTCOMES
 OCCUPIER SERVICES TEAM A SINGLE SOURCE FOR WORLD-CLASS REAL ESTATE OUTCOMES CBRE S PLATFORM LEADING GLOBAL BRAND AND LEADERSHIP WITH ROBUST CAPABILITIES 2 SPACE DISPOSITION (SALE) SPACE DISPOSITION (SUBLEASE)
The Gains from Right to Rent
 The Gains from Right to Rent Dean Baker and Hye Jin Rho July 2009 Center for Economic and Policy Research 1611 Connecticut Avenue, NW, Suite 400 Washington, D.C. 20009 202-293-5380 www.cepr.net CEPR The
HOW LONG WILL THE HOUSING DEMAND SURGE CONTINUE? WADE R. RAGAS, PHD MAI SRA REAL PROPERTY ASSOCIATES, (504) ( ) WADERAGAS.
 ( ) WADERAGAS.") HOW LONG WILL THE HOUSING DEMAND SURGE CONTINUE? WADE R. RAGAS, PHD MAI SRA REAL PROPERTY ASSOCIATES, (504) (324-3994) WADERAGAS.COM LOUISIANA EMPLOYMENT BY METRO AREA DECEMBER 2015, JANUARY 2015 AND JANUARY
HOW LONG WILL THE HOUSING DEMAND SURGE CONTINUE? WADE R. RAGAS, PHD MAI SRA REAL PROPERTY ASSOCIATES, (504) (324-3994) WADERAGAS.COM LOUISIANA EMPLOYMENT BY METRO AREA DECEMBER 2015, JANUARY 2015 AND JANUARY
National Foreclosure Report
 National Foreclosure Report OCTOBER 20 1.5% In October, the foreclosure inventory was down 1.5 percent from September 20, representing 48 months of consecutive year-overyear declines. Improved economic
Senior Title by Knud E. Hermansen P.L.S., P.E., Ph.D., Esq.
 Senior Title by Knud E. Hermansen P.L.S., P.E., Ph.D., Esq. Recently, I presented to surveyors a problem similar to the following: A to a pin on the easterly bank of Cedear Stream; thence along the stream,
STATE OF THE MULTIFAMILY MARKET MACRO VIEW
 STATE OF THE MULTIFAMILY MARKET MACRO VIEW JEANETTE I. RICE, CRE AMERICAS HEAD OF MULTIFAMILY RESEARCH APRIL 19, 2018 Westchester/ Fairfield 2 JEANETTE I. RICE STATE OF U.S. MULTIFAMILY MARKET KEY INVESTMENT
Foreclosures Continue to Bring Home Prices Down * FNC releases Q Update of Market Distress and Foreclosure Discount
 Foreclosures Continue to Bring Home Prices Down * FNC releases Q4 2011 Update of Market Distress and Foreclosure Discount The latest FNC Residential Price Index (RPI), released Monday, indicates that U.S.
Release Date: May 21, 2009 March Key Characteristics
 Release Date: May 21, 2009 March 2009 Key Characteristics The RPX 25-MSA Composite has stabilized since January 2009, after being in virtual freefall for much of 2008. The Composite declined only 0.3 percent
2017 RESIDENTIAL REAL ESTATE MARKET REPORT
 2017 RESIDENTIAL REAL ESTATE MARKET REPORT Published January 26, 2018 Our market reports have been focused on the effects of low inventory on our housing market and for good reason. December 2017 marked
The U.S. Housing Confidence Index
 March 2018 www.pulsenomics.com 2014-2018 Pulsenomics LLC Pulsenomics, Housing Confidence Survey, and Housing Confidence Index are trademarks of Pulsenomics LLC. HCI Each Housing Confidence Index (HCI)
PACE LAW SCHOOL LAND USE & SUSTAINABLE DEVELOPMENT CONFERENCE
 PACE LAW SCHOOL LAND USE & SUSTAINABLE DEVELOPMENT CONFERENCE PRESENTED BY: WILLIAM V. CUDDY, JR. December 8, 2016 Multifamily Residential Development as a driver and consequence of economic development
DEPARTMENT OF PROFESSIONAL AND OCCUPATIONAL REGULATION REAL ESTATE APPRAISER BOARD
 DEPARTMENT OF PROFESSIONAL AND OCCUPATIONAL REGULATION REAL ESTATE APPRAISER BOARD Report to the House Committee on General Laws Senate Committee on General Laws and Technology Housing Commission Evaluation
National Housing Trends
 National Housing Trends 34% America s Choice of Best Long Term Investment 26% 17% 15% 6% Real Estate Stocks / Mutual Funds Gold Savings Accounts / CDs Bonds Gallup 2018 Housing Affordability 197 Index
The Link Between Middle-Income Housing Affordability and Affordable Housing
 REBIC 2017 FORUM UNCC Downtown Charlotte Campus Wendell Cox 1 February 2017 The Link Between Middle-Income Housing Affordability and Affordable Housing The Link Between Middle-Income Housing Affordability
Bank of America Accused of Racial Discrimination in 30 U.S. Metropolitan Areas and 201 Cities
 FOR IMMEDIATE RELEASE August 31, 2016 Contact: Pamela Bond (202) 898-1661 pbond@nationalfairhousing.org Bank of America Accused of Racial Discrimination in 30 U.S. Metropolitan Areas and 201 Cities Civil
Zombie and Vacant Properties Remediation Initiative: Emerging Best Practices
 Zombie and Vacant Properties Remediation Initiative: Emerging Best Practices 1 Our Reach Office Locations Atlanta, GA Boston, MA Buffalo, NY Chicago, IL (LISC, NEF, NMSC) Cincinnati, OH Detroit, MI Duluth,
Goomzee Corporation Fall MLS Platforms. America s MLS Platform Vendors & Market Distribution. Goomzee Research
 Fall 2009 MLS Platforms America s MLS Platform Vendors & Market Distribution Goomzee s MLS Vendor Market Research Over 500 MLS organizations were polled in this research report. This was initially an internal
Your Key to New Homeownership
 Weichert, Realtors Your Key to New Homeownership Offices Across America Weichert, Realtors Preparation leads to success. What we will discuss today: Your wants and needs What s happening in the market
Housing Affordability: Local and National Perspectives
 University of Pennsylvania ScholarlyCommons 2018 ADRF Network Research Conference Presentations ADRF Network Research Conference Presentations 11-2018 Housing Affordability: Local and National Perspectives
A SIMULATION: MEASURING THE EFFECT OF HOUSING STIMULUS PROGRAMS ON FUTURE HOUSE PRICES
 Research Brief April 2010 First American CoreLogic A SIMULATION: MEASURING THE EFFECT OF HOUSING STIMULUS PROGRAMS ON FUTURE HOUSE PRICES www.facorelogic.com 800.345.7334 2009 First American CoreLogic,
OFFICE OF PERSONNEL MANAGEMENT. 5 CFR Part 531 RIN: 3206-AM88. General Schedule Locality Pay Areas
 This document is scheduled to be published in the Federal Register on 10/27/2015 and available online at http://federalregister.gov/a/2015-27380, and on FDsys.gov 6325-39 OFFICE OF PERSONNEL MANAGEMENT
SE Michigan Residential Real Estate Recovery Are we there yet or is it over?
 SE Michigan Residential Real Estate Recovery Are we there yet or is it over? Changing View of Residential Transactions Changing View of Residential Transactions 2015 Short Sales 3% Leases Bank 11% Owned
IRVINE, Calif. May 8, 2014
 ALL-CASH SHARE OF U.S. RESIDENTIAL SALES REACHES NEW HIGH IN FIRST QUARTER EVEN AS INSTITUTIONAL INVESTOR SHARE OF SALES DROPS TO LOWEST LEVEL SINCE Q1 2012 May 5, 2014 By RealtyTrac Staff All-Cash Purchases
By Vinney Chopra, CEO Moneil Investment & Management Group
 By Vinney Chopra, CEO Moneil Investment & Management Group If you want to know everything you need to start investing in multifamily syndications, look no further. Vinney Chopra is ready to share his wealth
In the early 1980s only a handful of community land trusts existed in the United States
 C h a p t e r 1 Introducing the CLT In the early 1980s only a handful of community land trusts existed in the United States nearly all located in rural areas. By 2008, more than 200 CLT programs were operating
Growing Demand for Smaller Industrial Properties
 Growing Demand for Smaller Industrial Properties Moderator: Lew Friedland, Colony Capital Panelists: Rene Circ, CoStar Portfolio Strategy Brian Fiumara, CBRE Andrew Mele, Trammell Crow Company #crec15
OFFICE OF PERSONNEL MANAGEMENT. 5 CFR Part 531 RIN 3206-AN64. General Schedule Locality Pay Areas
 This document is scheduled to be published in the Federal Register on 12/07/2018 and available online at https://federalregister.gov/d/2018-26519, and on govinfo.gov Billing Code: 6325-39-P OFFICE OF PERSONNEL
ECONOMIC CURRENTS. Vol. 3, Issue 1. THE SOUTH FLORIDA ECONOMIC QUARTERLY Introduction
 ECONOMIC CURRENTS THE SOUTH FLORIDA ECONOMIC QUARTERLY Introduction Economic Currents provides an overview of the South Florida regional economy. The report contains current employment, economic and real
WESTCHESTER COUNTY MARKET OVERVIEW AND DEVELOPMENT TRENDS
 WESTCHESTER COUNTY MARKET OVERVIEW AND DEVELOPMENT TRENDS PACE LAND USE LAW CENTER ANNUAL CONFERENCE PRESENTED BY: WILLIAM V. CUDDY, JR. December, 2017 PAGE 0 MULTIFAMILY RESIDENTIAL AND ECONOMIC DEVELOPMENT
Jim & Jim McKenna LBA & LSA TheJims.com
 Jim & Jim McKenna LBA & LSA 631-974-9151 TheJims.com Return on Investment January 2000 March 2013 MSN Money.com, Case Shiller Pending Home Sales 110 105 100 95 90 Jan Feb Mar Apr May Jun Jul Aug Sep Oct
RESA Reports. real estate Staging Pricing. Brought to you by the Real Estate Staging Association
 May 2015 RESA Reports real estate Staging Pricing Photo Courtesy of Moving Mountains Design Brought to you by the Real Estate Staging Association www.realestatestagingassociation.com Real Estate Staging
THINGS TO CONSIDER WHEN SELLING YOUR HOUSE SPRING 2018 EDITION
 THINGS TO CONSIDER WHEN SELLING YOUR HOUSE SPRING 2018 EDITION TABLE OF CONTENTS 3 5 Reasons To Sell This Spring WHAT'S HAPPENING IN THE HOUSING MARKET? 5 Lack Of Listings Slowing Down The Market 6 Buyer
February 2012 Real Estate Data
 1 of 10 4/4/2012 1:45 PM Real Estate Trends ly Housing Summary Official Site of the Hi! Sign In Sign Up 0 Listings 0 es Mobile Apps National Association of REALTORS Find Homes http://www.fortlauderdalebeachproperty.com
Real estate prices bottom, but remain stagnant
 Real estate prices bottom, but remain stagnant United States Index 2000Q4 = 100 200 180 Commercial RE prices 160 140 House prices 120 100 2001 2002 2003 2004 2005 Sources: Standard & Poor's and Fiserv,
Apartments: A $1.3 Trillion Market
 Apartments: A $1.3 Trillion Market A Research Report from the National Multi Housing Council Prepared by the Rosen Consulting Group Kenneth T. Rosen Susan U. Persin Daniel T. VanDyke Jeanine Kranitz This
Economic and Housing Market Outlook ( ) October 31, Contra Costa AOR
 October 31, Contra Costa AOR") Economic and Housing Market Outlook (2012 2013) Contra Costa AOR October 31, 2012 Oscar Wei Senior Research Analyst California Association of REALTORS Overview US and California Economies California Housing
Economic and Housing Market Outlook (2012 2013) Contra Costa AOR October 31, 2012 Oscar Wei Senior Research Analyst California Association of REALTORS Overview US and California Economies California Housing
CI 102: MARKET ANALYSIS FOR COMMERCIAL INVESTMENT REAL ESTATE
 CI INTRO: INTRODUCTION TO COMMERCIAL ANALYSIS 2013 COURSE SCHEDULE CI 102: MARKET ANALYSIS FOR CI 104: INVESTMENT ANALYSIS FOR San Francisco CA Apr 4-5 Atlanta GA Apr 25-26 Las Vegas NV May 2-3 Washington
Housing, Construction, and Remodeling Update. Toby Morrison Director of Insights Metrostudy October 12, 2013
 Housing, Construction, and Remodeling Update Toby Morrison Director of Insights Metrostudy October 12, 2013 New Home Sales (Units) "Pro-Worthy" R&R Projects New Homes Sales and Remodeling Are Firmly on
November November 2012
 NAREIT REIT World NAREIT REIT World November 2012 November 2012 1 Company Overview Multifamily NOI Current: 86% Target: 90% Multifamily Portfolio 35,067 apartment homes 115 apartment communities 96.4%
U.S. MULTIFAMILY MARKETVIEW FIGURES Q4 2016
 U.S. MULTIFAMILY MARKETVIEW FIGURES Q4 2016 U.S. MULTIFAMILY MARKETVIEW Q4 2016 2016 DELIVERS IMPRESSIVE DEMAND AND NEW SUPPLY TOTALS Vacancy Rate 4.9% Net Absorption* 201,000 Units Rentable Completions*
Project Thunderbird Property Company II, LLC
 C O N F I D E N T I A L J U N E 2 0 1 8 R E A L E S T A T E I N V E S T M E N T O F F E R I N G Project Thunderbird Property Company II, LLC Investment Offering Toys R Us (the Company ) has retained Lazard
Housing Price Forecasts. Illinois and Chicago PMSA, December 2015
 Housing Price Forecasts Illinois and Chicago PMSA, December 2015 Presented To Illinois Association of Realtors From R E A L Regional Economics Applications Laboratory, Institute of Government and Public
The CoStar Office Report
 DCN:6155 The CoStar Office Report T H I R D Q U A R T E R 2 0 0 4 National Office Market Table of Contents Table of Contents.................................................................... A Methodology........................................................................
Real gross domestic product California vs. United States
 Real gross domestic product California vs. United States Percent change, year ago 6 4 U.S. California 2 0-2 -4-6 2001 2002 2003 2004 2005 2006 2007 2008 2009 2010 2011 Source: Bureau of Economic Analysis.
Emerging Trends in Real Estate 2014
 Emerging Trends in Real Estate 2014 Emerging Trends is the industry s most predictive forecast 35th annual outlook Based on over 1,000 interviews and surveys of industry leaders Sponsored by PwC and the
Western Economic Developments
 IN THIS ISSUE F E D E R A L R E S E R V E B A N K O F S A N F R A N C I S C O Western Economic Developments Office market slumps, housing demand remains strong in District Figure, panel B: Commercial office
SAVI TALKS HOUSING: How Indy s affordable housing market is changing and why it matters. Photo courtesy of Near East Area Renewal
 SAVI TALKS HOUSING: How Indy s affordable housing market is changing and why it matters Photo courtesy of Near East Area Renewal Getting past the misperception Pruiett - Igoe Pruitt-Igoe, built in 1954
National Housing Trends
 National Housing Trends 34% America s Choice of Best Long Term Investment 26% 17% 15% 6% Real Estate Stocks / Mutual Funds Gold Savings Accounts / CDs Bonds Gallup 2018 Total Existing Home Sales in thousands
False Sense of Security
 False Sense of Security The Failure of Increased Security Deposits in Converting and Assuring Payment Performance from Conditionally Approved Apartment Renters Executive Summary For many hard working American
Monthly Indicators + 4.8% - 3.5% %
 Monthly Indicators 2015 New Listings were up 45.0 percent for single family/duplex homes but decreased 44.1 percent for townhouse-condo properties. Pending Sales increased 14.3 percent for single family/duplex
Market Trends and Outlook
 Residential Remodeling Market Trends and Outlook Kermit Baker Remodeling Futures Conference April 3, 2012 Remodeling Market Overview 1. Home improvement spending totaled an estimated $290 billion last
Titling Reform: How States Can Attract Investment in Manufactured Homes
 Titling Reform: How States Can Attract Investment in Manufactured Homes SUMMARY The new Duty to Serve rule adopted by the Federal Housing Finance Agency (FHFA) will give mortgage giants Fannie Mae and
Cost of Living Comparisons: Valdosta, Georgia, and the Nation Third Quarter 2009 October 23, 2009
 Overview In the third quarter of 2009, survey data suggest that the cost of living for middle management households in Georgia communities is about 8.3 percent less, on average, than in the rest of the
THINGS TO CONSIDER WHEN SELLING YOUR HOUSE. Licensed Brokers MA and FL SUMMER 2018 EDITION
 THINGS TO CONSIDER WHEN SELLING YOUR HOUSE Licensed Brokers MA and FL SUMMER 2018 EDITION TABLE OF CONTENTS 3 5 Reasons To Sell This Summer WHAT'S HAPPENING IN THE HOUSING MARKET? 5 6 7 8 10 Lack Of Listings
Zillow Group Uncovers
 Zillow Group Uncovers Economic Trends in MF Housing Svenja Gudell, Zillow Chief Economist @SvenjaGudell svenjag@zillow.com June 15-18, 2016 Moscone Convention Center San Francisco Rents continue to grow,
THINGS TO CONSIDER WHEN SELLING YOUR HOUSE FALL 2018 EDITION
 THINGS TO CONSIDER WHEN SELLING YOUR HOUSE FALL 2018 EDITION 3 WHAT'S HAPPENING IN THE HOUSING MARKET? 5 6 8 Home Prices Over The Last Year The Real Reason Home Prices Are Increasing 651,000 Homeowners
Cottage Food Laws as of December 2014
 Cottage Food Laws as of December 2014 State Primary Statute Foods Allowed Revenue Venue Restrictions Additional requirements: These are just highlights, please Limit check your state law and any local
Economic Highlights. Payroll Employment Growth by State 1. Durable Goods 2. The Conference Board Consumer Confidence Index 3
 August 26, 2009 Economic Highlights Southeastern Employment Payroll Employment Growth by State 1 Manufacturing Durable Goods 2 Consumer Spending The Conference Board Consumer Confidence Index 3 Real Estate