UNDERSTANDING CALIFORNIA LUXURY CLIENTS. February 27, 2014 Oscar Wei, Senior Research Analyst
|
|
|
- Marjory Harmon
- 5 years ago
- Views:
Transcription
1 UNDERSTANDING CALIFORNIA LUXURY CLIENTS February 27, 2014 Oscar Wei, Senior Research Analyst


2 Sales of Existing Detached Homes California, Jan Sales: 363,640 Units, -13.8%YTD, -13.8%YTY 700, , , , , , ,000 - SERIES: Sales of Existing Single Family Homes SOURCE: CALIFORNIA ASSOCIATION OF REALTORS *Sales are seasonally adjusted and annualized

3 Median Price of Existing Detached Homes California, January 2014: $410,990, Up 22.1%YTY $700,000 P: May-07 $594,530 $600,000 $500,000 $400,000 $300,000 T: Feb-09 $245,230-59% from peak $200,000 $100,000 $- SERIES: Median Price of Existing Single Family Homes SOURCE: CALIFORNIA ASSOCIATION OF REALTORS


4 Sales of Existing Detached Homes California 2013 Sales: 413,870 Units, Down 5.9%YTY 700,000 ANNUALLY 600, , , , , ,000 0 SERIES: Sales of Existing Single Family Homes SOURCE: CALIFORNIA ASSOCIATION OF REALTORS *Sales are seasonally adjusted and annualized


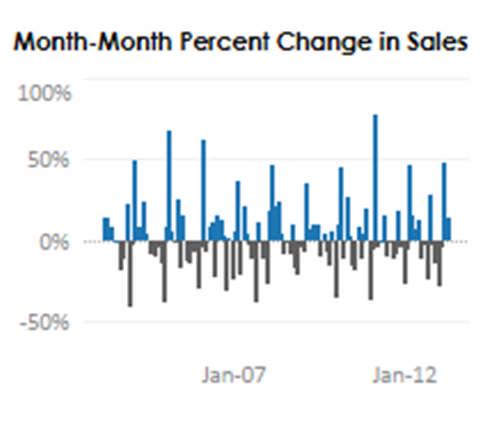
5 Sales: Luxury home vs. the Rest of the Market Sales of $1M and Up Sales Under $1M 25,000 20,000 15,000 10,000 5, : Up 35.5% 225, : Down 8.4% 220, , , , , , , SOURCE: CALIFORNIA ASSOCIATION OF REALTORS

6 Change in Sales by Price Range (Year-to-Year) 50% Jan % 40% 30% 23.7% 20% 10% 8.0% 0% -10% -6.4% -20% -30% -40% -35.1% $0 - $300k $300 - $500k $500 - $750k $750 - $1000k $1000k+ SERIES: Sales of Existing Detached Homes SOURCE: CALIFORNIA ASSOCIATION OF REALTORS


7 Sales Share by Price Range 60% Jan-13 Jan-14 50% 48% 40% 37% 30% 28% 30% 20% 10% 14% 18% 7% 5% 5% 9% 0% $0 - $300k $300 - $500k $500 - $750k $750 - $1000k $1000k+ SERIES: Sales of Existing Detached Homes SOURCE: CALIFORNIA ASSOCIATION OF REALTORS
8 Unsold Inventory Index California, January 2014: 4.3 Months Note: Unsold Inventory Index represents the number of months it would take to sell the remaining inventory for the month in question. The remaining inventory for the month is defined as the number of properties that were Active, Pending, and Contingent (when available) and divide the sum by the number of Sold properties for the month in question. SERIES: Unsold Inventory Index of Existing Single Family Homes SOURCE: CALIFORNIA ASSOCIATION OF REALTORS

 and divide the sum by the")
9 Unsold Inventory Index By Price Range California, Jan 2013 vs. Jan 2014 Last Year This Year $1,000K $ K $ K $ K $0-300K Note: Unsold Inventory Index represents the number of months it would take to sell the remaining inventory for the month in question. The remaining inventory for the month is defined as the number of properties that were Active, Pending, and Contingent (when available) and divide the sum by the number of Sold properties for the month in question. SERIES: Unsold Inventory Index of Existing Single Family Homes SOURCE: CALIFORNIA ASSOCIATION OF REALTORS

10 Unsold Inventory Index By Price Range California, Dec 2013 vs. Jan 2014 Dec-13 Jan-14 $1,000K $ K $ K $ K $0-300K Note: Unsold Inventory Index represents the number of months it would take to sell the remaining inventory for the month in question. The remaining inventory for the month is defined as the number of properties that were Active, Pending, and Contingent (when available) and divide the sum by the number of Sold properties for the month in question. SERIES: Unsold Inventory Index of Existing Single Family Homes SOURCE: CALIFORNIA ASSOCIATION OF REALTORS
11 Unsold Inventory Index (Months) Price Range (Thousand) Jan-14 Dec-13 Jan-13 $1,000K $ K $ K $ K $0-300K Note: Unsold Inventory Index represents the number of months it would take to sell the remaining inventory for the month in question. The remaining inventory for the month is defined as the number of properties that were Active, Pending, and Contingent (when available) and divide the sum by the number of Sold properties for the month in question. SERIES: Unsold Inventory Index of Existing Single Family Homes SOURCE: CALIFORNIA ASSOCIATION OF REALTORS
12 Unsold Inventory Index (Months) Price Range (Thousand) $1,000K $ K $ K $ K $0-300K Note: Unsold Inventory Index represents the number of months it would take to sell the remaining inventory for the month in question. The remaining inventory for the month is defined as the number of properties that were Active, Pending, and Contingent (when available) and divide the sum by the number of Sold properties for the month in question. SERIES: Unsold Inventory Index of Existing Single Family Homes SOURCE: CALIFORNIA ASSOCIATION OF REALTORS

13 Change in Inventory by Price Range (Year-to-Year) 40% Jan-14 30% 20% 21.9% 30.9% 24.3% 10% 11.1% 0% -10% -20% -13.4% $0 - $300k $300 - $500k $500 - $750k $750 - $1000k $1000k+ SERIES: Inventory of Existing Single Family Homes SOURCE: CALIFORNIA ASSOCIATION OF REALTORS
14 Survey Methodology 730 online surveys were received in November Respondents are Luxury clients who purchase/sell a home for over one million dollars. Maximum sampling error: ±3.5 percent at two standard deviations (a 95% confidence level).
15 PROFILE OF LUXURY CLIENTS
16 Type of Client Represented Buyer Seller Both 18% 41% 40% Q: Who did you represent in your last transaction?


17 TheTypical Luxury Client 74% College Educated 92% permanently reside in the United States 53Years Old 48% Single 71% Caucasian $350K Median Income
18 AboutThree-Quarters of LuxuryClients had a Post- Secondary Education 2.4% 8.1% Some High School 32.5% 13.0% High School Some College 2.4% Vocational/Technical School Four-Year College 41.5% Graduate School Q. What is the highest level of education your client had completed at the time of your last luxury transaction?

19 Singles made up 48% of LuxuryClients in % 45% 40% 35% 30% 25% 20% 15% 10% 5% 0% Married Single Other
20 Over 70% of Luxury Clients werewhite Buyers Sellers 80% 70% 60% 50% 40% 30% 20% 10% 0% 2% 2% 7% 16% 74% 73% 7% 7% 2% 5% 2% 3%
21 Client Profiles Luxury Buyers Traditional Buyers Luxury Sellers Traditional Sellers Age 46Years 38 Years 60Years 46Years Median Household Income Marital Status Single (57%); Married (24%) $350K $125K $275K $140K Single (37%); Married (63%) Single (44%); Married (30%) Single (32%); Married (48%)
22 Over 70% of Luxury Buyers werewhite Luxury Buyers 80% 70% 60% 50% 40% 30% 20% 10% 0% Traditional Buyers 74% 37% 28% 2% 8% 7% 26% 7% 7% 1% 2% 0%
23 Over 70% of Luxury Sellers werewhite Luxury Sellers 80% 70% 60% 50% 40% 30% 20% 10% 0% Traditional Sellers 73% 36% 26% 25% 12% 2% 16% 2% 5% 0% 3% 0%


24 Majority of Luxury HomeTransactions are not the Client s First Home Purchase Luxury Homes First-Time Buyer All Homes Repeat Buyer % First-Time Home Buyers Long Run Average 50% 15% 40% 28% 30% 20% 85% 10% 0% Q. Was your last luxury transaction the client's first home purchase? SERIES: 2013 Annual Housing Market Survey and 2013 Luxury Clients Survey SOURCE: CALIFORNIA ASSOCIATION OF REALTORS


25 More than four of five luxury repeat buyers owned more than one property 40.0% 38% 35.0% 30.0% Mean: 2.4 properties 25.0% 20.0% 15.0% 21% 17% 10.0% 9% 9% 5.0% 5% 0.0% Q. How many other properties does your last luxury client own?

26 International BuyersAre Purchasing Properties in California 9% 8% 8% 7% 6% 5% 5% 4% 3% 2% 1% 0% Luxury Homes All Homes SERIES: 2013 Housing Market Survey and 2013 Luxury Clients Survey SOURCE: CALIFORNIA ASSOCIATION OF REALTORS
27 PROFILE OF LUXURY PROPERTIES!
28 Majority of LuxuryTransactions weretraditional Sales 3.9% Other 3.0% Short Sale Foreclosure 0.1% 2.7% REO/bank-owned 90.3% Regular/Tradtional/Equity Sale 0% 10% 20% 30% 40% 50% 60% 70% 80% 90% 100%
29 PropertyType Luxury Homes SFH Condo/Townhomes All Homes Others SFH 6.3% Condo/Townhomes 6.0% 7.6% 16.3% 86.1% 77.7% Others
30 Luxury properties often had a hilltop or ocean view Hilltop 41% Ocean view 28% Golf course 16% Mountain area 12% Oceanfront 10% Resort area 9% Lakefront 4% Ski resort 1% 0% 5% 10% 15% 20% 25% 30% 35% 40% 45%
31 Luxury Buyers intended Largely to use their Luxury Homes as their Primary Residence 90% 80% 79% 70% 60% 50% 40% 30% 20% 10% 10% 9% 2% 0% Primary Residence Vacation/Second Investment/Rental Home Property Other
32 PropertyValue Breakdown 80% 76% 70% 60% Median Price: $1,375,000 50% 40% 30% 20% 13% 10% 6% 3% 3% $5M - $10M $10M+ 0% $1M - $2M $2M - $3M $3M - $5M
33 BUYING AND SELLING PROCESS
34 BUYING

35 Main Reasons for Purchasing a Home Traditional Buyers Luxury Home Buyers 25% Desired Larger Home 20% Desired Better/Other Location Change in Family Status 11% Changed Jobs/Relocated 11% Investment/Tax Advantages 5% Desired Smaller Home 5% To Rent it Out 2% Affordable Price 2% 0% 15% Desired Better Location Change in Family Status 4% Desired Smaller Home 4% Changed Jobs 4% Retirement/Move to Retirement Community 3% 2% Foreclosure/Short Sale/Default 10% 9% Other 11% Other 17% Desired Larger Home 3% To Flip it for a Profit 21% Investment/ Tax Considerations 6% Tired of Renting 23% Tired of Renting 20% 30% Q. What primarily motivated the client in your last luxury transaction to buy within the past year? 0% 10% 20% 30%
36 Reasons for Buying All Homes FirstTime HomebuyersVs. Repeat Homebuyers First-Time Buyers 0% 10% Repeat Buyers 20% 30% Tired of Renting Desired Larger Home Investment/ Tax Considerations Desired Better Location Change in Family Status Changed Jobs Foreclosure/Short Sale/Default Desired Smaller Home Retirement/Move to Retirement Community Other Q. What was the single most important reason for selling/buying the property? SERIES: 2013 Housing Market Survey SOURCE: CALIFORNIA ASSOCIATION OF REALTORS 40% 50% 60%

37 The Median Number ofyears that Luxury Buyers Intended to Keep the Property was Traditional 10 Luxury Q. How many years does the client in your last luxury transaction intend to keep the property?

38 One Third of Luxury Buyers Paid withallcash 40% 35% % of All Cash Sales 35% 30% 27% 25% 20% 15% More than a third of luxury buyers paid with all cash The share of all cash buyers had been on the rise for overall sales until this year 10% 5% 0% SERIES: 2013 Housing Market Survey and 2013 Luxury Clients Survey SOURCE: CALIFORNIA ASSOCIATION OF REALTORS Luxury Buyers Traditional Buyers

39 Luxury BuyersTypically Pay More Down Payment thantraditional Buyers The average down payment for luxury buyers is 30 percent of the sale price Down Payment The average down payment for traditional home buyers is 25 percent of the sale price

40 Majority of Luxury HomeClients used their Personal Savings as the source of their down payment 8.0% 1.4% 7.1% 27.8% Proceeds from a Previous Investment Personal Savings 1031 Exchange Other Don't Know/Unsure 55.7% What was the source of the down payment in your last luxury transaction?
41 Source of Down Payment Breakdown by Buyer Type First-Time Buyers Repeat Buyers Luxury Buyers Personal Savings 70.5% 55.7% 55.7% Proceeds from a Previous Investment/Residence 0.0% 24.6% 27.8% Other 29.5% 19.7% 16.5%
42 Differences in Financing 65 percent of luxury buyers obtained financing to purchase their luxury home Approximately 73 percent of traditional homebuyers obtained financing These results are not surprising given that luxury clients tend to be in higher income brackets and more able to pay all cash for a house

43 Difficulty inobtaining Financing (1=Very Easy to 10=Very Difficult) 9 Traditional Buyer 4 Luxury Buyers Q. Please rate how difficult it was for the client in your last luxury transaction to obtain financing.

44 Luxury clients utilized their personal contacts to find their agents. 100% 90% 80% 70% Other 60% Internet 50% 40% Advertising 30% Relationships/Contacts /Referrals 20% 10% 0% Tradtional Buyer Tradtional Seller Luxury Client Q. How did you find the client in your last luxury transaction?


45 How Agents Find Luxury Clients Client is a friend 18% Referral from a friend 15% Referral from a previous buyer 12% Referral from another agent 9% Prior dealings with my brokerage 8% Previous Client 8% Open House 7% Client found me online 7% Client is a relative 4% Client responded to my ad 3% For Sale Sign 2% Other 10% 0% 5% Q. How did you find your client in your last luxury transaction? 10% 15% 20%
46 Agents spent about 5 weeks on average looking for properties with their luxury buyers Weeks A luxurybuyer typically viewed 10 properties with his/her agent before making a home purchase. A traditional buyer viewed 10 properties with his/her agent before making a home purchase 0 Luxury Buyers Traditional Buyers Q. How many weeks did you spend looking for a property with your client in your last luxury transaction? Q. How many properties did you view with your client prior to the client making a purchase in your last transaction?

47 Luxury Home Buyer Made FewerOffersThan a Typical Home Buyer # of Offers Made on Other Properties Luxury Buyers 35% Median # of Offers Traditional Buyers 30% 3 Traditional Buyers 25% 20% 15% 10% 1 Luxury Buyers 5% 0% Q. How many offers did your last client make on other properties?
48 SELLING

49 Main Reasons for Selling Luxury Home Change in Family Status 18% Desired Smaller Home 18% Changed Jobs/Relocated 13% Desired Better/Other Location 12% Desired Larger Home 9% To Flip it for a Profit 5% No Longer Wanted/Needed a Vacation Property 4% Investment/Tax Advantages 4% Affordable Price 2% Other 15% 0% 2% 4% 6% 8% 10% 12% 14% 16% 18% 20% Q. What primarily motivated the client in your last luxury transaction to sell within the past year?
50 Traditional Sellers - Reasons for Selling Foreclosure/Short Sale/Default 16% Desired Larger Home 13% Change in Family Status 12% Desired Better Location 11% Investment/ Tax Considerations 11% Retirement/Move to Retirement Community 10% Changed Jobs 6% Desired Smaller Home 6.0% Other 17% 0% 2% 4% 6% Q. What was the single most important reason for selling the property? 8% 10% 12% 14% 16% 18%
51 Luxury SellersTypically KeepTheir Properties Longer thantraditionalsellers 8 Traditional Sellers 10 Luxury Sellers How many years did the seller own the property in your last luxury transaction?

52 Luxury Home Sellers Received FewerOffersThan Traditional Home Sellers # of Offers Made on Other Properties Luxury Sellers 35% Median # of Days on Market Traditional Sellers Median # of offers received by luxury sellers: 2 Median # of offers received by traditional sellers: 3 30% 11 Traditional Sellers 25% 20% 15% 10% 30 Luxury Sellers 5% 0% Q. How many offers did your last client received? 6 or more

53 Over aquarter of Luxury Homes SoldAboveAsking Price 60% Luxury Homes All Homes 50% 50% A luxuryhome typically sold with 1 percent discount below its asking price in 2013 A traditional home typically sold with 0 percent discount below its asking price in % 30% 27% 20% 10% 0% % of Sales Above Asking Price Q. What was the initial/listing price of your last transaction? Q. What was the final sales price of your last transaction?


54 Over 9 out of 10 Properties were marketed through an MLS MLS 91% Open House 37% Advertisement 35% Private Listing 10% Builder/Developer 4% Other 10% 0% 20% 40% 60% Q. How was the property in your last luxury transaction marketed? Select all that apply. 80% 100%

55 Marketing through the MLS was still the most effective way to sell a Luxury property. MLS Open House Private Listing Advertisement Builder/Developer Other 0% 10% 20% 30% 40% 50% 60% Q. Which of these marketing techniques was most effective in your last luxury transaction? 70%


56 The MedianAmount spent on marketing a luxury property was $1, % Photographer 11% 47% 1% Videographer Designer Architect Other None 14% 13% Q. Which of the following professionals did you hire to help assist you market the property in your last luxury transaction? Select all that apply.
57 Marketing Breakdown The median amount that sellers spent on a photographer was 300 dollars. The median amount that sellers spent on a videographer was 250 dollars. The median amount that sellers spent on a designer was 500 dollars.
58 Luxury Home PricesAre Expected to Increase Luxury Buyer Traditional Buyer Luxury Seller Traditional Seller Up 71% 36% 67% 43% Down 1% 20% 2% 21% Flat/Unsure 27% 44% 31% 36% Up 79% 60% 76% 58% Down 3% 17% 3% 23% Flat/Unsure 18% 23% 21% 19% 1Year 5Years Q Do you think home prices in the neighborhood where you purchased will go up, down, or stay flat in one year, in five years?

59 What LuxuryClients Needed the MostAssistance with?
60 CONCLUDING REMARKS
61 TheTakeaway Sales of luxury properties will grow steadily as the economy continues to improve International buyers are purchasing high-end properties in California Luxury clients need help, especially in the negotiation process Keep in touch with your clients


62 Join us for our next webinar Understanding International Clients Thursday, March 27, :00 PM - 3:00 PM To register:
63


64 For more information:


65 For more information:
739-8383 financehelpline@car.org")
66 The Finance Helpline FREE Member Benefit Provides one-on-one help Direct Line to Lenders Being a member of C.A.R. for 27 years, this member service, by far, in my humble opinion, is the next best thing to having a license in this climate. Bravo! - REALTOR finance.car.org (213) financehelpline@car.org

67 Navigate Mortgage Hurdles at the C.A.R. Finance Helpline Workshop March 20, 2014 Los Angeles Convention Center 9a.m. to 5p.m. Register now $39! At the door $49. Details: car.org/meetings/financeworkshops


68 Mortgage Resource Directory mortgage.car.org


69 Delivered online available 24/7 Choose from over 20 courses Learn from most tablet devices Accredited by the CalBRE A member benefit from C.A.R. store.car.org/12freece

70 Get Results with Social Media! Let our personal concierge service: Plan your campaigns Upload and add your contacts Regularly post engaging content Advise on growing fans and followers Track and train YOU for success One-on-one with a personal concierge any time Clarus.socialmadesimple.com or Call
71 THANKYOU!
WORKINGEFFECTIVELYWITHTODAY S APPRAISERS. December 19, 2013 Oscar Wei Senior Research Analyst
 WORKINGEFFECTIVELYWITHTODAY S APPRAISERS December 19, 2013 Oscar Wei Senior Research Analyst Problems reported by REALTORS : Out-of-town appraisers who are not familiar with the local market conditions
Economic and Housing Market Outlook ( ) October 31, Contra Costa AOR
 October 31, Contra Costa AOR") Economic and Housing Market Outlook (2012 2013) Contra Costa AOR October 31, 2012 Oscar Wei Senior Research Analyst California Association of REALTORS Overview US and California Economies California Housing
Economic and Housing Market Outlook (2012 2013) Contra Costa AOR October 31, 2012 Oscar Wei Senior Research Analyst California Association of REALTORS Overview US and California Economies California Housing
California Housing Market Update. Monthly Sales and Price Statistics January 2018
 California Housing Market Update Monthly Sales and Price Statistics January 2018 Sales Started with a Slight Decrease California, Jan. 2018 Sales: 388,800 Units, -2.9% YTD, -2.9% YTY 700,000 600,000 500,000
2013 Housing Market Forecast. SILVAR: Los Gatos/Saratoga District October 10, 2012 Leslie Appleton-Young, Vice President & Chief Economist
 2013 Housing Market Forecast SILVAR: Los Gatos/Saratoga District October 10, 2012 Leslie Appleton-Young, Vice President & Chief Economist What we saw from the roof.. C.A.R. NAR THE ECONOMY Recent Housing
California Housing Market Update. Monthly Sales and Price Statistics October 2018
 California Housing Market Update Monthly Sales and Price Statistics October 2018 Sales Had the 2 nd Largest Drop in the Last 6 Months California, October 2018 Sales: 397,060 Units, -3.7% YTD, -7.9% YTY
California Housing Market Update. Monthly Sales and Price Statistics August 2018
 California Housing Market Update Monthly Sales and Price Statistics August 2018 Sales Declined for the 4 th Consecutive Month California, August 2018 Sales: 399,600 Units, -2.1% YTD, -6.6% YTY 700,000
2011 Survey of California Home Buyers
 2011 Survey of California Home Buyers The copyright laws of the United States (Title 17 U.S. Code) forbid the unauthorized reproduction of this report by any means, including facsimile or computerized
California Housing Market Update. Monthly Sales and Price Statistics December 2018
 California Housing Market Update Monthly Sales and Price Statistics December 2018 Sales Reached the Lowest Level since Jan 2015 California, December 2018 Sales: 372,260 Units, -5.2% YTD, -11.6% YTY 700,000
California Housing Market Update. Monthly Sales and Price Statistics November 2018
 California Housing Market Update Monthly Sales and Price Statistics November 2018 Home Sales: Largest Decline Since 2014 California, November 2018 Sales: 381,400 Units, -4.6% YTD, -13.4% YTY 700,000 600,000
California Housing Market Update. Monthly Sales and Price Statistics September 2018
 California Housing Market Update Monthly Sales and Price Statistics September 2018 Sales Had the Largest Decline since March 2014 California, September 2018 Sales: 382,550 Units, -3.3% YTD, -12.4% YTY
2018 Housing Market Outlook. Central Coast Realty Group Business Symposium February 22, 2018 Oscar Wei Senior Economist
 2018 Housing Market Outlook Central Coast Realty Group Business Symposium February 22, 2018 Oscar Wei Senior Economist Overview Economic Update California Housing Market Outlook Regional Housing Market
California Housing Market Update. Monthly Sales and Price Statistics May 2018
 California Housing Market Update Monthly Sales and Price Statistics May 2018 Sales Lost Momentum as Mortgage Rates Continued to Climb California, May 2018 Sales: 409,270 Units, +0.3% YTD, -4.6% YTY 700,000
2013 Profile of Home Buyers and Sellers Metro Indianapolis Report
 Prepared for: Metro Indianapolis Board of REALTORS Prepared by: Research Division December 2013 Table of Contents Introduction... 2 Highlights... 3 Conclusion... 6 Methodology..7 Report Prepared by: Jessica
2012 Profile of Home Buyers and Sellers Texas Report
 2012 Profile of Home and Sellers Report Prepared for: Association of REALTORS Prepared by: NATIONAL ASSOCIATION OF REALTORS Research Division December 2012 2012 Profile of Home and Sellers Report Table
REAL ESTATE TECH TRENDS
 By Properties Online, Inc. 2018 Real Estate Tech Trends Properties Online, Inc. has compiled important statistical information for the real estate community. Statistical sources include the 2017 National
The home ownership rate is 64.3%. Existing home sales are 82% back to normal. New construction starts are 53% back to normal, up from 46% a year ago.
 Brian Buffini s Real Estate Report PAGE 1 INDUSTRY FACTS MEDIAN DAYS ON THE MARKET: 39 Days in April 2015 vs. Home sales in April reached a seasonally adjusted rate of 5.04 million, an increase of 6.1%
2013 CALIFORNIA HOUSING MARKET OUTLOOK. Santa Barbara AOR February 6, Leslie Appleton-Young, C.A.R. Chief Economist
 2013 CALIFORNIA HOUSING MARKET OUTLOOK Santa Barbara AOR February 6, 2013. Leslie Appleton-Young, C.A.R. Chief Economist 2013 New Member Benefit: 12 FREE Hours Online CE Courses C.A.R. s newest member
Investment and Vacation Home Buyers Survey 2011
 NATIONAL ASSOCIATION OF REALTORS Investment and Vacation Home Buyers Survey 2011 The Voice for Real Estate 2011 NAR Investment And Vacation Home Buyers Survey NATIONAL ASSOCIATION OF REALTORS 2011 NAR
2013 Profile of Home Buyers and Sellers Texas Report
 2013 Profile of Home Buyers and Sellers Report Prepared for: Association of REALTORS Prepared by: NATIONAL ASSOCIATION OF REALTORS Research Division December 2013 2013 Profile of Home Buyers and Sellers
Annual Report On Our National Real Estate Market
 A TWINCITIESPROPERTYFINDER.COM RESOURCE Annual Report On Our National Real Estate Market 1 Contents Industry Facts 3 Mortgage Stats 4 Distressed Properties & Price Information 5 Today s Buyer 6 First-Time
2012 Profile of Home Buyers and Sellers New Jersey Report
 Prepared for: New Jersey Association of REALTORS Prepared by: Research Division December 2012 Table of Contents Introduction... 2 Highlights... 4 Conclusion... 7 Report Prepared by: Jessica Lautz 202-383-1155
Contents. off the fence. It s a good life!
 I hope you enjoy the latest edition of Brian Buffini s Real Estate Report. The goal of this piece is to help you stay educated on today s market and position yourself as a true professional and your clients
2016 ECONOMIC AND HOUSING MARKET FORECAST
 2016 ECONOMIC AND HOUSING MARKET FORECAST April 06, 2016 San Francisco Association of REALTORS Oscar Wei, Senior Economist of C.A.R. OVERVIEW Economic Outlook California Housing Market Outlook Regional
ALTA Webinar: The Profile of Home Buyers and Sellers. Jessica Lautz National Association of REALTORS January 29, 2015
 ALTA Webinar: The Profile of Home Buyers and Sellers Jessica Lautz National Association of REALTORS January 29, 2015 Methodology Survey conducted with recent home buyers who purchased a home between July
CALIFORNIA ECONOMIC & MARKET OUTLOOK. October 29,2014 Contra Costa Association of REALTORS Leslie Appleton Young, Chief Economist
 2014 2015 CALIFORNIA ECONOMIC & MARKET OUTLOOK October 29,2014 Contra Costa Association of REALTORS Leslie Appleton Young, Chief Economist OVERVIEW Economic Outlook California Housing Market Outlook Housing
2019 Housing Market Forecast. Palos Verdes Peninsula AOR January 8, 2019 Jordan G. Levine Senior Economist
 2019 Housing Market Forecast Palos Verdes Peninsula AOR January 8, 2019 Jordan G. Levine Senior Economist Overview Good News: Economic fundamentals solid Homeownership still the dream Rates might not go
2008 Profile of Home Buyers and Sellers Texas Report
 2008 Profile of Home and Sellers Report Prepared for: Association of REALTORS Prepared by: NATIONAL ASSOCIATION OF REALTORS Research Division December 2008 As of fall 2008, the outlook for the economy
2006 Profile of Home Buyers and Sellers Texas Report
 2006 Profile of Home Buyers and Sellers Report Prepared for: Association of REALTORS Prepared by: NATIONAL ASSOCIATION OF REALTORS Research Division December 2006 2006 Profile of Home Buyers and Sellers
NAR Survey Shows Consumers Very Satisfied With Agent Performance
 For more information, contact: Walt Molony 702/981-8592 wmolony@realtors.org NAR Survey Shows Consumers Very Satisfied With Agent Performance LAS VEGAS, November 13, 2007 A new consumer survey shows that
2017 Profile of Home Buyers and Sellers
 New Jersey Report Prepared for: New Jersey REALTORS Prepared by: Research Division December 2017 New Jersey Report Table of Contents Introduction... 2 Highlights... 4 Methodology... 8 Report Prepared by:
November 1, 2016 Sacramento AOR Membership Meeting Oscar Wei, Senior Economist of C.A.R.
 November 1, 2016 Sacramento AOR Membership Meeting Oscar Wei, Senior Economist of C.A.R. Overview Economic Outlook California Housing Market Outlook Regional Housing Market Outlook 2017 Forecast Economic
YTD TOTAL VOLUME YTD SOLD PROPERTIES Q: WHAT IS YOUR HOME WORTH? A: CALL ME. SOLD DOM
 SOLD DOM 2012-13 2013-14 2014-15 306 387 324 Q: WHAT IS YOUR HOME WORTH? A: CALL ME. YTD SOLD PROPERTIES YTD TOTAL VOLUME CONDO & TOWN CONDO MEDIAN HOME SALES MEDIAN PRICE SALES PRICE 2013 2014 2015 2013
2010 Profile of Home Buyers and Sellers Illinois Report
 2010 Profile of Home and Sellers Report Prepared for: Association of REALTORS Prepared by: NATIONAL ASSOCIATION OF REALTORS Research Division December 2010 Introduction Many individuals and families aspire
THE CONSUMERS GUIDE TO REAL ESTATE STAGING
 THE CONSUMERS GUIDE TO REAL ESTATE STAGING Definition of Staging Real Estate Staging is the act of preparing and showcasing residential or commercial property for sale. It is a systematic and coordinated
REAL ESTATE TECH TRENDS
 By Properties Online, Inc. 2013 Real Estate Tech Trends Properties Online, Inc. has compiled important statistical information for the real estate community. Statistical sources include the 2012 National
Monthly Indicators % % - 9.2%
 Monthly Indicators 2016 New Listings were down 1.4 percent for single family/duplex homes and 25.0 percent for townhouse-condo properties. Pending Sales increased 58.3 percent for single family/duplex
CALIFORNIA SFUTUREHOMEBUYERS WHAT YOUNEEDTOKNOWTOCONVERT RENTERSINTOBUYERS. Presented by Carmen Hirciag, MBA Research Analyst
 CALIFORNIA SFUTUREHOMEBUYERS WHAT YOUNEEDTOKNOWTOCONVERT RENTERSINTOBUYERS Presented by Carmen Hirciag, MBA Research Analyst 2013 C.A.R. Renter Survey Methodology 1,675 telephone & online surveys Conducted
2016 NAR Investment and Vacation Home Buyers Survey
 2016 NAR Investment and Vacation Home Buyers Survey NATIONAL ASSOCIATION OF REALTORS Research Division April 2016 2016 NAR Investment and Vacation Home Buyers Survey Contents Introduction... 3 Market Environment...
2017 Profile of Home Buyers and Sellers
 2017 Profile of Home and Sellers Report Prepared for: REALTORS Prepared by: NATIONAL ASSOCIATION OF REALTORS Research Division December 2017 2017 Profile of Home and Sellers NATIONAL ASSOCIATION OF REALTORS
2012 Profile of Home Buyers and Sellers Florida Report
 2012 Profile of Home and Sellers Report Prepared for: REALTORS Prepared by: NATIONAL ASSOCIATION OF REALTORS Research Division December 2012 2012 Profile of Home and Sellers Report Table of Contents Introduction...
Selling Homes for Every Lifestyle
 Selling Homes for Every Lifestyle - 3rd generation Real Estate Company www.larenetwork.com SOLD L.A. Real Estate Network Group - 1818 West Beverly Blvd #209, Montebello, CA 90640 - Office# 323-724-2420
2019 Profile of Home Staging
 2019 Profile of Home Staging March 2019 National Association of REALTORS Research Group Table of Contents Section 1: Home Staging: Buyer s Agent Perspective Page 5 Section II: Home Staging: Seller s Agent
CALIFORNIA ECONOMIC & MARKET OUTLOOK. October 29,2014 SILVAR Leslie Appleton-Young, Chief Economist
 2014-2015 CALIFORNIA ECONOMIC & MARKET OUTLOOK October 29,2014 SILVAR Leslie Appleton-Young, Chief Economist OVERVIEW Economic Outlook California Housing Market Outlook Housing Affordability Regional Market
2018 Profile of Home Buyers and Sellers
 Massachusetts Report Prepared for: Massachusetts Association of REALTORS Prepared by: Research Division December 2018 Massachusetts Report Table of Contents Introduction... 2 Highlights... 4 Methodology...
Real gross domestic product California vs. United States
 Real gross domestic product California vs. United States Percent change, year ago 6 4 U.S. California 2 0-2 -4-6 2001 2002 2003 2004 2005 2006 2007 2008 2009 2010 2011 Source: Bureau of Economic Analysis.
New Hampshire Report. Prepared for: New Hampshire Association of REALTORS. Prepared by: NATIONAL ASSOCIATION OF REALTORS.
 New Hampshire Report Prepared for: New Hampshire Association of REALTORS Prepared by: Research Division January 2016 New Hampshire Report Table of Contents Introduction... 2 Highlights... 3 Methodology..8
Charlotte Report. Prepared for: Greater Regional Charlotte Association of REALTORS. Prepared by: NATIONAL ASSOCIATION OF REALTORS.
 Charlotte Report Prepared for: Greater Regional Charlotte Association of REALTORS Prepared by: Research Division January 2016 Charlotte Report Table of Contents Introduction... 2 Highlights... 3 Methodology..8
MORE HOMES SOLD FOR MORE MONEY IN LESS TIME
 MARKETING PLAN A COMPREHENSIVE PLAN FOCUSED ON THE SALE OF YOUR HOME PRESENTED BY: CHRIS ERMOLD 225 S. BOULDER ROAD LOUISVILLE, CO 80027 OFFICE: (303) 666-6500 DIRECT: (303) 664-6512 CERMOLD@REMAX.NET
2014 Profile of Home Buyers and Sellers Texas Report
 2014 Profile of Home Buyers and Sellers Report Prepared for: Association of REALTORS Prepared by: NATIONAL ASSOCIATION OF REALTORS Research Division December 2014 2014 Profile of Home Buyers and Sellers
Connecticut Report. Prepared for: Connecticut Association of REALTORS. Prepared by: NATIONAL ASSOCIATION OF REALTORS. Research Division.
 2015 Profile of Home Buyers and Sellers Report Prepared for: Association of REALTORS Prepared by: NATIONAL ASSOCIATION OF REALTORS Research Division January 2016 2015 Profile of Home Buyers and Sellers
The Texas 2005 Profile of Home Buyers and Sellers. Prepared by: NATIONAL ASSOCIATION OF REALTORS Research Division
 The Texas 2005 Profile of Home Buyers and Sellers Prepared by: NATIONAL ASSOCIATION OF REALTORS Research Division February, 2006 The 2005 NATIONAL ASSOCIATION OF REALTORS Profile of Home Buyers and Sellers
2016 Profile of Home Buyers and Sellers Florida Report
 2016 Profile of Home and Sellers Report Prepared for: REALTORS Prepared by: NATIONAL ASSOCIATION OF REALTORS Research Division December 2016 2016 Profile of Home and Sellers NATIONAL ASSOCIATION OF REALTORS
Monthly Market Watch for the Prescott Quad City Area. Provided by Keller Williams Check Realty Statistics from August 2012 Prescott MLS
 August 2012 Monthly Market Watch for the Prescott Quad City Area Provided by Keller Williams Check Realty Statistics from August 2012 Prescott MLS Report Overview: This report includes MLS data for the
SMART GUIDE TO SELLING YOUR HOME
 SMART GUIDE TO SELLING YOUR HOME Prepared for: Home Owner Compliments of: Steve Roesch, Principle Broker, Owner PDX Home Group, LLC Keller Williams Realty Professionals 9755 SW Barnes Rd. Suite 560. Portland,
Texas Association of REALTORS
 2017 Member Profile Association of REALTORS Report Prepared for: Association of REALTORS Prepared by: NATIONAL ASSOCIATION OF REALTORS Research Division July 2017 2017 Member Profile Report Table of Contents
EMBRACING THE ONLINE REAL ESTATE MARKET Original Research Commissioned by: Yahoo! Real Estate. July2008
 EMBRACING THE ONLINE REAL ESTATE MARKET Original Research Commissioned by: Yahoo! Real Estate EMBRACING THE ONLINE REAL ESTATE MARKET The online real estate market is growing in size and influence. We
Every year the National Association of
 NAR Report: Generational trends How Buyers Find the Right Home NAR s 2018 Generational Trends Shows Shifts in the Home-Search Process Every year the National Association of Realtors publishes a comprehensive
SINGLE HOUSING FORECAST
 SINGLE HOUSING FORECAST Harper Lee Collins RE/MAX Heritage WHERE IS THE NATIONAL MARKET NOW? National Association of Realtors: November 2011 November 2012 Total Sales: Up 14.5% Median Price: Up 10.1% Pending
2018 Member Profile Texas Association of REALTORS Report
 2018 Member Profile Association of REALTORS Report Prepared for: Association of REALTORS Prepared by: NATIONAL ASSOCIATION OF REALTORS Research Division August 2018 2018 Member Profile Report Table of
REALTORS CONFIDENCE INDEX SURVEY
 REALTORS CONFIDENCE INDEX SURVEY RESEARCH GROUP The REALTORS Confidence Index (RCI) survey gathers monthly information from REALTORS about local real estate market conditions, characteristics of buyers
STAY CONNECTED - GET THE FACTS: January 6, 2014
 Having trouble viewing this email? Click here STAY CONNECTED - GET THE FACTS: January 6, 2014 LEGAL HOTLINE QUESTION: Buyer makes offer and identifies, on line 17 of Form 21, that Form 35 is part of buyer's
Welcome to Real Estate Checklists & Systems!
 Welcome to Real Estate Checklists & Systems! Real Estate Checklists & Systems is a series of 101+ checklists designed to assist real estate professionals in the following 3 ways: 1. By helping consumers
REALTORS CONFIDENCE INDEX SURVEY
 REALTORS CONFIDENCE INDEX SURVEY RESEARCH GROUP The REALTORS Confidence Index (RCI) survey gathers monthly information from REALTORS about local real estate market conditions, characteristics of buyers
2017 Moving with Kids
 2017 Moving with Kids National Association of REALTORS Research Department Introduction Home buyers and sellers that have children living at home under the age of 18 have unique needs when they purchase
2011 Profile of Home Buyers and Sellers Texas Report
 2011 Profile of Home and Sellers Report Prepared for: Association of REALTORS Prepared by: NATIONAL ASSOCIATION OF REALTORS Research Division December 2011 2011 Profile of Home and Sellers Report Table
Profile of International Home Buyers in Florida
 Profile of International Home Buyers in Florida Research Division National Association of REALTORS 2009 Prepared for the Florida Association of REALTORS 2009 National Association of REALTORS Profile of
2011 Profile of Home Buyers and Sellers New York Report
 2011 Profile of Home and Sellers Report Prepared for: Association of REALTORS Prepared by: NATIONAL ASSOCIATION OF REALTORS Research Division December 2011 2011 Profile of Home and Sellers Report Table
LOCAL MARKET INTELLIGENCE PACKET SAN ANTONIO TEXAS BROUGHT TO YOU BY
 LOCAL MARKET INTELLIGENCE PACKET SAN ANTONIO TEXAS BROUGHT TO YOU BY ABOUT HOME SHOPPERS IN The following information will give you some valuable, data-supported, insights to better understand home shoppers
Florida Report. Prepared for: Florida REALTORS. Prepared by: NATIONAL ASSOCIATION OF REALTORS. Research Division. January 2016
 2015 Profile of Home and Sellers Report Prepared for: REALTORS Prepared by: NATIONAL ASSOCIATION OF REALTORS Research Division January 2016 2015 Profile of Home and Sellers NATIONAL ASSOCIATION OF REALTORS
2016 Member Profile Florida REALTORS Report
 2016 Member Profile REALTORS Report Prepared for: REALTORS Prepared by: NATIONAL ASSOCIATION OF REALTORS Research Division July 2016 2016 Member Profile Report Table of Contents Introduction... 2 Highlights...
2017 Profile of Home Staging
 2017 Profile of Home Staging National Association of REALTORS Research Department Executive Summary Buyers Agent Perspective: Forty-nine percent of buyers agents cited that homes staging had an effect
October 2017 Market Statistics
 ober 2017 ket Statistics for Ada and Canyon Counties Data from the Intermountain MLS as of ember 11, 2017 Monthly Analysis ober 2017 marks a full three years of falling inventory, specifically in the number
2015 Profile of Home Buyers and Sellers New York Report
 2015 Profile of Home and Sellers Report Prepared for: Association of REALTORS Prepared by: NATIONAL ASSOCIATION OF REALTORS Research Division January 2016 2015 Profile of Home and Sellers NATIONAL ASSOCIATION
Released: June Commentary 2. The Numbers That Drive Real Estate 3. Recent Government Action 9. Topics for Home Buyers, Sellers, and Owners 11
 Released: June 2011 Commentary 2 The Numbers That Drive Real Estate 3 Recent Government Action 9 Topics for Home Buyers, Sellers, and Owners 11 Brought to you by: KW Research Commentary The U.S. housing
2018 Profile of Home Buyers and Sellers
 2018 Profile of Home and Sellers Report Prepared for: Association of REALTORS Prepared by: NATIONAL ASSOCIATION OF REALTORS Research Division December 2018 2018 Profile of Home and Sellers NATIONAL ASSOCIATION
By: MaryAnne Simmons. Real Estate Broker, Principal Broker, KY, exp Realty, LLC
 By: MaryAnne Simmons Real Estate Broker, Principal Broker, KY, exp Realty, LLC Course Objectives At the end of this course, the student will be able to: List several advantage of pre-construction investing
2015 Member Profile Florida REALTORS Report
 2015 Member Profile REALTORS Report Prepared for: REALTORS Prepared by: NATIONAL ASSOCIATION OF REALTORS Research Division July 2015 2015 Member Profile Report Table of Contents Introduction... 2 Highlights...
2010 Profile of Home Buyers and Sellers Texas Report
 2010 Profile of Home and Sellers Report Prepared for: Association of REALTORS Prepared by: NATIONAL ASSOCIATION OF REALTORS Research Division December 2010 2010 Profile of Home and Sellers Report Table
Recent Home Buyer and Seller Profiles. November 3, 2017 National Association of REALTORS Research Division
 Recent Buyer and Seller Profiles November 3, 2017 National Association of REALTORS Research Division Methodology In July 2017, NAR mailed out a 131-question survey using a random sample weighted to be
2015 Member Profile Texas Association of REALTORS Report
 2015 Member Profile Association of REALTORS Report Prepared for: Assocation of REALTORS Prepared by: NATIONAL ASSOCIATION OF REALTORS Research Division July 2015 2015 Member Profile / National Association
Ada County Single-Family Homes
 Ada County Single-Family Homes Key Metrics Jan 2017 Jan 2018 % Chg YTD 2017 YTD 2018 % Chg Closed Sales 547 605 10.6% 547 605 10.6% Median Sales Price $240,000 $279,900 16.6% $240,000 $279,900 16.6% Days
MARKET AREA UPDATE Year: 2018 Report as of: 1Q 2Q 3Q 4Q
 Market Area (City, State): Los Angeles County, CA Provided by (Company / Companies): Coldwell Banker Residential Brokerage - SoCal Provided by RDC Member(s): Thomas Hilmar MARKET AREA UPDATE Year: 2018
2017 RESIDENTIAL REAL ESTATE MARKET REPORT
 2017 RESIDENTIAL REAL ESTATE MARKET REPORT Published January 26, 2018 Our market reports have been focused on the effects of low inventory on our housing market and for good reason. December 2017 marked
Monthly Indicators. November Monthly Snapshot % % %
 Monthly Indicators For residential real estate activity in the Miami-Fort Lauderdale-Pompano Beach MSA provided by Florida REALTORS 2012 Monthly Snapshot + 21.5% + 16.0% - 46.9% One-Year in Closed Sales
M onthly arket. July Table of Contents. Monthly Highlights
 Table of Contents Market Inventory...2 www.gaar.com Monthly Highlights The median sale price of single-family, detached homes climbed to $190,000 in July 2014, the highest level since August 2008. Market
Home Selling Made Simple
 Home Selling Made Simple Table of Contents Introduction...4 Determining Your Asking Price...5 Should You Sell Solo?...6 Tips On Advertising Your Home For Sale...8 Building Rapport With Homebuyers...10
MARKET AREA UPDATE Year: 2017 Report as of: 1Q 2Q 3Q 4Q
 MARKET AREA UPDATE Year: 2017 Report as of: 1Q 2Q 3Q 4Q Market Area (City, State): Los Angeles County, CA Provided by (Company / Companies): Coldwell Banker Residential Brokerage - SoCal Provided by RDC
Jackson County Residental Market Trends. November Pending Sales New Listings
 Jackson County Residental Market Trends November 2017 Pending Sales..2 New Listings..3 Overall activity trends are not a measure of pricing or value for individual properties. Small Sampling sizes can
Ada County Existing/Resale
 Ada County Existing/Resale June 2018 ket Statistics Report provided by Boise Regional REALTORS Data from the Intermountain MLS as of y 11, 2018 Key Metrics Jun 2017 Jun 2018 % Chg YTD 2017 YTD 2018 % Chg
2017 Profile of International Residential Transactions of Raleigh Regional Association of REALTORS Members
 2017 Profile of International Residential Transactions of Raleigh Regional Association of REALTORS Members Conducted for the Raleigh Regional Association of REALTORS by the National Association of REALTORS
Monthly Indicators + 7.3% + 6.6% + 8.3% Single-Family Market Overview Condo Market Overview New Listings Pending Sales.
 Monthly Indicators 2018 The three most prominent national market trends for residential real estate are the ongoing lack of abundant inventory, the steadily upward movement of home prices and year-over-year
2007 Profile of Home Buyers and Sellers Texas Report
 2007 Profile of Home and Sellers Report Prepared for: Association of REALTORS Prepared by: NATIONAL ASSOCIATION OF REALTORS Research Division December 2007 2007 Profile of Home and Sellers Report Table
JEFFREY SAMUELS. Welcome! Maximize Your Real Estate Value!
 Welcome! We look forward to speaking with you about the future sale of your home. We are confident you will feel that the programs we outline for you will provide you with the greatest possibility of selling
September 2017 Market Statistics
 tember 2017 ket Statistics for Ada and Canyon Counties Monthly Analysis Despite rising home prices, today s housing market doesn t have much else in common with the market we saw prior to the recession.
Monthly Indicators. Monthly Snapshot. March % % 0.0%
 Monthly Indicators 2017 We can comfortably consider the first quarter to have been a good start for residential real estate in 2017. There was certainly plenty to worry over when the year began. Aside
Monthly Indicators + 4.8% - 3.5% %
 Monthly Indicators 2015 New Listings were up 45.0 percent for single family/duplex homes but decreased 44.1 percent for townhouse-condo properties. Pending Sales increased 14.3 percent for single family/duplex
Released: February 8, 2011
 Released: February 8, 2011 Commentary 2 The Numbers That Drive Real Estate 3 Recent Government Action 10 Topics for Home Buyers, Sellers, and Owners 13 Brought to you by: KW Research Commentary Gradual
The Greater Reno-Tahoe Real Estate Report
 February, 2018February, 2018 February, 2018 Issue The Greater Reno-Tahoe Real Estate Report Housing Market Trends for: Reno, Sparks, Carson City, Carson Valley, Lake Tahoe, Dayton, and Fernley A FREE monthly
2007 Profile of Home Buyers and Sellers Pennsylvania Report
 2007 Profile of Home Buyers and Sellers Report Prepared for: Association of REALTORS Prepared by: NATIONAL ASSOCIATION OF REALTORS Research Division December 2007 2007 Profile of Home Buyers and Sellers
MARKET AREA UPDATE Report as of: 1Q 2Q 3Q 4Q
 Market Area (City, State):Albany, NY MARKET AREA UPDATE Report as of: 1Q 2Q 3Q 4Q :2011 Provided by (Company / Companies):Coldwell Banker Prime Properties What are the most significant trends in your current