UNIVERSITY PLACE 2.0. What would you do with 4 acres in the Central City?
|
|
|
- James Lucas
- 6 years ago
- Views:
Transcription

1 UNIVERSITY PLACE 2.0 What would you do with 4 acres in the Central City?

2 UNIVERSITY PLACE 2.0 Envisioning a way forward for the University Place site April 2, 2015 Presented by Adam Boehm, Jurie Lewis, Bryce Payne, Bob Sassa & Jason Wald
3 Overview Neighborhood context Market analysis Site and our assessment Development program Key assumptions Financial results
4 1. NEIGHBORHOOD CONTEXT University Place 2.0

5 Image credit: City of Portland Archives, 1938 South Portland

6 South Auditorium Urban Renewal Image credit: Halprin Landscape Conservancy

7 Image credit: Google Earth Pro, 2014

8 A few defining elements of the neighborhood Halprin Open Sequence PSU & University District MAX Orange line LRT Innovation Quadrant Proposed Green Loop

9 Halprin Open-Space Sequence We experience ourselves as dancers through awareness of our movements, and our city through awareness of our movements within it. Anna Halprin

10 The Halprin Open-Space Sequence 3. Pettygrove Park 3 2. Lovejoy Fountain 2 1. Source Fountain Image credit: Google Earth Pro 1


11 1 2 3 The space is choreographed for movement with nodes for quiet and contemplation, action and inaction, hard and soft, yin and yang. Lawrence Halprin

12 Campus Map Image credit: Portland State University District Framework Plan, June 2010


13 Portland State University is a university on the move Image credit: Portland State University
14 PSU enrollment is forecasted to grow Enrollment up 26% since 2002, relatively stable since enrollment exceeds 2019 forecast; long term target: 32-36,000 students 35,000 30,000 29,703 28,931 25,000 20,000 15,000 10,000 5,000 22,947 Three student enrollment scenarios Growth scenario 2008* OUS projection 24,000 27,400 32,300 Historic projection 24,000 28,600 36,100 40/40/20 24,000 33,600 48,600 * Projections were completed using Fall 2008 enrollment, current enrollment is higher 0 Data source: Portland State University District Framework Plan Data source: Portland State University Office of Research and Institutional Planning

15 Three Centers Image credit: Portland State University District Framework Plan, June 2010


16 MAX Orange line starts this fall. Image credit: Portland State University Image credit: TriMet Image credit: TriMet

17 Innovation Quadrant Marquam Hill: OHSU South Waterfront: OHSU University District: PSU Central Eastside Industrial District: OMSI PCC Together, the four districts of the quadrant are projected to grow by approximately 30,000 jobs and 11,000 households over the next 25 years. Image credit:


18 Image credits: City of Portland Bureau of Sustainability Green Loop Image credit: Portland Monthly, April 2, 2014
19 2. MARKET CONTEXT University Place 2.0
20 Housing: Portland multifamily market remains strong Vacancy decreasing Average rent $/SF increasing 10.0% $ % 8.9% 8.0% $2.00 $ % 6.0% 5.9% $1.50 $ % 4.0% 4.1% $ % 2.0% $ % 0.0% $ Data source: Axiometrics Data source: Multifamily NW


21 Multifamily PMA + pipeline 838 units under construction 1,665 units in pipeline


22 1. Cyan Multifamily comparables 3. Linc 245 Rent range: $ /SF 2. MW8 Unit size range: SF 4. Emery
23 Opportunity: The rise of the millenials Population by age cohort ( ) 100% 90% 80% Bigger: age group now 61% of population Faster: The size of this group has increased by 62% in last 4 years (vs. 36% for population overall) 85 Years and over 75 to 84 Years 55 to 64 Years 45 to 54 Years 35 to 44 Years 25 to 34 Years 18 to 24 Years 15 to 17 Years 10 to 14 Years 5 to 9 Years Under 5 Years 70% 60% 50% 40% 30% 20% 24.2% 22.6% 27.1% 28.7% 27.3% 34.1% 10% 0% Data source: Social Explorer, US Census (Census tracts 56-57)


24 Student housing 2,000+ PSU units housing 7.4% of students 28,000+ students and likely to grow Image credit: Scripps Health Image credit: American Campus Communities Image credits: Portland State University

25 Existing student housing On campus Near campus Image credit: Portland State University District Framework Plan

26 Future student housing Highest concentration anticipated near Living/Learning Center Image credit: Portland State University District Framework Plan


27 1. Cyan 1. Cyan Student housing comparables Rent range: $ /SF $554-1,384/bed 3. Linc 245 Unit size range: SF 2. MW8 University Housing: $513-$1,207/bed 4. Emery 1. MW8 2. University Pointe
 Data source: Social Explorer, US")
28 Opportunity: Ages fastest growing population in primary market area ( ) Data source: Social Explorer, US Census


29 Image credit: istockphoto.com/monkeybusiness Source: Multifamily Executive
30 Hotel: occupancy trends ( f) strong Downtown Lower occupancy Downtown Upper outperforming 100% 95% 90% Downtown Lower All Portland 100% 95% 90% Downtown Upper All Portland 85% 85% 84% 83% 80% 75% 75% 74% 80% 75% 73% 70% 70% 69% 72% 65% 65% 60% 60% 55% 55% 55% 50% 50% Data source: PKF Data source: PKF
31 Hotel: ADR trends ( f) positive Downtown Lower ADR Downtown Upper ADR $250 $250 Downtown Lower Downtown Upper All Portland All Portland $208 $200 $200 $181 $150 $150 $130 $122 $142 $100 $83 $114 $100 $91 $50 $50 $0 $ Data source: PKF Data source: PKF
32 University Place performance ( ): RevPAR up 24% year over year; equals 62% of PKF Downtown Lower 2014 RevPAR Seasonal occupancy (2014 average: 57% vs %) Seasonal ADR (2014 average: $88 vs. $ ) 100% 90% 80% % $250 $ % 60% $150 50% 40% $100 $103 30% $72 20% 27% $50 10% 0% Jan Feb Mar Apr May Jun Jul Aug Sep Oct Nov Dec $0 Jan Feb Mar Apr May Jun Jul Aug Sep Oct Nov Dec Data source: Portland State University Data source: Portland State University


33 Hotel PMA + pipeline Branded boutique: 802 Convention Center: 600 Extended stay: 203 Historic: 290 Hostel/Independent: 88


34 South of Market (SoMa) office market 2.3 million SF Average floor plate: 18,452 SF Average parking ratio: 1.48/1,000 SF Median age: 1969 Rental rates: $18-28/SF Full Service Leasing activity: 56,000+ SF in last year Data sources: CBRE, CoStar Image source: CBRE
35 Office: SoMa market trends ( Q1) Vacancy over time Rents increasing 12.0% 10.0% 11.3% $27/fs $25/fs $25.43/fs 8.0% 7.3% $23/fs 6.0% $21/fs 4.0% $19/fs $18.81/fs 2.0% $17/fs 0.0% Q Q Q Q Q Q Q Q Q Q Q Q Q Q Q Q Q Q Q Q QTD $15/fs Q Q Q Q Q Q Q Q Q Q Q Q Q Q Q Q Q Q Q Q QTD Data source: CoStar Data source: CoStar

36 Office It is important to us to offer a working environment that will help attract and retain the best talent. Jeff Heggedahl, president and ceo of Ecova Viewpoint Image credit: Sam Tenney/Daily Journal of Commerce
 165,000 SF Zidell Yards near Tillicum Crossing 246,000 SF Zidell Yards near The Emery 113,000 SF Image credit: Kristyna Wentz-Graff/The")
37 Office: pipeline Under construction Park Avenue West (TMT) 221,380 SF 67% leased Pearl West (BPM) 155,465 SF 63% leased Proposed Adaptive reuse The 100 Park Square (Clarion Partners/W3) 97,644 SF 29% leased Former Oregonian HQ (URG/Clarion Partners) 165,000 SF Zidell Yards near Tillicum Crossing 246,000 SF Zidell Yards near The Emery 113,000 SF Image credit: Kristyna Wentz-Graff/The Oregonian

38 Potential educational/institutional demand OHSU/PSU School of Public Health Pursuing accreditation PSU Business Accelerator Currently off campus PSU School of Art + Design Across multiple buildings PSU University Technology Services Currently leasing space Image credit: UBI Global
39 Retail: market trends ( ) CBD submarket metrics: 3.8% vacancy $22.10/SF quoted rates (2014Q4) Vacancy decreasing Rents increasing 7.0% 6.0% 6.5% $18 $17 5.0% $16 $ % $15 $14 3.0% 2.9% $13 $ % $12 1.0% $11 0.0% Q Q Q Q Q Q Q Q Q Q Q Q Q Q Q Q Q Q Q Q $ Q Q Q Q Q Q Q Q Q Q Q Q Q Q Q Q Q Q Q Q Data source: CoStar Data source: CoStar

40 Retail Demand in the district Rents: $18-28/SF Edge of trade area Challenging access Better sites for retail Image credit: Portland State University District Framework Plan
41 3. SITE ASSESSMENT The Exchange + Lincoln Station


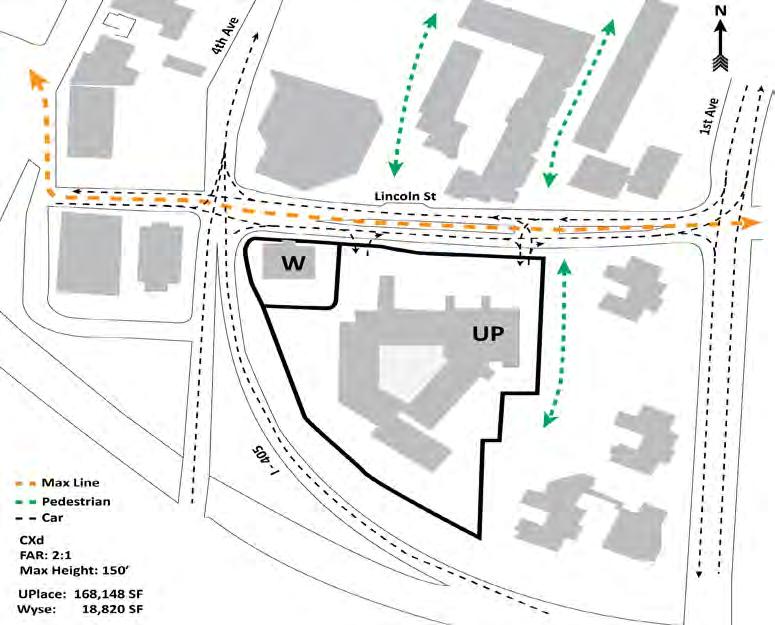
42 Site


43


44 Current zoning Zoning: CXd FAR: 2:1 Max height: 150 feet


45 Future zoning FAR: 4:1 Max height: 250 feet


46 Opportunities Challenges Scale Access Transportation Site circulation Proximity to PSU Competition Views Debt

47 Development objectives Retire debt Urban design and density Mix of uses Incorporate existing amenities Health and wellness Sustainability
48 4. PROGRAM + SITE PLAN The Exchange + Lincoln Station
49 The Exchange + Lincoln Station is Mixed-use development with potential for real synergies hospitality + housing employment + education open space for all
50 Development program Residential Hotel Office Institutional Parking Total Units Gross SF 405,100 90,300 60,000 44, ,400

51 Phasing Phase 1: Hospitality + Housing Below-grade parking Hotel and restaurant Two apartment buildings Halprin plaza Phase 2: Education + Employment Ground floor retail Academic podium Office Student housing tower Halprin open space
52 Phase 1 Mid-range hotel Restaurant Multifamily apartments
53 Phase 1 Program element: hotel 145 room mid-high range hotel Restaurant/outdoor terrace ADR $168 Lincoln


54 Phase 1 Program element: hotel PSU related Visitors Conferences

55 Phase 1 Program element: hotel

56 Phase 1 Hotel guests, office tenants, students/faculty Program element: restaurant
57 Phase 1 Program element: apartments
58 Phase 1 Program element: apartments 161,700 GSF 197 units Avg. rent $2.56 Lincoln The Marie APARTMENTS


59 Phase 1 Program element: apartments The Marie APARTMENTS


60 Phase 1 The Marie APARTMENTS Program element: apartments Urban professionals PSU students and staff Millennials
61 Phase 1 113,400 GSF 120 units Avg. rent $2.46 Lincoln Program element: apartments The Anna APARTMENTS

62 Phase 1 Program element: apartments


63 Phase 1 Empty nesters Retirees Boomers The Anna APARTMENTS Program element: apartments

64 Phase 2 Program element: apartments Height and density Mixed use office-institutional Student housing Ground floor retail

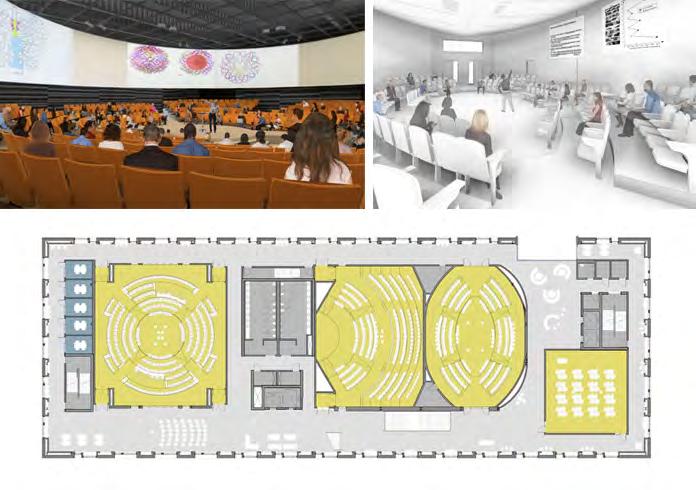
65 Phase 2 44,000 GSF Avg. rent $26 NNN Classrooms/offices Program element: institutional Lincoln
66

67 Phase 2 Program element: institutional

68 Phase 2 60,000 GSF Rent $22 NNN Open, flexible office space ink. INNOVATION NETWORKED KNOWLEDGE Program element: office Lincoln


69 Phase 2 ink. INNOVATION NETWORKED KNOWLEDGE Program element: office Image credit: Deutsche Telekom AG
70 Phase 2 Program element: student housing Lincoln 130,000 GSF 152 units/354 beds Avg. rent per SF $2.60 A ASCENT STUDENT LIVING


71 Phase 2 Program element: student housing A ASCENT STUDENT LIVING

72 Phase 2 A ASCENT STUDENT LIVING Program element: student housing


73 Open space Lincoln Halprin 3 Grant Way Peacemakers Plaza Sherman Way Halprin 2 Halprin Sequence Gathering spaces and recreation Bocce ball court Community garden Art fairs Music events Green Loop


74 Open space
75 Parking 363 stall parking garage


76 Parking Ratios: Hotel: 0.4/room Institutional: 1.0/1000 sf Office: 1.5/1000 sf Apartment 1: 0.5/per room Apartment 2: 1.0/room Retail: 5.0/1000sf Student: 0.4/room 363 total stalls Shared parking reduces need by 127 stalls saving $3.5 million 637 bike parking spots
77 Development timeline Phasing Plan Phase 1 Negotiate with PSU Purchase Property Phase 1 Design and Entitlement Garage Construction Hotel Construction Res 1 Construction Res 2 Construction Phase 2 PSU Acquires Wyse Property Design and Entitle Western Porion of Site Constuction of Commercial/Institutional/Student Housing Yr 1 Yr 2 Yr 3 Yr 4 Yr 5

78 Fly-over
79 5. KEY ASSUMPTIONS The Exchange + Lincoln Station
80 Acquisition Cost University Place $100/SF $16,814,800 Wyse Parcel $100/SF $1,882,000 Demolition $6.40/SF $765,400 Demolition $6.40/SF $29,811 TOTAL: $19,636,151
81 Hotel: $383/SF $238,692/key Parking: $42,000/stall Apartment 1: $308/SF $253,340/unit Mixed-use: $292/GSF Apartment 2: $331/SF $313,200/unit
82 Total Cost Phase 1: $126,000,000 Sources Uses Phase 1 Equity Developer 10% - $4,630,000 Institutional 90% - $41,664,000 Debt Hotel - $21,332,000 Apartment 1 - $32,515,000 Apartment 2 - $25,886,000 Phase 1 Site acquisition - $19,636,000 Parking structure - $16,399,000 Hotel - $34,610,000 Apartment 1 37,506,100 Apartment 2 - $26,355,650 65% LTC average
83 Building Values Phase 1: Parking - $9,170,000 (7.00% cap) Hotel - 35,308,000 (7.25% cap) Apartment 1-53,207,000 (5.50% cap) Apartment 2-36,979,000 (5.50% cap) TOTAL VALUE - 134,665,000 TOTAL COST - 126,000,000 Return on Cost %
84 Sources Total Cost Phase 2: $65,710,000 Total Value Phase 2: $72,508, % cap 10.3% return on cost Uses Equity Developer 10% - $2,040,000 Institutional 90% - $18,352,000 Debt 45,320,000 Phase 2 Mixed-use building - $65,710,000 69% LTC
85 6. FINANCIAL RESULTS The Exchange + Lincoln Station
86 Annualized cash yield: 11.00% Levered IRR: 13.70% Levered IRR w/pdc: 18.10%
87 Acknowledgements A special thank you to our advisor, Jerry Johnson of Johnson Economics Without the help of many, this would not have been possible. Thank you to: CBRE: McKell Dalton, Kim Danel, Trevor Kafoury, Kevin Kaufman, Tiffany West Commercial Realty Advisors NW, LLC: Bob LeFeber, George Macoubray, Nick Stanton City of Portland Bureau of Planning and Sustainability: Karl Lisle College Housing Northwest: David Garnand CoreCampus LLC: Mitch Dalton, Chad Matesi Downtown Neighborhood Association: Felicia Williams Elliott & Associates, Inc.: William Elliott GBD Architects: Kyle Anderson, Dan Nowell Greenlight Development: Mark Desbrow HFF: Casey Davidson John L. Scott Real Estate: Jay Russell Killian Pacific: Noel Johnson Lane Powell: Mike Silvey Oregon Pacific Investment: Julie Leuvray OHSU: Brian Newman Pacific Crest REA: Philip Higgins PacTrust: J. Benjamin Chessar PRS: Geoff Gill, Eric Mineart Portland State University: Rani Boyle, Jason Franklin, Gerry Mildner, Wim Wiewel Provenance Hotels: Bashar Wali Schlesinger Companies: Josh Schlesinger Specht Properties: Greg Specht Trammell Crow: Kirk Olsen University Place Hotel: Shelby Matson US Bank: M.K. Long Walsh Construction: Blas Delascio Wells Fargo: Tara Stevenson WFG Title: Scott Morcum And many more.

88 Thank you.
The Exchange: NAIOP Real Estate Development Workshop
 Portland State University PDXScholar Real Estate Development Workshop Projects Center for Real Estate Winter 2015 The Exchange: NAIOP Real Estate Development Workshop Adam Boehm Portland State University
IPS REAL ESTATE STRATEGY
 IPS REAL ESTATE STRATEGY BROAD RIPPLE HIGH SCHOOL Joe Gramelspacher, Special Projects Director March 26, 2018 overview 2 1 2 3 4 real estate strategy 3 overview 12 properties have been sold, resulting
MLS of Greater Cincinnati - Charts for the Month: November 2017
 MLS of Greater Cincinnati - Charts for the Month: November 2017 The following charts provide an overview of what has occurred in the MLS over the past month. Each chart provides a historical trend. The
The Benson Blocks: BOMA Real Estate Development Workshop
 Portland State University PDXScholar Real Estate Development Workshop Projects Center for Real Estate Summer 2011 The Benson Blocks: BOMA Real Estate Development Workshop Suvi Wesa Portand State University
SFR Condo Residential Lot Sales Inventory Sales Inventory Sales Inventory. Month YTD Month Month YTD Month Month YTD Month
 Grand Strand Market Report 2017 capped off a great year for the Grand Strand as full year SFR sales volume and median sales price were up 9.8% and 4.3%, respectively. Condo sales activity increased 3.0%
GREENHEART VILLAGE. growing an adaptive community
 GREENHEART VILLAGE growing an adaptive community 2013 ULI Hines Student Urban Design Competition Team Summary Board 1. Summary Proforma Year 0 Phase I Phase II Phase III 20142015 2016 2017 2018 2019 2020
REPORT TO THE BOARD OF GOVERNORS
 REPORT TO THE BOARD OF GOVERNORS SUBJECT STUDENT HOUSING AT WALTER GAGE INFILL SITE MEETING DATE JUNE 14, 2018 Forwarded to the Board of Governors on the Recommendation of the President APPROVED FOR SUBMISSION
Phoenix, Central and Northern Arizona
 Phoenix, Central and Northern Arizona End of Year Housing Report 1-8-354-5664 LongRealty.com 217 End of Year Housing Report SALES & INVENTORY Housing market trends For the overall real estate market in
METROPOLITAN TRACT PERFORMANCE REPORT For the Quarter Ended December 31, 2007
 F-5 METROPOLITAN TRACT PERFORMANCE REPORT For the Quarter Ended December 31, 2007 Finance, Audit & Facilities Committee March 20, 2008 CONSOLIDATED METROPOLITAN TRACT PROPERTIES Quarterly Summary Quarterly
Monthly Indicators + 7.3% + 6.6% + 8.3% Single-Family Market Overview Condo Market Overview New Listings Pending Sales.
 Monthly Indicators 2018 The three most prominent national market trends for residential real estate are the ongoing lack of abundant inventory, the steadily upward movement of home prices and year-over-year
METROPOLITAN TRACT PERFORMANCE REPORT For the Quarter Ended March 31, 2008
 F-5 METROPOLITAN TRACT PERFORMANCE REPORT For the Quarter Ended March 31, 2008 Finance, Audit & Facilities Committee June 12, 2008 CONSOLIDATED METROPOLITAN TRACT PROPERTIES Quarterly Summary Quarterly
Multifamily Month In Review: I arielpa.com 122 East 42 nd Street, Suite 1015, New York NY 10168
 Multifamily Month In Review: New York City September 2015 Released November 2015 By Ariel Property Advisors Join Our Network: e-mail join@arielpa.com or visit arielpa.com 212.544.9500 I arielpa.com 122
England Occupancy Survey May 2017 SUMMARY OF RESULTS
 England Occupancy Survey 2017 SUMMARY OF RESULTS Room occupancy in 2017 increased +1% to 73%. Bedspace occupancy also increased +1% to 54%. Weekday room occupancy remained stable at 72% whilst weekend
METROPOLITAN TRACT PERFORMANCE REPORT For the Quarter Ended March 31, 2007
 F-5 METROPOLITAN TRACT PERFORMANCE REPORT For the Quarter Ended March 31, 2007 Finance, Audit & Facilities Committee May 17, 2007 CONSOLIDATED METROPOLITAN TRACT PROPERTIES Quarterly Summary Quarterly
Austin s office rental rates continue to grow along with its population
 Research & Forecast Report AUSTIN OFFICE Q3 2016 Austin s office rental rates continue to grow along with its population Kaitlin Holm Research and Marketing Coordinator Austin Austin continues to grow
TUCSON and SOUTHERN ARIZONA
 TUCSON and SOUTHERN ARIZONA End of Year Housing Report (52) 818-454 Stephen@TeamWoodall.com 217 End of Year Housing Report SALES & INVENTORY Housing market trends For the overall real estate market in
F 6 STANDING COMMITTEES. B. Finance, Audit and Facilities Committee. Metropolitan Tract Performance Report for the Quarter Ended September 30, 2008
 VII. STANDING COMMITTEES F 6 B. Finance, Audit and Facilities Committee Metropolitan Tract Performance Report for the Quarter Ended September 30, 2008 F 6/211-08 11/20/08 METROPOLITAN TRACT PERFORMANCE
Detroit Inclusionary Housing Plan & Market Study Preliminary Inclusionary Housing Feasibility Study Executive Summary August, 2016
 Detroit Inclusionary Housing Plan & Market Study Preliminary Inclusionary Housing Feasibility Study Executive Summary August, 2016 Inclusionary Housing Plan & Market Study Objectives 1 Evaluate the citywide
Houston Summer Retail. Office. July 2016 Commercial Markets. Independent Valuations for a Variable World Page 1. Summary Q1 Statistics
 July 2016 Commercial Markets In This Issue Commercial Markets Retail Office Industrial Multifamily Housing Trends Single Family Housing Lot Supply & New Home Data % 10% 8% 6% 4% 2% 0% Retail 2007 Q1 2008
Timbercreek. U.S. Multi-Residential Opportunity Fund #1. Semi-Annual Investor Update
 Timbercreek U.S. Multi-Residential Opportunity Fund #1 Semi-Annual Investor Update FORWARD LOOKING STATEMENT Certain statements in this presentation about Timbercreek U.S. Multi-Residential Opportunity
Phoenix Real Estate Outlook. May 2015
 Phoenix Real Estate Outlook May 2015 General Economy 2 Arizona & US Nonfarm Employment YTY % Change 240,600 jobs lost 208,400 jobs gained (87%) Source: ADOA 3 Arizona Jobs Regained Since Bottom of Cycle
Bureau of Business Research Webinar Series October 2016
 Bureau of Business Research Webinar Series October 2016 Presented by Eric Thompson W.W. Marshall Associate Professor of Economics Director, Bureau of Business Research Outline Importance of Affordable
Oklahoma City Office Market Leasing. Construction, Delivery, Net Absorption and Vacancy Rate. Oklahoma City Office Market Sales
 03 04 04 04 05 06 07 07 09 10 12 Executive Summary National Economy Local Economy Oklahoma City Office Market Leasing Net Absorption and Inventory Rental and Vacancy Rates OKC Office Market Information
METROPOLITAN TRACT PERFORMANCE REPORT For the Quarter Ended December 31, 2006
 F-11 METROPOLITAN TRACT PERFORMANCE REPORT For the Quarter Ended December 31, 2006 Finance, Audit & Facilities Committee March 22, 2006 CONSOLIDATED METROPOLITAN TRACT PROPERTIES Quarterly Summary Quarterly
Ashland Transit Triangle:
 Ashland Transit Triangle: Strategic Approach to Implementation Fregonese Associates Inc. 12/19/16 Phase I of the Transit Triangle Study Conducted in the Fall of 2015 Tasks Completed: Market analysis Initial
NNN LEASED INVESTMENT OR OWNER/USER OPPORTUNITY
 NNN LEASED INVESTMENT OR OWNER/USER OPPORTUNITY 4244 N. 19TH AVENUE PHOENIX, AZ 85015 Jonathan Levy Advisor 480.425.5538 jonathan.levy@svn.com SVN DESERT COMMERCIAL ADVISORS 5343 N. 16TH STREET, SUITE
METROPOLITAN TRACT PERFORMANCE REPORT For the Quarter Ended September 30, 2007
 F-6 METROPOLITAN TRACT PERFORMANCE REPORT For the Quarter Ended September 30, 2007 Finance, Audit & Facilities Committee November 15, 2007 CONSOLIDATED METROPOLITAN TRACT PROPERTIES Quarterly Summary Quarterly
THE OUTLOOK FOR HOUSING IN ILLINOIS
 THE OUTLOOK FOR HOUSING IN ILLINOIS Jonathan Smoke Chief Economist January 25, 2017 NATIONAL TRENDS 2 2000.01 2000.05 2000.09 2001.01 2001.05 2001.09 2002.01 2002.05 2002.09 2003.01 2003.05 2003.09 2004.01
METROPOLITAN TRACT PERFORMANCE REPORT For the Quarter Ended June 30, 2007
 F-6 METROPOLITAN TRACT PERFORMANCE REPORT For the Quarter Ended June 30, 2007 Finance, Audit & Facilities Committee September 20, 2007 CONSOLIDATED METROPOLITAN TRACT PROPERTIES Quarterly Summary Quarterly
Monthly Indicators % + 9.7% %
 Monthly Indicators 2016 Percent changes calculated using year-over-year comparisons. New Listings were up 11.1 percent for single family homes and down 30.8 percent for townhouse-condo properties. Pending
California Housing Market Update. Monthly Sales and Price Statistics November 2018
 California Housing Market Update Monthly Sales and Price Statistics November 2018 Home Sales: Largest Decline Since 2014 California, November 2018 Sales: 381,400 Units, -4.6% YTD, -13.4% YTY 700,000 600,000
Greater Las Vegas Snapshot by Sale Type
 9.% Closed Sales Trend by Type December Closings by Type 8.% 7.% 6.% 8% Short Sales 1% 5.% 4.% 3.% Traditional Equity 82% 2.% 1.%.% Greater Las Vegas Snapshot by Sale Type - SFR Only Available List Price
UW Bothell + Cascadia College Campus Master Plan Update
 STANDING COMMITTEES F 8 Finance and Asset Management Committee UW Bothell + Cascadia College Campus Master Plan Update INFORMATION ITEM This item is for information only. BACKGROUND In June of 2016, the
Puerto Rico Housing Finance Authority Housing Stimulus Programs
 Puerto Rico Housing Finance Authority Housing Stimulus Programs March 31, 2012 (Final with US Data) Total sales assisted by PRHFA stimulus from $240MM Fund Assignment As of March 31, 2012 Silent Second
Attached for release to the market is a Canberra Update booklet that was provided today as part of an Analyst and Investor tour of Canberra.
 23 June 2010 MIRVAC GROUP CANBERRA Attached for release to the market is a Canberra Update booklet that was provided today as part of an Analyst and Investor tour of Canberra. For further information please
Fourth Quarter Multi-Family Market Report 2017
 Fourth Quarter Multi-Family Market Report 2017 03 04 04 05 05 06 07 07 08 10 Executive Summary National Economy Local Economy OKC Multi-Family Market Leasing by Class and Unit Mix OKC Multi-Family Market
California Housing Market Update. Monthly Sales and Price Statistics May 2018
 California Housing Market Update Monthly Sales and Price Statistics May 2018 Sales Lost Momentum as Mortgage Rates Continued to Climb California, May 2018 Sales: 409,270 Units, +0.3% YTD, -4.6% YTY 700,000
Management. Paradigm Development. Joseph Drabkin. Paradigm Development 21
 Management Joe Drabkin is President and co-founder of Paradigm Real Estate Group, which offers triple net commercial real estate investments, asset and property management, brokerage and development projects
F 5 STANDING COMMITTEES. Metropolitan Tract Performance Report. For the quarter ended June 30, B. Finance, Audit and Facilities Committee
 F 5 VII. STANDING COMMITTEES B. Finance, Audit and Facilities Committee Metropolitan Tract Performance Report For the quarter ended June 30, 2008 F 5/209-08 9/18/08 METROPOLITAN TRACT PERFORMANCE REPORT
Waterfront Market Analysis
 PORT OF VANCOUVER Waterfront Market Analysis PREPARED FOR PREPARED BY LELAND CONSULTING GROUP People Places Prosperity JULY 2015 1 Presentation Summary Project Context Phase 1 Office Market Hotel Market
FOR SALE MAHN PLAZA. John Son. my.leeorange.net/11512magnolia bre #
 FOR SALE 11512 Magnolia Street Garden Grove, CA Exclusive Advisor: John Son 714.564.7183 json@lee-associates.com bre #01069091 my.leeorange.net/11512magnolia TABLE OF CONTENTS FINANCIAL INFORMATION Financial
PORTLAND DEVELOPMENT COMMISSION Portland, Oregon. River District Housing Implementation Strategy Annual Report
 PORTLAND DEVELOPMENT COMMISSION Portland, Oregon DATE: August 8, 2001 TO: FROM: The Commissioners Donald F. Mazziotti REPORT NO.: 01-73 SUBJECT: River District Housing Implementation Strategy Annual Report
Monthly Indicators % % - 9.2%
 Monthly Indicators 2016 New Listings were down 1.4 percent for single family/duplex homes and 25.0 percent for townhouse-condo properties. Pending Sales increased 58.3 percent for single family/duplex
2019 Housing Market Forecast. Palos Verdes Peninsula AOR January 8, 2019 Jordan G. Levine Senior Economist
 2019 Housing Market Forecast Palos Verdes Peninsula AOR January 8, 2019 Jordan G. Levine Senior Economist Overview Good News: Economic fundamentals solid Homeownership still the dream Rates might not go
Multifamily Month In Review: New York City January 2016 Released March 2016 By Ariel Property Advisors
 Multifamily Month In Review: New York City January 2016 Released March 2016 By Ariel Property Advisors Join Our Network: e-mail join@arielpa.com or visit arielpa.nyc 212.544.9500 I arielpa.nyc 122 East
Minneapolis St. Paul Residential Real Estate Index
 University of St. Thomas Minneapolis St. Paul Residential Real Estate Index September 2017 Welcome to the latest edition of the UST Minneapolis St. Paul Residential Real Estate Index. The University of
665 Lenox Avenue MIXED USE WALK-UP BUILDING
 MIXED USE WALK-UP BUILDING Corner Property on Lenox Avenue-19,546 SF 20 Residential Units 6 Commercial Units FOR SALE ASKING PRICE: $8,200,000 Building Features Location On the northwest corner of West
HOUSTON REBOUNDED QUICKLY MULTI-HOUSING OFFICE INDUSTRIAL & RETAIL
 HFF s Houston office assembled the following carefullyanalyzed data to most accurately depict the damage caused by Tropical Storm Harvey to Houston. Harvey was the worst rain event in U.S. history Over
SILVERTON MANOR FOR SALE. 992 N 2nd Street, Silverton, Oregon Property Highlights
 FOR SALE SILVERTON MANOR 992 N 2nd Street, Silverton, Oregon 97381 Property Highlights Upside in Rents Assumable Long Term Financing in Place Recently Renovated (new windows, new gutters & fresh paint)
A 290-UNIT RESIDENTIAL DEVELOPMENT IN DOWNTOWN SAN JOSE
 EXECUTIVE SUMMARY GARDEN GATE TOWER SAN JOSE, CA A 290-UNIT RESIDENTIAL DEVELOPMENT IN DOWNTOWN SAN JOSE EXECUTIVE SUMMARY Cushman and Wakefield, as exclusive advisor, is pleased to present the opportunity
June 2008 MLS Month in Review
 June 28 MLS Month in Review The Greater Albuquerque Real Estate Market continues to be strong. REALTORS put 1,769 homes under contract in the month of June. For our Market Area, sales are up 9.5% for Detached
Analysis of Current and Forecasted Demand for Housing in North America
 Analysis of Current and Forecasted Demand for Housing in North America TIMBER MEASUREMENT SOCIETY Central Meeting April 9, 2015 Coeur d Alene, Idaho Delton Alderman Forest Products Marketing Unit Forest
WESTCHESTER COUNTY MARKET OVERVIEW AND DEVELOPMENT TRENDS
 WESTCHESTER COUNTY MARKET OVERVIEW AND DEVELOPMENT TRENDS PACE LAND USE LAW CENTER ANNUAL CONFERENCE PRESENTED BY: WILLIAM V. CUDDY, JR. December, 2017 PAGE 0 MULTIFAMILY RESIDENTIAL AND ECONOMIC DEVELOPMENT
Multifamily Month In Review: New York City december 2015 Released February 2016 By Ariel Property Advisors
 Multifamily Month In Review: New York City december 2015 Released February 2016 By Ariel Property Advisors Join Our Network: e-mail join@arielpa.com or visit arielpa.nyc 212.544.9500 I arielpa.nyc 122
California Housing Market Update. Monthly Sales and Price Statistics October 2018
 California Housing Market Update Monthly Sales and Price Statistics October 2018 Sales Had the 2 nd Largest Drop in the Last 6 Months California, October 2018 Sales: 397,060 Units, -3.7% YTD, -7.9% YTY
Published in Spring 1986 Issue The Real Estate Appraiser & Analyst Society of Real Estate Appraisers 1
 (1) Published in Spring 1986 Issue The Real Estate Appraiser & Analyst Society of Real Estate Appraisers 1 Alternative Valuation Methods for Leasehold Properties By Tony Sevelka, AACI, SREA, MAI, CRE Introduction
Monthly Indicators % % %
 Monthly Indicators 2016 Percent changes calculated using year-over-year comparisons. New Listings were down 27.6 percent for single family homes and 41.8 percent for townhouse-condo properties. Pending
First Quarter Multi-Family Market Report 2018
 First Quarter Multi-Family Market Report 2018 03 04 04 05 05 06 07 07 08 10 Executive Summary National Economy Local Economy OKC Multi-Family Market Leasing by Class and Unit Mix OKC Multi-Family Market
May 2008 MLS Month in Review
 May 28 MLS Month in Review The Albuquerque Market continues to improve, and it s evident that finally, the negative media is turning into positive media. This month s TOP Selling Price Range is $2K to
California Housing Market Update. Monthly Sales and Price Statistics September 2018
 California Housing Market Update Monthly Sales and Price Statistics September 2018 Sales Had the Largest Decline since March 2014 California, September 2018 Sales: 382,550 Units, -3.3% YTD, -12.4% YTY
Houston s industrial leasing activity decreases 42.7% over the quarter - vacancy rate remains under 5.0%
 Research & Forecast Report HOUSTON INDUSTRIAL Q3 2015 Houston s industrial leasing activity decreases 42.7% over the quarter - vacancy rate remains under 5.0% Lisa Bridges Director of Market Research Houston
1761 AMSTERDAM AVE 5 STORY, CORNER MIXED USE BUILDING
 1761 AMSTERDAM AVE 5 STORY, CORNER MIXED USE BUILDING 13 Residential Units & 2 Commercial Tenants 1761 AMSTERDAM AVENUE - PROPERTY OVERVIEW Property Description Cushman & Wakefield has been retained on
Metropolitan Area Statistics
 Metropolitan Area Statistics Apartment Completions 1Q 2011 1Q 2012 % Chg Atlanta - - n/a Boston 133 39-71% Chicago - 20 n/a Cleveland - - n/a Columbus - 272 n/a Dallas-Ft. Worth 604 1,059 75% Denver 328
RALEIGH-DURHAM MULTIFAMILY Year End 2017
 Research Report -DURHAM MULTIFAMILY Year End 2017 Multifamily Growth Expected to Continue in 2018, Despite a Moderate Decrease in Permitting Totals Emily Bostic Research Analyst Raleigh-Durham Key Takeaways
LAS VEGAS, NEVADA A 105,000 SQUARE FOOT VONS GROCERY ANCHORED SHOPPING CENTER IN THE GROWING NORTHWEST LAS VEGAS SUBMARKET
 LAS VEGAS, NEVADA A 105,000 SQUARE FOOT VONS GROCERY ANCHORED SHOPPING CENTER IN THE GROWING NORTHWEST LAS VEGAS SUBMARKET THE OPPORTUNITY Centennial Crossroads Plaza (the Property ), is a welloccupied
7/14/2016. Needed Housing. Workforce Housing. Planning for Needed Housing June 30, 2016 GOAL 10: HOUSING OAR (10)
") Needed Housing Planning for Needed Housing June 30, 2016 Damon Runberg, Oregon Employment Dept. Jim Long, City of Bend Affordable Housing Mgr. Tom Kemper, Housing Works Executive Director GOAL 10: HOUSING
Needed Housing Planning for Needed Housing June 30, 2016 Damon Runberg, Oregon Employment Dept. Jim Long, City of Bend Affordable Housing Mgr. Tom Kemper, Housing Works Executive Director GOAL 10: HOUSING
Market Overview TAMPA BAY OFFICE THIRD QUARTER
 Market Overview TAMPA BAY OFFICE THIRD QUARTER 29 COLLIERS ARNOLD TAMPA BAY Insights on the Market OFFICE THIRD QUARTER 29 MARKET INDICATORS TAMPA BAY INVENTORY 8,58,612 Sq. Ft. Q3 Q4* OVERALL VACANCY
657 S Belvoir South Euclid, OH Mark Khuri
 657 S Belvoir South Euclid, OH 44121 Overview Property Type: Multi-Family Size: 6,612 sq ft Sale Price: $499,000 # of Units: 8 Year Built: 1972 # of Stories: 2 Construction: Brick Parking Type: Covered
Monthly Market Watch for the Prescott Quad City Area. Provided by Keller Williams Check Realty Statistics from August 2012 Prescott MLS
 August 2012 Monthly Market Watch for the Prescott Quad City Area Provided by Keller Williams Check Realty Statistics from August 2012 Prescott MLS Report Overview: This report includes MLS data for the
WATERFRONT REDEVELOPMENT SITE
 1362 NW NAITO PKWY PORTLAND, OREGON WATERFRONT REDEVELOPMENT SITE Offering Brochure // May 2016 Contact for additional details on this opportunity: Graham Taylor graham.taylor@cbre.com + 1 503 221 4830
THE PESCADERO VACATION HOMES PESCADERO DRIVE / SAN DIEGO, CA 92107
 1466-74 PESCADERO DRIVE / SAN DIEGO, CA 92107 TABLE OF CONTENTS Confidentiality & Disclaimer All materials and information received or derived from ACRE Investment Real Estate Services, LLC its directors,
Housing Price Forecasts. Illinois and Chicago PMSA, December 2015
 Housing Price Forecasts Illinois and Chicago PMSA, December 2015 Presented To Illinois Association of Realtors From R E A L Regional Economics Applications Laboratory, Institute of Government and Public
RALEIGH-DURHAM MULTIFAMILY MIDYEAR Demand at an All-Time High, Skyrocketing Same-Unit Rents. Research & Forecast Report.
 Research & Forecast Report RALEIGH- MULTIFAMILY MIDYEAR 2015 Demand at an All-Time High, Skyrocketing Same-Unit Rents Market Indicators Relative to prior period VACANCY Raleigh-Durham JAN 2015 Raleigh-Durham
California Housing Market Update. Monthly Sales and Price Statistics December 2018
 California Housing Market Update Monthly Sales and Price Statistics December 2018 Sales Reached the Lowest Level since Jan 2015 California, December 2018 Sales: 372,260 Units, -5.2% YTD, -11.6% YTY 700,000
BANK OF AMERICA PLAZA
 BANK OF AMERICA PLAZA LITTLE ROCK, ARKANSAS High-Rise Office Tower Exceptional Repositioning or Redevelopment Opportunity Little Rock Central Business District EXECUTIVE SUMMARY THE OFFERING CBRE, as exclusive
Puerto Rico Housing Finance Authority Housing Stimulus Programs
 Puerto Rico Housing Finance Authority Housing Stimulus Programs June 30, 2011 (Preliminary June US data not yet available) Total sales assisted by PRHFA stimulus from $180MM Fund Assignment As of June
July 2012 was $162,256. ($153,956). was $314,607. was $172,488. ($164,426). Kansas City Region Average Sales Price - Existing Homes
. was $314,607. was $172,488. ($164,426). Kansas City Region Average Sales Price - Existing Homes") July 212 Kansas City Regional Real Estate Market Report Average Sales Price The average exis ng home sale price in July 212 was $162,256. 25 Kansas City Region Average Sales Price - Existing Homes July
July 212 Kansas City Regional Real Estate Market Report Average Sales Price The average exis ng home sale price in July 212 was $162,256. 25 Kansas City Region Average Sales Price - Existing Homes July
Lancaster Commercial & Industrial Market Overview. February 14, 2018
 Lancaster Commercial & Industrial Market Overview February 14, 2018 2017 Macro Economic Assumptions GDP (2017 Average for 4 Quarters) 2.6% 2017 Actual 2018 Forecast Total GDP 2.6% 2.75% to 3.5% Consumer
OFFERING MEMORANDUM LAKESHORE DRIVE STRIP LAKESHORE DRIVE LAKE ELSINORE, CA
 OFFERING MEMORANDUM LAKESHORE DRIVE STRIP 16746 LAKESHORE DRIVE LAKE ELSINORE, CA 2 MATTHEWS REAL ESTATE INVESTMENT SERVICES LAKESHORE DRIVE STRIP 16746 LAKESHORE DRIVE LAKE ELSINORE, CA I II III 04-05
MARKET OUTLOOK FOR SAN MATEO
 MARKET OUTLOOK FOR SAN MATEO Jonathan Smoke Chief Economist August 2, 2016 NATIONAL TRENDS 2 JOB CREATION REBOUNDED IN JUNE 229,000 jobs created by month in 2015; 172,000 average this year Employment and
SINGLE HOUSING FORECAST
 SINGLE HOUSING FORECAST Harper Lee Collins RE/MAX Heritage WHERE IS THE NATIONAL MARKET NOW? National Association of Realtors: November 2011 November 2012 Total Sales: Up 14.5% Median Price: Up 10.1% Pending
MEMORANDUM ADDENDUM. Dan Moye, Economic Development Corporation of Kansas City, Missouri
 MEMORANDUM ADDENDUM TO: FROM: Dan Moye, Economic Development Corporation of Kansas City, Missouri Fran Lefor Rood, SB Friedman Development Advisors Direct: (312) 424-4253; Email: frood@sbfriedman.com DATE:
METROPOLITAN TRACT PERFORMANCE REPORT For the Quarter Ended September 30, 2005
 F-8 METROPOLITAN TRACT PERFORMANCE REPORT For the Quarter Ended September 30, 2005 Finance, Audit & Facilities Committee vember 18, 2005 CONSOLIDATED METROPOLITAN TRACT PROPERTIES Quarterly Summary Quarterly
THE POWER of Multifamily Investing
 THE POWER of Multifamily Investing 12M Investment Properties, LLC A Commercial Multifamily Real Estate Investment Firm BENEFITS TO INVESTING IN COMMERCIAL Multifamily Real Estate 2 1 2 3 4 Principal Safety:
RALEIGH-DURHAM MULTIFAMILY Q Unprecedented Investment Sales Crush All-Time Records in Research & Forecast Report.
 Research & Forecast Report RALEIGH-DURHAM MULTIFAMILY Q4 2015 Unprecedented Investment Sales Crush All-Time Records in 2015 Market Indicators Relative to prior period - Q4 2014 - Q4 2015 Emily Bostic Research
REAL ESTATE MARKET REVIEW
 MULTIFAMILY 2014 HAMPTON ROADS REAL ESTATE MARKET REVIEW Author Charles Dalton Data Analysis Real Data Financial Support The E.V. Williams Center for Real Estate and Economic Development (CREED) functions
4TH & BELL 5TH & JOHN
 314 BELL STREET, SEATTLE, WA 98121 HIGH RISE ZONING 124 & 130 5TH AVENUE NORTH, SEATTLE, WA 98109 MID RISE ZONING DOWNTOWN SEATTLE DEVELOPMENT SITES Elliott Bay DOWNTOWN SEATTLE BELLTOWN QUEEN ANNE SEATTLE
Second Quarter Industrial Market Report 2017
 Second Quarter Industrial Market Report 2017 03 04 04 04 05 06 08 09 10 11 13 Executive Summary National Economy Local Economy Oklahoma City Industrial Market Leasing Net Absorption and Inventory Rental
METROPOLITAN TRACT PERFORMANCE REPORT For the Quarter Ended June 30, 2006
 F-5 METROPOLITAN TRACT PERFORMANCE REPORT For the Quarter Ended June 30, 2006 Finance, Audit & Facilities Committee September 21, 2006 CONSOLIDATED METROPOLITAN TRACT PROPERTIES Quarterly Summary Quarterly
Housing Price Forecasts. Illinois and Chicago PMSA, October 2014
 Housing Price Forecasts Illinois and Chicago PMSA, October 2014 Presented To Illinois Association of Realtors From R E A L Regional Economics Applications Laboratory, Institute of Government and Public
Monthly Indicators + 4.8% - 3.5% %
 Monthly Indicators 2015 New Listings were up 45.0 percent for single family/duplex homes but decreased 44.1 percent for townhouse-condo properties. Pending Sales increased 14.3 percent for single family/duplex
ATLANTA BUILD FOR RENT 47 HOME SFR PORTFOLIO
 ATLANTA BUILD FOR RENT 47 HOME SFR PORTFOLIO 5224 HANOVER ST ATLANTA, GA 30349 Michael Finch Senior Vice President 480.626.0219 michael.rnch@svn.com Je7 Cline Senior Vice President 480.626.0210 jeq.cline@svn.com
2018 Housing Market Outlook. Central Coast Realty Group Business Symposium February 22, 2018 Oscar Wei Senior Economist
 2018 Housing Market Outlook Central Coast Realty Group Business Symposium February 22, 2018 Oscar Wei Senior Economist Overview Economic Update California Housing Market Outlook Regional Housing Market
Manhattan Rental Market Report November 2015 mns.com
 Manhattan Rental Market Report November 2015 TABLE OF CONTENTS 03 Introduction 04 A Quick Look 07 Mean Manhattan Rental Prices 11 Manhattan Price Trends 12 Neighborhood Price Trends 12 Battery Park City
Competitive Pricing Survey. Summary Report. Subject Property 3/6/2014. Subject Property: Survey Date:
 Competitive Pricing Survey Summary Report Subject Property: Survey Date: Subject Property 3/6/2014 14901 Quorum Drive, Suite 600 Dallas, Texas 75254 cpssupport@axiometrics.com http://www.axiometrics.com
Monthly Indicators % % - 3.5%
 Monthly Indicators 2017 New Listings were up 6.3 percent for the category but decreased 33.1 percent for the category. Pending Sales increased 5.0 percent for but decreased 1.3 percent for. The Median
PARK CHAMPA ARAPAHOE SQUARE DEVELOPMENT OPPORTUNITY ±.65 ACRES (28,489 SF) D-AS-12+ ZONING SITE PEPSI CENTER. Broadway. Park Ave
 D-AS-12+ ZONING SITE PEPSI CENTER. Broadway. Park Ave") & PARK CHAMPA ARAPAHOE SQUARE DEVELOPMENT OPPORTUNITY ±.65 ACRES (28,489 SF) D-AS-12+ ZONING PEPSI CENTER DOWNTOWN DENVER COORS FIELD Broadway SITE Park Ave PRESENTED BY ARA NEWMARK 1800 Larimer Street
& PARK CHAMPA ARAPAHOE SQUARE DEVELOPMENT OPPORTUNITY ±.65 ACRES (28,489 SF) D-AS-12+ ZONING PEPSI CENTER DOWNTOWN DENVER COORS FIELD Broadway SITE Park Ave PRESENTED BY ARA NEWMARK 1800 Larimer Street
2.8M SF of construction paired with high occupancy rates prove Austin s office market is hotter than ever in 3Q 2014.
 Q3 2014 OFFICE MARKET AUSTIN OFFICE MARKET RESEARCH & FORECAST REPORT 2.8M SF of construction paired with high occupancy rates prove Austin s office market is hotter than ever in 3Q 2014. AUSTIN OFFICE
SE Michigan Residential Real Estate Recovery Are we there yet or is it over?
 SE Michigan Residential Real Estate Recovery Are we there yet or is it over? Changing View of Residential Transactions Changing View of Residential Transactions 2015 Short Sales 3% Leases Bank 11% Owned
Frontera Crossing. austin, texas. investment summary
 Frontera Crossing austin, texas investment summary Holliday Fenoglio Fowler, L.P. acting by and through Holliday GP Corp. a Texas licensed real estate broker ( HFF ) Frontera Crossing HFF has been exclusively