E. V. WILLIAMS CENTER FOR REAL ESTATE AND ECONOMIC DEVELOPMENT
|
|
|
- Ferdinand Carson
- 5 years ago
- Views:
Transcription

1 H A M P T O N R O A D S E. V. WILLIAMS CENTER FOR REAL ESTATE AND ECONOMIC DEVELOPMENT

2

3 CONTENTS ASSOCIATE PUBLISHER Mike Herron Inside Business SPECIAL PROJECTS MANAGER Tracy King GRAPHIC DESIGN Pico Design & Illustration ADVERTISING SALES Robin Simmons Melissa Page Matt Murphy Message From The Director CREED Executive Committee CREED Advisory Board Members 2007 Hampton Roads Retail Market Survey 2007 Hampton Roads Industrial Market Survey 2007 Hampton Roads Office Market Survey Inside Business 258 Granby Street Norfolk, Virginia Hampton Roads Residential Market Survey 2007 Hampton Roads Multi-Family Market Survey E. V. Williams Center for Real Estate & Economic Development Commercial Real Estate Investment Market Review Data for Old Dominion University E.V. Williams Center for Real Estate and Economic Development Market Survey was collected in the fourth quarter 2006


4
 Real Estate Market Review and Forecast.")
5 MESSAGE FROM THE DIRECTOR Welcome and thank you for joining us for the 2007 Old Dominion University E. V. Williams Center for Real Estate and Economic Development (CREED) Real Estate Market Review and Forecast. This is our 12th annual market report and review and we sincerely appreciate your continued support. If you have ideas for improving upon the market review report, please let us know. Hampton Roads is officially designated the Virginia Beach Norfolk Newport News VA-NC MSA by the Office of Management and Budget. It encompasses 2,628 square miles, has a population of more than 1.6 million and a workforce of nearly 800,000. Hampton Roads is the fourth largest MSA in the southeast US, comprised of 16 cities and counties in Southeastern Virginia and Northeastern North Carolina, and is the largest consumer market between Washington DC and Atlanta. According to the Old Dominion University Economic Forecasting Project, our region s economy continued to grow in 2007 and our regional gross product will soon surpass $70 billion. For comparative purposes, that puts our region s economy ahead of West Virginia and New Hampshire. The bottom line is that our economy continues to expand, which is good news for jobs and good news for the real estate industry. As Chair of the Executive Advisory Board Committee, Joyce Hartman has done a wonderful job galvanizing the many committees of the board. I appreciate her service and all of members of the Executive committee. The Center would not be able to function without their service. If you are interested in becoming a member please contact our Membership Chair, Craig Cope of Liberty Property Trust. CREED membership is one of the most cost effective networking organizations you can ever support. CREED s web site has received over 26,000 page views. As a reminder, please visit by clicking on for the latest information on our region, as well as CREED s activities, members and research. We have a student services section where you can find students who are interested in internships and job opportunities as well as links to other informative web sites. There are many people to thank for their contributions to this report and the annual market review. Our research chair, Brian Dundon and his capable committee deserve many thanks for providing all quality control of our publication. Stephanie Sanker and her committee orchestrate the presentation and reception. Of course, a special thank you to all the volunteers within the real estate and economic development community for providing their expertise and sharing their data. None of this is possible without your commitment. In closing, please note that every effort is made to provide the most accurate information in these reports. Unfortunately, in our registration brochure we incorrectly listed Vivian Turok, our speaker for the office report, as being affiliated with GVA Advantis. Her correct title and affiliation is Senior Vice President Office Leasing with Divaris Real Estate. Our apologies to Vivian and all the employees and principals of Divaris Real Estate for this error. Your continued support is truly appreciated. John R. Lombard, Ph.D. Assistant Professor, Department of Urban Studies and Public Administration Director, E. V. Williams Center for Real Estate and Economic Development Old Dominion University College of Business and Public Administration Norfolk, VA Direct line: (757) Center line: (757)

6
7 THE 2007 EXECUTIVE COMMITTEE OF THE CREED ADVISORY BOARD The purpose of the Advisory Board is to provide professional expertise in various aspects of real estate and economic development to make recommendations to the University concerning policy and operations of the CREED as well as the University's real estate curriculum. The 2007 officers and members of the Board are as follows: Executive Committee Chair......Joyce Hartman Executive Director...John Lombard Vice Chair...Tom Dillon Program Chair...Stephanie Sanker Research/Editorial Chair......Brian Dundon Membership Chair...Craig Cope Curriculum Co-Chairs...Jon Crunkleton...Brad Sanford Sponsorship Chair......Cliff Moore By-Laws Chair...Andrew Keeney Past Chair...Billy King At-Large...Jonathan Guion...Aubrey Layne Market Review Committee Industrial...Billy King Office......Don Crigger Retail......Chris Read...Susan Pender...Mark Pendleton...David Machupa...Anne Millar...Troy Parker Multi-family...Real Data Residential......Van Rose Investment...Jonathan Guion Research/Editorial Committee Brian Dundon Sandi Prestridge Joy Learn Lane Shea Beth Hancock Maureen Rooks Brad Sanford Kristi Sutphin Send to: John R. Lombard, Ph.D Director E. V. Williams Center for Real Estate and Economic Development Old Dominion University 2089 Constant Hall Norfolk, VA Telephone: (757) To obtain additional copies of this report, please go to our website: 7
8 CREED ADVISORY BOARD MEMBERS J. Scott Adams CB Richard Ellis Tom Atherton Mid Eastern Builders, Inc. Jerry Banagan Office of Real Estate Assessor James N. Bradshaw Woolpert Inc. Nancy S. Brookes Global Tower Partners Christopher W. Brown Wachovia Bank, N.A. Stewart H. Buckle, III The Morgan Real Estate Group Rick E. Burnell Atlantic Commercial Real Estate Services, Inc. M. Albert Carmichael NAI Harvey Lindsay Commercial Real Estate Jeff Chernitzer Wall, Einhorn, & Chernitzer Lawrence J. Colorito, Jr., MAI Axial Advisory Group, LLC Jeff Cooper Cooper Realty, Inc. Craig A. Cope Liberty Property Trust Don Crigger, CCIM GVA Advantis Real Estate Services Co. Jon R. Crunkleton Old Dominion University Kim S. Curtis Southern Trust Mortgage Company Cecil V. Cutchins Olympia Development Corporation William G. Darden Hearndon Construction George C. Davis West Neck Community Association Laura B. de Graaf Commercial Real Estate Banking, Bank of America Robert L. Dewey Wilcox & Savage, P.C. Tom M. Dillon Resource Bank Michael Divaris Divaris Real Estate, Inc. Helen Dragas The Dragas Companies Brian Dundon Dundon & Associates Frederick D. Facka Smith Barney Sandra W. Ferebee GSH Residential Sales Corporation Joel T. Flax Goodman & Company Joan Gifford The Gifford Management Group Howard E. Gordon Williams Mullen Hofheimer Nusbaum, P.C. Dennis W. Gruelle Appraisal Consultation Group Jonathan S. Guion, SIOR Sperry Van Ness Elizabeth Hancock Office of the Real Estate Assessor Russell G. Hanson, Jr. Atlantic Mortgage & Investment Co. Carl Hardee Lawson Realty Corporation Warren D. Harris Chesapeake Economic Development John C. Harry John C. Harry, Inc. Joyce Hartman Southside Building Services Dorcas T. Helfant-Browning DTH Properties, LLC Virginia Henderson, MAI Commercial First Appraisers, LLC Terry Johnson Abbitt Realty Maria Kattmann City of Suffolk E. Andrew Keeney Kaufman & Canoles R. I. King, II Thalhimer/Cushman & Wakefield William E. King, SIOR NAI Harvey Lindsay April Koleszar Koleszar Properties, Inc. Barry M. Kornblau Summit Realty Group, Inc. Aubrey L. Layne, Jr. Great Atlantic Management, LLC Tyler H. Leinbach Meredith Construction Co., Inc. 8
9 John R. Lewis, II ECS Mid-Atlantic, LLC Harvey L. Lindsay, Jr. NAI Harvey Lindsay Jeffrey R. Mack Robinson Development Group Lauren H. Marsh NAI Harvey Lindsay Mike Mausteller Advantis Real Estate Services Co. Michael W. McCabe NAI Harvey Lindsay Michael D. McOsker, CCIM Thalhimer/Cushman & Wakefield G. Cliff Moore W. M. Jordan Company Michael A. Nice George Nice & Sons, Inc. Thomas A. O Grady City of Suffolk, Economic Development James N. Owens, CCIM NAI Harvey Lindsay Commercial Real Estate Robert L. Phillips, Jr. Thalhimer/Cushman & Wakefield Victor L. Pickett Laureate Capital Mortgage Bankers Sandra Prestridge City of Norfolk, Economic Development Chris Read CB Richard Ellis F. Craig Read Read Commerical John C. Richards, Jr. CB Richard Ellis/Melody & Co. Rennie Richardson Richardson Real Estate Company Thomas E. Robinson Robinson Development Group Maureen G. Rooks Thalhimer/Cushman & Wakefield Jim V. Rose Rose & Womble Realty Co.,LLC Robert J. Ruhl City of Va Beach, Economic Development Bradley R. Sanford, MAI Dominion Realty Advisors, Inc. Stephanie Sanker GVA Advantis Real Estate Services Co. Ted M. Sherman Continental Properties Corp. Robert M. Stanton Stanton Partners, Inc. Jeremy R. Starkey Monarch Bank Deborah Stearns GVA Advantis Kristine R. Sutphin City of Portsmouth Dept. of Econ. Dev. Leo Sutton Historic Ventures, LLC Michael Sykes Bank of America - Real Estate Banking Group Robert M. Thornton, CRE, CCIM, SIOR Thalhimer/Cushman & Wakefield Richard B. Thurmond William E. Wood & Associates Stewart Tyler, ASA Right of Way Acquisitions and Appraisals, Inc. George D. Vick, III NAI Harvey Lindsay Edward W. Ware Norfolk Redevelopment and Housing Authority H. Mac Weaver, II Wells Fargo Real Estate Group Edward M. Williams William E. Wood & Associates Julia L. Wilson G. L. Wilson Building Co. F. Blair Wimbush Norfolk Southern Corporation Peter E. Winters, Jr. SunTrust Bank Roderick S. Woolard City of Norfolk, Economic Development 9

10

11 The E. V. Williams Center for Real Estate for Real Estate and Economic Development wishes to acknowledge all of the firms, individuals and organizations for providing the necessary real estate information and assistance. Without their support, this survey would not be possible. Abbitt Management Company Amy-Shu Properties B. Bruce Taylor Company Benson and Associates Blackwood Development Brandywine Real Estate Mgmt. Serv. Corp. Budlong Enterprises Cafferty Commercial Real Estate Services CB Richard Ellis Charter Oak Partners Commercial Real Estate Services Cousins Market Center Crown America Divaris Real Estate DLC Management Corporation Dominion Properties Group Drucker and Falk Earle W. Kazis Associates Edens and Avant Equity Capital Realty Erwin L. Greenberg & Associates First Allied Corporation First Republic Global Real Estate and Investment Great Atlantic Commercial Real Estate Griffith Real Estate Services GVA Advantis H&M Investment Corporation Harbor Group International Jefferson Realty Group John Yancey Companies Long and Foster Mall Properties Mark Properties McLesky and Associates NAI Harvey Lindsay New Plan Nichols, Inc. Overton Family Partnership Parker Construction Pembroke Commercial Realty Perrine & Wheeler Phillips Edison Potter and Company Prime Commercial Real Estate Richardson Real Estate Riverdale Management Company Robert Brown and Associates S.L. Nusbaum Realty Co. Sam Segar and Associates Simon Property Group Steve Frazier and Company Thalhimer The Breeden Company The Carrington Company The Cordish Company The Cotswold Group The Katsias Company The Shopping Center Group Waitzer Properties William E. Wood & Associates RETAIL Acknowledgements Author Christopher C. Read CB Richard Ellis Data Analysis/Layout David Chapman Old Dominion University 2007 HAMPTON ROADS MARKET SURVEY Financial Support The E. V. Williams Center for Real Estate for Real Estate and Economic Development (CREED) functions and reports are funded by donations from individuals, organizations and the CREED Advisory Board. The Hampton Roads Association of Commercial Real Estate provided funding for the publishing of this report. Disclosure The data used for this report was provided by agents and owners of the surveyed properties. Approximately five percent of the rent and/or vacancy information was estimated. The data is deemed reliable; however, neither Old Dominion University, the E. V. Williams Center for Real Estate for Real Estate and Economic Development, nor CB Richard Ellis of Virginia, Inc. makes any representation or warranty as to its accuracy.
12 2007 RETAIL General Overview This report analyzes the 2006 retail real estate conditions within the Norfolk Virginia Beach Newport News, Virginia Metropolitan Statistical Area (the MSA ), which is commonly known as Hampton Roads. It provides supply, vacancy, construction, absorption and rent data for the MSA to include a comparison of the Southside and Peninsula areas of Hampton Roads with statistical data for specific submarkets and product types. The survey includes properties from the Southside of Hampton Roads located in the cities of Chesapeake, Norfolk, Portsmouth, Smithfield, Suffolk and Virginia Beach. Properties are also included from the Peninsula of Hampton Roads in Gloucester, Hampton, Newport News, Poquoson, Williamsburg and York County. This survey is believed to be the most comprehensive analysis of retail real estate trends in the MSA. The report includes information on all retail product types including regional malls, freestanding buildings and strip centers of various classifications. The scope of the report also includes a summary of new retail construction, an analysis of absorption, and a review of retail investment sales that have occurred in the region. METHODOLOGY This survey gathered information about strip shopping centers and regional malls located in the MSA that were at least 30,000 square feet in size. Information on retail-oriented freestanding buildings that were at least 23,000 square feet was also collected. Freestanding buildings that contained furniture stores, discounters, grocery stores or category killer retailers that met the established size criteria were included in the survey. Automotive uses and buildings containing downtown storefronts were not included. Although available retail space in many submarkets (e.g., Ghent) is best described as collections of small specialty shops, storefronts or freestanding buildings, practical limitations dictated that the focus of the survey be on larger product types. The survey data was collected between October 2006 and December A questionnaire was mailed to owners, leasing agents and property managers responsible for retail properties meeting the selection criteria. Direct phone contact was utilized as a follow-up to the mailing to encourage participation. Information on square footage for freestanding buildings was obtained from building owners, tax records, store managers and retail real estate representatives. Sales information was obtained from property owners, real estate agents, appraisers, and real estate assessors RETAIL 12
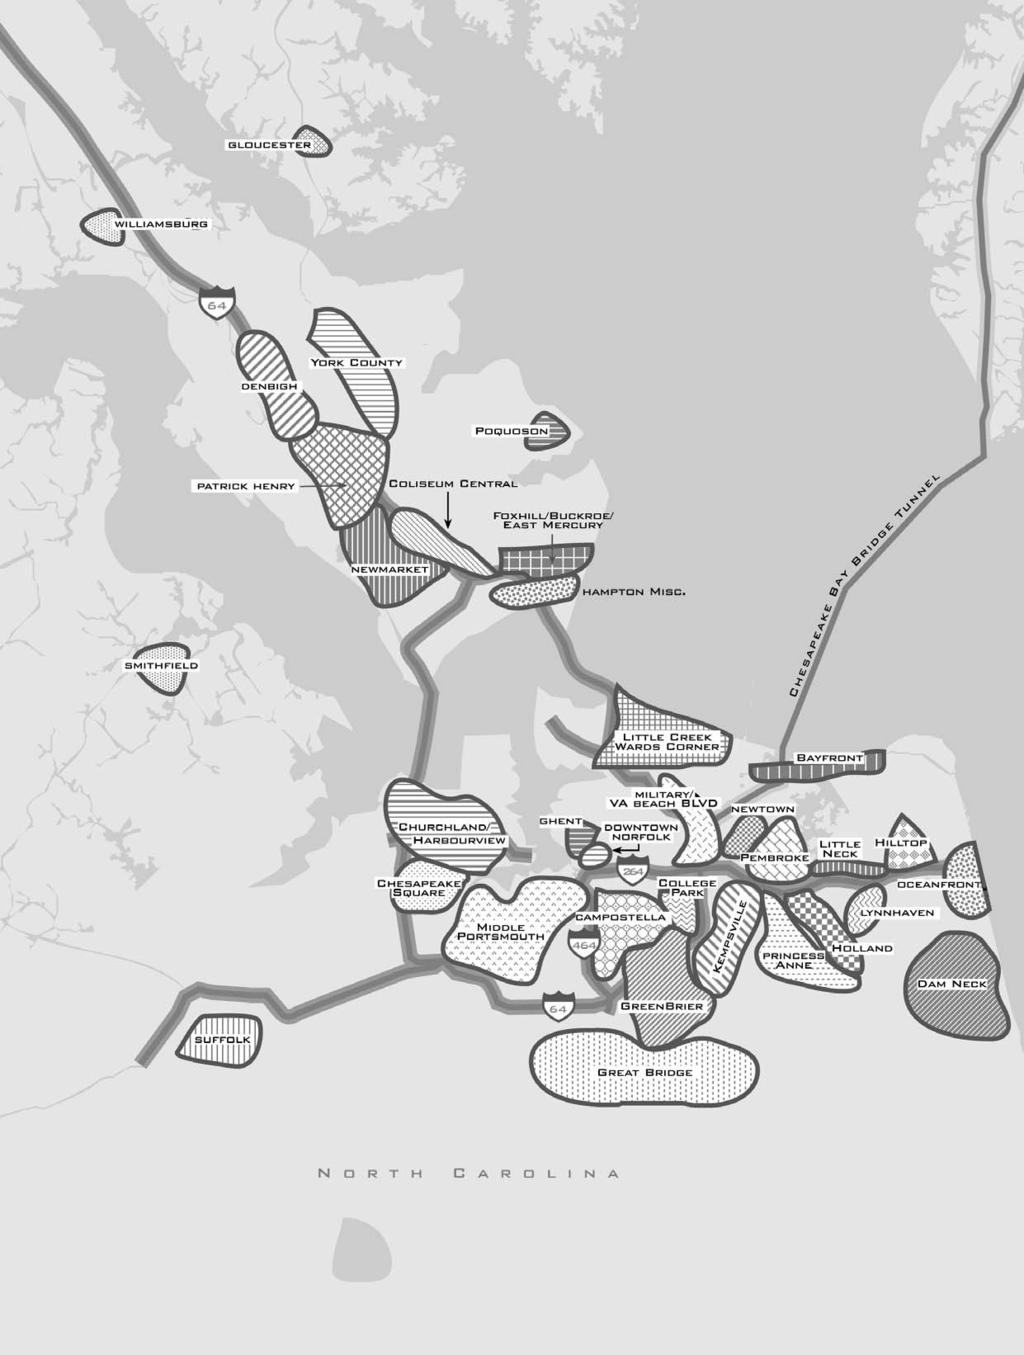
13 DEFINITIONS OF TERMS Asking Rates: The marketing rate per square foot of a retail property (excluding freestanding buildings and malls), exclusive of additional rents that may be paid under a triple net lease. Interpretation of average retail rates in different product types and submarkets should be viewed cautiously given the tremendous variability in rates for like product types and for properties located within the same submarket. Factors such as visibility, co-tenancy and accessibility are some of the many sources of variation in market rates which should also be considered. Big boxes: Contiguous retail space that is at least 23,000 square feet and located in any one of the identified product types. Retailers occupying big boxes include, but are not limited to, the following: category killers, specialty stores, discounters, furniture stores, grocery stores and theaters. Bowling alleys, automotive uses, roller rinks and ice-skating rinks were not included. C.A.M.: Common Area Maintenance Product Types: Properties were classified according to one of the following nine retail product types. The International Council of Shopping Centers defined the first six categories. Three additional categories were included to accurately categorize the remaining properties. Neighborhood Center Community Center Fashion/Specialty Center Power Center Theme Festival Center Outlet Center Freestanding Mall Other 30,000 to 150,000 square feet; supermarket anchored 100,000 to 350,000 square feet; discount department store, supermarket or drug store anchored 80,000 to 250,000 square feet; fashion anchored 250,000 to 600,000 square feet; category killer, home improvement and discount department store anchored 80,000 to 250,000 square feet; restaurants, entertainment anchored 50,000 to 400,000 square feet; manufacturer s outlet store anchored Individual building not considered a shopping center Shopping center with area designed for pedestrian use only Any center that does not fit into a typical category Regional Mall Node: Submarket anchored by regional mall. Small Shop: In-line retail space usually less than 10,000 square feet located in a multi-tenanted shopping center. Submarkets: Hampton Roads was divided into thirty-four retail submarkets (twenty-four Southside submarkets and ten Peninsula submarkets) which reflected general concentrations, pockets or corridors of retail product type. Geographical boundaries of the retail submarkets were influenced by density of existing retail product, physical or geographical obstacles, existing transportation networks, municipality boundaries, population concentrations and retailers perceptions of the MSA. Final determination of specific boundaries of each submarket was made by a subcommittee of the Real Estate Board comprised of retail real estate professionals who are actively involved in the MSA. Also highlighted were specific submarkets that are anchored by regional malls. A map which identifies the general location of each submarket is included in the centerfold of this report. Triple Net Lease: Type of lease under which a tenant pays its pro-rata share of real estate taxes, insurance and common area maintenance. 13
14 2007 RETAIL YEAR IN REVIEW The Hampton Roads market continued to experience strong retail real estate activity throughout the year. Overall vacancy continued to decline and large desirable blocks of retail space were virtually non-existent. National and local retailers were extremely active in the market. Although transaction activity was very brisk, many retailers had a difficult time finding desirable locations. Several large retail development projects that were under construction last year opened during 2006 including Hanbury Commons and Mount Pleasant Markeplace in Southern Chesapeake, Edinburgh North, New Town, City Center, and the redevelopment of Haygood Shopping Center. The Virginia Beach Town Center, a mixed use project which is being developed by Armada Hoffler, continues to progress with construction underway of the Westin Hotel as well as the performing arts center. New retail tenants added to the development include: Gordon Birsch, Relax the Back, Daily Grind, Johnny Rockets, and Brooks 346. Another mixed use development, The City Center at Oyster Point opened in Newport News. Retail tenants signed to the project include: Ann Taylor Loft, J. Jill, Jos. A. Bank, Talbot s, Coldwater Creek, Chico s, Red Star Tavern, and Firkin Pubs. The retail portion of the New Town development in Williamsburg opened and is anchored by Consolidated Theaters, Old Navy and Barnes and Noble. Grocery store expansion in Hampton Roads continues to remain very active. Farm Fresh is under construction in Downtown Norfolk and Suffolk and recently opened at Mount Pleasant Marketplace in Chesapeake and in Haygood Shopping Center in Virginia Beach. Last year, Harris Teeter opened a location in Virginia Beach at Nimmo Parkway and Princess Anne Road and recently opened a second location at the Hanbury Road interchange of the Great Bridge Bypass. Ukrop s opened at Williamsburg Marketcenter and is reported to be looking at another Williamsburg location. Food Lion signed new leases at Williams Court in Portsmouth and at a redeveloped center at the corner of Airline Blvd. and Greenwood Drive to be called Airline Center (the former Robert Hall Village). Both transactions involve relocations. Food Lion also consolidated two stores by opening a new unit at Atlantic Commons in Campostella. Stores were closed at Campostella Corner and Parkview Shopping Center. Food Lion also has plans to convert some of its existing Food Lion units to its Bottom Dollar concept. It is also rumored that Food Lion will be looking for sites for its Bloom concept. A Wal-Mart Supercenter is under construction in Norfolk at the Tidewater Drive and Little Creek Road intersection. Other Wal-Mart Supercenters opened at Dominion Boulevard in Southern Chesapeake and in Portsmouth at the Mid City Shopping Center site. A Super Wal-Mart also just opened in Elizabeth City at the intersection of the Route 17 Bypass and Halstead Extended. Big box retailers remain active in the region, including Wal-Mart, Best Buy, Dick s, Ross, Target and Kohl s. Barnes and Noble and Old Navy opened new locations in Williamsburg s New Town development. Dick s opened in Patrick Henry Mall. Trader Joe s opened in Newport News, and Target joined Home Depot in opening in the Edinburgh section of Chesapeake. Petsmart relocated from Janaf Shopping Center and opened in the third phase of Broad Creek Shopping Center on Military Highway. H&M and Barnes and Noble College Bookstore recently signed leases in MacArthur Center. Other new deals in MacArthur Center include: Zales, The Apple Store and New York Co. Kohl s and Bed Bath and Beyond are reported to have signed leases in the Harbourview section of Northern Suffolk. Deals have also been announced with Best Buy and Dick s in The Marquis development in Williamsburg at the Route 199 interchange. After years of legal issues, Lowe s was finally able to open its store on Virginia Beach Boulevard at Great Neck Road. The Goodman Company has reported deals with Kohl s, Best Buy and Bed Bath and Beyond at its new Landstown Commons development in Virginia Beach. Golds Gym is supposed to open in Norfolk in 2007 and also purchased land to build a new club adjacent to Lowe s at Chesapeake Square 2007 RETAIL 14
15 Infill of second and third generation boxes continued throughout the MSA. Jerry s Art a Rama opened at Fairfield Shopping Center, and Ollie s opened in Hampton, Norfolk, and Virginia Beach. Marshalls signed a lease in Haygood Shopping Center, BJ s opened in Janaf in a former HQ building as well as in Hampton at the Power Plant at the site of a former Super Kmart. Riverside Hospital leased an old grocery store site at the 4000 block of W. Mercury Boulvard in Hampton, and Performance Bicycle opened in London Bridge Plaza in Virginia Beach. Ace Hardware opened in a portion of a former Winn Dixie in Hampton. HAMPTON ROADS MARKET SURVEY The Hampton Roads retail market contained approximately 49,302,916 square feet of gross leasable area ( GLA ) in 390 properties. This year the former Kroger at Pembroke and the former Haynes in Hampton were removed from the retail inventory as a result of both properties being demolished. The U.S. Census Bureau indicates that the population of the MSA is approximately 1,700,000, resulting in 29 square feet of retail supply per person. Certain methodological differences (e.g., the inclusion of freestanding buildings and malls in this survey) make it difficult to compare per capita supply in the MSA to the any national average statistic. Survey information was obtained on 32,407,761 square feet of retail property located in Southside Hampton Roads, accounting for approximately 66% of the total square footage in the market. The average asking rent for small shop space on the Southside was $16.10 per square foot, triple net, which is $1.26 higher than the calendar year 2005 average. The reported size of the Peninsula was 16,895,155 with an average small shop rent of $15.17 per square foot, triple net. This too was an increase over calendar year 2005 s average rate of $ The Hampton Roads Vacancy Rate, which is down.74% from last year, is the lowest observed in the history of the ODU CREED Market Survey. Overall vacancy is in the single digits on both sides of the water, with a market total of 6.81%. The Southside vacancy rate dropped.90% to 5.79%, while the Peninsula rate fell from 9.18% to 8.76%. In order for new retail construction to be included in this year s report, it must be substantially completed by year-end Having stated that, Hampton Roads welcomed 2,594,843 square feet of retail to the market. More impressive is the fact that a total of 2,318,750 square feet of property was absorbed during
16 2007 RETAIL MARKET OVERVIEW NEW NUMBER OF CONSTRUCTION OCCUPIED ABSORPTION PROPERTIES GLA IN SF VACANT SF % VACANT IN SF IN SF IN SF 2007 Southside ,407,761 1,876, % 1,552,392 30,531,085 1,741,962 Peninsula ,895,155 1,480, % 1,042,451 15,414, ,788 Total ,302,916 3,356, % 2,594,843 45,945,974 2,318, Southside ,852,210 2,063, % 593,520 28,789,123 1,280,869 Peninsula ,337,458 1,499, % 618,179 14,838, ,097 Total ,189,668 3,562, % 1,211,699 43,627,224 1,967, Southside ,184,395 2,676, % 271,610 27,508, ,736 Peninsula ,799,778 1,648, % 185,000 14,151, ,338 Total ,984,173 4,324, % 456,610 41,659, , Southside ,336,266 3,169, % 419,458 27,166, ,138 Peninsula ,094,161 2,027, % 330,000 14,066, ,018 Total ,430,427 5,197, % 749,458 41,233, , Southside ,180,691 3,433, % 574,400 26,747, ,167 Peninsula ,546,085 1,891, % 676,000 13,654, ,008 Total ,726,776 5,324, % 1,250,400 40,402,046 1,467, Southside ,760,443 3,548, % 828,800 26,212,213 1,185,818 Peninsula ,906,530 2,183, % 202,750 12,722, ,563 Total ,666,973 5,732, % 1,031,550 38,934,871 1,428, Southside ,436,515 3,760, % 918,100 25,676,428 (158,181) Peninsula ,477,970 1,997, % 212,229 12,480, ,115 Total ,914,485 5,757, % 1,130,329 38,156,523 (11,066) 2000 Southside ,816,383 2,933, % 2,064,727 25,883,089 1,344,209 Peninsula ,249,617 2,012, % 758,370 13,236, ,785 Total ,066,000 4,945, % 2,823,097 39,120,069 1,636, Southside ,089,939 2,551, % 1,414,805 24,538,880 1,961,927 Peninsula ,548,482 1,604, % 1,253,342 12,944,195 1,592,805 Total ,638,421 4,155, % 2,668,147 37,483,075 3,554, Southside ,463,588 2,886, % No Data 22,576,953 No Data Peninsula ,952,845 1,601, % No Data 11,351,390 No Data Total ,416,433 4,488, % No Data 33,928,343 No Data 2007 RETAIL 16
17 RETAIL SUBMARKETS SOUTHSIDE SUBMARKETS There were 26 retail submarkets on the Southside this year. The average size of the submarkets was 1,246,452 square feet. The largest Southside submarkets were Greenbrier and Military Highway with a combined square footage of 7,583,259 square feet. The Southside has six regional mall nodes totaling 15,525,756 square feet. The range of vacancy rates in Southside submarkets can be seen in the table below. A trend seen in most Southside submarkets was a decrease in vacancy accompanied by an increase in asking small shops rates. New construction in Southside submarkets totaled 1,552,392 square feet this year. SOUTHSIDE BY SUBMARKET AVERAGE NUMBER OF SMALL SHOP PROPERTIES GLA IN SF VACANT SF % VACANT RATE PSF Bay Front 4 213,821 3, % $16.33 Birdneck/Oceanfront 4 191, % $11.50 Campostella 6 332,904 78, % $13.56 Chesapeake Square 9 2,132, , % $14.33 Churchland-Portsmouth/Harborview 14 1,034,680 80, % $13.54 Dam Neck 6 1,102,697 10, % $19.08 Downtown 3 1,281,338 35, % $13.75 Ghent 9 406,857 79, % $15.50 Great Bridge 18 1,363, , % $16.88 Greenbrier/Battlefield Boulevard 23 4,091, , % $20.14 Hilltop/Great Neck 12 1,534,848 5, % $21.05 Holland/Green Run 9 1,014,004 32, % $14.13 Indian River/College Park (Including Chesapeake) 4 482,309 24, % $12.75 Kempsville 11 1,222,988 39, % $16.34 Little Creek Road /Wards Corner/ Ocean View 18 1,897, , % $12.96 Little Neck 10 1,414, , % $15.57 Lynnhaven Road 1 12, % $12.00 Lynnhaven Road (Virginia Beach BoulZZ*`evard To Holland Road) 7 1,807, , % $20.67 Middle Portsmouth 13 1,473,920 72, % $13.15 Military Highway/Janaf 17 3,491, , % $15.11 Newtown 9 475,260 87, % $12.39 ODU 1 36,500 4, % $22.00 Pembroke 23 2,721, , % $19.25 Princess Anne Road (From Kempsville Road To Holland Road) 12 1,376,539 9, % $17.30 Smithfield 4 256,764 2, % $15.00 Suffolk 12 1,038,148 65, % $17.22 Grand Total ,407,761 1,876, % $
18 2007 RETAIL PENINSULA SUBMARKETS There were 10 retail submarkets on the Peninsula with an average size of 1,689,515 square feet. The two largest Peninsula submarkets are still Patrick Henry and Coliseum Central, each anchored by a regional mall and with a combined square footage of 7,839,977 square feet. Vacancy rates range from 3.02% at Patrick Henry to 19.79% in the Gloucester submarket. The Peninsula had 1,042,451 square feet of new construction in Vacancy was down in several Peninsula submarkets and average asking rents were up in most submarkets. PENINSULA BY SUBMARKET AVERAGE NUMBER OF SMALL SHOP PROPERTIES GLA IN SF VACANT SF % VACANT RATE PSF Coliseum Central 15 3,472, , % $16.75 Denbigh 14 1,458, , % $13.25 Foxhill/Buckroe/East Mercury 7 703,961 59, % $13.40 Gloucester 8 980, , % $14.63 Hampton Miscellaneous 2 118,882 22, % $10.75 Newmarket/Main 13 1,413, , % $11.02 Patrick Henry/Oyster Point/Kiln Creek 31 4,367, , % $17.50 Poquoson 2 108,521 9, % $15.00 Williamsburg 29 3,386, , % $18.13 York County ,402 66, % $13.28 Total ,895,155 1,480, % $15.17 RETAIL PRODUCT TYPE The Neighborhood Center was the predominant product type, with 144 properties totaling over 11 million square feet of leasable area or 23% of the total retail market. Community centers comprised 20% of the available retail supply, which equated to just under 10 million square feet. Market composition for the predominant product types is depicted in the adjacent chart. Vacancy rates range from 0% in Theme-Festival and Outlet Centers to 10.23% in Community Centers. Neighborhood Center vacancy decreased to 8.61%. This decrease can mainly be attributed to a very strong small shop leasing market. Almost every product type continued the downward trend in general vacancy RETAIL 18
19 TOTAL RETAIL PRODUCT BY TYPE NEW AVERAGE NUMBER OF CONSTRUCTION SMALL SHOP AVERAGE PROPERTIES GLA IN SF IN SF VACANT SF % VACANT RATE PSF CAM PSF Neighborhood Centers ,141, , , % $14.66 $2.19 Community Centers 54 9,861, ,611 1,008, % $16.43 $2.28 Fashion / Specialty 11 1,326, ,012 93, % $22.56 $4.08 Power Centers 27 9,019,340 1,050, , % $20.17 $2.81 Theme Festival 1 100, % No data No data Outlet 1 349,927 20, % No data No data Other 66 2,413, , % $15.57 $2.57 Freestanding 76 7,747, , , % No data No data Mall 10 7,344, , % No data No data Total ,302,916 2,594,843 3,356, % $15.79 $2.39 SOUTHSIDE BY TYPE AVERAGE NUMBER OF SMALL SHOP AVERAGE PROPERTIES GLA IN SF VACANT SF % VACANT RATE PSF CAM PSF Neighborhood Centers 100 7,924, , % $14.97 $2.32 Community Centers 35 6,095, , % $16.30 $2.44 Fashion / Specialty 9 926,273 52, % $22.56 $4.08 Power Centers 18 5,717, , % $20.57 $3.10 Theme Festival 1 100, % No data No data Other 45 1,553,946 82, % $15.84 $2.65 Freestanding 44 4,531, , % No data No data Mall 7 5,558, , % No data No data Total ,407,761 1,876, % $16.10 $2.55 PENINSULA BY TYPE AVERAGE NUMBER OF SMALL SHOP AVERAGE PROPERTIES GLA IN SF VACANT SF % VACANT RATE PSF CAM PSF Neighborhood Centers 44 3,217, , % $13.97 $1.91 Community Centers 19 3,765, , % $16.66 $1.97 Fashion / Specialty 2 399,851 41, % No data No data Power Centers 9 3,302, , % $19.56 $2.36 Outlet Center 1 349, % No data No data Other ,084 66, % $15.05 $2.40 Freestanding 32 3,216,051 86, % No data No data Mall 3 1,785, , % No data No data TOTAL ,895,155 1,480, % $15.17 $
20
21 RETAIL SUBMARKETS Southside Bayfront Birdneck/Oceanfront Campostella Chesapeake Square Churchland/Harbourview Dam Neck Downtown Norfolk Ghent Great Bridge Greenbrier/Battlefield Boulevard Hilltop/Great Neck Holland/Green Run Indian River/College Park Kempsville Little Creek Road/Wards Corner Little Neck Lynnhaven Middle Portsmouth Military Highway/Janaf Newtown Pembroke Princess Anne Smithfield Suffolk Peninsula Coliseum Central Denbigh Foxhill/Buckroe Gloucester Hampton Miscellaneous Patrick Henry Poquoson Newmarket/Main Williamsburg York County 21
22 2007 RETAIL BIG BOX VACANCY Big box vacancy in Hampton Roads totaled 1,777,050 square feet for This number represents 53% of total retail vacancy in the market. Square footage of big box vacancy continued to decrease with redevelopment of boxes and retailers expanding into second generation space. On the Southside, big box vacancies of 957,887 square feet accounted for 51% of all Southside retail vacancy; on the Peninsula, the 819,163 square feet of big box vacancy accounted for 55% of all Peninsula retail vacancy. Big box retailers aggressively expanded in 2006, resulting in the highest rate of absorption in seven years. In 2007, big box absorption will continue to fuel new development in the market. There are currently very few opportunities in the market for second generation big box users. VACANCY BY SUBMARKET Southside 1,316,595 1,607,323 2,073,115 2,207,416 2,220,935 1,906,391 1,513,523 1,142, ,887 Peninsula 864,474 1,232,255 1,328,841 1,435,489 1,407,021 1,556,029 1,141, , ,163 TOTAL 1,950,441 2,839,578 3,401,956 3,642,905 3,627,956 3,462,420 2,654,730 2,124,582 1,777,050 Big Box Vacancy Vacant Square Feet 4,000,000 3,500,000 3,000,000 2,500,000 2,000,000 Southside Peninsula TOTAL 1,500,000 1,000, , RETAIL 22
23 NEW DEVELOPMENT A tremendous amount of retail development continued in 2006 in Hampton Roads. Leading the way are the cities of Chesapeake and Virginia Beach. They are as follows: Chesapeake 1. Cahoon Commons Crescent Development / Sun Life (Under Construction) 2. Hanbury Commons Armada Hoffler (Complete) 3. Mount Pleasant Marketplace Stanton Partners/ RDG (Complete) 4. Edinburgh Commons Ellis Gibson Development (East & North Phase Complete) Virginia Beach 1. Courthouse Marketplace Armada Hoffler (Complete) 2. Redmill Walk Ellis Gibson Development (Planned) 3. Shops at Town Center Sifen & Co. (Planned) 4. City Walk Sandler ( Planned) 5. Landstown Commons The Goodman Company (Under Construction) Newport News 1. Jefferson Commons Goodman Company (Complete) 2. The Village of Stoney Run The Breeden Company (Under Construction) Isle of Wight 1. The Shoppes at Eagle Harbor The Breeden Company 2. Benn s Church Armada Hoffler (Planned) Suffolk 1. Bennett s Creek Shopping Center Stanton Partners/RDG (Under Construction) 2. Obici Place RDG (Planned) York County 1. Williamsburg Market Center Robert Brown & Associates (Complete) Williamsburg 1. Windsor Meade S.L. Nusbaum Realty Co. (Complete) 2. Settlers Market AIG (Planned) 3. High Street (Planned) 4. New Town Developers Realty (Complete) 5. Quarterpath Crossing S.L. Nusbaum Realty Co. (Planned) 23

24 2007 RETAIL The following is a list of the properties included in this year s survey listed by submarket with a code representing the type of property. The GLA of the property is also listed. A Neighborhood Center F Outlet Center B Community Center G Other C Fashion/Specialty Center H Freestanding D Power Center I Mall E Theme Festival SOUTHSIDE BAY FRONT Bayside I & II A 79,397 Cape Henry Plaza A 58,424 Kroger H 47,000 Marina Shores G 29,000 BIRDNECK / OCEANFRONT Birdneck SC A 65,460 Farm Fresh H 29,296 Harris Teeter H 48,000 Linkhorn Shops A 48,899 CAMPOSTELLA Atlantic Commons A 63,393 Bainbridge Marketplace A 46,444 Campostella Corner A 43,375 George Washington Commons A 44,942 Holly Point SC A 65,321 Southgate Plaza A 69,429 CHESAPEAKE SQUARE BJ's H 115,660 Chesapeake Center B 296,832 Chesapeake Square Mall I 800,000 Chesp. Sq. D 220,000 Food Chesp. Sq. H 45,000 Home Depot H 130,060 Lowes H 115,000 Taylor Road Plaza A 60,000 Wal-Mart Supercenter / Sam's Club H 350,000 CHURCHLAND / PORTSMOUTH / HARBORVIEW Academy Crossing G 45,483 Churchland Blvd SC (Formerly Farmco Plaza) A 52,966 Churchland Place G 21,000 Churchland SC A 149,741 Churchland Square A 64,989 Grand H 30,000 Harbourview Station East D 217,308 Harbourview Station West D 83,007 Marketcenter at Harbourview A 65,750 Marketplace Square A 12,461 Poplar Hill Plaza B 102,326 Sterling Creek A 75, RETAIL Towne Point Square A 58,989 Western Branch Crossing H 55,000 DAM NECK Dam Neck Square A 67,917 General Booth Plaza A 73,320 K-Mart Plaza / Dam Neck Crossing B 135,656 Red Mill Commons D 586,575 Sandbridge SC A 66,800 Strawbridge Marketplace A 172,429 DOWNTOWN Church Street Crossing A 51,000 MacArthur Center Mall I 1,100,000 Waterside Festival Marketplace I 130,338 GHENT 21st Street Pavilion G 21,000 Center Shops A 129,966 Colley Village A 44,585 Farm Fresh H 40,000 Ghent Place G 13,000 Harris Teeter H 27,000 Palace Shops I, II C 71,794 Palace Station G 38,000 The Corner Shops G 21,512 GREAT BRIDGE Cahoon Commons D 215,000 Cedar Lake A 28,297 Centerville Crossing A 55,000 Crossings at Deep Creek A 68,970 Dominion Marketplace A 73,103 Dominion Plaza SC A 63,733 Former Winn Dixie H 50,000 Glenwood Square A 73,859 Great Bridge SC A 158,000 Hanbury Village A 100,561 Harbor Watch Shoppes G 21,505 Las Gaviotas A 82,000 Millwood Plaza G 16,969 Mt. Pleasant Marketplace A 115,000 Mt. Pleasant Village A 39,970 Wilson Village A 52,500 Woodford Shoppes B 9,760 Woodford Square B 139,623 GREENBRIER / BATTLEFIELD BOULEVARD Battlefield Marketplace G 30,000 Chesapeake Crossing B 287, Crossways Center I & Eden Way Shops D 438,725 Crossways II D 152,686 Edinburgh Commons North D 195,111 Edinburgh East D 133,000 Gainsborough Square A 88,838 Greenbrier Mall I 809,017 Greenbrier Market Center D 487,580 Greenbrier South SC A 97,500 Home Depot H 130,060 K-Mart / OfficeMax H 165,000 Knell's Ridge Square G 40,000 Lowes H 114,000 Orchard Square A 88,910 Greenbrier A 83,711 Regal Cinemas H 60,763 The Shoppes at Greenbrier G 40,000 Townplace at Greenbrier C 78,000 Village Square G 15,000 Volvo Parkway SC G 41,874 Wal-Mart Way Crossing G 80,160 Wal-Mart / Sam's Club / Kohl's D 433,821 HILLTOP / GREAT NECK Great Neck Square A 93,887 Great Neck Village A 73,836 Hilltop East C 100,000 Hilltop North B 202,511 Hilltop Plaza B 152,025 Hilltop Square B 270,093 Hilltop West G 60,000 La Promenade C 63,280 Marketplace at Hilltop C 113,000 Regency Hilltop B 236,549 Renaissance Place G 47,667 Target H 122,000 HOLLAND / GREEN RUN Auburn Place A 44,846 Chimney Hill B 207,175 Green Run Square A 60,000 Holland Plaza SC A 151,967 Holland Windsor Crossing (Super K-Mart) B 237,000 Lowes H 125,323 Lynnhaven Green A 50,838 Shipps Corner A 63,355 Timberlake SC A 73,500
25 INDIAN RIVER / COLLEGE PARK College Park I & II B 181,902 Indian River Plaza B 126,017 Indian River SC A 123,752 Tidewater Plaza A 50,638 KEMPSVILLE Arrowhead Plaza A 97,006 Fairfield SC B 239,763 Kemps Corner Shoppes G 25,929 Kemps River Center A 57,907 Kemps River Crossing B 245,268 Kempsville Crossing A 111,394 Kempsville Plaza A 60,778 Parkway Marketplace A 72,863 Providence Square SC A 135,915 University Shoppes A 26,100 Woods Corner A 150,065 LITTLE CREEK ROAD / WARDS CORNER / OCEAN VIEW Ames / Kroger B 140,568 Dollar Tree Shopping Center A 54,415 East Beach Shoppes A 63,000 Farm Fresh - Little Creek H 66,000 Glenwood Shoppes A 53,255 Little Creek East SC B 189,815 Little Creek Square A 82,300 Meadowbrook S C G 27,260 Mid-Town SC A 75,768 Mid-Way SC G 31,000 Ocean View SC A 73,658 Roosevelt Gardens SC A 109,175 Southern SC B 260,847 Suburban Park B 127,450 Super Wal-Mart H 225,000 Tidewater I & II SC B 126,212 Wards Corner Strip A 61,540 Wedgewood SC A 130,000 LITTLE NECK Ames Plaza B 177,549 Birchwood SC A 358,635 Home Depot H 130,060 Kroger H 45,000 London Bridge Plaza B 120,000 Lowes H 160,000 Lynnhaven Convenience G 36,900 Princess Anne Plaza West C 77,558 Regatta Bay Shops G 60,000 Sam's Club Plaza D 248,604 LYNNHAVEN ROAD Lynnhaven Crossing G 55,550 Lynnhaven East B 97,303 Lynnhaven Mall I 1,293,100 Lynnhaven North B 176,254 Lynnshores Shopping Center G 12,692 Lynnway Place G 30,213 Parkway Plaza G 42,000 Wal-Mart H 113,112 MIDDLE PORTSMOUTH Afton SC A 106,500 Airline Plaza A 99,549 Elmhurst Square A 45,842 Gilmerton Square G 43,236 Manor Commerce Center G 67,060 Manor Village G 14,573 Olde Towne Market Place A 38,200 Rodman SC A 45,000 Super Wal-Mart H 205,000 Triangle SC A 82,430 Victory Crossing D 356,000 Victory West SC A 160,791 Williams Court B 214,739 MILITARY HIGHWAY / JANAF Best Square B 140,030 Broad Creek Phase 3 C 31,161 Broad Creek SC D 364,000 Bromley SC A 55,330 CostCo H 110,000 Dump / Mega Office G 115,854 Farm Fresh H 60,000 Food Lion #170 H 41,000 Grand Outlet H 35,000 Janaf D 836,809 Lowes H 115,000 Military Crossing D 216,524 Military Triangle G 10,061 Northampton Business Center (former 5760 North Hampton Blvd.) G 80,000 Super K-Mart & Shoppes B 200,000 Super Wal-Mart H 224,513 The Military Circle I 856,542 NEWTOWN Cypress Plaza SC A 59,012 Cypress Point A 117,958 Diamond Springs Shoppes G 18,840 Newpointe SC A 92,978 Newtown Baker Crossing A 91,687 Newtown Center G 19,876 Newtown Convenience Center G 19,800 Thomas Corner SC G 23,557 Weblin Square G 31,552 ODU University Village G 36, PEMBROKE Aragona SC A 69,700 Best Buy H 45,000 Bloom Brothers Furniture H 58,000 Circuit City H 38,414 Collins Square A 111,370 Columbus Village East A 63,000 Columbus Village Entertainment Center E 100,000 Dean Plaza (Former HQ) D 140,000 Giant Square B 150,000 Goodwill H 34,000 Haverty's H 55,000 Haygood SC B 160,129 Haynes H 228,000 Hunter's Mill Shoppes G 22,827 Loehmann's Plaza C 139,380 Northern Super Center G 36,588 Pembroke Mall I 570,000 Pembroke Meadows SC A 81,592 Pembroke Place and East Shops B 186,075 Pembroke Plaza G 34,900 Roomstore H 50,000 Value City H 95,000 Virginia Beach Town Center C 252,100 PRINCESS ANNE ROAD Courthouse Marketplace A 122,000 Home Depot H 130,000 Kempsville Marketplace A 71,460 Lynnhaven Square S C G 22,933 Parkway SC A 64,820 Pleasant Valley Marketplace A 86,107 Princess Anne Marketplace B 209,500 Princess One SC A 84,725 Salem Crossing D 392,407 Salem Lakes SC A 37,087 Woodtide SC A 25,500 SMITHFIELD Cypress Run SC G 25,000 Eagle Harbor A 77,400 Smithfield Plaza B 89,120 Smithfield Square A 65,244 SUFFOLK Bennetts Creek Crossing A 114,300 Bennetts Creek Food Lion A 64,544 Holland Plaza A 69,345 Kensington Square A 60,000 Lowes H 150,000 Oak Ridge A 38,700 Suffolk Plaza B 174,221 Suffolk Plaza West A 60,000 Suffolk SC B 85,803 Suffolk Specialty Shops G 15,200

26 2007 RETAIL Suffolk Village SC G 11,875 Wal-Mart Super Center H 194,160 PENINSULA COLISEUM CENTRAL Coliseum Corner A 49,267 Coliseum Crossing B 221,004 Coliseum Mall I 961,396 Coliseum Marketplace A 86,681 Coliseum Specialty Shops G 15,026 Coliseum Square G 45,041 Hampton Towne Centre D 376,100 Hampton Woods A 89,092 Home Depot H 130,060 Riverdale Plaza D 280,133 Sports Authority H 40,000 Target H 122,000 The Power Plant D 621,150 Todd Center & Todd Lane Shops B 242,000 Wal-Mart Super Center H 193,316 DENBIGH Beaconsdale SC A 28,000 Denbigh Crossing A 145,000 Denbigh Speciality Shops G 24,504 Denbigh Village Centre B 334,299 Ferguson Center G 118,000 Former Hills Denbigh H 86,589 Kmart H 115,854 Lee Hall Plaza A 36,000 Newport Crossing B 200,088 Richneck Shopping Center A 63,925 Stoneybrook Shopping Center A 75,000 Turnberry Crossing A 53,775 Village Square A 40,000 Warwick Denbigh SC B 137,925 FOXHILL / BUCKROE / EAST MERCURY Buckroe SC A 76,000 Farm Fresh Phoebus H 39,000 Kmart H 94,500 Langley Square A 146,434 Nickerson A 70,450 Nickerson Plaza A 83,849 Willow Oaks Village Square S.C. B 193,728 GLOUCESTER Food Lion H 40,000 Hayes Plaza SC A 55,504 Hayes SC A 100,000 Home Depot H 100,000 Lowe's H 125, RETAIL Wal-Mart Super Center H 220,000 Winn Dixie Marketplace B 165,000 York River Crossing B 175,000 HAMPTON MISCELLANEOUS G 54,645 Kecoughtan SC A 64,237 The Shops at Hampton Harbor NEWMARKET / MAIN 4113 W Mercury Blvd. H 49, W. Mercury Blvd. H 28,080 Brentwood SC A 53,600 Dresden SC G 35,000 Forest Park Square B 155,000 Francisco Village A 55,865 Hampton Plaza B 173,199 Hilton SC A 74,000 Midway Shopping Center G 58,780 Newmarket South D 387,221 Newmarket B 117,377 Warwick Center A 150,000 Warwick Village A 75,400 PATRICK HENRY / OYSTER POINT / KILN CREEK Bayberry Village A 60,147 Best Buy Building H 135,000 City Center C 149,851 Commonweatlh Center G 30,279 Fairway Plaza G 37,950 Glendale SC G 30,000 Grand Furniture H 35,000 Harris Teeter H 52,334 Haverty's H 45,000 Haynes H 85,000 Hidenwood SC A 108,000 Jefferson Commons D 400,000 Jefferson Greene G 57,430 Jefferson Plaza D 178,200 Kroger H 55,000 Lowes H 120,000 Market Oyster Point A 69,660 Newport Marketplace D 450,000 Newport Square B 184,126 Office Depot H 30,122 Oyster Point Plaza A 73,197 Oyster Point Square A 83,089 Patrick Henry Mall I 644,000 Sam's Club H 133,880 The Shoppes at Oyster Point G 30,000 Victory Kiln Creek A 61,000 Village Kiln Creek B 263,000 Villages of Kiln Creek G 45,300 Wal-Mart Super Center H 201,146 Yoder Plaza SC D 435, POQUOSON Poquoson SC A 57,458 Wythe Creek SC A 51,063 WILLIAMSBURG Colony Square A 66,806 Ewell Station A 68,048 Festival Marketplace G 16,216 Gallery Shops G 18,187 Governor's Green SC A 100,000 Home Depot H 130,000 James York Plaza B 138,677 Kingsgate Green B 138,348 Lowes H 163,000 Marketplace Shoppes G 26,626 Marketplace Shopping Center G 30,000 Monticello Marketplace B 300,000 Monticello SC A 82,000 New Town C 250,000 Norge Crossing H 52,000 Olde Towne SC G 30,000 Prime Outlets F 349,927 Staples H 37,400 Village Shops at Kingsmill G 82,200 Wal-Mart SuperCenter H 210,000 Williamsburg Crossing A 149,933 Williamsburg Farm Fresh A 79,188 Williamsburg Marketcenter B 120,920 Williamsburg Outlet Mall I 180,000 Williamsburg Pavillion Shops G 50,000 Williamsburg SC I & II B 251,000 Williamsburg Towne and Cnty A 49,802 WindsorMeade Marketplace D 174,379 Yankee Candle H 42,000 YORK COUNTY Grafton SC A 32,000 Heritage Square A 81,175 Kiln Creek Center A 45,700 Yorktown A 73,050 Patriots Square A 47,231 Shady Banks SC A 57,654 Wal-Mart SuperCenter H 220,000 Washington Square & Shops B 254,972 York Square A 48,720 Yorkshire Downs G 23,900


27
28
 functions and reports are funded by donations from individuals, organizations and the CREED Advisory Board.")
29 INDUSTRIAL 2007 HAMPTON ROADS MARKET SURVEY Acknowledgements Author Billy King, SIOR Data Preparation Stephanie Sanker Survey Coordination Clay Culbreth, CCIM, SIOR Financial Support The E. V. Williams Center for Real Estate and Economic Development (CREED) functions and reports are funded by donations from individuals, organizations and the CREED Advisory Board. Statistical data provided by Society of Office and Industrial Realtors (SIOR) Comparative Statistics Market Survey. Research data provided by Real Capital Analytics through Sperry Van Ness.
30 2007 INDUSTRIAL General Overview This report analyzes the 2006 industrial real estate conditions within the Virginia Beach-Norfolk-Newport News, VA-NC Metropolitan Statistical Area (the MSA ) that is also known as Hampton Roads. It provides inventory, vacancy, rent, sale and other data for the MSA. The survey includes properties in the cities of Chesapeake, Hampton, Newport News, Norfolk, Poquoson, Portsmouth, Suffolk, Virginia Beach, and Williamsburg, plus the counties of Gloucester, James City, York and Isle of Wight. METHODOLOGY This survey includes the following types of properties: Office-warehouse, industrial and shop facilities of 5,000 square feet or greater, although some facilities of less than 5,000 square feet may be included. Properties must have less than 80% office space to be included in the SIOR/ODU survey. Both owner-occupied and leased properties are included. Owner-occupied is defined as a property that is 100% occupied by a business that is the same as or is related to the owner of the building. All properties that are available and are listed for sale or lease regardless of whether they are occupied, unless they are strictly available for sale as an investment property. For example, a property that is available for sale and is currently occupied on a short-term lease is included. All properties that have commenced construction (foundations installed minimum). The survey excludes the following types of properties: Land Warehouse or shop facilities on shipyard properties Warehouse or other industrial facilities on federal government property (e.g., military installations) Industrial facilities on government property (e.g., Norfolk International Terminal, Newport News Marine Terminal) Functional submarket delineations are determined with minimal regard to city boundaries. The entire market is divided into 16 submarkets defined by industrial building concentrations, the transportation network, and pertinent physical features. The area map included in this report provides a location key for reference. The E. V. Williams Center for Real Estate and Economic Development (CREED) has been tracking the inventory of the Hampton Roads industrial market since The results of the 2007 survey collected during the 4th quarter of 2006 indicate that the Hampton Roads industrial market currently encompasses 100,237,510 total square feet of space located in 2,699 buildings throughout the Region. This is an increase of 3,410,235 square feet, or 3.51% from the last year s survey. The increase is primarily due to expansions of existing buildings and new construction started in the marketplace. As a counter to these increases, there was an elimination of buildings that were demolished or converted to alternative uses (multi-family and retail) INDUSTRIAL 30
31 HAMPTON ROADS OVERVIEW As part of the SIOR National Industrial Survey, the Hampton Roads industrial market is within the South-Atlantic region of the United States, which includes twenty-seven major submarkets spanning from Maryland through Florida. This year, Hampton Roads vacancy rate increased to 5.87% from 5.21% in last year s survey. Last year (2005) was the lowest vacancy rate that has been recorded for the area since the survey started in This year s 2006 vacancy rate of 5.87% is still a historically low rate. The vacancy rate was up in 11 out of 16 area submarkets covered, with 5 submarkets down as compared to Total Hampton Roads market absorption this year was 2.80% or 2,566,823 square feet, as compared with 2.03% (1,826,089 square feet) in This represents a 38% increase in absorption. If 2005 could be termed a break-through year for our Hampton Roads Market, this year was commitment year for Hampton Roads. This is signified by 1) the start-up and substantial completion of 7 major speculative industrial/distribution projects, including high-bay and bread and butter office-warehouse projects and 2) the continuing escalation of lease rates in existing buildings for the vast majority of the market that is served adequately by their existing space. Sale prices of user (owner-occupied) properties continued to escalate beyond even the prices experienced in a remarkable The speculative projects started and substantially completed and referred to above are summarized as follows: 1. Indian River Distribution Center by Ashley Capital 230,741 square feet 2. Enterchange No. 1 - Hampton by Schneider National and Devon Group 243,219 square feet 3. Northgate Logistics Center by George Powers 300,000 square feet 4. Waverton Industrial Village by Waverton Properties 58,800 square feet 5. Shirley T. Holland Commerce Center by Johnson Development 329,766 square feet 6. Chesapeake Industrial Center by West Essex Management 186,000 square feet 7. Bridgeway Commerce Center III by Liberty Property Trust 168,000 square feet Total New Projects Completed and Under Construction 1,515,726 square feet Two projects that had been announced in last year s survey that were not built are the South Suffolk Distribution project by Triumph and the 14 acre Trade Street distribution project in Chesapeake. Overall, 2006 was a quieter year for industrial investment sales, as compared with the watershed year of Among the investment projects trading hands were the First Data Corp property, a 54,000 square feet former user property in Greenbrier which sold as a high-end flex building to First Potomac Realty Trust, and the 90,000 square foot Woodlake Distribution Center, also in Greenbrier, which was sold to a local investor. On the Peninsula in Hampton, the West Park Project of 515,485 square feet (2 buildings) was sold to High Street Equity Advisors for $32,300,000 ($62.47/square feet) Industrial leasing highlights included the following: Lease of the former Dan River Inc. warehouse in PortCentre Commerce Park, Portsmouth to Massimo Zannetti Beverage USA (228,000 square feet) Expansion of Laufen Tiles at Commonwealth Storage (120,000 square feet) Lease by Barton Mines in Chesapeake on Diamond Hill Road (D.D. Jones/First Potomac Realty Trust) (100,000 square feet) Lease of Givens, Inc. at 400 Woodlake Circle, Chesapeake (80,500 square feet) Lease of NYK Logistics to kick-off major Norfolk Logistics Center project in Chesapeake (130,000 square feet) Lease of former Dana Corp. space at Bridgeway Commerce I, Suffolk by Walker International (3PL) (80,000 square feet) 31
32 2007 INDUSTRIAL The breakdown of available space by unit size continues to change from year to year. The most recognizable change in the past year has been a decrease in the smaller spaces available (5,000 20,000 sf), as well as an increase in the largest units (greater than 60,000 sf). The percentages of buildings that are available in each size range are as follows: PERCENTAGE OF AVAILABLE BUILDING BY SIZE RANGE Begin Size (SF) < 5,000 30% 15% 32% 25% 30% 25% 5,000-20,000 40% 52% 44% 40% 42% 30% 20,000-40,000 15% 18% 12% 15% 13% 15% 40,000-60,000 9% 8% 7% 8% 6% 10% > 60,000 6% 7% 5% 12% 9% 20% Industrial land sale highlights included: usable acres purchased in Northgate Commerce Park by a local development partnership at $932,215 or $89,808 per acre. 34 acres purchased on Yadkin Road, east of Cavalier Park in Chesapeake, by ProLogis at $5,780,000+ or $170,000 per acre for The Norfolk Logistics Center acre Glenn site on Kenyon Road, Suffolk bought by McDonald Windward Partners for $2,350,000 ($20,506/Acre) acres purchased by the City of Suffolk at 803 Carolina Road for $1,188,714 ($21,532/Acre). Availability of lease space in the larger size ranges (above 40,000 square feet) was pushed up considerably this year because of the delivery of several new large, high-bay buildings noted above. For Sale opportunities continued to be scarce in all size ranges. As mentioned above, land availability is extremely limited in close-in, central core portions of the Hampton Roads market. This continues to push developers and users to consider and to execute purchases in such outlying submarkets as Suffolk and Isle of Wight. Average market asking rents for small spaces (less than 20,000 square feet) rose substantially during Rates for larger spaces were strong and not yet negatively impacted by the availability of the new projects noted above. This should change in 2007 and Also, an increase in asking rents for all size units is reflective of the decrease in the overall availability. The variance between asking lease rates and final negotiated rates, highly dependent on the age and location of a particular building, has been between 0% and 10% in RENTS FOR AVAILABLE BUILDING BY SIZE RANGE Begin Size (SF) < 5,000 $6.34 $7.16 $6.95 $7.30 $7.75 $7.85 5,000-20,000 $4.46 $5.80 $5.89 $6.20 $6.50 $ ,000-40,000 $4.35 $4.99 $5.21 $5.45 $5.75 $ ,000-60,000 $4.15 $4.13 $4.44 $4.75 $4.95 $5.00 > 60,000 $3.24 $3.43 $3.15 $4.00 $4.30 $ INDUSTRIAL 32
33 SALES OVERVIEW The 2006 sales activity for industrial buildings continued to show price escalations even as compared with Industrial building sales prices predominated in the $35 p.s.f. to $65 p.s.f. range. There were sales that were finalized higher in the $95 p.s.f. to $135 p.s.f. range, as a result of either high-end location, developed yard or surplus land area. Available modern industrial buildings for purchase remained very hard to find in 2006 in all size ranges. PERCENTAGE OF AVAILABLE BUILDING BY SIZE RANGE DATE LOCATION SQ. FT. PRICE $/SF ACRES 2/06 Verizon 31,000 $880,000 $ /06 Viasys 10,293 $1,400,000 $ /06 Sherwin-Williams 16,000 $800,000 $ /06 First Data 54,000 $5,100,000 $ /06 L.A. Services 48,800 $2,200,000 $ /06 IBS America 14,400 $915,000 $ /06 American Road Markings 21,334 $550,000 $ Rent Basis: NNN 33

34
35 INDUSTRIAL SUBMARKETS Southside Suffolk Portsmouth West Norfolk Central Norfolk Cavalier Bainbridge Norfolk Industrial Park Airport Industrial Park Greenbrier Cleveland Lynnhaven Peninsula Copeland Oakland Oyster Point Williamsburg Extended 35

36
37 HAMPTON ROADS INDUSTRIAL MARKET VACANCY RATE 16% 14% 12% 10% 8% 6% 4% 2% 0% 13.5 (as of 1 st month of the year) Source: Old Dominion University E.V. Williams Center for Real Estate and Economic Development.

38

39 OFFICE 2007 HAMPTON ROADS MARKET SURVEY Acknowledgements Authors Donald R. Crigger, CCIM Senior Director, Office Brokerage - Norfolk, VA Christopher Bendit Director, Office Brokerage Newport News, VA GVA Advantis Financial Support The E. V. Williams Center for Real Estate for Real Estate and Economic Development (CREED) functions and reports are funded by donations from individuals, organizations and the CREED Advisory Board. The Hampton Roads Association of Commercial Real Estate provided funding for the publishing of this report.
40 2007 OFFICE General Overview TThe Hampton Roads multi-tenant office market is comprised of approximately 23 million square feet of net leasable space, plus approximately 3.2 million square feet of owner-occupied space. Average asking rents for the overall market increased from $15.60 per square foot to $16.35 per square foot, as a blended average for Class A and B space. Both the Southside and Peninsula submarkets, as well as in Downtown Norfolk, experienced increases in average asking rents. On the whole, the market vacancy rate for all classes has decreased slightly this year to 7.98 %, down from 8.0%. Downtown Norfolk s vacancy rate dropped considerably from 10.9% at the end of 2005 to 7.63%. While the Southside Suburban market saw an increase from 6.6% in 2005 to 8.07%. The Peninsula market experienced a decrease in rate from 9.3% to 6.64%. The overall Hampton Roads Office Market grew very little in 2006 in comparison with previous years, but it remained stable throughout. The approximately 300,000 square feet absorbed was distributed evenly within the region, led by Downtown Norfolk and the Pembroke/CBD submarkets on the Southside and by the Hampton Roads Center and Oyster Point areas on the Peninsula. This is not surprising as these are among the largest concentrations of space with the greatest leasing activity levels in the past decade. What differs from past years is that several submarkets had negative absorption. Noteworthy is that many of these are smaller submarkets characterized by older properties without much land available for expansion. With single digit vacancies prevalent throughout the market, expanding companies unable to grow in these locations have relocated to newer developments in the larger submarkets. The net effect is a bit of a consolidation of space throughout the region as higher density developments continue to attract the market sector willing and able to pay the highest rental rates for the highest quality of space. Thus, we see a corresponding significant average asking rental rate increase OFFICE 38
41 JANUARY 2007 AVERAGE RENTS & VACANCIES TABLE I MULTI-TENANT CLASS A, B AND C DOWNTOWN NORFOLK By Class CLASS A CLASS B CLASS C NLA % Vac. Avg Rent NLA % VAC AVG RENT NLA % VAC AVG RENT Downtown Norfolk 1,690, % $ ,527, % $ , % $10.29 SOUTHSIDE By Class CLASS A CLASS B CLASS C NLA % VAC AVG RENT NLA % VAC AVG RENT NLA % VAC AVG RENT Downtown Norfolk 1,690, % $ ,527, % $ , % $11.78 Airport/Northampton 176, % $ , % $ , % $11.00 Central Norfolk N/A N/A N/A 875, % $ , % $11.79 Chesapeake/Greenbrier 945, % $ ,985, % $ , % $11.50 Corporate Landing N/A N/A N/A 69, % $12.93 N/A N/A N/A Hilltop/Oceanfront 132, % $ , % $ , % $9.00 Kempsville 122, % $ , % $13.15 N/A N/A N/A Little Neck N/A N/A N/A 502, % $ , % $11.76 Lynnhaven 865, % $ , % $13.47 N/A N/A N/A Military Circle 70, % $ , % $ , % $10.76 Newtown/Witchduck 1,089, % $ ,003, % $ , % $10.00 Pembroke/Central Business District 984, % $ ,204, % $ , % $10.33 Portsmouth 88, % $ , % $ , % $11.00 Suffolk 408, % $ , % $16.74 N/A N/A N/A PENINSULA By Class CLASS A CLASS B CLASS C NLA % VAC AVG RENT NLA % VAC AVG RENT NLA % VAC AVG RENT Coliseum Central 211, % $ , % $10.01 N/A N/A N/A Downtown Hampton 158, % $ , % $ , % $10.00 Downtown Newport News N/A N/A N/A 153, % $14.00 N/A N/A N/A Hampton Roads Center 538, % $ , % $ , % $10.82 Newmarket N/A N/A N/A 670, % $ , % $13.50 Oyster Point 1,395, % $ ,182, % $ , % $9.59 Suburban Newport News N/A N/A N/A 236, % $ , % $7.43 Williamsburg/James City/ York County 178, % $ , % $13.87 N/A N/A N/A 39
42 2007 OFFICE TABLE II CLASS A & B ONLY DOWNTOWN NORFOLK CLASS A & B JANUARY 2007 SUBMARKET NLA % VAC AVG RENT Downtown Norfolk 3,217, % $18.57 SOUTHSIDE - CLASS A & B JANUARY 2007 SUBMARKET NLA % VAC AVG RENT Airport/Northampton 298, % $16.57 Central Norfolk 875, % $13.23 Chesapeake/Greenbrier 2,931, % $16.42 Corporate Landing 69, % $12.93 Hilltop/Oceanfront 436, % $18.79 Kempsville 442, % $15.82 Little Neck 502, % $13.96 Lynnhaven 1,760, % $16.15 Military Circle 270, % $16.48 Newtown/Witchduck 2,092, % $16.87 Pembroke/Central Business District 2,288, % $19.83 Portsmouth 467, % $15.35 Suffolk 817, % $13.87 PENINSULA CLASS A & B JANUARY 2007 SUBMARKET NLA % VAC AVG RENT Coliseum Central 515, % $13.44 Downtown Hampton 206, % $14.02 Downtown Newport News 153, % $14.00 Hampton Roads Center 1,041, % $16.62 Newmarket 670, % $15.78 Oyster Point 2,578, % $15.58 Suburban Newport News 236, % $11.70 Williamsburg/James City/York County 533, % $ OFFICE 40
43 DOWNTOWN NORFOLK MARKET With no new inventory delivered during 2006, Downtown Norfolk vacancy continued its steady decline in all classes of space. We expect this trend to continue in 2007 as the only new addition to the skyline will be the owner-occupied, Dominion Enterprises (formerly known as Trader) mixed-use 500,000 GSF building with 300,000 square foot of office space located on the ever evolving Granby Street. Rental rates continue an upward trend with the highest class of space moving firmly into the mid $20s and all other classes increasing as well. In terms of net absorption, Downtown had a typical year with total occupied space increasing by approximately 100,000 square feet. While most of the growth was attributable to existing Downtown companies expanding, the key to the financial district's stability has been its extremely strong retention rate throughout the past decade. The announcement of a new, city-block sized mixed-use development that includes a 22-story office tower, to be known as The Wachovia Center, will certainly have an impact on rates and activity in the Downtown Market, although not immediately. The development will include 250,000 square feet of Class A office space, and is already 53% pre-leased. Construction will commence in Spring of 2008 with delivery set for Summer The distribution of the Downtown Norfolk Submarket is as follows: NET LEASABLE AREA (SQ. FT.) % OF DOWNTOWN NORFOLK INVENTORY Class A Multi-Tenant 1,690, % Class B Multi-Tenant 1,527, % Class C Multi-Tenant 96, % Subtotal Multi-Tenant 3,314, % Owner Occupied 649, % Total 3,964, % The reported overall vacancy rate and average rents for the Downtown Norfolk by building class are as follows: AVG. RENT % VACANT AVG. RENT % VACANT AVG. RENT % VACANT Class A $ % $ % $ % Class B $ % $ % $ % Class C $ % $ % $ % Total $ % $ % $ % A & B Only $ % $ % $ % * weighted averages 41
44 2007 OFFICE SOUTHSIDE SUBURBAN MARKET The Southside Suburban market led the region in new construction deliveries in 2006 with the completion of the 50,000 square foot Liberty II building, followed by the 75,000 square foot Liberty III, both in Chesapeake; the second AmeriGroup building totaling 106,000 square feet on the campus of Regent University in Virginia Beach; Gallery I, a 30,000 square foot building in the Newtown Road area of Virginia Beach; Bridgeway Technology Center III consisting of 72,000 square feet in Suffolk; and Town Center North, a 52,000 square foot building in the heart of the Virginia Beach Town Center. The largest block of available space remains in the Liberty III building in Chesapeake at 75,000 square feet. The other buildings are substantially leased to existing regional companies expanding (e.g. AmeriGroup, American Funds, etc.). While several submarkets experienced occupancy gains (most notably the Pembroke/CBD area), these gains were substantially offset by losses in other locations. In fact, a few submarkets experienced negative absorption during The net effect was a period of flat demand in comparison with previous years. The distribution of Southside Suburban Submarket is as follows: NET LEASABLE AREA (SQ. FT.) % OF SOUTHSIDE INVENTORY Class A Multi-Tenant 4,883, % Class B Multi-Tenant 8,286, % Class C Multi-Tenant 352, % Subtotal Multi-Tenant 13,521, % Owner Occupied 2,201, % Total 15,722, % The reported overall vacancy rate and average rents for the Southside by building class are as follows: AVG. RENT % VACANT AVG. RENT % VACANT AVG. RENT % VACANT Class A $ % $ % $ % Class B $ % $ % $ % Class C $ % $ % $ % Total $ % $ % $ % A & B Only $ % $ % $ % * weighted averages 2007 OFFICE 42
45 PENINSULA SUBURBAN MARKET The total office inventory on the Virginia Peninsula for Class A & B multi-tenant space is approximately 6 million square feet, with a 2006 overall vacancy rate of 6.64% compared to 9.2% at the end of Oyster Point and Hampton Roads Center continue to be the primary submarkets on the Peninsula accounting for 78% of all Class A space and 49% of all Class B space. Oyster Point remains the largest submarket on the Peninsula containing 2,578,584 square feet of Class A & B office space. The second largest submarket is Hampton Roads Center, which contains 1,041,990 square feet of Class A & B office space. Combined, these two submarkets possess 3,620,574 square feet or 60% of the total office inventory for Classes A and B. The balance of 2,439,642 square feet is divided among seven other submarkets stretching from Downtown Hampton to Williamsburg/James City County. Oyster Point saw the Class A vacancy rate remain stable at 3.08% during 2006 on a base of 1,395,602 square feet. Oyster Point led the Peninsula in absorption with 118,647 square feet of Class A space on a base of 1,395,602 rsf. Class B space saw an absorption of 11,990 rsf. The absorption figure represents typical leasing of available space but more importantly only 42,048 square feet of Class A space is currently available. The most notable office activity in Oyster Point in 2006 was the delivery of One City Center, a 100,000 square foot office/retail facility. The facility contains 30,000 square feet of retail space on the first floor and 70,000 square feet of office on floors two through five. The office component is 75% leased at rents in the $20.50 per square foot range with a tenant improvement allowance of $18.00 per square foot below a finished ceiling. Merchants Walk was delivered in 2006 and contains 28,000 rsf of office space which is 100% leased at rental rates in the $18.50 per rsf range. Lastly, the William E. Wood building, containing 26,000 square feet, was delivered and is 72% leased at rates in the $18.00 per rsf range. Class A space in Hampton Roads Center saw absorption of 103,561 square feet on a base of 538,722 square feet. The majority of this absorption is attributable to the 100% lease-up of the Hampton Roads Research Quad Building III containing 100,000 square feet. However, vacancy rates for Class A space increased from 5.6% in 2005 to 8.7% in This increase in vacancy was due to the Research Quad Building I putting 20,000 square feet back on the market. Vacancy rates for Class B space plummeted in 2006 from a 2005 vacancy rate of 23% down to 5%. The majority of the decrease in vacancy can be attributed to the NDS building only having 11,000 sf available, down from 35,331 sf in 2005, and the Research Office Building leasing 19,000 sf in Buildings delivered in 2006 to Hampton Roads Center submarket were the Research Quad Building III containing 100,000 sf and the VA Peninsula Realtors Building containing 19,000 sf. The major new construction project in the pipeline for 2007 is Two City Centre in Oyster Point containing 70,000 sf of office space which is 75% pre-leased at rates in the $22.50 per rsf range. In 2007, rental rates are forecasted to rise in Oyster Point due to the lack of available space. Tenant improvement packages will edge down as market conditions tighten. Hampton Roads Center will see rental rates tighten and tenant improvement packages will remain stable due to the limited amount of available space. 43
46 2007 OFFICE The distribution of Peninsula Submarket is as follows: NET LEASABLE AREA (SQ. FT.) % OF PENINSULA INVENTORY Class A Multi-Tenant 2,543, % Class B Multi-Tenant 3,453, % Class C Multi-Tenant 326, % Subtotal Multi-Tenant 6,323, % Owner Occupied 432, % Total 6,756, % The reported overall vacancy rate and average rents for the Peninsula by building class are as follows: AVG. RENT % VACANT AVG. RENT % VACANT AVG. RENT % VACANT Class A $ % $ % $ % Class B $ % $ % $ % Class C $ % $ % $ % Total $ % $ % $ % A & B Only $ % $ % $ % * weighted averages 2007 OFFICE 44
47 ABSORBTION 2006 SUBMARKET # SF LEASABLE # SF LEASABLE SF VACANT VACANT VAC ABSORBTION SPACE 2005 SPACE 2006 CHANGE SPACE 2005 SPACE 2006 CHANGE 2006 Downtown Norfolk 3,309,216 3,314,224 5, , ,991 (106,681) 106,681 Airport/Northampton 320, , ,400 33,311 15,911 (15,911) Central Norfolk 984, , , ,033 61,528 (61,528) Chesapeake/Greenbrier 2,848,835 2,973, , , , ,915 8,085 Hilltop/Oceanfront 446, , ,586 20,039 12,453 (12,453) Corporate Landing 69,756 69, Kempsville 442, , ,307 29,220 (5,087) 5,087 Lynnhaven 1,760,940 1,760, , ,229 3,008 (3,008) Little Neck 530, , ,334 15,939 (26,395) 26,395 Military Circle 336, , ,599 29,065 14,466 (14,466) Newtown/Witchduck 1,987,747 2,110, , , , ,610 86,588 Pembroke/Central Business District 2,160,632 2,224,632 64, ,147 86,340 (49,807) 49,807 Portsmouth 477, ,266 10,682 47,650 88,924 41,274 (41,274) Suffolk 679, , ,149 23,000 52,800 29,800 (19,584) Downtown Hampton 218, , ,898 19,565 1,667 (1,667) Downtown Newport News 153, , ,443 45,353 40,910 (40,910) Hampton Roads Center 766,662 1,077, , ,891 35,833 (120,058) 159,493 Coliseum Central 515, , ,469 52,921 22,452 (22,452) Newmarket 820, , , , Oyster Point 2,535,234 2,659, , , ,442 (7,146) 108,728 Suburban Newport News 284, , ,850 30,850 (30,850) Williamsburg/James City/ York County 533, , ,196 16,834 (14,362) 14,362 TOTAL 22,183,803 23,083,508 1,759,576 1,961, , ,123 45

48

49 OFFICE SUBMARKETS Southside Airport/Northampton Chesapeake/Greenbrier Downtown Norfolk Central Norfolk Hilltop/Oceanfront Corporate Landing Kempsville Little Neck Lynnhaven Military Circle Newtown/Witchduck N. Suffolk Pembroke Portsmouth Peninsula Downtown Hampton Hampton Roads Center Coliseum Central Downtown Newport News Newmarket Oyster Point Suburban Newport News Williamsburg/James City Co./ York County 47
50 2007 OFFICE The following is a list of the properties included in this year s survey. DOWNTOWN NORFOLK CLASS A 150 West Main Street ,183 Crown Center ,000 Dominion Tower ,276 Main Street Tower ,000 Norfolk Southern Tower ,463 Town Point Center ,266 World Trade Center ,941 CLASS B 100 East Main Street , Granby Street , Granby Mall Building , Plume Street ,000 Anders Williams Building ,000 Bank of America ,892 Towne Bank Building (109 E. Main St.) ,698 City Centre ,138 Duke Grace Building ,417 First Virginia Tower ,600 Ghent-Olney Building ,000 Historic Freemason Building ,000 Lonsdale Building ,000 Monticello Arcade ,500 Monticello Office Building ,000 Plume Center West ,375 Seaboard Center ,000 St. Paul Building , E. Main St. (Former SunTrust) ,000 Tazewell Building ,000 The Helena Building ,100 Wainwright Building ,151 York Street Center ,293 CLASS C 220 West Freemason Street , Granby Street , Monticello Avenue ,760 Former Home Savings Bank Bldg ,825 Norfolk Community Services ,192 OWNER OCCUPIED AAA Headquarters ,000 AT&T ,000 Atlantic Building ,000 Decker Building ,000 Landmark Communications ,500 Norfolk Telcom Center ,000 Peta ,000 Standard Forms ,000 Two Commercial Place , OFFICE AIRPORT/ NORTHAMPTON CLASS A Twin Oaks I ,000 Twin Oaks II ,000 CLASS B Airport Executive Center ,609 HRSA-ILA Bldg (Longshoremen s) ,678 Northhampton Executive Center ,000 CLASS C Electrical Workers Corporation Office... 22,020 OWNER OCCUPIED USAA Building ,000 Zim-American Israeli Shipping ,000 CMA/CGM (USA) ,000 CENTRAL NORFOLK CLASS B Almeda Business Center (flex) ,000 Commerce Park Place(flex) ,783 Gateway II(flex) ,000 Lafayette Executive Center ,641 Lawson Building ,022 Norfolk Business Center (flex) ,000 Norfolk Business Center II (flex) ,926 Norfolk Commerce Center I(flex) ,000 Norfolk Commerce Center III(flex) ,000 Norfolk Commerce Center IV(flex) ,980 Norfolk Commerce Center V(flex) ,000 Norfolk Commerce Park Office Building ,000 CLASS C 4100 Building ,614 Atlas Building ,476 Blair Building ,000 Southern Office Building ,061 Time Building ,000 OWNER OCCUPIED American Funds Building ,000 CHESAPEAKE/ GREENBRIER CLASS A 1580 Crossways Blvd ,800 Armada Hoffler Corporate Headquarters , CHKD Health Center(Volvo Park VI)... 25,000 Chubb Building ,500 Dendrite One ,000 Dendrite Two ,000 Greenbrier Tower I ,900 Greenbrier Tower II ,976 Lake Center I ,000 Lake Center II ,000 Liberty One ,000 Liberty Two ,000 Liberty Three ,000 One Greenbrier Point (Oracle) ,000 Towers Perrin II ,000 CLASS B Atlantic Business Center ,000 Battlefield Corporate Center ,000 Battlefield Lakes Tech Center I ,500 Battlefield Lakes Tech Center II ,000 Battlefield Lakes Tech Center III ,000 Battlefield Technology Center ,578 Battlefield Technology Center I ,000 Battlefield Technology Center II (MCI) ,000 Branch Executive Quarter- Hamilton ,600 Branch Executive Quarter- Jefferson ,838 Branch Executive Quarter-Madison... 16,788 Chelsea Commons WCMB ,400 Crossways Commerce Center II ,300 Crossways I ,007 Crossways II (flex) ,751 Crossways III ,992 Eden North Center ,700 Greenbrier Business Center ,000 Greenbrier Business Centre (flex) ,561 Greenbrier Circle Corporate Center ,138 Greenbrier I & II ,276 Greenbrier Square ,250 Greenbrier Tech Center One (flex)....95,414 Greenbrier Tech Center Two (Flex)....82,340 Heritage Bank Building ,654 Independence Technology Center I....98,000 Knells Ridge Plaza ,500 Knells Ridge Square ,000 Old Greenbrier Village ,015 Riverwalk Professional Bldg ,000 Rose and Womble Business Center...13,432 SunTrust Bank Building ,500 Volvo Expressway ,000 Volvo Park ,000 Volvo VII ,000 Woodbrier Terrace ,000 CLASS C 2125 Smith Avenue ,423
51 OWNER OCCUPIED Cox Communications ,000 First Data ,557 Household Finance ,000 Panasonic Call Center ,000 Towers Perrin ,000 Volvo Penta ,000 HILLTOP/ OCEANFRONT CLASS A Pavilion Center ,177 Potter Professional Center ,500 William E. Wood Building ,000 CLASS B 1206 Laskin Road Executive Center... 33,000 Beach Tower ,000 Birdneck Office Park ,182 Birdneck Square ,285 Colonial Mill Professional Center ,555 Damalas Centre ,900 First Colonial Office Park ,000 General Booth Professional Center... 11,000 Gibson Pavilion ,000 Great Neck Professional Bldg ,000 Heritage Commons ,000 Hilltop West Executive Center ,000 Mill Dam Crossing ,037 Rudd Building ,000 Sandpiper Key Associates Bldg ,000 CLASS C Oceana East ,360 CORPORATE LANDING CLASS B Princess Anne Executive Park ,756 Verizon Building ,000 OWNER OCCUPIED Al-Anon ,000 Approved Financial ,000 GEICO ,000 KEMPSVILLE CLASS A Chadwick Building ,000 Grayson Building ,000 CLASS B 1201 Lake James Office , Holland Road ,000 Arrowhead Office Court ,000 Atrium of College Park Square ,379 Central Park I ,000 Central Park II ,000 College Park Square III ,150 Courtyard at Providence ,879 Fairfield Square ,933 Holland South ,843 Holland/Taft Professional Center ,850 Kempsville Office Park ,722 Oxford Square ,544 Providence South Office Park ,000 Woolpert Building ,700 LYNNHAVEN CLASS A Lynnhaven Commons Complex ,000 Lynnhaven Commons (office bldg)... 26,000 Lynnwood Plaza ,157 Marsh Landing ,117 Oceana Center One ,928 Oceana Place ,369 Park West ,180 Pinehurst Centre ,000 Reflections I ,924 Reflections II ,676 Reflections III ,000 Reflections IV ,000 Viking Building ,900 Windwood Center ,348 CLASS B 596 Lynnhaven Pkwy ,910 Advanced Technology Building ,000 Basgier Bldg. I ,200 Basgier Bldg. II ,000 Bennet Office Building ,522 Commercial Place ,400 Lynnhaven Corporate Center I ,046 Lynnhaven Corporate Center II ,300 Lynnhaven Corporate Center III ,000 Lynnhaven Executive Center ,000 Lynnhaven Five ,549 Lynnhaven North ,000 Lynnhaven Professional Center ,000 Lynnhaven Station ,226 Parkway Center 3 and ,567 Parkway Center I & II ,112 Parkway III (Unisys) ,428 Parkway West (flex) ,563 Princess Anne Bank Building ,000 RBM Building ,170 Sabre Street I ,000 Sabre Street II ,000 Sabre Street III ,000 Sabre Street IV ,000 South Lynnhaven Business Park ,000 U.S. Commerce Center (Tidewater Tech) ,819 Yorktown Commerce Center ,529 OWNER OCCUPIED Cenit Bank Bldg ,000 Eastern ,000 Global Technical Systems ,000 SAIC ,000 Hall Automotive ,865 LITTLE NECK CLASS B 3300 Building (Virginia Beach Blvd.)... 11, North Lynnhaven (Lynnhaven Station) ,000 King s Grant Office Building ,000 Little Neck Office Park (3300 Bldg) ,000 Little Neck Office Park (3300 South)... 50,000 Little Neck Office Park (3400 Bldg) ,000 Little Neck Towers ,860 NEXCOM Building ,000 NEXCOM Expansion ,000 Plaza Trail Office Building ,975 Rose Hall Commons ,266 Rose Hall Professional Center ,000 Rosemont Interstate Center I ,400 Rosemont Interstate Center II ,835 Rosemont Interstate Center III* ,000 Sun Building ,600 Transouth Building ,500 CLASS C Birchwood Office Park ,688 Byler Building ,592 OWNER OCCUPIED TAF Group ,000 MILITARY CIRCLE CLASS A Riverside Commerce Center ,000 CLASS B Centura Bank Building ,442 Circle East ,047 College Park Executive Center ,000 FBI Building ,000 49
52 2007 OFFICE I.T.T. Building ,379 CLASS C Executive Office - Janaf ,800 Janaf Office Building ,329 OWNER OCCUPIED Riverside Corporate Center ,682 Sentara ,000 Virginia Natural Gas Campus ,403 NEWTOWN/ WITCHDUCK CLASS A AAA Headquarters ,045 Amelia Building ,660 Amerigroup Building I ,000 Amerigroup Building II ,000 BB&T Building ,000 Expressway Corporate Center ,658 Gallery I ,000 Greenwich Center ,000 Greenwich Commons ,000 Greenwich Station ,000 Halifax Building ,100 Mass Mutual Building ,500 Smithfield Building ,000 Verizon Center ,000 Westmoreland Building ,436 CLASS B 144 Business Park Drive , Business Park Drive , Business Park Drive , Witchduck Road , Newtown Road ,181 American Teleservices Building ,232 Amerigroup Corp ,000 Azalea Village ,000 BCF Building ,000 BPC Building ,074 Colonial Corporate Center ,772 Commerce Centre ,500 Commonwealth Building ,000 Executive Cove ,000 Hampton Roads Realtors Association ,784 Interstate Corporate Center ,000 Parliament Drive Professional Building ,000 TRC Center I ,000 TRC Center II ,884 TRC Center III ,000 Witchduck Crossing ,326 CLASS C Witchduck Office Court ,000 OWNER OCCUPIED 209 Business Park Drive ,250 Cox Cable Building ,000 Cox Expansion ,000 Copy Data (Ikon) ,000 Lendman ,000 Newtown Square ,000 PEMBROKE/CENTRAL BUSINESS DISTRICT CLASS A Convergence Center ,000 Convergence Center II ,000 Five Columbus Center ,000 One Columbus Center ,000 Pembroke Commercial Bldg ,760 Six Columbus Center ,000 Southport Center ,000 Town Center ,900 Resource Bank Plaza ,315 Ticketmaster ,000 Town Center North Tower , Central Park Avenue ,000 CLASS B 4224 Holland Road , Columbus ,000 Corporate Center I ,000 Corporate Center II ,475 Corporate Center III ,000 Corporate Center IV ,012 Dragas Office Park ,896 Haygood Executive Park ,472 Holland Commerce Center ,000 Holland Office Park ,000 Holland Plaza Office Building ,513 Huff, Poole, Mahoney Building ,000 Independence Business Center ,000 Independent Technology Center ,000 Independent Plaza ,655 Larkspur Village ,184 Old Donation Executive Park ,347 Pembroke Office Park ,000 Pocahontas Center ,800 Prism Plaza ,000 South Trust Bank Building ,000 Southgate Centre ,200 Southport Business Center(flex) ,683 Southport Trade Center(flex) ,883 Thalia One ,408 Thalia Professional Center ,000 The Meadows ,433 VST Building ,000 CLASS C Beacon Building (VA Pilot) ,200 Haygood Buildings ,392 OWNER OCCUPIED Alantec Financial Fed Credit Union.12,000 AVIS ,000 Coastal Training Technologies ,000 Commonwealth College ,000 Electronic Systems Building ,000 ISC ,000 QED Building ,000 REIN Building ,500 PORTSMOUTH CLASS A BB&T Building ,327 Harbourfront Corporate Center (801 Water St) ,000 CLASS B 307 County Street , Crawford Street Building , Crawford Street ,171 Boyette Professional Center ,000 Bristol Square ,800 Towne Bank Building ,000 JJH Building ,563 New Kirn Building ,000 Port Trade Center ,223 PortCentre I (flex) ,000 Wachovia Bank ,000 SUFFOLK CLASS A JTASC Building ,365 CLASS B Bridgeway Technology Center I ,000 Bridgeway Technology Center II ,500 Bridgeway Technology Center III ,384 Brinkley Building ,500 Harbour Breeze Professional Center ,265 Lake View Technology Center One...112,740 Main Street Center ,800 Washington Street Center , OFFICE 50
53 OWNER OCCUPIED Towne Bank Center ,000 Rose & Womble Building ,000 Overton Building ,940 Lockheed Martin ,000 DOWNTOWN HAMPTON CLASS A Harbour Centre ,855 CLASS B W. Queens Way , W. Queens Way ,500 Mill Point Center ,000 One Mallory Street ,000 CLASS C 55 W. Queens Way ,132 DOWNTOWN NEWPORT NEWS CLASS B 2600 Building ,596 Wachovia Bank Building ,846 OWNER OCCUPIED Newport News Shipbuilding, Bldg ,000 HAMPTON ROADS CENTER CLASS A 6 Manhattan Square ,106 Allstate Building ,000 Anthem Alliance ,482 Lakefront Plaza I ,442 Morgan Marrow Building ,000 Parkway Center ,000 Olympia Place ,395 Research Quad - Building One ,000 Research Quad - Building Three ,000 Oxford Plaza ,297 VA Peninsula Realtors ,000 CLASS B Hampton I ,532 Hampton II ,000 Hampton III ,000 Hampton Technology Center I , Butler Farm Road , Butler Farm Road ,715 NDS Building ,000 Raytheon ,000 Research Office Building ,000 CLASS C 3217 Armistead Avenue ,043 NASA Langley Research Center ,790 COLISEUM CENTRAL CLASS A Executive Tower ,164 Pinewood Plaza ,500 CLASS B 2310 Tower Place ,500 Colony Square of Hampton ,050 NationsBank Building ,434 Riverdale Complex ,000 Sheraton Office Bldg ,673 Todds Lane Professional Center ,500 West Telemarketing ,855 OWNER OCCUPIED Langley Federal Credit Union ,800 NEWMARKET CLASS B NetCenter ,171 Newmarket Building ,262 UPS Call Center ,000 CLASS C Rouse Tower ,000 OWNER OCCUPIED NN Shipbuilding Employee Credit Union ,000 OYSTER POINT CLASS A 601 Thimble Shoals Boulevard ,000 Atrium At Oyster Point ,971 Cedar One ,467 Contemporary Cybernetics ,000 Ferguson Corporate Center II ,000 First Union Centre ,982 Fountain Plaza One ,000 Fountain Plaza Two ,000 Fountain Plaza Three ,000 TowneBank Center ,000 One Oyster Point ,226 Oyster Point Interstate Center ,000 Patrick Henry Corporate Center ,000 Peninsula Professional Building ,800 Rock Landing Corporate Center II....33,476 SunTrust Building ,955 Symantec Corp. Building ,000 Tower Park ,667 Two Oyster Point ,137 Wachovia Building ,921 Merchants Walk ,000 One City Center ,000 William E Wood Building ,000 CLASS B Jefferson Avenue , Bluecrab (flex) ,000 BB&T Plaza ,348 Cale Colony ,871 Canon Place ,000 Comb-Bay Park ,000 Dunwoody Place ,798 Executive Center ,399 Fishing Point Complex(flex) ,000 International Distribution Center ,000 McCale Professional Park ,000 Middle Ground Business Center ,000 Oyster Point Business Center ,000 Oyster Point Center ,000 Oyster Point Place (flex) ,000 Oyster Point West ,560 Park Central Executive Center ,425 Park Place (751 & 753 Thimble Shoals) ,000 Peninsula Business Center I (flex) ,817 Peninsula Business Centre II (flex)....40,475 Peninsula Business Centre III (flex)....60,000 Riverside Offices ,000 Rock Landing Corporate Center IV....18,125 Rock Landing Corporate Center V....18,125 Technology Center (flex) ,000 Thimble Shoals Business Center (flex).55,377 Thimble Shores Lakefront ,000 CLASS C J.Clyde Morris Blvd ,000 McCord Building ,000 Pilgrim Landing ,650 Regent Park ,000 51
54 2007 OFFICE OWNER OCCUPIED Applied Research Center ,000 Fountain Plaza Two ,000 Muller Martini Building ,000 Peninsula Retail Credit ,000 SUBURBAN NEWPORT NEWS CLASS B Bay Savings Bank Building ,000 Colony Square of Denbigh II ,100 Denbigh Professional Park ,598 Ferguson Enterprises ,800 MCI Building ,000 Tidewater Tech ,778 CLASS C Mariner Building ,000 Teagle Building ,000 WNER OCCUPIED CNU Building ,000 WILLIAMSBURG/ JAMES CITY/ YORK COUNTY CLASS A Atrium Building ,000 Casey New Town - SunTrust ,000 Courthouse Green Office Park II ,000 First Union Center ,000 Langley Federal Credit Union ,000 Williamsburg Commerce Center ,000 CLASS B 104 Bypass Road , George Washington Memorial Highway ,000 Chartertowne Professional Center....12,800 Greens Springs Office Park ,000 Kristinsand Office Park ,221 Packets Executive Center ,000 Quarterland Commons Office Condos ,000 Rivergate Center ,000 Wachovia Bank ,500 Williamsburg Office Park ,600 Disclaimer: The information in this report is deemed reliable. Old Dominion University Real Estate Center makes no representation or warranty as to its accuracy. BOLD indicates change/addition from last year s survey 2007 OFFICE 52
 625-8181 Don Foust 823 E.")
55 Most Mortgage Companies Arrange Loans We Arrange Relationships EXCELLENCE IN REAL ESTATE FINANCE Over $15 Billion in Debt and Sales Transactions Since 1995 Contact Victor Pickett, Gary Beck or Don Esinhart 999 Waterside Drive, Suite 2210 Norfolk, VA (757) Don Foust 823 E. Main Street, 16th Floor Richmond, VA (804) Atlanta Charlotte Raleigh Charleston Greenville Nashville Norfolk Richmond Louisville Birmingham Mobile Indianapolis Jacksonville Naples Tampa Pittsburgh Wash DC/Baltimore Visit our website at

56

57 RESIDENTIAL 2007 HAMPTON ROADS MARKET SURVEY Acknowledgements Authors Bea Hopkins Director Residential DataBank Data Analysis/Layout Bea Hopkins Residential DataBank Blair Hardesty Residential DataBank Financial Support The Old Dominion University E. V. Williams Center for Real Estate and Economic Development (CREED) reports are funded by donations from individuals, organizations and the CREED Advisory Board. Disclosure Data collection from December November 2006
58 2007 RESIDENTIAL General Overview The Hampton Roads Residential Market statistics covered in this report analyzes the new home building industry and the existing home sales activity for a twelve month period beginning with December 2005 through November Additionally, data from the prior twelve months is used for comparison. Included are the cities of Chesapeake, Hampton, Poquoson, Portsmouth, Newport News, Norfolk, Suffolk, Virginia Beach, and Williamsburg, and the counties of Isle of Wight, James City, Southampton, and York. The new construction data contained in this report was gathered from the actual deeds recorded in the various jurisdictions and from the building permit departments within each city or county. The existing home closings data was gathered from the Real Estate Information Network. THE YEAR IN REVIEW The year of 2006 was a year of adjustment and change for the new construction housing market. Starting with a burst of building permit activity during the first quarter, the market proceeded to weaken in the following months. For the twelve months ending in November, a total of 7,188 permits were issued, down 6.8% from year ago numbers. The cooling off in the new construction market created an increase in completed standing inventory that builders are working to control. As a result, production has slowed and permit numbers have declined. On the closing side, the new construction market is off by 5.0% year over year with a total of 4,810 recorded. As a comparison, the national new construction market is expected to finish the year down 17%. November was the slowest month by far for closings with just 295 on record for all of Hampton Roads. High-end homes have suffered the most extensive loss in sales volume while homes priced in the $200K to $400K range have sustained a moderate sales pace, enabling the new construction market to come close to the historical norm of around 5,000 closed units per year. Table I details the new construction activity by jurisdiction for the Hampton Roads area while Table II lists the top 10 most active subdivisions for permits. The locations in Table II are split equally between the Southside and the Peninsula and they represent 18% of all new construction activity. Closings for existing homes show a stronger decline during the year than new construction units with a loss of nearly 2,000 from year ago numbers. A total of 22,224 were recorded in the Hampton Roads area for a drop of 8.2%. The low point for sales was December By mid-year 2006, monthly sales figures were close to the numbers posted the prior year. However, in September, sales dropped considerably and remained slow for the rest of the year. A combination of factors all contributed to the housing market slow down. Consumer confidence started to weaken as interest rates increased slightly and at the same time, home prices continued to rise. News of the Norfolk Ford Plant closing and the potential loss of Oceana Naval Base in Virginia Beach increased apprehension in the home buying public and investors alike. On a national level, news stories of a possible housing bubble and articles featuring significant declines in the major markets, increased concern in local buyers. As sales slowed in Hampton Roads, the market shifted from a sellers market to a buyers market with a notable increase in inventory from which to choose. The total number of active listings 2007 RESIDENTIAL 56
59 of homes for sale, both new construction and existing homes, increased from around 3,000 in January 2006 to over 10,000 in November. The market time to sell a home rose from an average of less than 30 days in 2005 to over 80 days in November A combination of the large inventory and a slow sales pace contributed to fears of a housing bubble about to burst. Nearly 4,000 residential properties were listed for the first time during the month of May. Beginning in July, the number of new listings of homes going up for sale dropped sharply each month. By November, only 500 properties were newly listed for sale, indicating that sellers and investors were prepared to wait and see what the market would do. This phenomenon has contributed to firm housing prices despite a markedly slow sales pace. The total housing market that includes both new construction and existing homes, declined 7.6% on a year over year basis, with 27,034 closed sales. Existing home sales still outpaced new construction sales almost 5 to 1. TABLE I NEW CONSTRUCTION PERMIT AND CLOSING ACTIVITY (December 2004 through November 2005 compared to December 2005 Through November 2006) ALL PRODUCT TYPES PERMITS PERMITS % DIFFERENCE CLOSINGS CLOSINGS % DIFFERENCE Chesapeake 1, % 1, % Hampton % % Isle of Wight County % % James City County 1,051 1, % % Newport News % % Norfolk % % Portsmouth % % Southampton County % % Suffolk 1, % % Virginia Beach 1,513 1, % 1,099 1, % Williamsburg % % York County % % TOTALS 7,715 7, % 5,061 4, % TABLE II TOP 10 SUBDIVISIONS BY PERMITS THROUGH NOVEMBER Virginia Beach - Ridgely Manor 334 James City County - Fords Colony 221 James City County - Colonial Heritage 153 Virginia Beach - Sanctuary at False Cape 149 Isle of Wight County - Eagle Harbor 146 Hampton - Kings Landing 140 James City County - Braemar Creek 128 Virginia Beach - Villas at Bellamy 120 Virginia Beach - The Westin 119 Virginia Beach - Lexington
60 2007 RESIDENTIAL AVERAGE PRICES New construction average prices have increased again over the past year. The combined average for all types of new housing is now $398,605, up from $356,349 one year ago, for an increase of 11.9%. A new single-family detached home has a current average price of $445,086, also up 11.9%. A new condominium has an average closing price of $337,363, up 19.9%, and a townhome carries an average closing price of $295,733, an increase of 11.0%. Eight out of twelve jurisdictions have an average closing value for a new single-family detached home of over $400,000, and Virginia Beach, with an increase of 18.1% and an average closing price of $548,181, still carries the highest average price in Hampton Roads. INDIVIDUAL MARKET SEGMENTS Single-family detached homes continue to be the most numerous type of housing to be built. Nevertheless, permit activity dropped 20.5% with 4,198 issued. Closings also declined by 12.8% with 2,876 recorded. Seventy percent of all closing activity occurred in the price points below $500,000. Future activity based on data gathered from the cities and counties of Hampton Roads, indicate that there are new subdivisions going through the approval process or recently approved, that could add over 27,000 single family homes to the area over time. An estimate of the current inventory of new single-family detached homes, established by using permit data and the present home closings pace, represents a 5.5 months supply. Condominium units experienced growth in both permits and closings during the year. A total of 2,362 permits were issued for an increase of 46.7%, while closings increased for the year by 5.3% with 1,568 recorded. Seventy-eight percent of all condominium closings had a sales price that fell within the range of $200K to $399K. The number of condominium units that have been approved or are approaching final approval total 15,721. Based on permit data, Hampton Roads currently has an esti-mated 6 months supply of inventory. Townhome building permit numbers fell by 23.9% after having a strong prior year. A total of 628 were issued. Closings increased 34.1% with a total of 366 recorded. Exactly mirroring the condominium market, the most active price range for townhome units fell within the $200K to $399K and that price range encompassed 78% of all closings. The number of townhome units approved for development has reached 3,850 while the current market has an estimated 8.5 month supply RESIDENTIAL 58
61 CHART I 2006 SINGLE FAMILY HOME AVERAGE CLOSING VALUES (NEW CONSTRUCTION VERSUS EXISTING) $600,000 $550,000 $500,000 $450,000 $400,000 $350,000 $300,000 $250,000 $200,000 $470,689 $301,082 $430,033 $307,988 $270,675 $183,269 $403,506 $220,005 $236,049 $175,906 $451,792 $282,038 $548,181 $346,885 $335,187 $193,013 New Construction Resale $437,831 $382,722 $350,389 $212, ,732 $417,350 $465,585 $356,383 $150,000 $100,000 $50,000 $- Chesapeake Isle of Wight Portsmouth Norfolk SHC Suffolk Virginia Beach Hampton James City County Newport News Wburg. York County THE RESALE MARKET Existing home sales led the housing market with steady growth for the prior three years. During 2006 however, the resale market performed at a much slower sales pace and recorded a loss of 8.2% with a total of 22,224 closings. The median price in Hampton Roads during the month of November 2006 was $215,000, an increase of 9.1% from November On the national level the median price for November 2006 was $218,000, down 3.1% from the prior year. The average combined price for all types of existing homes rose to $248,831, up 8.2% compared to year over year numbers. The percent increase in the average price was down considerably from the gain of 23.5% recorded at this time last year. Home sellers, hoping to realize the same substantial gains as the prior years, have been surprised by the softening of the market. To avoid accepting a lower price than anticipated, many home owners who are not moving out of the area have pulled their listings, perhaps waiting for the demand of the Spring market. The current number of existing homes listed for sale represents a 3.8 month supply based on the sales pace of The inventory is up from 2.3 months at this time last year. Nationally, there is a 7.3 month supply as reported by the National Association of Realtors. The single-family detached segment of the resale market continues to be the most active with a total of 16,062 closings. That figure is down 9.6% from year ago numbers. The average price for an existing single-family home has risen to $269,761, up 7.9% from last year. The area with the highest average price is Williamsburg with $417,350. The condominium market slowed during the year with 2,716 closings, down 200 units from last year for a loss of 7.2% The average price increased 9.8% with a new high of $219,528. The highest average price for condominium units is in Virginia Beach with $247,916. The townhome resale market was off only 1.9% with 3,446 closings. The new average price is $177,983, up 15.5%. 59
62 2007 RESIDENTIAL CHART II EXISTING HOMES SALES & LISTINGS DEC 2005 NOV 2006 Sales Listings Dec 2005 Jan 2006 Feb 2006 Mar 2006 Apr 2006 May 2006 Jun 2006 Jul 006 Aug 2006 Sep 2006 Oct 2006 Nov 2006 THE TOTAL MARKET NUMBERS The total for the 12-month period ending in November for new construction and existing home closings is 27,034 for a loss of 7.6% on a year over year basis. New construction holds an 18% share of the total market, up 1.0% from one year ago As 2006 was a year of adjustment, expect 2007 to be a year of opportunity. Interest rates have moved down to a rate below mid-year 2006, inventory units are being sold and the sales pace is improving. In previous years when the Housing Market suffered a contraction, the reasons were extremely high interest rates or a national economic recession that created an environment where buyers could not afford to purchase a home. During this past upswing, a frenzy of buying and selling occurred and prices escalated at such a rapid pace that many buyers were quickly priced out of the market. A swift market decline was the result. As David Lereah, the Chief Economist for the National Association of Realtors put it The real estate boom of was unprecedented. The industry flew higher than it ever did. The plane needs to land and refuel in order to take off again. In 2007 home sellers should become more realistic in their pricing and builders will probably be quicker to offer incentives that translate into increased affordability, a key selling point. According to a survey conducted by the National Association of Home Builders, what matters most to a prospective home buyer is the price, mortgage interest rates, and their own housing needs. Realizing the shortage of affordable housing in this area, local builders will begin to focus on 2007 RESIDENTIAL 60
63 housing designed to sell in the price range of $200K to $400K, a range that is within reach for the average household in Hampton Roads. The new year will probably show a decline in the market for the first quarter of the year and very likely, a further decline in sales of homes in the higher price points. The active buying season of Spring and Fall should show an increase in sales but building activity for the year may fall below However, it should be an excellent year of opportunity for the buyers in the market. TABLE III VIRGINIA BEACH TOP 6 SUBDIVISIONS RANKED BY CLOSINGS Community No. Closed Average Price 1. Ridgely Manor 186 $304, Lexington 128 $301, Sanctuary at False Cape 97 $654, Woodbridge Point 70 $452, West Neck Village 53 $367, Highland Parish 34 $559,615 TABLE IV CHESAPEAKE TOP 6 SUBDIVISIONS RANKED BY CLOSINGS Community No. Closed Average Price 1. Cahoon Plantation 105 $433, The Hampshires 53 $305, North Trail at Arboretum 46 $330, Preserve on the Elizabeth 44 $540, Marsh Pointe Estates Ravenna 33 $452, Quailshire Estates 30 $399,929 61

64
65 RESIDENTIAL SUBMARKETS Southside Suffolk Portsmouth Norfolk Chesapeake Isle of Wight Co. Franklin/So. Hampton Virginia Beach Peninsula Newport News Hampton James City County York County 63
66 2007 RESIDENTIAL TABLE V PENINSULA TOP 6 SUBDIVISIONS RANKED BY CLOSINGS Community No. Closed Average Price 1. J Colonial Heritage 129 $432, J Braemar Creek 68 $214, N Port Warwick 58 $336, J New Town 57 $343, Y Creekside 50 $437, J Scotts Pond 44 $347,993 TABLE VI SUFFOLK, ISLE OF WIGHT, PORTSMOUTH, NORFOLK TOP 6 SUBDIVISIONS RANKED BY CLOSINGS Community No. Closed Average Price 1. I Eagle Harbor 130 $381, S Belmont Park 69 $261, S Harbour View West 66 $495, R 388 Boush Street 48 $234, I Windsor Woods 47 $318, I Founders Pointe 45 $572,983 S Mansfield Farms 45 $343, RESIDENTIAL 64
67 CHART III 15 YEAR NEW CONSTRUCTION AND RESALE CLOSING HISTORY 25,000 20,000 Resale NC 15,000 10,000 5, CHART IV BUILDING PERMIT HISTORY WITH PERCENT DIFFERENCE 8, % 0.2% 17.0% -0.9% 4.0% 6.2% -6.8% 7,000 6, % -6.5% -10.5% -14.6% -5.5% -9.5% 0.0% 5,000 4,000 3,000 2,000 1,
68 2007 RESIDENTIAL TABLE VII TOP TWENTY BUILDERS RANKED BY CLOSINGS AND PERMITS TIME FRAME OF DECEMBER 2005 THROUGH NOVEMBER 2006 Top 20 Builders # of Closings Top 20 Builders # of Permits 1. Dragas Associates 2. Chesapeake Homes 3. Centex Homes 4. Franciscus Company 5. Terry/Peterson Residential 6. U S Home Corporation 7. Futura Group LLC 8. Genesis Group Inc 9. Atlantic Homes Corporation 10. Villa Construction 11. Ainslie Widener Inc 12. Napolitano Enterprises 13. Beco Construction Eagle Construction of HR 14. Collins Enterprises 15. McQ Builders 16. Virginia Enterprises 17. Home Associates of VA 18. GCR Inc 19. Lifestyle Homes Wayne Harbin Builder 20. Sadler Building Corporation Dragas Associates 2. Franciscus Company 3. Futura Group 4. Chesapeake Homes 5. Centex Homes 6. U S Home Corporation 7. Collins Building Company 8. Terry/Peterson Residential 9. Armada Hoffler Construction 10. Health E Community Enterprises 11. Atlantic Homes Corporation 12. Ainslie Widener Inc 13. Lynnhaven Homes 14. Tech Company LLC 15. Bishard Development Corporation 16. L L Building 17. Beco Construction 18. Pace Construction Corporation 19. Eagle Construction of HR GCR Inc 20. Wayne Harbin Builder Note: Resale information is made available by the Real Estate Information Network 2007 RESIDENTIAL 66


69 Dominion Reality Advisors, Inc. Real Estate Appraisers and Consultants Bradley R. Sanford, MAI David E. Richards, MAI William E. Ward, Jr., MAI Susan J. Fulcher Peter M. McCrary David L. Stankus Valuation of Commercial Real Estate, including office, industrial, retail, apartments, adult care, marinas, golf courses and subdivisions for financing, investment, litigation and estate matters Robin Hood Road, Suite 101 Norfolk, Virginia Fax


70
 and are currently reported as being occupied are considered positive absorption.")
71 DEFINITIONS The following terminology and sources are used in the CREED Apartment Report: Absorption Net change in occupied units within comparable communities within a specific time frame. New units that have entered the market in the last six months (completions) and are currently reported as being occupied are considered positive absorption. Note: With regard to existing communities, absorption can only be calculated for communities that participated in the current and previous survey. Averages All averages within this report are calculated using a weighted average based on the number of units. Comparable Rent Change Net change in quoted rent of existing comparable units within a specific time frame. Comparable Units are defined as communities that participated in the current and previous survey. New units that have entered the market since the previous reporting period are not included in the comparable rent change although they are included in the overall average rent calculation. Concessions Any monetary discount or enticement being offered during the current reporting period. MULTI-FAMILY Acknowledgements Author Charles Dalton Data Analysis/Layout Real Data 2007 HAMPTON ROADS MARKET SURVEY Financial Support Old Dominion University E.V. Williams Center for Real Estate and Economic Development (CREED) reports are funded by donations from individuals, organizations and the CREED Advisory Board. Rental Rate The quoted monthly rental rate excluding any additional concessions or specials. Total Units For the market as a whole, all rentable units that were surveyed in the current time period. For the individual communities, the total number of units that are complete. Vacant Unit Physically unoccupied; pre-leases that are not physically occupied are considered vacant.
72 2007 MULTI-FAMILY General Overview The Virginia Beach-Norfolk-Newport News Apartment Report, published by Real Data, is a detailed analysis of the rental market within conventional apartment communities in the Peninsula and Tidewater portions of the Hampton Roads region. The area has been divided into eight submarkets: Chesapeake/Suffolk, Hampton, Newport News, Norfolk, Portsmouth, Virginia Beach, Williamsburg and York. Combined, these areas contain a survey base of over 80,000 apartment units. Submarket Percentages York County/ Williamsburg 6% Chesapeake 10% The Virginia Beach-Norfolk-Newport News market is divided into two portions by the James River. The Peninsula area is north of the James River and contains Hampton, Newport News, Williamsburg and York. The Tidewater area is south of the James River and contains Chesapeake/Suffolk, Norfolk, Portsmouth, and Virginia Beach. The submarket with the highest concentration of units is Virginia Beach, which accounts for more than one-quarter of the regions apartment units. Virginia Beach 28% Portsmouth 8% Norfolk 15% Hampton 11% Newport News 22% The occupancy rate in the Hampton Roads region is consistently one of the highest in the southeast. As of October 2006, the average occupancy rate was 95.6%. There were 768 units absorbed in Development activity slowed slightly in the past year, and just 640 units were started in the past twelve months. This is in comparison to nearly 1,700 units started in 2005, and over 2,000 units started in As of October 2006, there were over 1,700 units under construction, and an additional 1,800 units were proposed. The average quoted rental rate is $823, with one-bedroom rents averaging $731 per month, two-bedroom units with an average rental rate of $829, and three-bedroom units reporting an average quoted rental rate of $980. Rental rates from existing inventory increased over $33 in the last twelve months MULTI-FAMILY 70
73 HISTORICAL APARTMENT DEVELOPMENT Virginia Beach-Norfolk-Newport News A total of 83,753 units were surveyed for this report. Development of apartment units in this market peaked during two time periods, the early 1970s and the late 1980s. Development during the 1990s and so far in the 2000s is minor compared to past development. Approximately 14% of the apartment units in this region were built after TABLE I HISTORICAL APARTMENT DEVELOPMENT 25,000 22,831 20,000 17,302 NUMBER OF UNITS 15,000 10,000 5,000 11,776 9,451 8,841 5,827 3,805 2,457 5,068 1,494 0 Pre YEAR BUILT 71
74 2007 MULTI-FAMILY MULTI-FAMILY PERMIT ACTIVITY Historical Multi-Family Building Permits Virginia Beach-Norfolk-Newport News Multi-family permit activity, which include rental and for-sale units, were strongest in Much of the permit activity has not been rental apartments, but instead for-sale condominiums and townhouses, especially in recent years when a decline in interest rates made it easier for many people to get into the for-sale arena. Also, many people, including emptynesters and those entering the work force, were looking for a lower maintenance lifestyle that a condominium or townhome provides. Developers responded by building more condominiums and townhomes. TABLE II ANNUAL MULTI-FAMILY PERMIT ACTIVITY PERMITS ISSUED 3,200 3,000 2,800 2,600 2,400 2,200 2,000 1,800 1,600 1,400 1,200 1, ,085 2,355 2,339 2,292 1,712 1,818 1,536 1,519 1,320 1,377 1,421 1,384 1,216 1, MULTI-FAMILY 72
75 TABLE III MULTI-FAMILY PERMITS PAST 12 MONTHS NUMBER OF PERMITS Nov Dec Jan Feb Mar Apr May Jun Jul Aug Sep Oct APARTMENT DEVELOPMENT ACTIVITY There are currently over 1,700 apartment units under construction within nine communities in the Virginia Beach- Norfolk-Newport News market. As of October, over 1,800 additional apartment units were planned for the region. TABLE IV APARTMENT DEVELOPMENT ACTIVITY (OCTOBER 2006) Under Construction Proposed NUMBER OF UNITS Chesapeake Hampton Newport News Norfolk Portsmouth Virginia Beach Williamsburg York 73
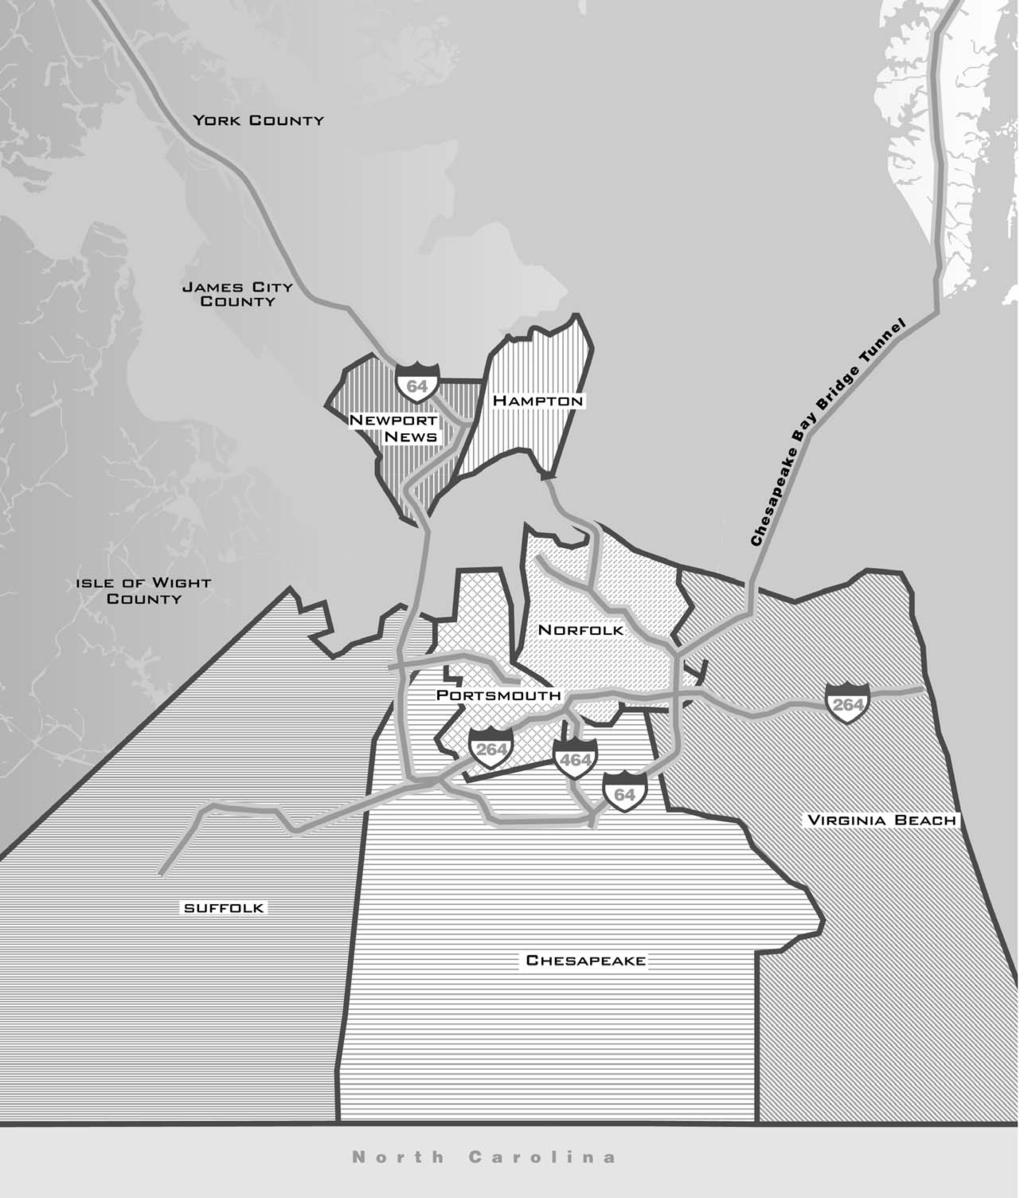
76
77 MULTI-FAMILY SUBMARKETS Southside Chesapeake Franklin/Southampton Co. Isle of Wight Co. Norfolk Portsmouth Suffolk Virginia Beach Peninsula Hampton James City County Newport News York County 75
78 2007 MULTI-FAMILY ABSORPTION Demand for housing can be measured by calculating the number of housing units absorbed within a given time frame. Absorption is defined as the net change in occupied units. Therefore, positive absorption occurs when previously vacant or newly built dwellings become occupied. Based on the current state of the economy and historical performance, the Virginia Beach-Norfolk-Newport News area is expected to absorb between 700 and 900 units annually. The 768 units absorbed over the past year falls within expected absorption levels. TABLE V ABSORPTION AMOUNT OF ABSORPTION Oct Apr Oct Apr Oct Apr Oct Apr Oct Apr Oct Apr Oct The Hampton submarket had the highest level of absorption between April and October, and Virginia Beach reported the least absorption MULTI-FAMILY 76
79 Table VI SUBMARKET ABSORPTION OCTOBER 2005 ABSORPTION (SIX MONTHS) Chesapeake Hampton Newport News Norfolk Portsmouth Virginia Beach Williamsburg York VACANCY The overall vacancy rate for the Virginia Beach-Norfolk-Newport News market as of October 2006 was 4.4%. While this is the highest the vacancy rate has been in nearly 10 years, the market is still very healthy. Based on the current development pipeline, vacancy rates are expected to rise modestly, reaching five percent in Table VII OVERALL VACANCY VACANCY RATE Oct April 2001 Oct Apr Oct Apr Oct Apr Oct Apr Oct Apr Oct
80 2007 MULTI-FAMILY Every area saw an increase in vacancy rate over the past six months with the exception of Hampton, which remained the same at 3.7%, and Portsmouth, which actually saw an improvement in vacancy rate from 3.9% in April to 3.0% in October. The most significant increase in vacancy was in Newport News, whose vacancy went from 4.2% in April to 6.1% in October. Table VIII SUBMARKET VACANCY RATES April 2006 October % VACANCY RATES 6% 5% 4% 3% 2% 1% 0% Chesapeake Hampton Newport News Norfolk Portsmouth Virginia Beach Williamsburg York County Overall 2007 MULTI-FAMILY 78
81 RENTAL RATES As of October, the average rental rate in Virginia Beach-Norfolk-Newport News was $823. Concessions were slightly more common in October of 2006 with 8.7% of communities offering some type of concession. In October 2005, only 5% of communities were offering rental concessions. Concessions offered most often were monthly reductions in the rent, or one month free rent. Table IX AVERAGE RENTAL RATES $900 $800 AVERAGE RENTAL RATE $700 $600 $500 $400 $300 $200 $100 $0 Oct April 2001 Oct Apr Oct Apr Oct Apr Oct Apr Oct Apr Oct
82 2007 MULTI-FAMILY AVERAGE RENTS Average overall rents ranged from a low of $732 in Newport News to a high of $990 in York County. Newport News, Portsmouth, Norfolk, Williamsburg, and Hampton all reported rents lower than the average rent of $823, while Chesapeake, York County, and Virginia Beach all reported rents higher than the average overall quoted rent. Table IX AVERAGE RENTAL RATES $1000 $900 $800 AVERAGE RENT $700 $600 $500 $400 $300 $200 $100 $0 Newport News Portsmouth Norfolk Hampton Williamsburg Overall Chesapeake Virginia Beach York County 2007 MULTI-FAMILY 80
83 MANAGEMENT There were nearly 450 conventional apartment communities with more than 50 units surveyed in the Hampton Roads region in October. Out of more than 80,000 apartment units surveyed, the top fifteen management firms manage close to 70% of these units in the Virginia Beach-Norfolk-Newport News apartment market. The top five management firms manage 36% of the surveyed market, or nearly 30,000 units. Table X TOP 15 MANAGEMENT COMPANIES S.L. Nusbaum Great Atlantic Drucker & Falk Lawson Companies AIMCO Breeden Management WMCI Perrel Management Ripley-Heatwole Abbitt Management Clark-Whitehill Ent. United Dominion Realty PRG Real Estate Kotarides Companies Bonaventure Realty Group 0 1,000 2,000 3,000 4,000 5,000 6,000 7,000 8,000 UNITS REGIONAL TRENDS Roanoke Over 8,800 apartment units were surveyed for the April 2006 Roanoke Apartment Index Report. Findings indicated a vacancy rate of 9.1% an increase from 7.8% reported in the previous year. The decrease in occupancy is due in part to the conversion of one community to a tax credit community. In the renovation process, many residents have been displaced. Overall rental rates were $591 per month. There are 24 units under construction at a second phase of Peter s Creek, located on Barrens Road. In addition, there are 60 units proposed at Blue Ridge Club, located off Peter s Creek Road. Richmond Findings for the August 2006 Richmond Apartment Index were based on more than 50,000 units. The overall vacancy rate was 5.2% while the average rent reported was $761 per month. For the first time since the inception of this report, there were no starts in the Richmond area in the past six months, although there are still over 800 units currently under construction, and there are an additional 800 units proposed. 81


84

85 INVESTMENT 2007 HAMPTON ROADS MARKET SURVEY Acknowledgements Author Jonathan Guion, SIOR Managing Director Sperry Van Ness Commercial Real Estate Advisors
86 2007 INVESTMENT General Overview This report analyzes commercial real estate investments, during the year 2006, within the Virginia Beach-Norfolk-Newport News, VA-NC Metropolitan Statistical Area (the MSA ) that is also known as Hampton Roads, Virginia. This report provides both summary and specific data on investment sales of commercial properties located throughout the MSA. Where available the report includes properties in the cities of Chesapeake, Hampton, Newport News, Norfolk, Poquoson, Portsmouth, Suffolk, Virginia Beach and Williamsburg, as well as the counties of Gloucester, James City and York. METHODOLOGY The purpose of this Commercial Investment Review is to collect commercial real estate investment sales data and report on current national and local trends; and as future data is collected, establish longer-term trends within the Hampton Roads commercial real estate investment market. This 2007 survey is the third in the series. Data has been collected for the period January 1, 2006 through December 31, As this report was required for publication at the end of December 2006, it may not include some transactions that took place at the very end of the year. This data should be used for trend analysis only, as the data collected is from multiple sources and the author was not always able to verify the specifics of all individual transactions. The focus of this survey is on the four primary types of commercial investment real estate: apartments, office, retail and industrial. The objective of this report is to include as many building sales as possible. An effort has been made to limit the survey to buildings that are owned as investments. Single tenant buildings are included if the primary function of the ownership is as an investment. Owner occupied buildings are included if a significant part of the property is leased to third party tenants. Land is excluded from this report. National and regional data, as well as analysis, have been provided by Real Capital Analytics and REIS, through Sperry Van Ness International. Local data has been gathered through Sperry Van Ness Commercial Real Estate Advisors in Virginia Beach with assistance from area brokers and real estate appraisers INVESTMENT 84
87 NATIONAL OVERVIEW Although the national commercial property investment market managed to maintain the record levels set over the last few years, some dramatic changes in the landscape occurred during Changes included the impact of foreign capital, the condo conversion market, fluctuations in interest rates, mobility of capital, privatizations and mega deals. Foreign investors, REITs and syndicators all slowed their investments in 2006, while at the same time acquisitions by condo converters came to a screeching halt. Even with all these changes the total volume of sales in the commercial property investment market grew by over 10% during the year. In 2005, foreign investors accounted for over $21 billion in acquisitions in U.S. commercial properties; in 2006 that number dropped by over 20% to below $16 billion. Across the U.S., foreign investors represented only 2% of the acquisitions of apartments, 4% of the acquisitions of industrial, 8% of the acquisitions of retail and 11% of the acquisitions of office properties. Across all four property types foreign investors showed a drop in the volume of acquisitions that they made in U.S. properties. The good news is that private investors, and for some part institutions, picked up the slack and then some. The most dramatic shift in the market was the condo converters who went from spending over $30 billion in 2005 to well under $10 billion in Developers buying commercial properties for conversion to condominiums were the largest single group of buyers during 2005 and in the process took approximately 175,000 apartment units out of the apartment rental market. They also took over 12 million square feet of office and industrial space to be converted into residential condominiums and over 6 million square feet to be converted to commercial condominiums. At the beginning of the year we were skeptical on how this market would fare with the slow down in the residential markets. During the year, some of the conversion projects were never converted and managed to be resold as apartments, even at a profit. The condo market cooled during the year. Many conversion lenders tightened their criteria and we don t expect to see a return to that kind of acquisition activity in the near future. Interest rates took an upward bump in the middle of the year but still remained at historically low levels. The mid-year bump in the interest rate did push capitalization rates up accordingly, but the second half of the year showed a corresponding drop in both rates. The availability of inexpensive capital kept investors looking for acquisitions while still willing to pay aggressive prices for these deals. As a result, capitalization rates crept down again at the end of the year and prices for the most part continued at their high levels. Nationally, average capitalization rates for institutional quality properties are still strong, ranging from 5.6% for apartments to 7.1% for industrial. The mobility of capital has continued to explode nationally as local investors expanded their acquisitions well beyond their local markets. In search of competitive deals, West Coast buyers are moving east, and East Coast buyers are moving to the mid-west. Major market buyers are flocking to secondary markets; all are looking for means to increase their yields. Secondary and tertiary markets became popular as prized properties in these markets were picked up. Midwestern and southeastern sellers have been the beneficiaries of this capital flow and the trend should continue. Larger national investors, in addition to scouring smaller markets, have also started to look overseas for opportunities. The flow of capital for real estate has truly gone global and will remain that way for the foreseeable future. Privatization and mega deals have been a driving force for the investment market throughout REIT mergers and acquisitions by equity funds doubled in 2006 to approximately $100 billion. Approximately half of this activity was privatization backed by equity funds. Blackstone s pending $36 billion purchase of EOP will be the largest real estate deal in history and is the precursor to mega deals to come. During 2006, transactions for 31 portfolios or properties valued over $1 billion each were announced. The largest REIT IPO in history was concluded during the third quarter of the year and the record for largest sale for an individual property was broken multiple times. These mega deals will continue to influence the national commercial property landscape during the coming year. 85
88 2007 INVESTMENT As we concluded at the end of last year, it appears the economic recovery has started to show signs as most markets across the country posted positive absorption and many posted modest rent growth as well. The strengthening of the base fundamentals in many markets allowed the continued justification of higher values and lower capitalization rates for most deals. The economy continues to push along and it appears most investors are very optimistic about the coming years. The year ahead will hold very much the same as interest rates should remain relatively low, the economy should continue along on a positive pace and investors will continue to prefer hard assets. HAMPTON ROADS OVERVIEW The Hampton Roads commercial property investment market maintained a steady pace throughout 2006 as it benefited from the mobility of capital and a stable economic base. In spite of the scheduled closing of the Ford truck manufacturing plant in Norfolk and lingering concerns surrounding the Base Realignment and Closure Commission (BRAC) recommendations, the Hampton Roads MSA economy, according to the U.S. Department of Labor, was one of a limited number of MSAs nationwide to show a continued increase in average nonagricultural employment. The gains are not large, but they are positive, reinforcing the stability of the market. The strong presence of the wide variety of U.S. military branches and military support operations, along with the continued growth of the Ports of Hampton Roads, sustain the local economy. One of the largest factors influencing the local commercial property investment market for 2005 were portfolio sales, which with a few exceptions all but disappeared during While several portfolio sales did take place in the office and apartment sectors, they paled in comparison to the $100 million invested by First Potomac Realty Trust in The largest transactions in Hampton Roads during 2006 included the Alta Cove apartments valued at $63 million, and the West Park Warehouses and the Dove Landing Apartment portfolio, both valued just over $32 million each. Most of the investment sales that took place in 2006 were smaller properties and the total volume of investment sales dropped by almost 30%. The total volume of commercial investment sales dropped from an adjusted $804 million in 2005 to $570 million for APARTMENTS The national apartment market is continuing to show robust activity highlighted by a record number of mega deals. Positive rent growth for apartments keeps a steady flow of capital pushing into this market segment and market dynamics has kept the national vacancy factor at a healthy low of 5.4%. In 2005, condo converters drove the apartment sales market pushing sales prices up and cap rates down. Although condo converters, who represented approximately 35% of the buyers in 2005, came to a screeching halt during 2006, institutions and REITs picked up the slack and then some. Mega deals drove the 2006 market with multiple portfolios valued over $1 billion each trading hands. The largest of the apartment mega deals was the Peter Cooper Village / Stuyvesant Town transaction in Manhattan valued over $5.4 billion. With condo converters basically out of the market and no longer driving up prices, the national average price per unit has come down slightly from last year to $94,500 per unit for Capitalization rates continue to be very aggressive with the national average continuing the downward trend to 5.28%. The Hampton Roads apartment market continues to show robust activity. Vacancy rates that remain among the nations lowest, continued positive employment numbers and the slip in the housing market has Hampton Roads continuing to attract a lot of attention from both buyers and builders.. Builders were very aggressive in 2005 delivering a record 1,770 units and even more aggressive in 2006 with 2,319 units scheduled for delivery. This represents over a 30% increase in the 2007 INVESTMENT 86
89 number of new units scheduled for delivery in 2006, now the strongest year since Another 1,700 units are under construction for 2007 and the impact of all these new units on rental rates will be seen in 2007 and 2008 as these and additional units are absorbed. Vacancy rates for 2006 were up to 4.4%, up 30% from The number of properties acquired during the year was fewer than last year, but the number of actual units sold was almost identical. We recorded 2,837 units sold during The biggest change factor for the year was the average price per unit which jumped over 20% from $66,500 per unit in 2005 to $80,307 per unit in The range of per unit values remained fairly disperse with a low for this year of $28,814 and a high of $168,449 per unit. Estimated capitalization rates were up slightly and ranged from 5.9% up to 10.5% with the majority in the mid 7% to mid 8% range. Sixty percent of the units sold were to three buyers from outside the market. Major transactions for the year included Alta Cove in Chesapeake that sold for $63 million and the Dove Landing portfolio of apartments in Virginia Beach and Norfolk that sold for $32,636,000. This portfolio included eight properties with a total of 438 units that sold for $74, per unit. Significant transactions for 2006 included: Development City Units Price Price/Unit Alta Cove Chesapeake 374 units $63,000,000 $168,449 Riverdale Hampton 580 units $30,150,000 $ 51,982 Brookfield Va. Beach 352 units $24,000,000 $ 68,181 Talbot Park Norfolk 114 units $17,200,000 $150,877 Gates of West Bay Norfolk 202 units $15,500,000 $ 76,732 Arbor Trace Va. Beach 148 units $14,750,000 $ 99,662 Dove Landing N Va. Beach 150 units $11,176,842 $ 74,512 * *Price Allocated OFFICE Nationally, office properties remained a prime target for buyers with a reported total acquisition volume estimated at over $120 billion. This represents a significant increase in sales volume over the prior year of almost 15%, after removing REIT privatizations. Declining vacancy rates, increasing rental rates and softening of concessions have all contributed to the strong investment activity in the office market. With capitalization rates remaining low and construction costs still rising, there is continued pressure on prices. Since sales prices remain high in primary markets there has been a strong shift from buyers to secondary and tertiary markets where capitalization rates do not have the same pressures. Nationally, average prices for office buildings rose to $220 per square foot, reflecting a gain of over 20% during the year. Capitalization rates continued their downward trend, closing the year at approximately 6.2%. Office investment sales volume in Hampton Roads was off significantly from the prior year showing a decline in the number of building sales of almost half. Although the number of sales was off, the average price per square foot continued its 87
90 2007 INVESTMENT upward trend from $127 per square foot in 2005 to $135 per square foot in This increase is due in large part to the sale of several medical office buildings which have a higher cost to construct. The availability of office buildings for sale remains scarce as it appears a significant number of buildings were refinanced and repositioned over the last few years. Major transactions for the year included the sale of the Patrick Henry Corporate Center in Newport News for $14,500,000 and the portfolio sale by Liberty Property Trust of their Rock Landing buildings in Newport News. Significant transactions for 2006 included: Development City Units Price Per SF Jefferson Ave. Newport News 100,000 SF $14,500,000 $145 Rock Landing Dr. Newport News 62,971 SF $7,203,070 $114* Kingsley La Norfolk 31,856 SF $4,330,000 $136 Center Point Dr. Va. Beach 28,250 SF $4,200,000 $149 Laskin Rd Va. Beach 9,500 SF $3,950,000 $416 Rock Landing Newport News 33,224 SF $3,800,397 $114* *allocated indicates the property was part of a multi-building portfolio transaction RETAIL Retail, the investment poster child for 2005, lost a lot of its luster in The volume of retail investment sales dropped over 15% for the year. Although 2005 was a blistering year for all types of retail properties, 2006 showed dramatic declines in sales volumes for regional malls and portfolio sales of strip centers, the high dollar transactions. With the continued retail sales growth of big box users such as Target and Costco, power centers are still in the sights for investment buyers. Individual retail assets such as unanchored centers and free standing stores have been the only real bright spot with sales volume increases approaching 50% over The largest contributor to the slow down in overall sales volume has been continued aggressive pricing combined with the lack of quality of the properties for sale. The end of 2005 showed the beginning of a drop in the price per square foot that continued through 2006 at a slightly slower pace. By the end of the year the national average price per square foot had dropped to $157, from a high of $180 in mid The national average for capitalization rates did end the year lower, at 6.76%, after starting level and actually rising a bit mid year. In spite of the slip in interest nationally, the Hampton Roads retail market maintained a brisk pace for Sales volume for retail properties almost matched 2005 both in square footage and dollar volume. In 2005, there were a significant number of transactions that were portfolio related, whereas in 2006 almost all the transactions were individual property sales. The average price per square foot slipped slightly from $104 in 2005 to an average of $97 per square foot in These smaller unanchored centers have lower quality credit ratings and thereby demand higher capitalization rates and lower per square foot prices. Quoted capitalization rates for the stronger properties ranged from 6.7% to 9%, while many smaller 2007 INVESTMENT 88
91 centers, though only estimated, sold for capitalization rates ranging from 9% and up. Local free standing triple net drug store properties sold for $400 per square foot on capitalization rates of 7%. Major retail transactions for the year included Chesapeake Crossing Shopping Center, Lynnhaven East and North and Patriot Plaza. Significant transactions for 2006 included: Development City Units Price Per SF Richmond Rd. Food Lion Williamsburg 68,060 SF $14,500,000 $213 Chesapeake Crossing Chesapeake 287,679 SF $12,010,000 $42 Lynnhaven East & North Va. Beach 106,657 SF $11,800,000 $111 Victory Blvd. AJ Wright Portsmouth 72,800 SF $10,650,000 $146 Holland Rd - Kmart Va. Beach 190,547 SF $10,000,000 $52 Linens & Things Center Newport News 34,103 SF $6,300,000 $185 Patriot Plaza Williamsburg 76,520 SF $6,200,000 $81 INDUSTRIAL The national industrial property investment market is separated into two distinct property types that include warehouses and flex buildings. Warehouses are typically 300,000 square feet and larger distribution buildings while the flex properties are smaller in size and have a greater percentage of office space. Flex properties are typically designed for high tech, research and back office operations. Increases in wholesale trade and logistics operations have bolstered the national warehouse market, while the flex market, though continuing to struggle with high vacancies, showed signs of renewed investor interest in Nationally, flex properties ended the year at an average price per square foot of $96, down slightly from the $99 per square foot posted at the end of Warehouses ended the year with an average price per square foot of $57, up slightly from the end of year 2005 figure of $55 per square foot. Capitalization rates for warehouse properties fluctuated slightly during the year, but ended the year down at just over 7%. Capitalization rates for flex properties fluctuated during the year but also ended the year down closer to 7.3%. The Hampton Roads industrial investment market was off substantially from the blistering pace set during In 2005, the volume of industrial investment property sales more than tripled over the prior year and portfolio sellers and buyers targeting Hampton Roads set the pace, accounting for 80% of the investment transactions during that year. In 2006, the volume of industrial sales based on square footage dropped over 40%, down to just over 2 million square feet from an adjusted 3.5 million in The dollar volume of investment sales was almost identical to 2005, but the number of buildings sold more than doubled. This indicates that a wider variety of investment buyers were purchasing much smaller assets. The average price per square foot increased dramatically based on the smaller asset size, from $37 per square foot in 2005 up to $64 per square foot for Significant increases in construction costs also helped drive these values up. Flex properties lead the values, pushing $70 to $90 per square foot, while warehouse values remained in the $40 to $55 per square foot range. 89
92 2007 INVESTMENT Major industrial investment transactions included the purchase of the West Park warehouses in Hampton, Crossways I in Chesapeake and the mixed use property that was formerly the Williamsburg Candle Factory. Although the Williamsburg Candle Factory included retail and office property the majority of the square footage was manufacturing and warehouse. Significant transactions for 2006 included: Development City Units Price Per SF West Park warehouses Hampton 515,486 SF $32,219,450 $ 63 Crossways I Chesapeake 143,122 SF $15,700,000 $109 Williamsburg Candle Williamsburg 261,000 SF $10,916,500 $ 42 Middleground Blvd Newport News 77,125 SF $5,950,000 $ 77 Stephanie Way Chesapeake 51,209 SF $5,100,000 $100 Central Drive Va. Beach 56,444 SF $4,850,000 $ 86 Gateway II Norfolk 42,429 SF $3,600,000 $ 85 Steel Street Chesapeake 143,000 SF $3,600,000 $ 25 Miller Store Rd Va. Beach 41,673 SF $2,700,000 $ INVESTMENT 90

93

94
RETAIL 2011 RETAIL. Author. Survey Collection. Data Analysis/ Layout. Financial Support. Disclosure. David Machupa Cushman & Wakefield/THALHIMER
 RETAIL Author Survey Collection Data Analysis/ Layout Financial Support Disclosure David Machupa Cushman & Wakefield/THALHIMER Kyllie Brinkley E.V. Williams Center for Real Estate and Economic Development
RETAIL. Acknowledgements. Authors: Christopher C. Read CB Richard Ellis of Virginia, Inc. Susan P. Pender. NAI Harvey Lindsay
 The E. V. Williams Center for Real Estate and Economic Development wishes to acknowledge all of the firms, individuals and organizations for providing the necessary real estate information and assistance.
Kyllie Brinkley E.V. Williams Center for Real Estate and Economic Development Old Dominion University
 HAMPTON ROADS MARKET REVIEW RETAIL Author Survey Collection Data Analysis/ Layout Financial Support Disclosure David Machupa Cushman & Wakefield THALHIMER Kyllie Brinkley E.V. Williams Center for Real
Old Dominion University
 Old Dominion University E. V. Williams Center for Real Estate and Economic Development E. V. Williams Center for Real Estate and Economic Development www.odu.edu/creed CONTENTS 5 Message From The Director
Page 82: Commercial Versus Residential Heading: 6th line should read: The commercial real estate industry has.
 Errata: Page 82: Commercial Versus Residential Heading: 6th line should read: The commercial real estate industry has. Page 85: Chart title should read as US COMMERCIAL PROPERTY SALES. Page 86: Chart at
INDUSTRIAL. Acknowledgements. Author: Billy King, SIOR. Data Preparation: Stephanie Sanker. Survey Coordination Clay Culbreth, CCIM, SIOR
 HAMPTON ROADS 2006 INDUSTRIAL M A R K E T S U R V E Y Acknowledgements Author: Billy King, SIOR Data Preparation: Stephanie Sanker Survey Coordination Clay Culbreth, CCIM, SIOR Financial Support: The E.
INDUSTRIAL. Acknowledgements MARKET SURVEY. Author. Data Preparation. Survey Coordination. Financial Support HAMPTON ROADS.
 INDUSTRIAL 2007 HAMPTON ROADS MARKET SURVEY Acknowledgements Author Billy King, SIOR Data Preparation Stephanie Sanker Survey Coordination Clay Culbreth, CCIM, SIOR Financial Support The E. V. Williams
2011 HAMPTON ROADS REAL ESTATE MARKET REVIEW
 2011 HAMPTON ROADS REAL ESTATE MARKET REVIEW 2011 HAMPTON ROADS REAL ESTATE MARKET REVIEW CONTENTS ASSOCIATE PUBLISHER Mike Herron Inside Business 757.222.3991 SPECIAL PUBLISHING MANAGER Olga Currie GRAPHIC
MARKET SURVEY OLD DOMINION UNIVERSITY CENTER FOR REAL ESTATE AND ECONOMIC DEVELOPMENT. Center for Real Estate & Economic Development
 2004 MARKET SURVEY OLD DOMINION UNIVERSITY CENTER FOR REAL ESTATE AND ECONOMIC DEVELOPMENT Center for Real Estate & Economic Development Some commercial real estate firms can help you with a particular
Old Dominion University Hampton Roads Real Estate Market Review and Forecast 2005
 Old Dominion University Hampton Roads Real Estate Market Review and Forecast 2005 Presented by: The Center for Real Estate and Economic Development Real Estate Centers University of Pennsylvania Samuel
INVESTMENT. Acknowledgements. Authors: Jonathan Guion, SIOR Senior Advisor Sperry Van Ness Commercial Real Estate Advisors
 HAMPTON ROADS 2006 INVESTMENT M A R K E T S U R V E Y Acknowledgements Authors: Jonathan Guion, SIOR Senior Advisor Sperry Van Ness Commercial Real Estate Advisors 87 2006 INVESTMENT GENERAL OVERVIEW T
REAL ESTATE MARKET REVIEW
 MULTIFAMILY 2014 HAMPTON ROADS REAL ESTATE MARKET REVIEW Author Charles Dalton Data Analysis Real Data Financial Support The E.V. Williams Center for Real Estate and Economic Development (CREED) functions
Inside Business. Old Dominion University Hampton Roads Real Estate Market Review and Forecast. Executive Committee. Programs Committee
 Old Dominion University Hampton Roads Real Estate Market Review and Forecast Presented by: The Center for Real Estate and Economic Development Executive Committee Melody Bobko Ron Bray Craig Cope John
MULTIFAMILY 2012 MULTI-FAMILY HAMPTON ROADS MARKET REVIEW. Author. Data Analysis. Financial Support. Disclosure. Charles Dalton.
 HAMPTON ROADS MARKET REVIEW MULTIFAMILY Author Data Analysis Financial Support Disclosure Charles Dalton Real Data The E. V. Williams Center for Real Estate and Economic Development (CREED) functions and
Residential. Acknowledgements. Author Data Analysis/ Layout. Financial Support. Disclosure. Blair Hardesty Director Residential DataBank
 Residential Acknowledgements Author Data Analysis/ Layout Financial Support Disclosure Blair Hardesty Director Residential DataBank The E. V. Williams Center for Real Estate and Economic Development (CREED)
Multi-Family. Acknowledgements. Author. Data Analysis/ Layout. Financial Support. Disclosure. Charles Dalton. Real Data
 Multi-Family Acknowledgements Author Charles Dalton Data Analysis/ Layout Real Data Financial Support Disclosure The E. V. Williams Center for Real Estate and Economic Development (CREED) functions and
MULTI-FAMILY DEFINITIONS. Acknowledgements. The following terminology and sources are used in the CREED Apartment Report:
 DEFINITIONS The following terminology and sources are used in the CREED Apartment Report: Absorption Net change in occupied units within comparable communities within a specific time frame. New units that
Hampton Roads Real Estate Market Review and Forecast
 Old Dominion University Hampton Roads Real Estate Market Review and Forecast 2011 Presented by: E.V. Williams Center for Real Estate and Economic Development Welcome! John R. Lombard, Ph.D. Director E.V.
MARKET SURVEY OLD DOMINION UNIVERSITY CENTER FOR REAL ESTATE AND ECONOMIC DEVELOPMENT. Center for Real Estate & Economic Development
 2004 MARKET SURVEY OLD DOMINION UNIVERSITY CENTER FOR REAL ESTATE AND ECONOMIC DEVELOPMENT Center for Real Estate & Economic Development Some commercial real estate firms can help you with a particular
3 RD QUARTER 2016 RICHMOND RETAIL MARKET REPORT FORECAST 5.3% VACANCY 349,524 SF UNDER CONSTRUCTION (137,905) SF NET ABSORPTION
 SF NET ABSORPTION") 3 RD QUARTER 2016 RICHMOND RETAIL MARKET REPORT FORECAST All signs indicate a stabilized market that continues to support well-located new development. The majority of absorption in the 3rd quarter was
3 RD QUARTER 2016 RICHMOND RETAIL MARKET REPORT FORECAST All signs indicate a stabilized market that continues to support well-located new development. The majority of absorption in the 3rd quarter was
INVESTMENT. Acknowledgements MARKET SURVEY. Author HAMPTON ROADS
 INVESTMENT 2007 HAMPTON ROADS MARKET SURVEY Acknowledgements Author Jonathan Guion, SIOR Managing Director Sperry Van Ness Commercial Real Estate Advisors 2007 INVESTMENT General Overview This report analyzes
INDUSTRIAL. Stephanie Sanker, SIOR, CCIM. Stephanie Sanker, SIOR, CCIM
 2011 HAMPTON ROADS REAL ESTATE MARKET REVIEW INDUSTRIAL Author Data Preparation Survey Coordination William C. Throne, SIOR, CCIM, ALC Vice President, Cushman & Wakefield/THALHIMER Stephanie Sanker, SIOR,
INVESTMENT OFFERINGS CUSHMAN & WAKEFIELD THALHIMER CAPITAL MARKETS GROUP THIRD QUARTER 2016
 CUSHMAN & WAKEFIELD THALHIMER CAPITAL MARKETS GROUP INVESTMENT OFFERINGS THIRD QUARTER 2016 ERIC ROBISON Senior Vice President (804) 697 3475 eric.robison@thalhimer.com MICHAEL EARLY First Vice President
Charleston. Retail Loves the Holy City. Fourth Quarter 2017 Retail. Vacancy Rates. Net Absorption. Asking Rent $ , %
 Retail Loves the Holy City Even with 158,000 plus square feet (sf ) hitting the market in the fourth quarter of 2017, the vacancy rate continued its march downward dropping 0.8% to! Much of the rising
3 RD QUARTER 2015 RICHMOND RETAIL MARKET REPORT FORECAST 5.7% VACANCY 509,220 SF UNDER CONSTRUCTION 370,165 SF NET ABSORPTION
 3 RD QUARTER 2015 RICHMOND RETAIL MARKET REPORT FORECAST As 2015 winds down, the vacancy rates are approaching an all time low. Retail inventory is down causing an increase in construction with national
RESIDENTIAL. Acknowledgements 2008 HAMPTON ROADS REAL ESTATE MARKET REVIEW. Author Bea Hopkins Director Residential DataBank
 ODU-MarketReview2008-FINAL2:ODUMarketReview2005 2/14/08 11:53 AM Page 57 RESIDENTIAL 2008 HAMPTON ROADS REAL ESTATE MARKET REVIEW Acknowledgements Author Bea Hopkins Director Residential DataBank Data
Shopping Center Occupancy Study of the Greater Hagerstown Area
 Shopping Occupancy Study of the Greater Hagerstown 2015 Prepared By City of Hagerstown Planning & Code Administration Department November 2015 Shopping Occupancy Study of the Greater Hagerstown - 2015
Slover Library opened January 2015 WHAT S
 Slover Library opened January 2015 WHAT S NeW Summer 2015 THE MAIN Coming in 2017 WATERSIDE LIVE! THE COURTHOUSE HARBOR S EDGE Announcing Harbor s Edge Phase II in Fort Norfolk Coming Summer 2016 NEWRETAIL
Charleston. Retail Is Still Thriving. Fourth Quarter 2018 Retail
 Retail Is Still Thriving The region s vacancy rate crept up slightly from the previous quarter, while the availability rate dropped marginally. Asking NNN rental rates dropped over $1.50 per square foot
INVESTMENT OFFERINGS CUSHMAN & WAKEFIELD THALHIMER CAPITAL MARKETS GROUP SECOND QUARTER 2016
 CUSHMAN & WAKEFIELD THALHIMER CAPITAL MARKETS GROUP INVESTMENT OFFERINGS SECOND QUARTER 2016 ERIC ROBISON Senior Vice President (804) 697 3475 eric.robison@thalhimer.com CATHARINE SPANGLER Senior Associate
The CoStar Retail Report
 The CoStar Retail Report Y E A R - E N D 2 0 1 1 YEAR-END 2011 KANSAS CITY Table of Contents Table of Contents.................................................................... A Methodology........................................................................
MARKET INSIGHT LOUISVILLE, KENTUCKY MULTIFAMILY REPORT THIRD QUARTER 2017
 CUSHMAN & WAKEFIELD COMMERCIAL KENTUCKY LOUISVILLE MULTIFAMILY RESEARCH MARKET INSIGHT MULTIFAMILY REPORT THIRD QUARTER 217 The Cushman & Wakefield Commercial Kentucky Multifamily Research Team provides
MARKET WATCH SOUTHERN CALIFORNIA & PHOENIX
 SOUTHERN CALIFORNIA & PHOENIX COMMERCIAL REAL ESTATE MARKET FOURTH QUARTER 217 MARKET WATCH SOUTHERN CALIFORNIA & PHOENIX 1.888.659.DAUM WWW.DAUMCOMMERCIAL.COM D/AQ Corp. # 1129558 DAUM TABLE OF CONTENTS
Upstate, SC 2Q17. Industrial Market Report. Q2 Industrial. Upstate Economy in 2Q17* Industrial Sector in 2Q17. Trends for 2Q17
 Upstate, SC 2Q17 Industrial Market Report The industrial market for the Upstate of South Carolina saw continued growth for the second quarter of 217. While there was a positive net absorption of 67,53
WEST COUNTY MARKETPLACE
 INVESTMENT SUMMARY Retail Investment Opportunity Offering Memorandum WEST COUNTY MARKETPLACE 2004 Veterans Memorial Parkway (Highway 78), Birmingham, AL $5,168,600 9.8% CAP RATE PRESENTED BY: Josh Randolph,
Investor Presentation 2017
 Investor Presentation 2017 BACKGROUND 2017 Broad Street Realty, LLC l 2 BACKGROUND BROAD STREET REALTY OVERVIEW Michael Jacoby (based in Bethesda) and Tom Yockey (based in Denver) founded Broad Street
The CoStar Retail Report
 The CoStar Retail Report T H I R D Q U A R T E R 2 0 1 1 Kansas City Retail Market Kansas City Retail Market THIRD QUARTER 2011 KANSAS CITY Table of Contents Table of Contents....................................................................
Time for Retail to Take Stock
 Q1 2013 RETAIL LAS VEGAS NEVADA RESEARCH & FORECAST REPORT Time for Retail to Take Stock It is heartening to say, after five years of a bad economy, that the first quarter of 2013 s 119,649 square feet
Charleston. Retail Continues to Thrive. First Quarter 2018 Retail
 Retail Continues to Thrive Internet sales continue to have an effect on brick and mortar locations causing retailers to close non-performing locations, downsize or be sold. In other cases, retailers are
INVESTOR PRESENTATION Broad Street Realty, LLC l 1
 INVESTOR PRESENTATION 2018 2018 Broad Street Realty, LLC l 1 BACKGROUND Experts in the complex and challenging world of commercial real estate 2018 Broad Street Realty, LLC l 2 BACKGROUND BROAD STREET
Lower Norfolk County Time Line by Donald W. Moore, CG
 Lower Norfolk Time Line 1607 first landing of Jamestown colonist at Cape Henry 1 1635 Adam Thoroughgood patent 2 1636 New Norfolk 3 1637 Lower and Upper Norfolk 4 first Lower Norfolk court 5 1639 first
SUMMIT POINTE CHESAPEAKE, VA 23320
 CONTACT US OFFICE LEASING PERRY FRAZER Executive Vice President +1 757 228 1833 perry.frazer@cbre-norfolk.com PAT MUGLER Executive Vice President +1 757 228 1831 pat.mugler@cbre-norfolk.com RETAIL LEASING
4Q 16. Columbus Market Report. 605 S Front St Suite 200 Columbus OH
 4Q 16 Columbus Market Report 605 S Front St Suite 200 Columbus OH 43215 www.ohioequities.com 614 224 2400 Columbus Table of Contents 01 Office Market Report 02 Retail Market Report 03 Industrial Market
101 E Washington Street, Ste 400 Greenville, SC Q 18. Market Report
 101 E Washington Street, Ste 400 Greenville, SC 29601 2Q 18 Market Report GREENVILLE/SPARTANBURG 2Q18 OFFICE REPORT * MARKET SUMMARY The Greenville Spartanburg Office market remained fairly steady at the
WINCHESTER STATION WINCHESTER, FREDERICK COUNTY, VIRGINIA
 OFFERING SUMMARY WINCHESTER, FREDERICK COUNTY, VIRGINIA Best-In-Class Merchandising Mix 95% of GLA Occupied by National Tenants Significant Base Rental Rate Spreads On Recent Backfill of Former HHGregg
1st Quarter Updated February 2019 CAPITAL MARKETS. Investment Offerings
 CAPITAL MARKETS Investment Offerings 1st Quarter 2019 Updated February 2019 OFFICE Vistas I& II One Holland Place Commonwealth Medical Park Northpointe Center Petersburg, VA Dumfries, VA 154,653 SF, 95%
INDUSTRIAL QUICK STATS SUMMARY & OUTLOOK MARKET TRENDS VACANCY & NET ABSORPTION ECONOMIC STATS. Current Quarter. Direct Vacancy 2.
 ORANGE COUNTY INDUSTRIAL SECOND QUARTER 218 QUICK STATS Direct Vacancy 2.2% Overall Vacancy 2.5% Lease Rate NNN $.95 Gross Absorption Under Construction MARKET TRENDS Current Quarter 2,956,71 SF 1,367,18
3/18/2012 WELCOME. Stephanie Sanker, CCIM, SIOR S.L. Nusbaum Realty Co.
 E.V. Williams Center for Real Estate and Economic Development (CREED) Old Dominion University Presents the 17 TH ANNUAL HAMPTON ROADS REAL ESTATE MARKET REVIEW AND FORECAST Wednesday, March 14, 2012 WELCOME
>> Greater Los Angeles Retail Starts 2017 At A Slow Pace
 Research & Forecast Report GREATER LOS ANGELES RETAIL Q1 2017 Accelerating success. >> Greater Los Angeles Retail Starts 2017 At A Slow Pace Greater Los Angeles Retail Market The Los Angeles Basin retail
NORFOLK COMMERCE PARK PORTFOLIO
 INVESTMENT OFFERING OPPORTUNITY SEPTEMBER 2018 NORFOLK COMMERCE PARK PORTFOLIO NORFOLK,VA AN INSTITUTIONALLY-SIZED OFFICE/FLEX PORTFOLIO Hampton Roads Military Circle Mall JANAF NORTHAMPTON BLVD. PRINCESS
For Lease. Center Oak Plaza 1119 Johnnie Dodds Blvd Mount Pleasant, South Carolina LOCATED IN THE HEART OF MOUNT PLEASANT
 For Lease Center Oak Plaza 1119 Johnnie Dodds Blvd Mount Pleasant, South Carolina 29464 LOCATED IN THE HEART OF MOUNT PLEASANT For More Information, Contact: Vitré Ravenel Stephens Senior Vice President
Catawba Area Plan Market Analysis. Prepared for: Catawba Area Plan Citizen Advisory Group October 23, 2008
 Catawba Area Plan Market Analysis Prepared for: Catawba Area Plan Citizen Advisory Group October 23, 2008 Completed Development Almost 98% of the housing units are single-family. There are currently no
Good Year, Poor Quarter
 Q4 2013 RETAIL LAS VEGAS NEVADA RESEARCH & FORECAST REPORT Good Year, Poor Quarter After nine quarters of positive net absorption, Southern Nevada s retail market fell into negative net absorption territory
Homestretch: Office Market Set to Finish Strong
 Research & Forecast Report RENO OFFICE Q3 2016 Homestretch: Office Market Set to Finish Strong >> Vacancy drops significantly the largest drop quarter over quarter in 2016 >> Rental rates are not increasing
The Office Market Feels The Heat in Q2
 Research & Forecast Report RENO OFFICE Q2 2017 The Office Market Feels The Heat in Q2 >>All major office submarkets have decreased vacancy and positive absorption this quarter >>The overall vacancy decreased
Year End Deliveries Drive Leasing Activity In the Raleigh-Durham Market
 Research Report RALEIGH-DURHAM OFFICE Q4 2018 Accelerate Success Year End Deliveries Drive Leasing Activity In the Raleigh-Durham Market Kelsey Rogers Senior Research Analyst Raleigh-Durham Market Indicators
For Lease. Center Oak Plaza 1119 Johnnie Dodds Blvd Mount Pleasant, South Carolina LOCATED IN THE HEART OF MOUNT PLEASANT
 For Lease Center Oak Plaza 1119 Johnnie Dodds Blvd Mount Pleasant, South Carolina 29464 LOCATED IN THE HEART OF MOUNT PLEASANT For More Information, Contact: Vitré Ravenel Stephens Vice President Retail
>> Greater Los Angeles Retail Continues to Witness Declining Vacancy
 Research & Forecast Report GREATER LOS ANGELES RETAIL Accelerating success. >> Greater Los Angeles Retail Continues to Witness Declining Vacancy Greater Los Angeles Retail Market The Los Angeles Basin
CHICAGO CBD OFFICE INVESTMENT PROPERTIES GROUP
 CHICAGO CBD OFFICE INVESTMENT PROPERTIES GROUP SECOND QUARTER NEWSLETTER 216 HOT TOPICS Capital markets remain a focus with 14 assets either under contract or sold totaling $2.6 billion, which includes
The Upstate, South Carolina
 The Upstate, South Carolina Investment Progressing with Infrastructure and Manufacturing Expansions Following a trend started in 2015, net absorption remains positive, but has slowed pace in the last two
>> Greater Los Angeles Retail Ends 2016 With Mixed Results
 Research & Forecast Report GREATER LOS ANGELES RETAIL Q4 2016 Accelerating success. >> Greater Los Angeles Retail Ends 2016 With Mixed Results Greater Los Angeles Retail Market The Los Angeles Basin retail
17th Annual Real Estate Review & Forecast
 2017 17th Annual Real Estate Review & Forecast This Year s Sponsors Member FDIC Construction: Review & Forecast 2017 Page 2 Permits Issued 142 New Commercial Construction Permits issued for all Elkhart
New and improved approach to retail
 Research & Forecast Report GREENVILLE SPARTANBURG ANDERSON, SC RETAIL Q4 2017 New and improved approach to retail Crystal Baker Research Coordinator South Carolina Key Takeaways > > Rents remain stable
3 RD QUARTER 2016 RICHMOND INDUSTRIAL MARKET REPORT
 3 RD QUARTER 2016 RICHMOND INDUSTRIAL MARKET REPORT FORECAST The Richmond Industrial market continued trending in the positive direction in the third quarter, with the absorption of over 320,000 square
RALEIGH-DURHAM MULTIFAMILY Year End 2017
 Research Report -DURHAM MULTIFAMILY Year End 2017 Multifamily Growth Expected to Continue in 2018, Despite a Moderate Decrease in Permitting Totals Emily Bostic Research Analyst Raleigh-Durham Key Takeaways
Shelby Corners. Northwest Corner of Hall Road and Schoenherr Road Utica (Detroit MSA), Michigan. Ben Wineman (630)
, Michigan. Ben Wineman (630)") Shelby Corners Northwest Corner of Hall Road and Schoenherr Road Utica (Detroit MSA), Michigan For further information contact owner s exclusive representatives Ben Wineman (630) 954-7336 bwineman@midamericagrp.com
Shelby Corners Northwest Corner of Hall Road and Schoenherr Road Utica (Detroit MSA), Michigan For further information contact owner s exclusive representatives Ben Wineman (630) 954-7336 bwineman@midamericagrp.com
Existing Land Use. Typical densities for single-family detached residential development in Cumberland County: 1
 Existing Land Use A description of existing land use in Cumberland County is fundamental to understanding the character of the County and its development related issues. Economic factors, development trends,
INDUSTRIAL QUICK STATS SUMMARY & OUTLOOK MARKET TRENDS VACANCY & NET ABSORPTION ECONOMIC STATS
 ORANGE COUNTY INDUSTRIAL FOURTH QUARTER 217 QUICK STATS Direct Vacancy 2.3% Overall Vacancy 2.7% Lease Rate NNN $.91 Gross Absorption Under Construction MARKET TRENDS Current Quarter 4,283,991 SF 963,138
Quick Absorption of Newly Constructed Office Buildings
 Research & Forecast Report CHARLESTON, SC OFFICE Q3 2016 Quick Absorption of Newly Constructed Office Buildings Bryana Mistretta Research Coordinator South Carolina Key Takeaways >> The Interstate 526
The CoStar Retail Report
 The CoStar Retail Report M I D - Y E A R 2 0 0 9 Southwest Florida Retail Market Southwest Florida Retail Market MID-YEAR 2009 SOUTHWEST FLORIDA Table of Contents Table of Contents....................................................................
>> Greater Los Angeles Retail Continues to Witness Declining Vacancy
 Research & Forecast Report GREATER LOS ANGELES RETAIL Accelerating success. >> Greater Los Angeles Retail Continues to Witness Declining Vacancy Greater Los Angeles Retail Market The Los Angeles Basin
MARKET SUMMARY MICHIGAN, METRO DETROIT AREA FOURTH QUARTER 2016 P LAN T E M OR AN CRES A. pmcresa.com
 FOURTH QUARTER 2016 MICHIGAN, METRO DETROIT AREA MARKET SUMMARY P LAN T E M OR AN CRES A 26300 NORTHWESTERN HIGHWAY SOUTHFIELD, MI 48076 248.223.3500 pmcresa.com Connect with us for more information: Subscribe
MARKET WATCH. Market Highlights
 MARKET WATCH Market Highlights Office Total Inventory 362,968,225 SF Total Vacancy Rate 14.10% Average Rate $24.32 PSF YTD Net Absorption 2,081,326 SF Industrial Total Inventory 804,891,880 SF Total Vacancy
3 RD QUARTER 2015 RICHMOND INDUSTRIAL MARKET REPORT
 3 RD QUARTER FORECAST As the U.S. economy continued to show positive economic growth through the third quarter, the Richmond, VA Industrial market saw demand for warehouse and flex properties increase
Jefferson Pointe Outparcel 4541 Illinois Road Fort Wayne, Indiana 46804
 Illinois Road Featured Property Highlights Surrounding 600,000 SF Jefferson Pointe Shopping Center anchors this unique offering. Redevelop space into single or multi-tenant use. SC zoned building is +/-
Sites Listed on the Virginia Beach Historical Register - By Address As of January 26, 2018 (Year listed shown in parenthesis)
") Sites Listed on the Virginia Beach Historical Register - By Address As of January 26, 2018 (Year listed shown in parenthesis) 411 16 th Street (2004) 301 20 th Street, Nita Fay House (2005) removed from
Sites Listed on the Virginia Beach Historical Register - By Address As of January 26, 2018 (Year listed shown in parenthesis) 411 16 th Street (2004) 301 20 th Street, Nita Fay House (2005) removed from
INDUSTRIAL QUICK STATS SUMMARY & OUTLOOK MARKET TRENDS VACANCY & NET ABSORPTION ECONOMIC STATS
 PHOENIX, ARIZONA INDUSTRIAL THIRD QUARTER 217 QUICK STATS Direct Vacancy 8.7% Overall Vacancy 9.% Lease Rate NNN $.54 Gross Absorption Under Construction MARKET TRENDS Current Quarter 5,991,128 SF 4,751,494
AUSTIN, TEXAS MUELLER ROSE INVESTMENT SUMMARY 181 UNIT APARTMENT COMMUNITY
 AUSTIN, TEXAS MUELLER ROSE INVESTMENT SUMMARY 181 UNIT APARTMENT COMMUNITY EXECUTIVE SUMMARY HFF has been exclusively retained to offer qualified investors the opportunity to purchase the fee simple interest
Washington DC Market Office Report
 Washington DC Market Office Report Market Overview The Office Market The Washington Office Market includes the District of Columbia and adjacent suburban submarkets in Maryland and Virginia. The Washington
SINGLE TENANT INVESTMENT OPPORTUNITY
 SINGLE TENANT INVESTMENT OPPORTUNITY FAIRFIELD, ALABAMA(BIRMINGHAM MSA) JIM SCHUCHERT SENIOR ASSOCIATE SRS NATIONAL NET LEASE GROUP 610 Newport Center Drive, Suite 1500 Newport Beach, CA 92660 DL: 949.270.8204
SHOPS OF BERRYHILL OFFERING MEMORANDUM
 OFFERING MEMORANDUM 1890 BERRYHILL RD, CORDOVA, TN 38016 EAST RETAIL SUBMARKET RETAIL SHOPPING CENTER 17,360 sf INVESTMENT OPPORTUNITY CHIMNEY ROCK BLVD BERRYHILL RD N For more information, please contact:
OFFICE QUICK STATS SUMMARY & OUTLOOK MARKET TRENDS VACANCY & NET ABSORPTION ECONOMIC STATS
 LOS ANGELES NORTH OFFICE FOURTH QUARTER 217 QUICK STATS Direct Vacancy 11.8% Overall Vacancy 12.5% Lease Rate FSG $2.75 Gross Absorption Under Construction MARKET TRENDS Current Quarter 1,6,941 SF 89,158
OFFICE REPORT WINTER 2017
 A Global Division of Cressy Commercial Real Estate OFFICE REPORT WINTER 217 www.cressycommercial.com OFFICE BUILDING CLASSIFICATIONS Office buildings are loosely classified based on the quality of their
First Quarter 2017 Industrial Market Report. Chicago. Economic Overview
 Chicago Market Facts 5.3% Chicago s unemployment rate continued to trend downward. Recorded at 5.3% as of February 2017. 17 MSF The number of completed projects increased to 5.1 msf and projects currently
OFFICE QUICK STATS SUMMARY & OUTLOOK MARKET TRENDS VACANCY & NET ABSORPTION ECONOMIC STATS
 LOS ANGELES CENTAL/SOUTHEAST OFFICE THIRD QUARTER 218 QUICK STATS Direct Vacancy 14.7% Overall Vacancy 15.2% Lease Rate FSG $3.16 Gross Absorption Under Construction MARKET TRENDS Change from Last Quarter
Los Angeles Basin Retail Market Continues To Witness Decreasing Vacancy Rates
 RETAIL GREATER LOS ANGELES BASIN MARKET REPORT Continues To Witness Decreasing Vacancy Rates MARKET INDICATORS - VACANCY 6.0% NET ABSORPTION 1,605,200 CONSTRUCTION 2,111,970 RENTAL RATE $2.03 P NNN UNEMPLOYMENT
Greenville defies the nationwide trend of retail closures
 Research & Forecast Report GREENVILLE SPARTANBURG ANDERSON, SC RETAIL Q3 2017 Greenville defies the nationwide trend of retail closures Crystal Baker Research Coordinator South Carolina Key Takeaways >
EASTRIDGE PLAZA - PORTERVILLE, CA
 EASTRIDGE PLAZA - PORTERVILLE, CA DuBois Gianulias www.cbre.com/dg ACCEPTING OFFERS IMMEDIATELY Exclusively Offered By Jon Gianulias Senior Vice President 916.446.8787 jon.gianulias@cbre.com John DuBois
Westgate Center. Southwest Corner of Division Street & 25th Avenue South St. Cloud, Minnesota
 Westgate Center Southwest Corner of Division Street & 25th Avenue South St. Cloud, Minnesota For further information contact owner s exclusive representatives. Joe Girardi 630.954.7392 j.girardi@midamericagrp.com
VACANCY COMPLETIONS RENTAL RATE. *Projected $1.70. Vacancy Rate 14.9% 14.4% $1.60 $1.50 $1.40 $1.30 $1.20
 Research & Forecast Report RENO OFFICE Q4 A Good Year Overall > Building sale prices are significantly higher than. > Seven buildings over 40,000 sf sold in, more than in previous years. > Many large office
MARKET WATCH. Market Highlights. Economic Indicators
 MARKET WATCH Third Quarter 2017 Market Highlights Office Total Inventory 364,583,007 SF Total Vacancy Rate 12.60% Average Rate $25.50 PSF Net Absorption 1,006,505 SF Industrial Total Inventory 819,657,165
Gaining Traction Gradually in 2018
 Research & Forecast Report RENO OFFICE Q1 2018 Gaining Traction Gradually in 2018 >> Overall vacancy increased slightly to 12.3% >> Negative net absorption of 13,792 square feet >> Rental rates remained
Indianapolis MARKETBEAT. Office Q Economy. Market Overview INDIANAPOLIS OFFICE
 INDIANAPOLIS OFFICE Economic Indicators Market Indicators (Direct, All Classes) Direct Net Absorption/Direct Asking Rent 4-QTR TRAILING AVERAGE Direct Vacancy Q3 17 Q3 18 MSA Employment 1.05M 1.07M MSA
OFFICE QUICK STATS SUMMARY & OUTLOOK MARKET TRENDS VACANCY & NET ABSORPTION ECONOMIC STATS
 LOS ANGELES SAN GABRIEL VALLEY OFFICE SECOND QUARTER 218 QUICK STATS Direct Vacancy 11.1% Overall Vacancy 11.4% Lease Rate FSG $2.32 Gross Absorption Under Construction MARKET TRENDS Current Quarter 345,68
For Sale New Construction Buffalo Wild Wings Retail Center Highway 278 at Highway 46- Hilton Head, SC
 For Sale New Construction Buffalo Wild Wings Retail Center Highway 278 at Highway 46- Hilton Head, SC Site 325,000 sf shopping center Contact: David Oliver 770-993-8850 davidoliver@jazdev.com For Sale
Elsworth Plaza ALESSANDRO BLVD, MORENO VALLEY, CA ALESSANDRO BLVD, MORENO VALLEY, CA 92553
 The information contained herein has been obtained from sources we The deem information reliable. We contained cannot herein assume has responsibility been obtained for its from accuracy sources we deem
SINGLE TENANT STATESVILLE INVESTMENT OPPORTUNITY NORTH CAROLINA ACTUAL SITE
 SINGLE TENANT INVESTMENT OPPORTUNITY STATESVILLE NORTH CAROLINA ACTUAL SITE EXCLUSIVELY MARKETED BY: JIM SCHUCHERT FIRST VICE PRESIDENT SRS NATIONAL NET LEASE GROUP 610 Newport Center Drive, Suite 1500
Metropolitan Milwaukee Office Market Report Third Quarter 2015
 Metropolitan Milwaukee Office Market Report Third Quarter 2015 RETAIL OFFICE INDUSTRIAL LAND INVESTMENT NAI MLG COMMERCIAL 414 347 9400 757 N BROADWAY, SUITE 700, MILWAUKEE, WI 53202 MLGCOMMERCIAL.COM
WAKE UNION PLACE WAKE FOREST, NORTH CAROLINA LAND FOR SALE ±65.43 ACRES SITE WAKE FOREST PRESBYTERIAN CHURCH. Smithfield s CHICKEN N BAR-B-Q
 WAKE FOREST, NORTH CAROLINA LAND FOR SALE ±65.43 ACRES WAKE FOREST PRESBYTERIAN CHURCH SITE KEARNEY ROAD CAPITAL BOULEVARD WAKE FOREST CROSSING Smithfield s CHICKEN N BAR-B-Q MARKET OF WAKE FOREST DURHAM
NET LEASE INVESTMENT OFFERING MCDONALD S (GL) 1880 E Market Street Harrisonburg, VA 22801
 1880 E Market Street Harrisonburg, VA 22801") MCDONALD S (GL) 1880 E Market Street Harrisonburg, VA 22801 TABLE OF CONTENTS TABLE OF CONTENTS I. Executive Profile Executive Summary Investment Highlights Property Overview II. Location Overview Photographs
MCDONALD S (GL) 1880 E Market Street Harrisonburg, VA 22801 TABLE OF CONTENTS TABLE OF CONTENTS I. Executive Profile Executive Summary Investment Highlights Property Overview II. Location Overview Photographs