INDUSTRIAL. Acknowledgements. Author: Billy King, SIOR. Data Preparation: Stephanie Sanker. Survey Coordination Clay Culbreth, CCIM, SIOR
|
|
|
- Walter Patrick
- 6 years ago
- Views:
Transcription


1 HAMPTON ROADS 2006 INDUSTRIAL M A R K E T S U R V E Y Acknowledgements Author: Billy King, SIOR Data Preparation: Stephanie Sanker Survey Coordination Clay Culbreth, CCIM, SIOR Financial Support: The E. V. Williams Center for Real Estate and Economic Development (CREED) functions and reports are funded by donations from individuals, organizations and the CREED Advisory Board. Statistical data provided by Society of Office and Industrial Realtors (SIOR) Comparative Statistics Market Survey. Research data provided by Real Capital Analytics through Sperry Van Ness.

2 2006 INDUSTRIAL GENERAL OVERVIEW T his report analyzes the 2005 industrial real estate conditions within the Virginia Beach- Norfolk-Newport News, VA-NC Metropolitan Statistical Area (the MSA ) that is also known as Hampton Roads. It provides inventory, vacancy, rent, sale and other data for the MSA. The survey includes properties in the cities of Chesapeake, Hampton, Newport News, Norfolk, Poquoson, Portsmouth, Suffolk, Virginia Beach, and Williamsburg, plus the counties of Gloucester, James City, York and Isle of Wight. METHODOLOGY This survey includes the following types of properties: Office-warehouse, industrial and shop facilities of 5,000 square feet or greater. Properties must have less than 80% office space to be included in the SIOR/ODU survey. Both owner-occupied and leased properties are included. Owner-occupied is defined as a property that is 100% occupied by a business that is the same as or is related to the owner of the building. This survey includes all properties that are available and are listed for sale or lease regardless of whether they are occupied, unless they are strictly available for sale as an investment property. For example, a property that is available for sale and is currently occupied on a short-term lease is included. The survey excludes the following types of properties: Land Warehouse or shop facilities on shipyard properties Warehouse or other industrial facilities on federal government property (i.e., U.S. Naval Bases) Industrial facilities on government property (i.e., Norfolk International Terminal or Newport News Marine Terminal) Functional market areas determined submarket delineations with minimal regard to city boundaries. The entire market is divided into 16 submarkets defined by industrial building concentrations, the transportation network, and pertinent physical features. The area map included in this report provides a location key for reference. There were certain minor boundary adjustments made to the area map this year in order to make it more complete and consistent with the mapping methodology of CoStar, a market subscription service now covering Hampton Roads INDUSTRIAL 30
3 OVERVIEW The Old Dominion University s E. V. Williams Center for Real Estate and Economic Development (CREED) has been tracking the inventory of the Hampton Roads industrial market since The results of the 2005 survey indicate that the Hampton Roads industrial market currently encompasses 96,836,275 total square feet of space located in 2,699 buildings throughout the Region. This is an increase of 836,404 square feet, or.87% from the 2004 survey. This increase is due primarily to the enhancement of the survey in the Isle of Wight Submarket (started 2003), the Suffolk Submarket (started 1995) and the Williamsburg Submarket (1995), as well as building expansions and new construction. As a counter to these increases, there was an elimination of many previously included buildings that were noted to be under the survey s minimum criteria of 5,000 square feet. HAMPTON ROADS OVERVIEW The Hampton Roads industrial market is within the South-Atlantic region of the United States, which includes twenty-seven major markets spanning from Maryland into Florida. This year, Hampton Roads posted its lowest vacancy rates since this survey started (1995) with an overall vacancy rate in 2005 of 5.1%. Two of our submarkets saw vacancies at year-end at 0% and all four Peninsula submarkets had their vacancies drop significantly (1.05% %). Total absorption this year was 2.03% or 1,826,089 square feet, compared with 1.7% in In many ways, 2005 was a breakthrough year for the Market. Watershed events included: 1) the purchase or optioning of 8 major land parcels targeted for major, high-bay projects; 2) the sale of four major industrial investment properties; 3) completion and substantial lease-up of the 100% speculative Bridgeway Commerce Center by Liberty Property Trust and 4) the escalation of sale values to levels outstripping even the most bullish projections. Specific highlights included four major industrial buildings investment sales, some of which are included on the attached Comparables list: 1) DD Jones Campostella portfolio, totaling 712,000 square feet, 2) the 400,000 square foot Gateway facility in Hampton 3) and the 300,000 square foot Bay Warehouse complex in Chesapeake. Each of these properties were bought by Potomac Realty Trust. Also, the newly completed 17-North project by the Ireland Partnership of 168,000 square feet was sold this year to another local investor. As mentioned above, several major completed land sales or land options were solidified, allowing the purchasing developers to position these sites for major, high-bay distribution warehouse projects: INDUSTRIAL
4 2006 INDUSTRIAL 1. Benton Trust site, on Benton Road in Suffolk 72 acres. 2. Trade Street, Chesapeake acres. 3. Copeland Industrial Park Spiegel site Newport News 46 acres. 4. Shirley T. Holland site purchase in Isle of Wight County by Johnston Development 30 acres. 5. Ashley Capital s 13 acre purchase at East Indian River Road site adjacent to the Ford Plant. 6. Northgate Logistics site by American Port Services in Northgate Park, Suffolk. 7. Ashley Capital purchase of 755,000 square foot GE facility and core 50 acres on College Drive, Suffolk. If each of these developments is actually built as announced, this would supply an additional 2,782,534 square feet of modern, high-bay space for the market. 2,408,617 sq. ft. would be vacant of this new construction. These developments are in both in-close locations and outer suburban submarkets. The breakdown of available space by unit size continues to change from year to year. The most recognizable change in the past year has been a shift back to a more abundant supply of smaller units (under 5,000 sq. ft.). The percentages of buildings that are available in each size range are as follows: HAMPTON ROADS INDUSTRIAL MARKET VACANCY RATE 16% 14% 12% 10% (as of 1st month of the year) % 6% % 2% 0% INDUSTRIAL 32
5 PERCENTAGE OF AVAILABLE BUILDING BY SIZE RANGE Begin Size (SF) > 5,000 30% 15% 32% 25% 30% 5,000-20,000 40% 52% 44% 40% 42% 20,000-40,000 15% 18% 12% 15% 13% 40,000-60,000 9% 8% 7% 8% 6% > 60,000 6% 7% 5% 12% 9% Available lease space continues to be the most lacking in the larger size ranges (above 40,000 square feet). Also, lacking are for sale opportunities, in all size ranges. This trend is likely to continue into 2006 and As mentioned above, land availability is extremely limited in close-in, central core portions of the Hampton Roads market. This is clearly pushing developers and users to consider and to execute on purchases in such outlying submarkets as Suffolk and Isle of Wight County, as noted above. PERCENTAGE OF AVAILABLE SPACE BY SIZE RANGE Begin Size (SF) > 5,000 3% 10% 5,000-20,000 18% 25% 20,000-40,000 19% 25% 40,000-60,000 15% 10% > 60,000 45% 30% INDUSTRIAL
6 2005 INDUSTRIAL 34

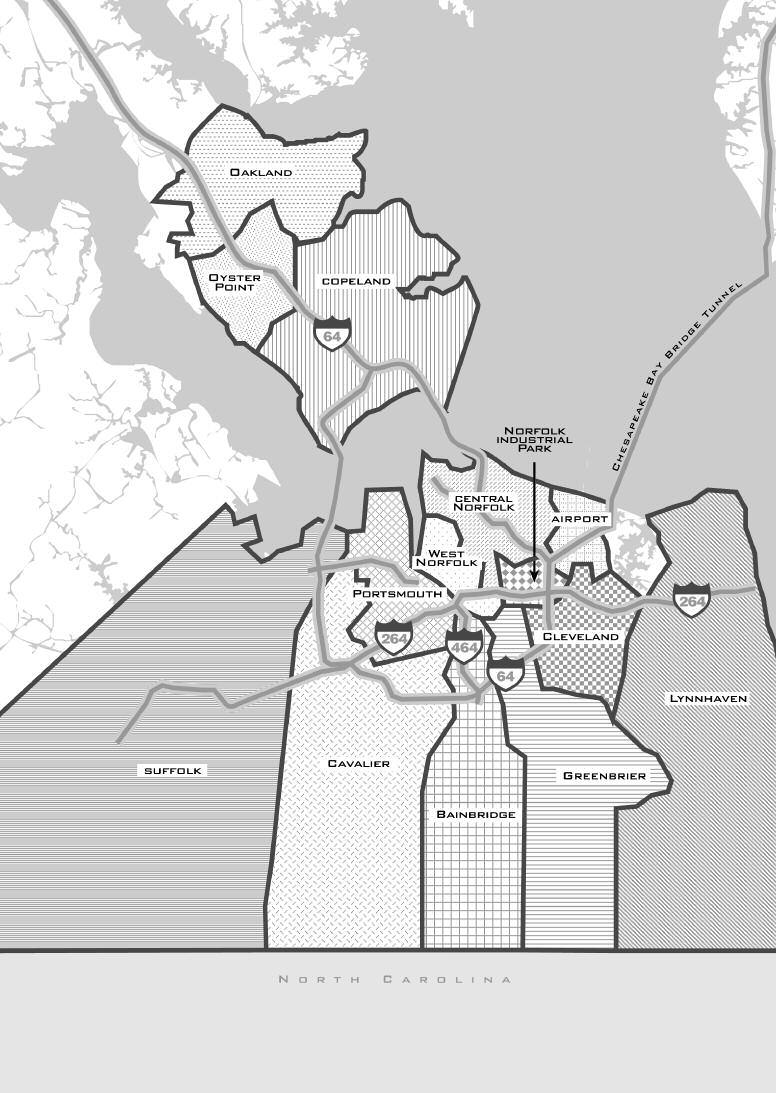
7 INDUSTRIAL SUBMARKETS Southside Suffolk Portsmouth West Norfolk Central Norfolk Cavalier Bainbridge Norfolk Industrial Park Airport Industrial Park Greenbrier Cleveland Lynnhaven Peninsula Copeland Oakland Oyster Point Williamsburg Extended INDUSTRIAL
8 2006 INDUSTRIAL Average market asking rents for small spaces (less than 20,000 square feet) have risen substantially during the past year. The increase in the number of smaller units available has not yet led to a decrease as of yet in asking rents, however. Also, an increase in asking rents for all size units is reflective of the decrease in the overall availability. The variance between asking lease rates and final negotiated rates, highly dependent on the age and location of a particular building, has been, between 5% and 10% in AVERAGE MARKET ASKING RENTS ($/SF) Begin Size (SF) > 5,000 $6.34 $7.16 $6.95 $7.30 $7.75 5,000-20,000 $4.46 $5.80 $5.89 $6.20 $ ,000-40,000 $4.35 $4.99 $5.21 $5.45 $ ,000-60,000 $4.15 $4.13 $4.44 $4.75 $4.95 > 60,000 $3.24 $3.43 $3.15 $4.00 $4.30 SALES OVERVIEW The 2005 sales activity for industrial buildings saw significant price escalation which continued into early Industrial building sales price predominated in the $35 - $75 per square foot (p.s.f). range. Surprisingly, there were sales finalizing higher in the $100 - $120 p.s.f. range, factoring in developed yard or surplus land area into the p.s.f. price. Available modern industrial buildings for purchase have remained very hard to find in all size ranges. REPRESENTATIVE BUILDING SALES TRANSACTIONS Date Location Sq. Ft. Price $/SF Acres Dec GE Facility 755,000 NA NA 50 Dec Tesoro Corp 15,980 $ 750,000 $ Dec Int'l Plaza, Chesapeake 15,500 $1,550,000 $ Oct DD Jones, Campostella Road, Chesapeake 712,000 $29,000,000 $ Oct Professional Place, Chesapeake 14,250 $1,300,000 $ Oct Norfolk Industrial Area 9,852 $600,000 $ May Seventeen N. Fenway Avenue 168,000 $7,200,000 $ Mar Bay Whses. Cook & Cavalier 300,000 $13,200,000 $ INDUSTRIAL 36
9 2005 SIOR/ODU HAMPTON ROADS INDUSTRIAL SURVEY Submarket Totals Bldgs Total Vacancy Vacancy Submarket City Surveyed Sq Ft Sq Ft % Greenbrier Area Chesapeake 265 8,091,101 91, % Bainbridge/S. Elizabeth River Area Chesapeake 133 5,383, % Cavalier Industrial Park Area Chesapeake 177 5,335, , % Norfolk Commerce Park/ Norfolk 140 7,052, , % Central Norfolk Area Norfolk Industrial Park Area Norfolk ,068, , % West Side/Midtown Norfolk Area Norfolk 260 5,910, , % Lynnhaven Area Virginia Beach 173 5,549, , % Greenwich/Cleveland Streets Area Virginia Beach 130 3,147,891 58, % Airport Industrial Park Area Virginia Beach 70 3,702, , % City of Portsmouth Portsmouth 157 4,368,804 1,006, % City of Suffolk Suffolk 143 9,762, , % Isle of Wight Isle of Wight 14 2,424, % Southside Totals 2,009 70,796,014 3,453, % Copeland/Lower Peninsula Area Peninsula 363 9,599, , % Oyster Point/Middle Peninsula Area Peninsula 158 3,877, , % Oakland/Upper Peninsula Area Peninsula 117 4,668, , % Williamsburg Extended Area Peninsula 52 7,885, , % Peninsula Totals ,031,261 1,621, % Totals 2,699 96,827,275 5,074, % INDUSTRIAL
INDUSTRIAL. Acknowledgements MARKET SURVEY. Author. Data Preparation. Survey Coordination. Financial Support HAMPTON ROADS.
 INDUSTRIAL 2007 HAMPTON ROADS MARKET SURVEY Acknowledgements Author Billy King, SIOR Data Preparation Stephanie Sanker Survey Coordination Clay Culbreth, CCIM, SIOR Financial Support The E. V. Williams
INDUSTRIAL. Stephanie Sanker, SIOR, CCIM. Stephanie Sanker, SIOR, CCIM
 2011 HAMPTON ROADS REAL ESTATE MARKET REVIEW INDUSTRIAL Author Data Preparation Survey Coordination William C. Throne, SIOR, CCIM, ALC Vice President, Cushman & Wakefield/THALHIMER Stephanie Sanker, SIOR,
REAL ESTATE MARKET REVIEW
 MULTIFAMILY 2014 HAMPTON ROADS REAL ESTATE MARKET REVIEW Author Charles Dalton Data Analysis Real Data Financial Support The E.V. Williams Center for Real Estate and Economic Development (CREED) functions
Multi-Family. Acknowledgements. Author. Data Analysis/ Layout. Financial Support. Disclosure. Charles Dalton. Real Data
 Multi-Family Acknowledgements Author Charles Dalton Data Analysis/ Layout Real Data Financial Support Disclosure The E. V. Williams Center for Real Estate and Economic Development (CREED) functions and
MULTI-FAMILY DEFINITIONS. Acknowledgements. The following terminology and sources are used in the CREED Apartment Report:
 DEFINITIONS The following terminology and sources are used in the CREED Apartment Report: Absorption Net change in occupied units within comparable communities within a specific time frame. New units that
MULTIFAMILY 2012 MULTI-FAMILY HAMPTON ROADS MARKET REVIEW. Author. Data Analysis. Financial Support. Disclosure. Charles Dalton.
 HAMPTON ROADS MARKET REVIEW MULTIFAMILY Author Data Analysis Financial Support Disclosure Charles Dalton Real Data The E. V. Williams Center for Real Estate and Economic Development (CREED) functions and
INVESTMENT. Acknowledgements. Authors: Jonathan Guion, SIOR Senior Advisor Sperry Van Ness Commercial Real Estate Advisors
 HAMPTON ROADS 2006 INVESTMENT M A R K E T S U R V E Y Acknowledgements Authors: Jonathan Guion, SIOR Senior Advisor Sperry Van Ness Commercial Real Estate Advisors 87 2006 INVESTMENT GENERAL OVERVIEW T
Residential. Acknowledgements. Author Data Analysis/ Layout. Financial Support. Disclosure. Blair Hardesty Director Residential DataBank
 Residential Acknowledgements Author Data Analysis/ Layout Financial Support Disclosure Blair Hardesty Director Residential DataBank The E. V. Williams Center for Real Estate and Economic Development (CREED)
INVESTMENT. Acknowledgements MARKET SURVEY. Author HAMPTON ROADS
 INVESTMENT 2007 HAMPTON ROADS MARKET SURVEY Acknowledgements Author Jonathan Guion, SIOR Managing Director Sperry Van Ness Commercial Real Estate Advisors 2007 INVESTMENT General Overview This report analyzes
MARKET WATCH SOUTHERN CALIFORNIA & PHOENIX
 SOUTHERN CALIFORNIA & PHOENIX COMMERCIAL REAL ESTATE MARKET FOURTH QUARTER 217 MARKET WATCH SOUTHERN CALIFORNIA & PHOENIX 1.888.659.DAUM WWW.DAUMCOMMERCIAL.COM D/AQ Corp. # 1129558 DAUM TABLE OF CONTENTS
OFFICE QUICK STATS SUMMARY & OUTLOOK MARKET TRENDS VACANCY & NET ABSORPTION ECONOMIC STATS
 ORANGE COUNTY OFFICE THIRD QUARTER 217 QUICK STATS Direct Vacancy 12.1% Overall Vacancy 12.9% Lease Rate FSG $2.61 Gross Absorption Under Construction MARKET TRENDS Current Quarter 2,479,293 SF 379, SF
INDUSTRIAL QUICK STATS SUMMARY & OUTLOOK MARKET TRENDS VACANCY & NET ABSORPTION ECONOMIC STATS
 ORANGE COUNTY INDUSTRIAL FOURTH QUARTER 217 QUICK STATS Direct Vacancy 2.3% Overall Vacancy 2.7% Lease Rate NNN $.91 Gross Absorption Under Construction MARKET TRENDS Current Quarter 4,283,991 SF 963,138
INDUSTRIAL QUICK STATS SUMMARY & OUTLOOK MARKET TRENDS VACANCY & NET ABSORPTION ECONOMIC STATS. Current Quarter. Direct Vacancy 2.
 LOS ANGELES NORTH INDUSTRIAL THIRD QUARTER 218 QUICK STATS Direct Vacancy 2.3% Overall Vacancy 2.6% Lease Rate NNN $1.1 Gross Absorption Under Construction MARKET TRENDS Current Quarter 1,632,564 SF 595,199
INDUSTRIAL QUICK STATS SUMMARY & OUTLOOK MARKET TRENDS VACANCY & NET ABSORPTION ECONOMIC STATS
 VENTURA COUNTY INDUSTRIAL FOURTH QUARTER 217 QUICK STATS Direct Vacancy 2.1% Overall Vacancy 2.4% Lease Rate NNN $.7 Gross Absorption Under Construction MARKET TRENDS Current Quarter 1,332,957 SF 774,362
INDUSTRIAL QUICK STATS SUMMARY & OUTLOOK MARKET TRENDS VACANCY & NET ABSORPTION ECONOMIC STATS
 PHOENIX, ARIZONA INDUSTRIAL THIRD QUARTER 217 QUICK STATS Direct Vacancy 8.7% Overall Vacancy 9.% Lease Rate NNN $.54 Gross Absorption Under Construction MARKET TRENDS Current Quarter 5,991,128 SF 4,751,494
INDUSTRIAL QUICK STATS SUMMARY & OUTLOOK MARKET TRENDS VACANCY & NET ABSORPTION ECONOMIC STATS. Current Quarter. Direct Vacancy 2.
 ORANGE COUNTY INDUSTRIAL SECOND QUARTER 218 QUICK STATS Direct Vacancy 2.2% Overall Vacancy 2.5% Lease Rate NNN $.95 Gross Absorption Under Construction MARKET TRENDS Current Quarter 2,956,71 SF 1,367,18
OFFICE QUICK STATS SUMMARY & OUTLOOK MARKET TRENDS VACANCY & NET ABSORPTION ECONOMIC STATS
 INLAND EMPIRE OFFICE THIRD QUARTER 217 QUICK STATS Direct Vacancy 11.4% Overall Vacancy 11.7% Lease Rate FSG $1.83 Gross Absorption Under Construction MARKET TRENDS Current Quarter 529,634 SF 45,24 SF
OFFICE QUICK STATS SUMMARY & OUTLOOK MARKET TRENDS VACANCY & NET ABSORPTION ECONOMIC STATS
 LOS ANGELES NORTH OFFICE FOURTH QUARTER 217 QUICK STATS Direct Vacancy 11.8% Overall Vacancy 12.5% Lease Rate FSG $2.75 Gross Absorption Under Construction MARKET TRENDS Current Quarter 1,6,941 SF 89,158
Houston Summer Retail. Office. July 2016 Commercial Markets. Independent Valuations for a Variable World Page 1. Summary Q1 Statistics
 July 2016 Commercial Markets In This Issue Commercial Markets Retail Office Industrial Multifamily Housing Trends Single Family Housing Lot Supply & New Home Data % 10% 8% 6% 4% 2% 0% Retail 2007 Q1 2008
Old Dominion University Hampton Roads Real Estate Market Review and Forecast 2005
 Old Dominion University Hampton Roads Real Estate Market Review and Forecast 2005 Presented by: The Center for Real Estate and Economic Development Real Estate Centers University of Pennsylvania Samuel
RESIDENTIAL. Acknowledgements 2008 HAMPTON ROADS REAL ESTATE MARKET REVIEW. Author Bea Hopkins Director Residential DataBank
 ODU-MarketReview2008-FINAL2:ODUMarketReview2005 2/14/08 11:53 AM Page 57 RESIDENTIAL 2008 HAMPTON ROADS REAL ESTATE MARKET REVIEW Acknowledgements Author Bea Hopkins Director Residential DataBank Data
CoStar Industrial Statistics. Y e a r - E n d Brownsville/Harlingen Industrial Market
 CoStar Industrial Statistics Y e a r - E n d 2 0 1 7 Brownsville/Harlingen Industrial Market Brownsville/Harlingen Industrial Market Year-End 2017 Brownsville/Harlingen Table of Contents Table of Contents.................................................................
OFFICE QUICK STATS SUMMARY & OUTLOOK MARKET TRENDS VACANCY & NET ABSORPTION ECONOMIC STATS
 LOS ANGELES SAN GABRIEL VALLEY OFFICE SECOND QUARTER 218 QUICK STATS Direct Vacancy 11.1% Overall Vacancy 11.4% Lease Rate FSG $2.32 Gross Absorption Under Construction MARKET TRENDS Current Quarter 345,68
Inside Business. Old Dominion University Hampton Roads Real Estate Market Review and Forecast. Executive Committee. Programs Committee
 Old Dominion University Hampton Roads Real Estate Market Review and Forecast Presented by: The Center for Real Estate and Economic Development Executive Committee Melody Bobko Ron Bray Craig Cope John
Upstate, SC 1Q16. Industrial Market Report. Industrial. Upstate Economy in 1Q16* Industrial Sector in 1Q16. Trends for 1Q16
 Market Report The industrial market for the Upstate of South Carolina saw continued growth for the first quarter of 2016. While there was a positive net absorption of 1,024,708/SF, the Upstate industrial
3 RD QUARTER 2015 RICHMOND INDUSTRIAL MARKET REPORT
 3 RD QUARTER FORECAST As the U.S. economy continued to show positive economic growth through the third quarter, the Richmond, VA Industrial market saw demand for warehouse and flex properties increase
Sarasota-Manatee, FL 3rd Quarter 2015 INDUSTRIAL. Market Trends COMMERCIAL REAL ESTATE INFORMATION
 Sarasota-Manatee, FL 3rd Quarter 2015 INDUSTRIAL Market Trends COMMERCIAL REAL ESTATE INFORMATION Table of Contents/Methodology of Tracked Set Table of Contents/Methodology of Tracked Set Sarasota-Manatee
OFFICE QUICK STATS SUMMARY & OUTLOOK MARKET TRENDS VACANCY & NET ABSORPTION ECONOMIC STATS
 LOS ANGELES CENTAL/SOUTHEAST OFFICE THIRD QUARTER 218 QUICK STATS Direct Vacancy 14.7% Overall Vacancy 15.2% Lease Rate FSG $3.16 Gross Absorption Under Construction MARKET TRENDS Change from Last Quarter
Homestretch: Office Market Set to Finish Strong
 Research & Forecast Report RENO OFFICE Q3 2016 Homestretch: Office Market Set to Finish Strong >> Vacancy drops significantly the largest drop quarter over quarter in 2016 >> Rental rates are not increasing
GRAND PLAZA BUSINESS PARK
 LEASED INVESTMENT OFFERING RARE 27,200 SQ. FT. ORANGE COUNTY MULTI-TENANT BUSINESS PARK GRAND PLAZA BUSINESS PARK 200-220 S. GRAND AVE., SANTA ANA, CA Exclusively Presented By: Mike Hefner, SIOR Executive
Miami-Dade County Office Market Report 1Q Real Capital Partners Real Estate Services
 -Dade County Office Report 1Q 216 Real Capital Partners Real Estate Services 1Q 216 -Dade County Office Report Overview -Dade County s Vacancy Increases to 1.4% Net Negative (11,64) SF in the Quarter The
MAR KET GLANCE SAN DIEGO OFFICE MARKET REPORT PROPERTY SERVICES DEVELOPMENT INVESTMENT FOURTH QUARTER 2015 PROPERTY SERVICES DEVELOPMENT INVESTMENT
 AT A SAN DIEGO OFFICE MARKET REPORT FOURTH QUARTER 215 AT A NEW SUPPLY PUSHES VACANCY RATES HIGHER San Diego s regional economy has been buzzing and added a net total of 37,8 jobs in the 12 months ending
BOSTON INDUSTRIAL MARKET
 BOSTON INDUSTRIAL MARKET THIRD QUARTER 217 INDSTATUS INLAND FREIGHT Inside... Industrial vacancy drops slightly. Positive absorption seen 11 of the past 13 quarters. Warehouse space in The Boroughs remains
San Francisco Bay Area to Marin, San Francisco, and San Mateo Counties Housing and Economic Outlook
 San Francisco Bay Area to 019 Marin, San Francisco, and San Mateo Counties Housing and Economic Outlook Bay Area Economic Forecast Summary Presented by Pacific Union International, Inc. and John Burns
Market Research. OFFICE First Quarter 2010
 colliers international LAS VEGAS, NV Market Research OFFICE First Quarter 2010 Market Indicators Net Absorption Construction Rental Rate Q1-10 Q2-2010 Projected Clark County Economic Data Jan-10 Jan-09
Second Quarter: Suburban Maryland s Uptick in Leasing has yet to be Realized in Absorption Numbers
 Q2 2013 OFFICE SUBURBAN MARYLAND SUBURBAN MARYLAND MARKET REPORT Second Quarter: Suburban Maryland s Uptick in has yet to be Realized in Numbers Updated May 2012 MARKET INDICATIONS Q2 2013 Q3 2013 (p)
CoStar Industrial Statistics. Y e a r - E n d McAllen/Edinburg/Pharr Industrial Market
 CoStar Industrial Statistics Y e a r - E n d 2 0 1 7 McAllen/Edinburg/Pharr Industrial Market Year-End 2017 McAllen/Edinburg/Pharr Table of Contents Table of Contents.................................................................
Market Overview TAMPA BAY OFFICE THIRD QUARTER
 Market Overview TAMPA BAY OFFICE THIRD QUARTER 29 COLLIERS ARNOLD TAMPA BAY Insights on the Market OFFICE THIRD QUARTER 29 MARKET INDICATORS TAMPA BAY INVENTORY 8,58,612 Sq. Ft. Q3 Q4* OVERALL VACANCY
PARHAM PROFESSIONAL PARK
 20,372 s.f. medical office building value-add and owner occupant oportunity PARHAM PROFESSIONAL PARK PARHAM PROFESSIONAL PARK a Executive Summary THE OPPORTUNITY JLL, as exclusive advisor, is pleased to
MARKET UPDATE Q4 2018
 THE KLABIN COMPANY MARKET UPDATE Q4 2018 SOUTH BAY LOS ANGELES THE KLABIN COMPANY KLABIN.COM A TRADITION OF TRUST HOT TOPICS 1 Full Employment 2 Falling Interest Rates 3 Trade War 4 Lack of Supply 5 Credit
The CoStar Office Report
 The CoStar Office Report T H I R D Q U A R T E R 2 0 1 2 THIRD QUARTER 2012 PHOENIX Table of Contents Table of Contents.................................................................... A Methodology........................................................................
First Quarter 2017 Industrial Market Report. Chicago. Economic Overview
 Chicago Market Facts 5.3% Chicago s unemployment rate continued to trend downward. Recorded at 5.3% as of February 2017. 17 MSF The number of completed projects increased to 5.1 msf and projects currently
WINTER 2016 OMAHA, NEBRASKA INDUSTRIAL MARKET REPORT
 WINTER 2016 OMAHA, NEBRASKA INDUSTRIAL MARKET REPORT By Kevin Stratman OMAHA S THRIVING INDUSTRIAL MARKET SHOWS NO SIGNS OF SLOWING DOWN It is difficult to find one aspect of the Omaha industrial market
NORFOLK COMMERCE PARK PORTFOLIO
 INVESTMENT OFFERING OPPORTUNITY SEPTEMBER 2018 NORFOLK COMMERCE PARK PORTFOLIO NORFOLK,VA AN INSTITUTIONALLY-SIZED OFFICE/FLEX PORTFOLIO Hampton Roads Military Circle Mall JANAF NORTHAMPTON BLVD. PRINCESS
OFFICE QUICK STATS SUMMARY & OUTLOOK MARKET TRENDS VACANCY & NET ABSORPTION ECONOMIC STATS
 VENTURA COUNTY OFFICE THIRD QUARTER 217 QUICK STATS Direct Vacancy 13.9% Overall Vacancy 14.3% Lease Rate FSG $2.25 Gross Absorption Under Construction MARKET TRENDS Current Quarter 34,43 SF 18,112 SF
3 RD QUARTER 2016 RICHMOND INDUSTRIAL MARKET REPORT
 3 RD QUARTER 2016 RICHMOND INDUSTRIAL MARKET REPORT FORECAST The Richmond Industrial market continued trending in the positive direction in the third quarter, with the absorption of over 320,000 square
Year End Deliveries Drive Leasing Activity In the Raleigh-Durham Market
 Research Report RALEIGH-DURHAM OFFICE Q4 2018 Accelerate Success Year End Deliveries Drive Leasing Activity In the Raleigh-Durham Market Kelsey Rogers Senior Research Analyst Raleigh-Durham Market Indicators
CoStar Office Statistics. Y e a r - E n d Portland Office Market
 CoStar Office Statistics Y e a r - E n d 2 0 1 7 Year-End 2017 Portland Table of Contents Table of Contents................................................................. A Methodology......................................................................
ECONOMIC CURRENTS. Vol. 3, Issue 1. THE SOUTH FLORIDA ECONOMIC QUARTERLY Introduction
 ECONOMIC CURRENTS THE SOUTH FLORIDA ECONOMIC QUARTERLY Introduction Economic Currents provides an overview of the South Florida regional economy. The report contains current employment, economic and real
June Published by the Virginia REALTORS Data recorded July 20,
 Data recorded July 20, 2018 1 The Virginia REALTORS association publishes monthly and quarterly home sales reports to provide our members, the media, and real estate-related industries with current data
The Improvement of the Industrial Market
 Research & Forecast Report Long Island industrial MARKET Q2 2015 The Improvement of the Industrial Market Rose Liu Research & Financial Analyst Long Island Takeaways The overall economy on Long Island
BOSTON OFFICE MARKET. Inside... THIRD QUARTER 2017 OFFICESTATUS. »»Boston CBD bounces back. »»Two large companies to move headquarters into Boston.
 BOSTON OFFICE MARKET THIRD QUARTER 2017 OFFICESTATUS BOSTON COMMON BOSTON Inside...»»Boston CBD bounces back.»»two large companies to move headquarters into Boston.»»Natixis Global Asset Management opens
FOURTH QUARTER 2013 LEASING ACTIVITY CONTINUES TO BE BETTER THAN EXPECTED MARYLAND OFFICE MARKET REPORT MARKET SUMMARY ABSORPTION
 Q4 2013 MARYLAND OFFICE MARYLAND OFFICE MARKET REPORT FOURTH QUARTER 2013 LEASING ACTIVITY CONTINUES TO BE BETTER THAN EXPECTED MARKET SUMMARY Updated April 2013 MARKET INDICATORS Q4 2013 Q1 2014* VACANCY
Quick Absorption of Newly Constructed Office Buildings
 Research & Forecast Report CHARLESTON, SC OFFICE Q3 2016 Quick Absorption of Newly Constructed Office Buildings Bryana Mistretta Research Coordinator South Carolina Key Takeaways >> The Interstate 526
Office Market Report OFFICE MARKET REPORT. Boston. The Stevens Group. Ten Post Office Square Boston MA
 OFFICE MARKET REPORT Office Market Report Boston The Stevens Group First Quarter 2017 The Stevens Group Ten Post Office Square Boston MA 02109 617-886-9300 Our Difference Is Your Advantage First Quarter
3 RD QUARTER 2015 RICHMOND RETAIL MARKET REPORT FORECAST 5.7% VACANCY 509,220 SF UNDER CONSTRUCTION 370,165 SF NET ABSORPTION
 3 RD QUARTER 2015 RICHMOND RETAIL MARKET REPORT FORECAST As 2015 winds down, the vacancy rates are approaching an all time low. Retail inventory is down causing an increase in construction with national
Industrial Outlook. An in-depth look at the Louisville industrial market. Analysis includes leasing, sales, construction and employment.
 Industrial Outlook Louisville An in-depth look at the Louisville industrial market. Analysis includes leasing, sales, construction and employment. JLL Research Insight Industrial market quick out of the
The CoStar Industrial Report. Y e a r - E n d St. Louis Industrial Market
 The CoStar Industrial Report Y e a r - E n d 2 0 1 6 Year-End 2016 St. Louis Table of Contents Table of Contents................................................................. A Methodology......................................................................
January 2018 longandfoster.com
 January 218 longandfoster.com 78 -2% % % 7% 1% 3% 4% % 3% 2% 4% 4% 3% 3% 7% 9% 11% 13% 1 1% % - Median Sale Price Percent Change Year/Year 79 $219, $212,25 $225, $237, $226, $232, $24,75 $234,3 $238,625
The past year is better described as a year of
 Omaha Office Market Report Omaha, Nebraska / January 2018 Omaha Office Market Conditions and Trends 2017 Office Market Underperforms Omaha s office market enjoyed a number of significant transactions in
INDUSTRIAL QUICK STATS SUMMARY & OUTLOOK MARKET TRENDS VACANCY & NET ABSORPTION ECONOMIC STATS
 INLAND EMPIRE INDUSTRIAL FOURTH QUARTER 217 QUICK STATS Direct Vacancy 5.1% Overall Vacancy 5.3% Lease Rate NNN $.57 Gross Absorption Under Construction MARKET TRENDS Current Quarter 9,23,744 SF 16,31,563
Office Market Continues to Improve
 Research & Forecast Report LAS VEGAS OFFICE Q3 2016 Office Market Continues to Improve > > Southern Nevada s office market is improving at a steady rate > > Net absorption has been positive in twelve of
San Francisco Bay Area to Santa Clara & San Benito Counties Housing and Economic Outlook
 San Francisco Bay Area to 019 Santa Clara & San Benito Counties Housing and Economic Outlook Bay Area Economic Forecast Summary Presented by Pacific Union International, Inc. and John Burns Real Estate
Chicago s industrial market thrives during the third quarter.
 CHICAGO INDUSTRIAL MARKET MONITOR THIRD QUARTER 2015 Chicago s industrial market thrives during the third quarter. Demand across the Chicago industrial market remains high sending absorption up and vacancy
Washington DC Market Office Report
 Washington DC Market Office Report Market Overview The Office Market The Washington Office Market includes the District of Columbia and adjacent suburban submarkets in Maryland and Virginia. The Washington
Economic growth driving tighter market conditions
 Metro Philadelphia Industrial, 217 Economic growth driving tighter market conditions Net Absorption 1.8 Million sq. ft. Vacancy Rate 5.4% Asking Lease Rate (NNN) $4.35 Development 2.2 Million sq. ft. Figure
Virginia HOME SALES REPORT NOVEMBER 2017
 Virginia HOME SALES REPORT NOVEMBER 2017 Published by the Virginia REALTORS, the advocate for real estate professionals and property owners in Virginia. The Virginia REALTORS association publishes monthly
Metropolitan Milwaukee Office Market Report Third Quarter 2015
 Metropolitan Milwaukee Office Market Report Third Quarter 2015 RETAIL OFFICE INDUSTRIAL LAND INVESTMENT NAI MLG COMMERCIAL 414 347 9400 757 N BROADWAY, SUITE 700, MILWAUKEE, WI 53202 MLGCOMMERCIAL.COM
Page 82: Commercial Versus Residential Heading: 6th line should read: The commercial real estate industry has.
 Errata: Page 82: Commercial Versus Residential Heading: 6th line should read: The commercial real estate industry has. Page 85: Chart title should read as US COMMERCIAL PROPERTY SALES. Page 86: Chart at
Chicago s industrial market thrives during the second quarter.
 Economic Overview CHICAGO INDUSTRIAL MARKET MONITOR SECOND QUARTER 2015 Chicago s industrial market thrives during the second quarter. Demand across the Chicago industrial market remains high sending absorption
Virginia HOME SALES REPORT MAY Published by the Virginia REALTORS, the advocate for real estate professionals and property owners in Virginia.
 Virginia HOME SALES REPORT MAY 2018 Published by the Virginia REALTORS, the advocate for real estate professionals and property owners in Virginia. The Virginia REALTORS association publishes monthly and
The CoStar Office Report
 The CoStar Office Report Y E A R - E N D 2 0 0 8 YEAR-END 2008 PHOENIX Table of Contents Table of Contents.................................................................... A Methodology........................................................................
MARKETBEAT INDUSTRIAL SNAPSHOT
 9.1 4.9 7.3 4.5 7. 1.3 8.1 1.3 1.7.3 msf MARKETBEAT INDUSTRIAL SNAPSHOT LAS VEGAS, NV A Cushman & Wakefield Alliance Research Publication Q1 215 ECONOMIC OVERVIEW The U.S. economy continued to add jobs
CoStar Industrial Statistics. T h i r d Q u a r t e r St. Louis Industrial Market
 CoStar Industrial Statistics T h i r d Q u a r t e r 2 0 1 7 Third Quarter 2017 St. Louis Table of Contents Table of Contents................................................................. A Methodology......................................................................
CoStar Industrial Statistics. Y e a r - E n d Pittsburgh Industrial Market
 CoStar Industrial Statistics Y e a r - E n d 2 0 1 7 Year-End 2017 Pittsburgh Table of Contents Table of Contents................................................................. A Methodology......................................................................
Our Housing Market Turns the Corner
 Our Housing Market Turns the Corner OUR HOUSING MARKET TURNS THE CORNER After a very difficult half decade characterized by falling sales and prices, a surge in foreclosures and many underwater homeowners,
SALT LAKE CITY MARKET
 INDUSTRIAL SALT LAKE CITY MARKET FOURTH QUARTER 2017 Year-End 2017 Salt Lake City Table of Contents Table of Contents................................................................. A Methodology......................................................................
The CoStar Office Report
 The CoStar Office Report Y E A R - E N D 2 0 1 1 YEAR-END 2011 JACKSONVILLE Table of Contents Table of Contents.................................................................... A Methodology........................................................................
Houston s industrial leasing activity decreases 42.7% over the quarter - vacancy rate remains under 5.0%
 Research & Forecast Report HOUSTON INDUSTRIAL Q3 2015 Houston s industrial leasing activity decreases 42.7% over the quarter - vacancy rate remains under 5.0% Lisa Bridges Director of Market Research Houston
CoStar Office Statistics. Y e a r - E n d McAllen/Edinburg/Pharr Office Market
 CoStar Office Statistics Y e a r - E n d 2 0 1 7 McAllen/Edinburg/Pharr Office Market Year-End 2017 McAllen/Edinburg/Pharr Table of Contents Table of Contents.................................................................
MARKET REPORT FIRST QUARTER Market Ripe for Speculative Construction Falling Demand for Obsolete Product Not Indicative of Market Health
 SHENANDOAH MARKET REPORT VALLEY Q1 2015 NORTH SHENANDOAH INDUSTRIAL VALLEY NORTH INDUSTRIAL MARKET REPORT FIRST QUARTER 2015 Market Ripe for Speculative Falling Demand for Obsolete Product Not Indicative
INDUSTRIAL MARKET REPORT. San Antonio. 4th Quarter Q4 Market Trends 2016 by Xceligent, Inc. All Rights Reserved
 INDUSTRIAL MARKET REPORT San Antonio 4th Quarter 2015 Table of Contents/ Methodology of Tracked Set Xceligent is a leading provider of verified commercial real estate information which assists real estate
Leasing strength concentrated in new assets
 MARKETVIEW Midtown Manhattan Office, Q4 216 Leasing strength concentrated in new assets Leasing Activity 4.25 MSF Net Absorption.62 MSF Availability Rate 11.8% Vacancy Rate 7.9% Average Asking Rent $8.18
The CoStar Industrial Report
 The CoStar Industrial Report F I R S T Q U A R T E R 2 0 1 1 Miami-Dade County Industrial Market Miami-Dade County Industrial Market FIRST QUARTER 2011 MIAMI-DADE COUNTY Table of Contents Table of Contents....................................................................
The CoStar Office Report. T h i r d Q u a r t e r Greensboro/Winston-Salem Office Market
 The CoStar Office Report T h i r d Q u a r t e r 2 0 1 4 Greensboro/Winston-Salem Office Market Third Quarter 2014 Greensboro/Winston-Salem Table of Contents Table of Contents.................................................................
Virginia HOME SALES REPORT JULY Published by the Virginia REALTORS, the advocate for real estate professionals and property owners in Virginia.
 Virginia HOME SALES REPORT JULY Published by the Virginia REALTORS, the advocate for real estate professionals and property owners in Virginia. The Virginia REALTORS association publishes monthly and quarterly
KEY TOWER SALE highlights start of 2017
 KEY TOWER SALE highlights start of 2017 Demand for office space in the Greater Cleveland office market remained strong as 2016 wound down and transitioned into the first quarter of 2017. After netting
17th Annual Real Estate Review & Forecast
 2017 17th Annual Real Estate Review & Forecast This Year s Sponsors Member FDIC Construction: Review & Forecast 2017 Page 2 Permits Issued 142 New Commercial Construction Permits issued for all Elkhart
Virginia AUGUST 2018
 Virginia HOME SALES REPORT AUGUST 2018 Published by the Virginia REALTORS, the advocate for real estate professionals and property owners in Virginia. The Virginia REALTORS association publishes monthly
ECONOMIC CURRENTS. Vol. 5 Issue 2 SOUTH FLORIDA ECONOMIC QUARTERLY. Key Findings, 2 nd Quarter, 2015
 ECONOMIC CURRENTS THE Introduction SOUTH FLORIDA ECONOMIC QUARTERLY Economic Currents provides an overview of the South Florida regional economy. The report presents current employment, economic and real
Houston s industrial market continues to expand
 Research & Forecast Report HOUSTON INDUSTRIAL Q1 2017 Houston s industrial market continues to expand Lisa Bridges Director of Market Research Houston During the first quarter of 2017, 1.7M SF of Houston
The Office Market Feels The Heat in Q2
 Research & Forecast Report RENO OFFICE Q2 2017 The Office Market Feels The Heat in Q2 >>All major office submarkets have decreased vacancy and positive absorption this quarter >>The overall vacancy decreased
The CoStar Industrial Report
 The CoStar Industrial Report M I D - Y E A R 2 0 1 0 Houston Industrial Market Houston Industrial Market MID-YEAR 2010 HOUSTON Table of Contents Table of Contents....................................................................
INVESTMENT OFFERINGS CUSHMAN & WAKEFIELD THALHIMER CAPITAL MARKETS GROUP SECOND QUARTER 2016
 CUSHMAN & WAKEFIELD THALHIMER CAPITAL MARKETS GROUP INVESTMENT OFFERINGS SECOND QUARTER 2016 ERIC ROBISON Senior Vice President (804) 697 3475 eric.robison@thalhimer.com CATHARINE SPANGLER Senior Associate
HOUSTON INDUSTRIAL MARKET
 REAL ESTATE OUTLOOK HOUSTON INDUSTRIAL MARKET FIRST QUARTER 217 Industrial Sector Continues Push Forward Flex Market Softening under Pressure from Office Market Availability OV E R V I E W Industrial gains
The CoStar Industrial Report
 The CoStar Industrial Report F I R S T Q U A R T E R 2 0 1 1 Broward County Industrial Market Broward County Industrial Market FIRST QUARTER 2011 BROWARD COUNTY Table of Contents Table of Contents....................................................................
Las Vegas Valley Executive Summary
 ARROYO MARKET SQUARE Las Vegas Valley Executive Summary Retail Market 4th Quarter 2013 THE DISTRICT AT GREEN VALLEY RANCH January 23, 2014 Re: Commercial Real Estate Survey: 4th Quarter, 2013 Dear Reader,
Research. New product, high rents CLEVELAND 1Q16 INDUSTRIAL MARKET. Current Conditions
 New product, high rents The Greater Cleveland industrial market absorbed 556,046 square feet in the first quarter of 2016, the 14th consecutive quarter of positive tenancy gains for the market. The positive
The CoStar Industrial Report
 The CoStar Industrial Report M I D - Y E A R 2 0 1 3 MID-YEAR 2013 COLORADO SPRINGS Table of Contents Table of Contents.................................................................... A Methodology........................................................................
Rite Aid. offering memorandum Halprin Drive - NORFOLK, VIRGINIA ACTUAL PROPERTY
 Rite Aid offering memorandum ACTUAL PROPERTY Buyer must verify the information and bears all risk for any inaccuracies. Marcus & Millichap is a trademark of 2016 Marcus & Millichap. Activity ID: Y0330263