Page 82: Commercial Versus Residential Heading: 6th line should read: The commercial real estate industry has.
|
|
|
- Emil Gibson
- 5 years ago
- Views:
Transcription
 should light blue. Page 89: MultiFamily Properties Chart at bottom: Should read MULTIFAMILY MARKET.")
1 Errata: Page 82: Commercial Versus Residential Heading: 6th line should read: The commercial real estate industry has. Page 85: Chart title should read as US COMMERCIAL PROPERTY SALES. Page 86: Chart at the top: the purple line (above and to the right of Next 5 Years) should light blue. Page 89: MultiFamily Properties Chart at bottom: Should read MULTIFAMILY MARKET. Page 90: 2007 Apartment Sales Chart: 3 rd and 4 th columns should say Units and $/Unit, respectively.


2 ODU-MarketReview2008-FINAL2:ODUMarketReview2005 2/14/08 11:51 AM Page 1 INVESTMENT INDUSTRIAL OFFICE RESIDENTIAL MULTI-FAMILY RETAIL 2008 HAMPTON ROADS REAL ESTATE MARKET REVIEW INVESTMENT RETAIL INDUSTRIAL OFFICE RESIDENTIAL RETAIL INDUSTRIAL OFFICE RESIDENTIAL MULTI-FAMILY MULTI-FAMILY RETAIL INDUSTRIAL OFFICE RESIDENTIAL E. V. WILLIAMS CENTER FOR REAL ESTATE AND ECONOMIC DEVELOPMENT

3 ODU-MarketReview2008-FINAL2:ODUMarketReview2005 2/14/08 11:51 AM Page 2

4 ODU-MarketReview2008-FINAL2:ODUMarketReview2005 2/14/08 11:51 AM Page 3 ASSOCIATE PUBLISHER Mike Herron Inside Business SPECIAL PUBLISHINGS MANAGER Tracy King CONTENTS GRAPHIC DESIGN Pico Design & Illustration AD DESIGN Kristie Mathison DIRECTOR OF SALES Bill Blake ADVERTISING SALES Robin Simmons Tracy King John White Message From The Director CREED Executive Committee CREED Advisory Board Members 2008 Hampton Roads Retail Market Survey 2008 Hampton Roads Industrial Market Survey 2008 Hampton Roads Office Market Survey BUSINESS MANAGER Sylvia Mapp Hampton Roads Residential Market Survey Inside Business 258 Granby Street Norfolk, Virginia Hampton Roads Multi-Family Market Survey 2008 Commercial Real Estate Investment Market Review E. V. Williams Center for Real Estate & Economic Development Data for Old Dominion University E.V. Williams Center for Real Estate and Economic Development Market Survey was collected in the fourth quarter 2007
5 ODU-MarketReview2008-FINAL2:ODUMarketReview2005 2/14/08 11:51 AM Page 4 HAMPTON ROADS Real Estate Market Review
6 ODU-MarketReview2008-FINAL2:ODUMarketReview2005 2/14/08 11:51 AM Page 5 MESSAGE FROM THE DIRECTOR Welcome and thank you for joining us for the 2009 Old Dominion University E. V. Williams Center for Real Estate and Economic Development (CREED) Real Estate Market Review and Forecast. This is our 13th annual market report and review and we sincerely appreciate your continued support. Hampton Roads is officially designated the Virginia Beach Norfolk Newport News VA-NC MSA by the Office of Management and Budget. It encompasses 2,628 square miles, has a population of more than 1.6 million and a workforce of nearly 800,000. Hampton Roads is the fourth largest MSA in the southeast US, comprised of 16 cities and counties in Southeastern Virginia and Northeastern North Carolina, and is the largest consumer market between Washington DC and Atlanta. According to the Old Dominion University Economic Forecasting Project, our region s economy will face a number of challenges in However, while our economic growth is expected to be lower than that of 2007, the region s economic growth will be on par with that of the Commonwealth and is even expected to exceed national economic growth. As the enclosed market reviews suggest, the housing market correction felt by many at the national level, may not be as dramatic for the region s real estate. The bottom line is that our economy continues to expand, which is good news for jobs and good news for the real estate industry. Tom Dillon of Resource Bank has replaced Joyce Hartman as Chair of the Executive Advisory Board Committee. Joyce Hartman has done a wonderful job galvanizing the many committees of the board and successfully raised the leadership bar of the Advisory Board even higher. Fred Facka, a very involved ODU alumnus, has replaced Cliff Moore on our Sponsorship Committee. If you are interested in becoming a member, please contact our Membership Chair, Craig Cope of Liberty Property Trust. CREED membership is one of the most cost effective networking organizations you can ever support. CREED s web site has received over 33,600 page views. As a reminder, please visit by clicking on for the latest information on our region, as well as CREED s activities, members and research. We have a student services section where you can find students who are interested in internships and job opportunities as well as links to other informative web sites. There are many people to thank for their contributions to this report and the annual market review. Our research chair, Brian Dundon and his capable committee deserve many thanks for providing all the quality control of our publication. Stephanie Sanker orchestrates the presentation and reception. Of course, a special thank you to all the volunteers within the real estate and economic development community for providing their expertise and sharing their data. None of this is possible without your commitment. In closing, please note that every effort is made to provide the most accurate information in these reports. If you find an error or have a suggestion on how to improve upon these reports, please contact me with comments. Your continued support is truly appreciated. John R. Lombard, Ph.D. Associate Professor, Department of Urban Studies and Public Administration Director, E. V. Williams Center for Real Estate and Economic Development Old Dominion University College of Business and Public Administration Norfolk, VA Direct line: (757) Center line: (757)

7 ODU-MarketReview2008-FINAL2:ODUMarketReview2005 2/14/08 11:51 AM Page 6
8 ODU-MarketReview2008-FINAL2:ODUMarketReview2005 2/14/08 11:51 AM Page 7 THE 2008 EXECUTIVE COMMITTEE OF THE CREED ADVISORY BOARD The purpose of the Advisory Board is to provide professional expertise in various aspects of real estate and economic development to make recommendations to the University concerning policy and operations of the CREED as well as the University's real estate curriculum. The 2008 officers and members of the Board are as follows: Executive Committee Chair... Tom Dillon Executive Director... John Lombard Vice Chair... Brad Sanford Program Chair... Stephanie Sanker Research Chair... Brian Dundon Membership Chair... Craig Cope Curriculum Co-Chairs... Jon Crunkleton... Brad Sanford Sponsorship Chair... Cliff Moore... Fred Facka By-Laws Chair... Andrew Keeney Past Chair... Joyce Hartman At-Large... Jonathan Guion... Billy King... Aubrey Layne Market Review Committee Industrial... Billy King... Stephanie Sanker Office... Don Crigger Retail... David Machupa Multi-family... Charles Dalton/Real Data Residential... Van Rose Investment... Stephanie Sanker Research/Editorial Committee Brian Dundon Beth Hancock Joy Learn Sandi Prestridge Maureen Rooks Brad Sanford Lane Shea Kristi Sutphin To obtain additional copies of this report, please go to our website: Send to: John R. Lombard, Ph.D, Director E. V. Williams Center for Real Estate and Economic Development Old Dominion University 2089 Constant Hall Norfolk, VA Telephone: (757) jlombard@odu.edu 7
9 ODU-MarketReview2008-FINAL2:ODUMarketReview2005 2/14/08 11:51 AM Page 8 CREED ADVISORY BOARD MEMBERS J. Scott Adams CB Richard Ellis Tom Atherton Mid Eastern Builders, Inc. Jerry Banagan Office of Real Estate Assessor Nancy S. Brookes Global Tower Partners Stewart H. Buckle, III The Morgan Real Estate Group Rick E. Burnell Atlantic Commercial Real Estate Services, Inc. M. Albert Carmichael Harvey Lindsay Commercial Real Estate Lawrence J. Colorito, Jr., MAI Axial Advisory Group, LLC Jeff Cooper Cooper Realty, Inc. Craig A. Cope Liberty Property Trust Ann K. Crenshaw Kaufman & Canoles Don Crigger, CCIM GVA Advantis Real Estate Services Co. Jon R. Crunkleton Old Dominion University Kim S. Curtis Southern Trust Mortgage Company Cecil V. Cutchins Olympia Development Corporation William G. Darden Hearndon Construction George C. Davis West Neck Community Association Laura B. de Graaf Commercial Real Estate Banking, Bank of America Robert L. Dewey Wilcox & Savage, P.C. Tom M. Dillon Resource Bank Michael Divaris Divaris Real Estate, Inc. Helen Dragas The Dragas Companies Brian Dundon Dundon & Associates Frederick D. Facka Smith Barney Sandra W. Ferebee GSH Residential Sales Corporation Joel T. Flax Goodman & Company, LLP Howard E. Gordon Williams Mullen Hofheimer Nusbaum, P.C. Dennis W. Gruelle Appraisal Consultation Group Jonathan S. Guion, SIOR Sperry Van Ness Elizabeth Hancock Office of the Real Estate Assessor Russell G. Hanson, Jr. Atlantic Mortgage & Investment Co. Carl Hardee Lawson Realty Corporation Warren D. Harris Virginia Beach Economic Development John C. Harry John C. Harry, Inc. Joyce Hartman Southside Building Services Dorcas T. Helfant-Browning DTH Properties, LLC Virginia P. Henderson, MAI Commercial First Appraisers, LLC Cherie James Wall, Einhorn, & Chernitzer Terry Johnson Abbitt Realty Maria Kattmann City of Suffolk E. Andrew Keeney Kaufman & Canoles R. I. King, II Thalhimer/Cushman & Wakefield William E. King, SIOR Harvey Lindsay April Koleszar Koleszar Properties, Inc. Barry M. Kornblau Summit Realty Group, Inc. Aubrey L. Layne, Jr. Great Atlantic Management, LLC Tyler H. Leinbach Meredith Construction Co., Inc. John R. Lewis, II ECS Mid-Atlantic, LLC HAMPTON ROADS Real Estate Market Review

10 ODU-MarketReview2008-FINAL2:ODUMarketReview2005 2/14/08 11:51 AM Page 9 Harvey L. Lindsay, Jr. Harvey Lindsay Susan Long-Molnar Managing Communications Consulting Mike Mausteller Advantis Real Estate Services Co. Michael W. McCabe Harvey Lindsay Michael D. McOsker, CCIM Thalhimer/Cushman & Wakefield Michael A. Nice George Nice & Sons, Inc. Thomas A. O'Grady City of Suffolk, Economic Development James N. Owens, CCIM Harvey Lindsay Commercial Real Estate Robert L. Phillips, Jr. Thalhimer/Cushman & Wakefield Victor L. Pickett Grandbridge Real Estate Capital LLC Sandra Prestridge City of Norfolk, Economic Development Chris Read CB Richard Ellis F. Craig Read Read Commerical John C. Richards, Jr. CB Richard Ellis/Melody & Co. Thomas E. Robinson Robinson Development Group Maureen G. Rooks Thalhimer/Cushman & Wakefield Jim V. Rose Rose & Womble Realty Co.,LLC Robert J. Ruhl City of Va Beach, Economic Development Bradley R. Sanford, MAI Dominion Realty Advisors, Inc. Stephanie Sanker GVA Advantis Paula J. Shendow First American Title Insurance Company Ted M. Sherman Continental Properties Corp. Kenneth Sisk, P.E. The Vision Group Anthony W. Smith Robinson Development Group Robert M. Stanton Stanton Partners, Inc. Jeremy R. Starkey Monarch Capital LLC Deborah Stearns GVA Advantis Daniel R. Stegall Daniel Richard Stegall, A Professional Law Corporation Kristine R. Sutphin City of Portsmouth Dept. of Econ. Dev. Leo Sutton Historic Ventures, LLC Michael Sykes Bank of America - Real Estate Banking Group Robert M. Thornton, CRE, CCIM, SIOR Thalhimer/Cushman & Wakefield Richard B. Thurmond William E. Wood & Associates Stewart Tyler, ASA Right of Way Acquisitions and Appraisals, Inc. George D. Vick, III Harvey Lindsay Edward W. Ware Norfolk Redevelopment and Housing Authority H. Mac Weaver, II Wells Fargo Real Estate Group Edward M. Williams William E. Wood & Associates Julia L. Wilson G. L. Wilson Building Co. F. Blair Wimbush Norfolk Southern Corporation Peter E. Winters, Jr. SunTrust Bank Roderick S. Woolard City of Norfolk, Economic Development 9
11 ODU-MarketReview2008-FINAL2:ODUMarketReview2005 2/14/08 11:51 AM Page 10


12 ODU-MarketReview2008-FINAL2:ODUMarketReview2005 2/14/08 11:51 AM Page 11 RETAIL 2008 HAMPTON ROADS REAL ESTATE MARKET REVIEW Acknowledgements Author David Machupa Thalhimer/Cushman & Wakefield Data Analysis/Layout David Chapman Old Dominion University Financial Support The E. V. Williams Center for Real Estate for Real Estate and Economic Development (CREED) functions and reports are funded by donations from individuals, organizations and the CREED Advisory Board. Disclosure The data used for this report was provided by agents and owners of the surveyed properties. The data is deemed reliable; however, neither Old Dominion University, the E. V. Williams Center for Real Estate for Real Estate and Economic Development, nor Thalhimer/ Cushman & Wakefield makes any representation or warranty as to its accuracy. 11
, which is commonly known as Hampton Roads.")

13 ODU-MarketReview2008-FINAL2:ODUMarketReview2005 2/14/08 11:51 AM Page RETAIL General Overview This report analyzes the 2007 retail real estate conditions within the Virginia Beach Norfolk Newport News, Virginia Metropolitan Statistical Area (the MSA ), which is commonly known as Hampton Roads. It provides supply, vacancy, construction, absorption and rent data for the MSA to provide a comparison of the data for Southside and Peninsula areas of Hampton Roads for specific submarkets and product types. The survey includes properties from the Southside of Hampton Roads located in the cities of Chesapeake, Norfolk, Portsmouth, Smithfield, Suffolk and Virginia Beach. Properties are also included from the Peninsula of Hampton Roads in Gloucester, Hampton, Newport News, Poquoson, Williamsburg and York County. This survey is believed to be the most comprehensive analysis of retail real estate trends in the MSA. The report includes information on all retail product types including regional malls, freestanding buildings and strip centers of various classifications. The scope of the report also includes a summary of new retail construction, an analysis of absorption, and a review of retail investment sales that have occurred in the region. METHODOLOGY This survey gathered information about strip shopping centers and regional malls located in the MSA that were generally 30,000 square feet in size or larger. Additionally, information on retail-oriented freestanding buildings at least 23,000 square feet and freestanding buildings that contained furniture stores, discounters, grocery stores or category killer retailers that met the established size criteria were included in the survey. Automotive uses and buildings containing downtown storefronts were not included. Although available retail space in many submarkets (e.g., Ghent) is best described as a collection of small specialty shops, storefronts or freestanding buildings, practical limitations dictated that the focus of the survey be on larger product types. The survey data was collected between October 2007 and January Questionnaires were mailed to owners, leasing agents and property managers responsible for retail properties meeting the selection criteria. Direct contact was utilized as a follow-up to the mailing to encourage participation. Information on square footage for freestanding buildings was obtained from building owners, tax records, store managers and retail real estate representatives. Sales information was obtained from property owners, real estate agents, appraisers, and real estate assessors. HAMPTON ROADS Real Estate Market Review
14 ODU-MarketReview2008-FINAL2:ODUMarketReview2005 2/14/08 11:51 AM Page 13 DEFINITIONS OF TERMS Asking Rates: The market rate per square foot of a retail property (excluding freestanding buildings and malls), exclusive of additional rents that may be paid under a triple net lease. Interpretation of average retail rates in different product types and submarkets should be viewed cautiously given the tremendous variability in rates for like products and for properties located within the same submarket. Factors such as visibility, co-tenancy and accessibility are some of the many sources of variation in market rates which should be considered. Big Boxes: Contiguous retail space that is at least 23,000 square feet and located in any one of the identified product types. Retailers occupying big boxes include, but are not limited to, the following: category killers, specialty stores, discounters, furniture stores, grocery stores and theaters. Bowling alleys, automotive uses, roller rinks and iceskating rinks were not included. CAM: Common Area Maintenance Product Types: Properties were classified according to one of the following nine retail product types. The International Council of Shopping Centers defined the first six categories. Three additional categories were included to accurately categorize the remaining properties. Neighborhood Center Community Center Fashion/Specialty Center Power Center Theme Festival Center Outlet Center Freestanding Mall Other 30,000 to 150,000 square feet; supermarket anchored 100,000 to 350,000 square feet; discount department store, supermarket or drug store anchored 80,000 to 250,000 square feet; fashion anchored 250,000 to 600,000 square feet; category killer, home improvement and discount department store anchored 80,000 to 250,000 square feet; restaurants, entertainment anchored 50,000 to 400,000 square feet; manufacturer s outlet store anchored Individual building not considered a shopping center Shopping center with area designed for pedestrian use only Any center that does not fit into a typical category Regional Mall Node: Submarket anchored by regional mall. Small Shop: In-line retail space usually less than 10,000 square feet located in a multi-tenanted shopping center. Submarkets: Hampton Roads was divided into thirty-six retail submarkets (twenty-six Southside submarkets and ten Peninsula submarkets) which reflected general concentrations, pockets or corridors of retail product type. Geographical boundaries of the retail submarkets were influenced by density of existing retail product, physical or geographical obstacles, existing transportation networks, municipal boundaries, population concentrations and retailers perceptions of the MSA. Final determination of specific boundaries of each submarket was made by a subcommittee of the Real Estate Board comprised of retail real estate professionals who are actively involved in the MSA. Also highlighted were specific submarkets that are anchored by regional malls. A map which identifies the general location of each submarket is included in the centerfold of this report RETAIL Triple Net Lease: Type of lease under which a tenant pays its pro-rata share of real estate taxes, insurance and common area maintenance. 13
15 ODU-MarketReview2008-FINAL2:ODUMarketReview2005 2/14/08 11:51 AM Page RETAIL YEAR IN REVIEW During 2006, vacancy rates hit the lowest levels since the inception of the CREED market survey while small shop rental rates reached the highest levels in the market. In 2007, the Hampton Roads retail market reached another milestone: for the first time in CREED history the retail market surpassed 50 million square feet of product all the while witnessing strong growth, a slight increase in the vacancy rates and increase in the average rental rate. New and existing retailers searched for locations within established markets and followed the residential growth pattern creating hotbeds of activity in submarkets such as Northern Suffolk, Williamsburg and Southern Chesapeake. Several large retail development projects opened in 2007, including Landstown Commons in Virginia Beach, The Marquis in Williamsburg, Bennett s Creek in Suffolk, and Cahoon Commons in Chesapeake. In 2007, the Hampton Roads retail market reached another milestone: for the first time in CREED history the retail market surpassed 50 million square feet of product all the while witnessing strong growth, a slight increase in the vacancy rates and increase in the average rental rate. Mixed use projects consisting of retail, office and residential continue to attract Tenants. The Virginia Beach Town Center saw the Westin Hotel and the Sandler Center for the Performing Arts open in late 2007 as well as retailers Johnston & Murphy and McCormick and Schmick. The City Center at Oyster Point in Newport News added Banana Republic; The Towne Place in Greenbrier opened with Chicos and Jos A. Banks; Settlers Market in Williamsburg began clearing the site and thus far is anchored by Trader Joes, Books A Million, Michaels and Home Goods. All that remains of Coliseum Mall is Macy s. The site has been scrapped and a new J C Penny s has been built and will be joined by Target and other retailers. These new retailers and the new residential units will reemerge as The Peninsula Towne Center. Grocery Stores continued to expand in Hampton Roads. Farm Fresh opened a new gourmet concept in downtown Norfolk called the Marketplace at Harbor Heights, as well as a traditional store at Bennett s Creek in Suffolk. Food Lion converted 8 stores to its higher end Bloom concept and 10 stores to the value focused Bottom Dollar and continue to look for opportunities to grow all three banners. In Portsmouth, Food Lion relocated from Triangle Shopping Center to a larger unit at Williams Court and is in the process of doing the same with Airline Center. Wal-Mart has entered Hampton Roads with its Neighborhood Market concept and is under construction with its first store in Norfolk. Harris Teeter anchored the new Indian Lakes Crossing and will also anchor the planned developments of Brennaman Farms in Virginia Beach and Harbourview Marketplace in Suffolk. Trader Joes has signed a lease at Settlers Market in Williamsburg and Farm Fresh is opening the Marketplace concept on High Street in Williamsburg. Additional higher end grocers continue to explore the Hampton Roads market for opportunities. The Big Boxes continued expansion in Hampton Roads. Target led the way at Red Mill Walk in Virginia Beach. Lowes purchased the former Giant Square shopping center and will blade the site for a new freestanding unit. Kohl s opened in Landstown Commons in Virginia Beach and is under construction in Harborview East in Suffolk. Best Buy also HAMPTON ROADS Real Estate Market Review

16 ODU-MarketReview2008-FINAL2:ODUMarketReview2005 2/14/08 11:51 AM Page 15 opened at Landstown and signed a lease at Marquis in Williamsburg. J C Penny opened at the Peninsula Towne Center, Circuit City rolled out a new prototype at Janaf in Norfolk with their former location being back filled by Petco. Bed, Bath and Beyond opened at Landstown and is under construction at Harborview East. Gold s Gym opened in the Ghent section of Norfolk and Barnes and Noble opened a multi-level location within MacArthur Center. HAMPTON ROADS MARKET SURVEY The Hampton Roads retail market contained approximately 50,219,239 square feet of gross leasable area ( GLA ) in 396 properties. The US Census Bureau indicates the population of Hampton Roads is approximately 1.7 Million resulting in a 29.5 square feet of retail supply per person. Certain methodological differences (e.g., the inclusion of freestanding buildings and malls in this survey) make it difficult to compare per capita supply in the MSA to a national average statistic. Hampton Roads consists of two markets, the Southside and Peninsula. The Southside market has approximately 33,086,160 square feet, roughly 66% of the total square footage in the market, in 263 properties. The average asking rent for small shop space increased by $.58 over 2006 to $16.68 triple net. In 2007, there was an increase in the vacancy rate by.91% to 6.70% as new construction added 1,038,291 square feet to the Southside market. The Peninsula also experienced some exciting changes this past year. The 133 properties on the Peninsula that were surveyed combined for 17,133,079 square feet of product. The average asking price of small shop space increased $.24 to $15.41 per square foot triple net. The vacancy rate also slightly increased by.68% to 9.44 % with 1,009,000 square feet of new construction added to the Peninsula market. Overall both markets performed well. The average rental rate for small shop space in Hampton Roads has increased to $16.05 triple net. While the market saw an increase in the overall vacancy rate, some of that can be attributed to the new projects that came on line in the 4th quarter rather than excessive turnover of small shop tenants as anchor tenants continue to look for opportunities in the market RETAIL 15

17 ODU-MarketReview2008-FINAL2:ODUMarketReview2005 2/14/08 11:51 AM Page RETAIL MARKET OVERVIEW NEW NUMBER OF PROPERTIES GLA IN SF VACANT SF % VACANT CONSTRUCTION IN SF OCCUPIED IN SF ABSORPTION IN SF 2008 Southside ,086,160 2,215, % 1,038,291 30,870, ,596 Peninsula ,133,079 1,617, % 1,009,000 15,515, ,485 Total ,219,239 3,833, % 2,047,291 46,386, , Southside ,407,761 1,876, % 1,552,392 30,531,085 1,741,962 Peninsula ,895,155 1,480, % 1,042,451 15,414, ,788 Total ,302,916 3,356, % 2,594,843 45,945,974 2,318, Southside ,852,210 2,063, % 593,520 28,789,123 1,280,869 Peninsula ,337,458 1,499, % 618,179 14,838, ,097 Total ,189,668 3,562, % 1,211,699 43,627,224 1,967, Southside ,184,395 2,676, % 271,610 27,508, ,736 Peninsula ,799,778 1,648, % 185,000 14,151, ,338 Total ,984,173 4,324, % 456,610 41,659, , Southside ,336,266 3,169, % 419,458 27,166, ,138 Peninsula ,094,161 2,027, % 330,000 14,066, ,018 Total ,430,427 5,197, % 749,458 41,233, , Southside ,180,691 3,433, % 574,400 26,747, ,167 Peninsula ,546,085 1,891, % 676,000 13,654, ,008 Total ,726,776 5,324, % 1,250,400 40,402,046 1,467, Southside ,760,443 3,548, % 828,800 26,212,213 1,185,818 Peninsula ,906,530 2,183, % 202,750 12,722, ,563 Total ,666,973 5,732, % 1,031,550 38,934,871 1,428, Southside ,436,515 3,760, % 918,100 25,676,428 (158,181) Peninsula ,477,970 1,997, % 212,229 12,480, ,115 Total ,914,485 5,757, % 1,130,329 38,156,523 (11,066) 2000 Southside ,816,383 2,933, % 2,064,727 25,883,089 1,344,209 Peninsula ,249,617 2,012, % 758,370 13,236, ,785 Total ,066,000 4,945, % 2,823,097 39,120,069 1,636, Southside ,089,939 2,551, % 1,414,805 24,538,880 1,961,927 Peninsula ,548,482 1,604, % 1,253,342 12,944,195 1,592,805 Total ,638,421 4,155, % 2,668,147 37,483,075 3,554, Southside ,463,588 2,886, % No Data 22,576,953 No Data Peninsula ,952,845 1,601, % No Data 11,351,390 No Data Total ,416,433 4,488, % No Data 33,928,343 No Data HAMPTON ROADS Real Estate Market Review
18 ODU-MarketReview2008-FINAL2:ODUMarketReview2005 2/14/08 11:52 AM Page 17 RETAIL SUBMARKETS SOUTHSIDE SUBMARKETS There were 26 retail submarkets on the Southside this year. The average size of the submarkets was 1,272,544 square feet. The largest Southside markets were Greenbrier and Military Highway with combined square footage of 7,462,699 square feet. The Southside has six regional mall nodes totaling 15,424,221 square feet. The range of vacancy rates in the Southside submarkets can be seen in the table below. New construction on the Southside totaled 1,038,291 square feet. SOUTHSIDE BY SUBMARKET AVERAGE NUMBER OF SMALL SHOP PROPERTIES GLA IN SF VACANT SF % VACANT RATE PSF Bay Front 4 213,821 15, % $18.33 Birdneck/Oceanfront 4 191, % $11.50 Campostella 6 332,904 78, % $13.56 Chesapeake Square 9 2,137, , % $15.67 Churchland-Portsmouth/Harborview 14 1,034,680 86, % $13.92 Dam Neck 8 1,367, , % $21.63 Downtown 3 1,281,338 35, % $13.75 Ghent 9 406,857 79, % $16.79 Great Bridge 18 1,355,948 94, % $17.69 Greenbrier/Battlefield Boulevard 23 4,140, , % $20.00 Hilltop/Great Neck 12 1,534,848 9, % $21.36 Holland/Green Run 9 1,027,904 28, % $14.69 Indian River/College Park (Including Chesapeake) 4 482,309 50, % $13.25 Kempsville 11 1,183,576 33, % $16.80 Little Creek Road /Wards Corner/Ocean View 18 1,903, , % $14.27 Little Neck 10 1,375, ,, % $17.57 Lynnhaven Road 1 12, % $12.00 Lynnhaven Road (Virginia Beach Boulevard To Holland Road) 7 1,807, , % $21.50 Middle Portsmouth 14 1,549,231 67, % $14.14 Military Highway/Janaf 16 3,322, , % $14.49 Newtown 9 480,420 79, % $13.00 ODU 1 36,500 1, % $22.00 Pembroke 24 2,735, , % $16.92 Princess Anne Road (From Kempsville Road To Holland Road) 13 1,876, , % $18.41 Smithfield 4 256,764 6, % $15.67 Suffolk 12 1,038,148 65, % $17.56 Total ,086,160 2,215, % $ RETAIL 17
19 ODU-MarketReview2008-FINAL2:ODUMarketReview2005 2/14/08 11:52 AM Page RETAIL PENINSULA SUBMARKETS There were 10 retail submarkets on Peninsula with an average size of 1,713,307 square feet. The two largest Peninsula submarkets are now Patrick Henry and Williamsburg. While the Patrick Henry submarket is anchored by a regional mall, Williamsburg has no regional mall and we are seeing a variety of mixed use projects in this submarket. The Peninsula welcomed 1,009,000 square feet of new construction in Vacancy rates fluctuated in the various submarkets while overall average rental rates rose on the Peninsula. PENINSULA BY SUBMARKET AVERAGE NUMBER OF SMALL SHOP PROPERTIES GLA IN SF VACANT SF % VACANT RATE PSF Coliseum Central 14 2,510, , % $16.75 Denbigh 14 1,458, , % $13.83 Foxhill/Buckroe/East Mercury 7 717,555 43, % $13.80 Gloucester 9 1,069, , % $13.50 Hampton Misc 2 118,972 19, % $10.75 Newmarket/Main 13 1,408, , % $10.37 Patrick Henry/Oyster Point/Kiln Creek 32 4,464, , % $17.81 Poquoson 2 108,521 12, % $15.00 Williamsburg 30 4,386, , % $19.18 York County ,227 49, % $13.28 Total ,133,079 1,617, % $15.41 RETAIL PRODUCT TYPE SOUTHSIDE SUBMARKETS The Neighborhood Center remains the predominant product type with 148 properties with over 11 million square feet of GLA. The Community centers comprised over 10 million square feet with both product types showing increases in the average rental rate. The highest rents in non-mall properties were achieved in the Fashion / Specialty centers which also had the highest CAM Charges. HAMPTON ROADS Real Estate Market Review
20 ODU-MarketReview2008-FINAL2:ODUMarketReview2005 2/14/08 11:52 AM Page 19 TOTAL RETAIL PRODUCT BY TYPE NEW AVERAGE NUMBER OF CONSTRUCTION SMALL SHOP AVERAGE PROPERTIES GLA IN SF IN SF VACANT SF % VACANT RATE PSF CAM PSF Neighborhood Center ,337, , , % $15.25 $2.32 Community Center 56 10,077, ,000 1,255, % $16.41 $2.26 Fashion/Specialty Center 10 1,351, ,318 79, % $23.38 $3.93 Power Center 29 10,385,808 1,581, , % $21.65 $2.89 Theme Festival Center 1 100, % No data No data Outlet Center 1 349, % No data No data Other 65 2,393, , % $16.04 $2.70 Freestanding 77 7,839, , % $7.63 $1.69 Mall 9 6,382, , % $15.00 No data Total ,219,239 2,047,291 3,833, % $16.27 $2.47 SOUTHSIDE BY TYPE NEW AVERAGE NUMBER OF CONSTRUCTION SMALL SHOP AVERAGE PROPERTIES GLA IN SF IN SF VACANT SF % VACANT RATE PSF CAM PSF Neighborhood Center 103 8,008, , , % $15.56 $2.41 Community Center 37 6,316, , , % $16.40 $2.33 Fashion/Specialty Center 8 952, ,318 38, % $23.38 $3.93 Power Center 19 6,083, , , % $22.23 $3.14 Theme Festival Center 1 100, % No data No data Other 44 1,534, , % $16.54 $2.85 Freestanding 44 4,531, , % $6.00 $2.50 Mall 7 5,558, , % $15.00 No data Total ,086,160 1,038,291 2,215, % $16.68 $2.61 PENINSULA BY TYPE NEW AVERAGE NUMBER OF CONSTRUCTION SMALL SHOP AVERAGE PROPERTIES GLA IN SF IN SF VACANT SF % VACANT RATE PSF CAM PSF Neighborhood Center 45 3,329, , % $14.55 $2.11 Community Center 19 3,760, , % $16.42 $2.12 Fashion/Specialty Center 2 399, , % No data No data Power Center 10 4,302,183 1,009, , % $20.67 $2.49 Outlet Center 1 349, % No data No data Other , , % $15.10 $2.41 Freestanding 33 3,308, , % $8.17 $1.42 Mall 2 824, , % No data No data Total ,133,079 1,009,000 1,617, % $15.41 $ RETAIL 19
21 ODU-MarketReview2008-FINAL2:ODUMarketReview2005 2/14/08 11:52 AM Page 20
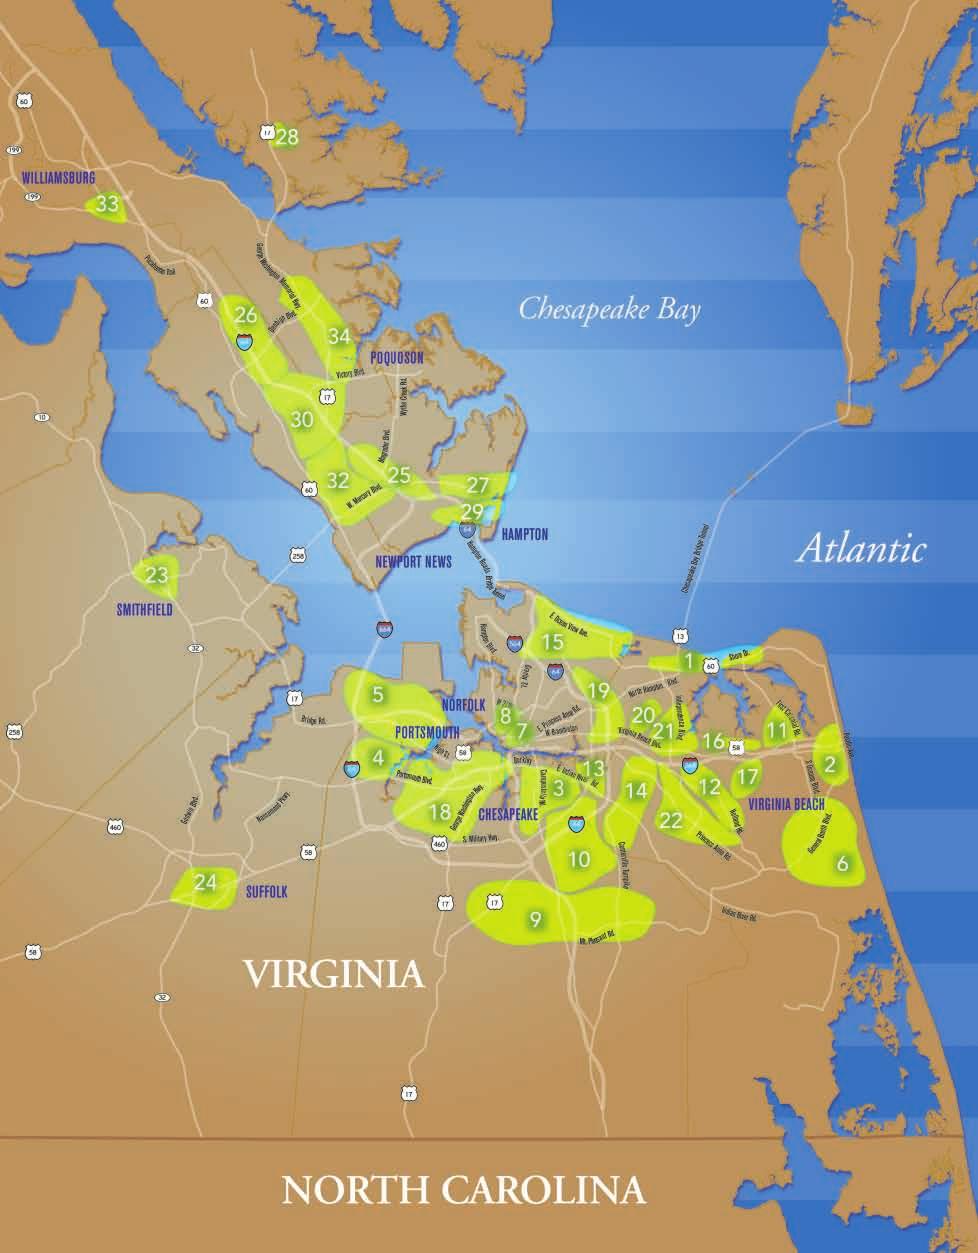
22 ODU-MarketReview2008-FINAL2:ODUMarketReview2005 2/14/08 11:52 AM Page 21 RETAIL SUBMARKETS Southside 1 Bayfront 2 Birdneck/Oceanfront 3 Campostella 4 Chesapeake Square 5 Churchland/Harbourview 6 Dam Neck 7 Downtown Norfolk 8 Ghent 9 Great Bridge 10 Greenbrier/Battlefield Boulevard 11 Hilltop/Great Neck 12 Holland/Green Run 13 Indian River/College Park 14 Kempsville 15 Little Creek Road/Wards Corner 16 Little Neck 17 Lynnhaven 18 Middle Portsmouth 19 Military Highway/Janaf 20 Newtown 21 Pembroke 22 Princess Anne 23 Smithfield 24 Suffolk Peninsula 25 Coliseum Central 26 Denbigh 27 Foxhill/Buckroe 28 Gloucester 29 Hampton Miscellaneous 30 Patrick Henry 31 Poquoson 32 Newmarket/Main 33 Williamsburg 34 York County 2008 RETAIL 21

23 ODU-MarketReview2008-FINAL2:ODUMarketReview2005 2/14/08 11:52 AM Page RETAIL BIG BOX VACANCY Big box vacancy in Hampton Roads declined to 1,775,648 square feet for This number represents 46 % of the total retail vacancy in the market. On the Southside, big box vacancies of 948,288 square feet represent 43% of the vacant space available while on the Peninsula 51% of the retail vacancy is attributed to the 827,360 square feet of big box product on the market. VACANCY BY SUBMARKET Southside 1,316,595 1,607,323 2,073,115 2,207,416 2,220,935 1,906,391 1,513,523 1,142, , ,288 Peninsula 864,474 1,232,255 1,328,841 1,435,489 1,407,021 1,556,029 1,141, , , ,360 TOTAL 1,950,441 2,839,578 3,401,956 3,642,905 3,627,956 3,462,420 2,654,730 2,124,582 1,777,050 1,775,648 BIG BOX VACANCY 4,000,000 3,500,000 Vacant Square Feet 3,000,000 2,500,000 2,000,000 1,500,000 1,000, ,000 0 Southside Peninsula TOTAL HAMPTON ROADS Real Estate Market Review
 2. Country Club Shops John Wood (Complete) 3.")
24 ODU-MarketReview2008-FINAL2:ODUMarketReview2005 2/14/08 11:52 AM Page 23 NEW DEVELOPMENT Hampton Roads continued to expand in 2007 with a fair amount of growth and redevelopment taking place on the Peninsula. A sampling of the change Hampton Roads witnessed this year is as follows: Chesapeake 1. Cahoon Commons Crescent Development (Complete) 2. Country Club Shops John Wood (Complete) 3. The Shops at Chesapeake Square Stanton Partners (Planned) Hampton 1. The Peninsula Town Center Mall Properties (Under Construction) Newport News 1. The Village of Stoney Run The Breeden Company (Complete) 2. The Marketplace S.L. Nusbaum Realty Co (Planned) Suffolk 1. Harbourview East Landonomics (Under Construction) 2. The Marketplace at Harbourview Hemisphere Development (Planned) 3. Bennett s Creek Stanton Partners / RDG (Complete) 4. Obici Place RDG (Planned) 5. The Shops at Godwin Marketplace S.L. Nusbaum/ Brinkley (Planned) 6. Nansemond Crossing Spectrum Development (Planned) Virginia Beach 1. Redmill Walk Ellis Gibson Development (Under Construction) 2. Landstown Commons The Goodman Company (Complete) 3. Indian Lakes Crossing Armada Hoffler (Complete) 4. The Shops at Town Center S.L. Nusbaum (Planned) Williamsburg 1. Settlers Market AIG (Under Construction) 2. High Street Rossland (Under Construction) 3. Quarterpath Crossing S.L. Nusbaum (Planned) 4. Marquis Premier ( Phase 1 Open) 2008 RETAIL 23
25 ODU-MarketReview2008-FINAL2:ODUMarketReview2005 2/14/08 11:52 AM Page RETAIL The following is a list of the properties included in this year s survey listed by submarket with a code representing the type of property. The GLA of the property is also listed. A Neighborhood Center F Outlet Center B Community Center G Other C Fashion/Specialty Center H Freestanding D Power Center I Mall E Theme Festival SOUTHSIDE BAY FRONT Bayside I & II A 79,397 Cape Henry Plaza A 58,424 Kroger H 47,000 Marina Shores G 29,000 BIRDNECK / OCEANFRONT Birdneck SC A 65,460 Farm Fresh H 29,296 Harris Teeter H 48,000 Linkhorn Shops A 48,899 CAMPOSTELLA Atlantic Commons A 63,393 Bainbridge Marketplace A 46,444 Campostella Corner A 43,375 George Washington Commons A 44,942 Holly Point SC A 65,321 Southgate Plaza A 69,429 CHESAPEAKE SQUARE BJ's H 115,660 Chesapeake Center B 296,832 Chesapeake Square Mall I 800,000 Chesp. Sq. D 225,000 Food Chesp. Sq. H 45,000 Home Depot H 130,060 Lowes H 115,000 Taylor Road Plaza A 60,000 Wal-Mart Supercenter / Sam's Club H 350,000 CHURCHLAND / PORTSMOUTH / HARBOURVIEW Academy Crossing G 45,483 Churchland Blvd SC (Formerly Farmco Plaza) G 52,966 Churchland Place G 21,000 Churchland SC A 149,741 Churchland Square A 64,989 Grand H 30,000 Harbourview Station East D 217,308 Harbourview Station West D 83,007 Marketcenter at Harbourview A 65,750 Marketplace Square G 12,461 Poplar Hill Plaza B 102,326 Sterling Commons A 75,660 Towne Point Square A 58,989 Western Branch CrossingLowes (Churchland) H 55,000 DAM NECK Courthouse Walk A 21,600 Dam Neck Crossing B 138,571 Dam Neck Square A 67,917 General Booth Plaza A 73,320 Red Mill Commons D 586,575 Red Mill Walk B 240,000 Sandbridge SC A 66,800 Strawbridge Marketplace A 172,429 DOWNTOWN Church Street Crossing A 51,000 MacArthur Center Mall I 1,100,000 Waterside Festival Marketplace I 130,338 GHENT 21st Street Pavilion G 21,000 Center Shops A 129,966 Colley Village A 44,585 Farm Fresh H 40,000 Ghent Place G 13,000 Harris Teeter H 27,000 Palace Shops I, II C 71,794 Palace Station G 38,000 The Corner Shops G 21,512 GREAT BRIDGE Cahoon Commons D 215,000 Cedar Lakes Center A 35,396 Centerville Crossing A 55,000 Crossings at Deep Creek A 68,970 Dominion Marketplace A 73,103 Dominion Plaza SC A 63,733 Former Winn Dixie H 50,000 Glenwood Square A 73,859 Great Bridge SC A 158,000 Hanbury Village A 100,560 Harbor Watch Shoppes G 21,505 Las Gaviotas A 82,000 Millwood Plaza G 16,969 Mt. Pleasant Shopping Center A 100,000 Mt. Pleasant Village A 39,970 Wilson Village A 52,500 Woodford Shoppes B 9,760 Woodford Square B 139,623 GREENBRIER / BATTLEFIELD BOULEVARD Battlefield Marketplace G 30,000 Chesapeake Crossing B 287,679 Crossways Center I & Eden Way Shops D 438,725 Crossways II D 152,686 Edinburgh Commons North D 195,111 Edinburgh East D 133,000 Gainsborough Square A 88,862 Greenbrier Mall I 809,017 Greenbrier Market Center D 487,580 Greenbrier South SC A 97,500 Home Depot H 130,060 K-Mart / OfficeMax H 165,000 Knell's Ridge Square G 40,000 Lowes H 114,000 Orchard Square A 88,910 Greenbrier A 83,711 Regal Cinemas H 60,763 The Shoppes at Greenbrier G 40,000 Townplace at Greenbrier C 127,109 Village Square G 15,000 Volvo Parkway SC G 41,874 Walmart Way Crossing G 80,160 Wal-Mart / Sam's Club / Kohl's D 433,821 HILLTOP / GREAT NECK Great Neck Square A 93,887 Great Neck Village A 73,836 Hilltop East C 100,000 Hilltop North B 202,511 Hilltop Plaza B 152,025 Hilltop Square B 270,093 Hilltop West G 60,000 La Promenade C 63,280 Marketplace at Hilltop C 113,000 Regency Hilltop B 236,549 Renaissance Place G 47,667 Target H 122,000 HOLLAND / GREEN RUN Auburn Place A 44,846 Chimney Hill B 207,175 Green Run Square A 60,000 Holland Plaza SC A 165,867 Holland Windsor Crossing (Super K-Mart) B 237,000 HAMPTON ROADS Real Estate Market Review
26 ODU-MarketReview2008-FINAL2:ODUMarketReview2005 2/14/08 11:52 AM Page 25 Lowes H 125,323 Lynnhaven Green A 50,838 Shipps Corner A 63,355 Timberlake SC A 73,500 INDIAN RIVER / COLLEGE PARK College Park I & II B 181,902 Indian River Plaza B 126,017 Indian River SC A 123,752 Tidewater Plaza A 50,638 KEMPSVILLE Arrowhead Plaza A 97,006 Fairfield SC B 239,763 Kemps Corner Shoppes G 25,929 Kemps River Center A 62,507 Kemps River Crossing B 245,268 Kempsville Crossing A 111,394 Kempsville Plaza A 60,778 Parkway Marketplace A 26,602 Providence Square SC A 135,915 University Shoppes A 26,100 Woods Corner A 152,314 LITTLE CREEK ROAD / WARDS CORNER / OCEAN VIEW Ames / Kroger B 140,568 Dollar Tree Shopping Center A 51,415 East Beach Shoppes A 63,000 Farm Fresh - Little Creek H 66,000 Glenwood Shoppes A 53,255 Little Creek East SC B 202,338 Little Creek Square A 82,300 Meadowbrook S C G 27,260 Mid-Town SC A 75,768 Mid-Way SC G 31,000 Ocean View SC A 73,658 Roosevelt Gardens SC A 109,175 Southern SC B 258,035 Suburban Park B 127,450 Super Walmart H 225,000 Tidewater I & II SC B 126,212 Wards Corner Strip A 61,540 Wedgewood SC A 130,000 LITTLE NECK Ames Plaza B 177,549 Birchwood SC A 358,635 Home Depot H 130,060 Kroger H 45,000 London Bridge Plaza B 120,000 Lowes H 160,000 Lynnhaven Convenience G 36,100 Lynnhaven Shopping Center B 140,000 Princess Anne Plaza West C 77,558 Regatta Bay Shops G 60,000 Sam's Club Plaza D 248,604 LYNNHAVEN ROAD Lynnhaven Crossing G 55,550 Lynnhaven East B 97,303 Lynnhaven Mall I 1,293,100 Lynnhaven North B 176,254 Lynnshores Shopping Center G 12,692 Lynnway Place G 30,213 Parkway Plaza G 42,000 Walmart H 113,112 MIDDLE PORTSMOUTH Afton SC A 106,500 Airline Center A 69,000 Airline Plaza A 99,549 Elmhurst Square A 45,842 Gilmerton Square G 43,236 Manor Commerce Center G 67,060 Manor Village G 14,573 Olde Towne Market Place A 38,200 Rodman SC A 45,000 Super Walmart H 200,000 Triangle SC G 82,430 Victory Crossing D 445,758 Victory West Shopping Center A 167,102 Williams Court B 214,739 MILITARY HIGHWAY / JANAF Best Square B 140,030 Broad Creek SC D 205,417 Bromley SC A 55,330 CostCo H 110,000 Dump / Mega Office G 115,854 Farm Fresh H 60,000 Food Lion #170 H 41,000 Grand Outlet H 35,000 Janaf D 878,381 Lowes H 115,000 Military Crossing D 195,003 Military Triangle G 10,061 Northampton Business Center (former 5760 North Hampton Blvd.) G 80,000 Super K-Mart & Shoppes B 200,000 Super Walmart H 224,513 The Military Circle I 856,542 NEWTOWN Cypress Plaza SC A 59,012 Cypress Point A 117,958 Diamond Springs Shoppes G 24,000 Newpointe SC A 92,978 Newtown Baker Crossing A 91,687 Newtown Center G 19,876 Newtown Convenience Center G 19,800 Thomas Corner SC G 23,557 Weblin Square G 31,552 ODU University Village G 36,500 PEMBROKE Aragona SC A 69,700 Best Buy H 45,000 Bloom Brothers Furniture H 58,000 Circuit City H 38,414 Collins Square A 111,370 Columbus Village East A 63,000 Columbus Village Entertainment Center E 100,000 Dean Plaza (Former HQ) D 140,000 Giant Square B 150,000 Goodwill H 34,000 Haverty's H 55,000 Haygood SC B 160,129 Haynes H 228,000 Hunter's Mill Shoppes G 22,827 Loehmann's Plaza C 139,380 Northern Super Center G 36,588 Pembroke East B 27,200 Pembroke Mall I 570,000 Pembroke Meadows SC A 81,592 Pembroke Place B 165,000 Pembroke Plaza G 34,900 Roomstore H 50,000 The Town Center of Virginia Beach C 260,000 Value City H 95,000 PRINCESS ANNE ROAD Courthouse Marketplace A 122,000 Home Depot H 260,000 Kempsville Marketplace A 71,460 Landstown Commons D 500,000 Lynnhaven Square S C G 22,933 Parkway SC A 64,820 Pleasant Valley Marketplace A 86,107 Princess Anne Marketplace B 209,500 Princess One SC A 84,725 Salem Crossing D 392,407 Salem Lakes SC A 37,087 Woodtide SC A 25,500 SMITHFIELD Cypress Run SC G 25,000 Eagle Harbor A 77,400 Smithfield Plaza B 89,120 Smithfield Square A 65,244 25
27 ODU-MarketReview2008-FINAL2:ODUMarketReview2005 2/14/08 11:52 AM Page RETAIL SUFFOLK Bennett s Creek Crossing A 114,300 Bennett s Creek Food Lion A 64,544 Holland Plaza A 69,345 Kensington Square A 60,000 Lowes H 150,000 Oak Ridge A 38,700 Suffolk Plaza B 174,221 Suffolk Plaza West A 60,000 Suffolk SC B 85,803 Suffolk Specialty Shops G 15,200 Suffolk Village SC G 11,875 Walmart Super Center H 194,160 PENINSULA COLISEUM CENTRAL Coliseum Corner A 49,267 Coliseum Crossing B 221,004 Coliseum Marketplace A 86,681 Coliseum Specialty Shops G 15,026 Coliseum Square G 45,041 Hampton Towne Centre D 376,100 Hampton Woods A 89,092 Home Depot H 130,060 Riverdale Plaza D 280,133 Sports Authority H 40,000 Target H 122,000 The Power Plant D 621,150 Todd Center & Todd Lane Shops B 242,000 Walmart Super Center H 193,316 DENBIGH Beaconsdale SC A 28,000 Denbigh Crossing A 145,000 Denbigh Speciality Shops G 24,504 Denbigh Village Centre B 334,299 Ferguson Center G 118,000 Former Hills Denbigh H 86,589 Kmart H 115,854 Lee Hall Plaza A 36,000 Newport Crossing B 200,088 Richneck Shopping Center A 63,925 Stoneybrook Shopping Center A 75,000 Turnberry Crossing A 53,775 Village Square A 40,000 Warwick Denbigh SC B 137,925 FOXHILL / BUCKROE / EAST MERCURY Buckroe SC A 89,594 Farm Fresh Phoebus H 39,000 Kmart H 94,500 Langley Square A 146,434 Nickerson A 70,450 Nickerson Plaza A 83,849 Willow Oaks Village Square S.C. B 193,728 GLOUCESTER 6513 Market Drive H 92,273 Food Lion H 40,000 Hayes Plaza SC A 52,651 Hayes SC A 100,000 Home Depot H 100,000 Lowe's H 125,000 Walmart Super Center H 220,000 Winn Dixie Marketplace B 165,000 York River Crossing B 175,000 HAMPTON MISCELLANEOUS Kecoughtan SC A 64,237 The Shops at Hampton Harbor G 54,645 NEWMARKET / MAIN 4113 W Mercury Blvd. H 49, W. Mercury Blvd. H 28,080 Brentwood SC A 53,600 Dresden SC G 35,000 Forest Park Square B 150,000 Francisco Village A 55,865 Hampton Plaza B 173,199 Hilton SC A 74,000 Midway Shopping Center G 58,780 Newmarket South D 387,221 Newmarket B 117,377 Warwick Center A 150,000 Warwick Village A 75,400 PATRICK HENRY / OYSTER POINT / KILN CREEK Bayberry Village A 60,147 Best Buy Building H 135,000 City Center C 149,851 Commonweatlh Center G 30,279 Fairway Plaza G 37,950 Glendale SC G 30,000 Grand Furniture H 35,000 Harris Teeter H 52,334 Haverty's H 45,000 Haynes H 170,000 Hidenwood SC A 108,000 Jefferson Commons D 400,000 Jefferson Greene G 57,430 Jefferson Plaza D 178,200 Kroger H 55,000 Lowes H 120,000 Market Oyster Point A 69,660 Newport Marketplace D 450,000 Newport Square B 184,126 Office Depot H 30,122 Oyster Point Plaza A 73,197 Oyster Point Square A 83,089 Patrick Henry Mall I 644,000 Patrick Henry Place A 96,391 Sam's Club H 133,880 The Shoppes at Oyster Point G 30,000 Victory Kiln Creek A 61,000 Village Kiln Creek B 263,000 Villages of Kiln Creek G 45,300 Walmart Super Center H 201,146 Yoder Plaza SC D 435,000 POQUOSON Poquoson SC A 57,458 Wythe Creek SC A 51,063 WILLIAMSBURG Colony Square A 66,806 Ewell Station A 68,048 Festival Marketplace G 16,216 Gallery Shops G 18,187 Governor's Green SC A 100,000 Home Depot H 130,000 James York Plaza B 138,677 Kingsgate Green B 138,348 Lowes H 163,000 Marketplace Shoppes G 26,626 Marketplace Shopping Center G 30,000 Monticello Marketplace B 300,000 Monticello SC A 82,000 Newtown C 250,000 Norge Crossing H 52,000 Olde Towne SC G 30,000 Prime Outlets F 349,927 Staples H 37,400 The Marquis (Phase I) D 1,000,000 Village Shops at Kingsmill G 82,200 Wal-Mart SuperCenter H 210,000 Williamsburg Crossing A 149,933 Williamsburg Farm Fresh A 79,188 Williamsburg Marketcenter B 120,920 Williamsburg Outlet Mall I 180,000 Williamsburg Pavillion Shops G 50,000 Williamsburg SC I & II B 251,000 Williamsburg Towne and Cnty A 49,802 WindsorMeade Marketplace D 174,379 Yankee Candle H 42,000 YORK COUNTY Grafton SC A 32,000 Heritage Square A 86,000 Kiln Creek Center A 45,700 Yorktown A 73,050 Patriots Square A 47,231 Shady Banks SC A 57,654 Wal-Mart SuperCenter H 220,000 Washington Square & Shops B 254,972 York Square A 48,720 Yorkshire Downs G 23,900 HAMPTON ROADS Real Estate Market Review


28 ODU-MarketReview2008-FINAL2:ODUMarketReview2005 2/14/08 11:52 AM Page 27 27


29 ODU-MarketReview2008-FINAL2:ODUMarketReview2005 2/14/08 12:32 PM Page 28 HAMPTON ROADS Real Estate Market Review


30 ODU-MarketReview2008-FINAL2:ODUMarketReview2005 2/14/08 11:53 AM Page 29 INDUSTRIAL 2008 HAMPTON ROADS REAL ESTATE MARKET REVIEW Acknowledgements Author Billy King, SIOR Data Preparation Stephanie Sanker, CCIM Survey Coordination Clay Culbreth, CCIM, SIOR Reporters Greenbrier Bainbridge/S. Elizabeth River Area Cavalier Industrial Park Norfolk Commerce Park & Central Norfolk Area Norfolk Industrial Park West Side/Midtown Norfolk Area Lynnhaven Greenwich/Cleveland Streets Area Airport Industrial Park Portsmouth Suffolk Isle of Wight Copeland/Lower Peninsula Oyster Point/Middle Peninsula Area Oakland/Upper Peninsula Area Williamsburg Extended Area Ron Biesecker & Christine Kaempfe Chip Worley Pat Mumey & Scott Wermers Worth Remick Charles Dickinson Billy King Brian Baker Bobby Beasley Bobby Beasley Abe Ellis Bill Throne Billy King Clay Culbreth Bobby Phillips Trip Ferguson Bobby Phillips 29
 that is also known as Hampton Roads. It provides inventory, vacancy, rent, sale and other data for the MSA.")

31 ODU-MarketReview2008-FINAL2:ODUMarketReview2005 2/14/08 11:53 AM Page INDUSTRIAL General Overview This report analyzes the 2007 industrial real estate conditions within the Virginia Beach- Norfolk-Newport News, VA-NC Metropolitan Statistical Area (the MSA ) that is also known as Hampton Roads. It provides inventory, vacancy, rent, sale and other data for the MSA. The survey includes properties in the cities of Chesapeake, Hampton, Newport News, Norfolk, Poquoson, Portsmouth, Suffolk, Virginia Beach, and Williamsburg, plus the counties of Gloucester, James City, York and Isle of Wight. METHODOLOGY This survey includes the following types of properties: Office-warehouse, industrial and shop facilities of 5,000 square feet or greater, although some facilities of less than 5,000 square feet may be included. Properties must have less than 80% office space to be included in the ODU survey. Both owner-occupied and leased properties are included. Owner-occupied is defined as a property that is 100% occupied by a business that is the same as or is related to the owner of the building. All properties that are available and are listed for sale or lease regardless of whether they are occupied, unless they are strictly available for sale as an investment property. For example, a property that is available for sale and is currently occupied on a short-term lease is included. All properties that have commenced construction (foundations installed minimum). The survey excludes the following types of properties: Land Warehouse or shop facilities on shipyard properties Warehouse or other industrial facilities on federal government property (e.g., military installations) Industrial facilities on government property (e.g. Norfolk International Terminal or Newport News Marine Terminal) Functional submarket delineations are determined with some regard to city boundaries but boundaries are not determinative. The entire market is divided into 16 submarkets defined by industrial building concentrations, the transportation network, and pertinent physical features. The area map included in this report provides a location key for reference. The E. V. Williams Center for Real Estate and Economic Development (CREED) at Old Dominion University has been tracking the inventory of the Hampton Roads industrial market since The results of this year s survey (collected during the 4th quarter of 2007) indicate that the Hampton Roads industrial market currently encompasses 103,794,954 total square feet of space located in 2,743 build- HAMPTON ROADS Real Estate Market Review

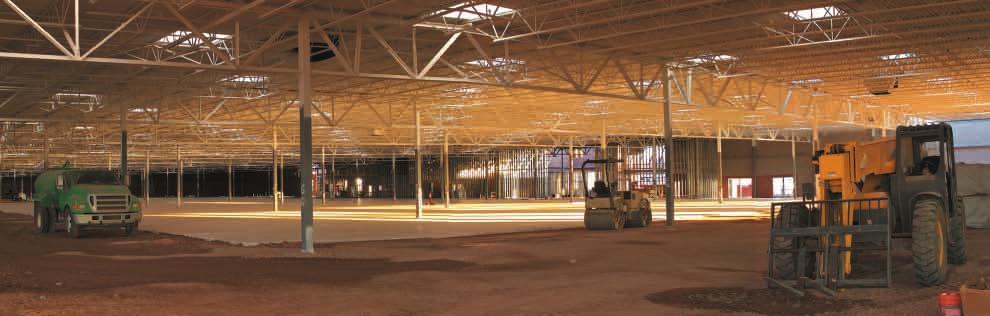
32 ODU-MarketReview2008-FINAL2:ODUMarketReview2005 2/14/08 11:53 AM Page 31 Bridgeway III ings throughout the region. This is an increase of 3,557,444 square feet, or 3.55% from last year s survey. The increase is primarily due to expansions of existing buildings and new construction started in the marketplace. As a counter to these increases there was an elimination of eight (8) buildings (in the Westside Norfolk submarket) that were demolished or converted to alternative uses (multi-family, mini-storage and retail). HAMPTON ROADS OVERVIEW This year, Hampton Roads vacancy rate increased to 10.51% from 5.87% in last year s survey. The vacancy rate, as measured in the beginning of 2007, was the lowest rate that has been recorded for the area since the survey started in This year's reported vacancy rate of 10.51% is 79% higher than last year s rate, and is historically a high rate for our market. The vacancy rate was up in 14 out of 16 submarkets covered. Total Hampton Roads market absorption this year was a negative 1.85% or -1,745,376 square feet, as compared with a positive 2.80% (2,566,823 square feet) in Absorption was negative on both the Peninsula (-332,455 square feet) and Southside (-1,412,910 square feet). Last year s report termed 2006 a commitment year for the Hampton Roads Industrial Market because of 1) the start up and substantial completion of seven major speculative distribution projects and 2) the continuing escalation of lease rates in the vast majority of the market that was adequately served by its existing space. The studied market year of 2007, might be termed an impact year for the Market. First, eight additional new projects commenced or finished and, thus, became available inventory in our market. These projects are as follows: Square Footage 1. Logistics America (NYK) by ProLogis 130,00 2. West Park Two by Taurus/High Street Equity Advisors 180, Bay Warehouse Addition by First Potomac 100, Virginia Regional Commerce Center by The Regional Companies 400, Agiao Phase II (Oceana South) 90, Virginia Commerce Center by MacDonald Development 385, Oceana South One by Commonwealth Development 81, Enterchange Two by Devon Group/Schneider National 470,200 Total New Projects Commenced or Completed in ,836,920 Seven new projects listed in 2006 survey 1,723,100 Total new projects last 2 years 3,560,020 Second, as a backdrop to all this additional space being available to our market, there were few new large lease deals that were concluded in Samples of these are as follows: Guardian Moving and Storage - 138,000 s.f. in the Gateway Manufacturing building, Hampton Tire Centers 31,500 s.f. in Bridgeway III, Suffolk Northrop Grumman 240,000 s.f. in Enterchange II, Hampton Lockheed Martin 30,000 s.f. at 1408 Stephanie Way, Chesapeake 2008 INDUSTRIAL 31


33 ODU-MarketReview2008-FINAL2:ODUMarketReview2005 2/14/08 11:53 AM Page INDUSTRIAL Virginia Commerce Center in Suffolk There were many other significant deals that were tracking in the market last year, but did not get concluded. Two major factors negatively impacted the demand element of our Hampton Roads Leasing Market in 2007: 1. The well documented success of the ports of Savannah and Charleston to the detriment of Port of Hampton Roads in capturing certain major import distribution accounts; 2. Nationally, Warehouse and Distribution Centers experienced a significant slowdown in demand, translating into a stall into improving vacancy trend that this sector had enjoyed since the economy emerged from recession.several years ago : Hugh Kelly, CRE as quoted in SIOR Professional Report Vol. 66, No. 4, Fall Third, the closing of the Ford F-150 Truck Plant in the Berkley section of Norfolk dampened the market. In addition to the loss of Ford employees and industrial activities at the 2,300,000 square foot plant, at least 6 suppliers, including TDS, Visteon and Johnson Controls were in various stages of closing their operations in These suppliers accounted for 601,000 square feet of give back space. Some of this space had been re-absorbed by the end of Despite these conditions, sales prices of user (owner occupied) properties continued a very strong pace in HAMPTON ROADS INDUSTRIAL MARKET VACANCY RATE 15% 12% (As of the first month of the year.) % % % 0% HAMPTON ROADS Real Estate Market Review
34 ODU-MarketReview2008-FINAL2:ODUMarketReview2005 2/14/08 11:53 AM Page 33 SALES OVERVIEW The market continued to show elevated prices even as compared to strong years in 2005 and Industrial building sales prices predominated in the $40 per square feet (p.s.f.) to $70 p.s.f. range. There were several sales that were finalized in the higher $100 - $140 p.s.f. range, as a result of either high-end or park locations, developed yard or surplus land area. Available modern industrial buildings for purchase remained very difficult to find in 2007 in all size ranges. REPRESENTATIVE BUILDING SALES TRANSACTIONS Date Location Sq. Ft. Price $/SF Acres 3/07 Truck Enterprises Cavalier 12,750 $3,200,000 $ /07 Blackhawk Industries 47,378 $3,250,000 $ /07 Cavalier Marine Supply 39,500 $1,300,000 $ /07 Ethan Allen 13,950 $1,650,000 $ /07 Lee s Tires 50,582 $1,850,000 $ /07 Johnson Controls 69,018 6,825,000 $ ODU HAMPTON ROADS INDUSTRIAL SURVEY SUBMARKET TOTALS Bldgs Submarket City Surveyed Total s.f. Vacancy s.f. Vacancy % Greenbrier Area Chesapeake 274 8,342, , % Bainbridge/S. Elizabeth River Area Chesapeake 133 5,464, , % Cavalier Industrial Park Area Chesapeake 179 5,959, , % Norfolk Commerce Park/Central Norfolk Area Norfolk 142 7,076,668 2,609, % Norfolk Industrial Park Area Norfolk ,196, , % West Side/Midtown Norfolk Area Norfolk 261 6,441, , % Lynnhaven Area Virginia Beach 253 7,449, , % Greenwich/Cleveland Streets Area Virginia Beach 127 3,141,006 60, % Airport Industrial Park Area Virginia Beach 70 3,684, , % City of Portsmouth Portsmouth 154 4,004, , % City of Suffolk Suffolk ,535,116 1,477, % Isle of Wight Isle of Wight 27 2,788, , % Southside Totals 2,074 76,085,095 8,099, % Copeland/Lower Peninsula Area Peninsula 363 9,983,484 2,103, % Oyster Point/Middle Peninsula Area Peninsula 149 4,109,297 67, % Oakland/Upper Peninsula Area Peninsula 97 4,611, , % Williamsburg Extended Area Peninsula 60 9,005, , % Peninsula Totals ,709,859 2,807, % Totals 2, ,794,954 10,906, % 2008 INDUSTRIAL 33
35 ODU-MarketReview2008-FINAL2:ODUMarketReview2005 2/14/08 11:53 AM Page INDUSTRIAL LEASING OVERVIEW Industrial Leasing Highlights and Comparable Leases for 2007 included the following: Noland Company HVAC Division lease of 818 Blue Crab Road, Newport News 17,000 square feet for 120 months at $7.25 p.s.f., NNN (Oyster Point Park). Guardian Moving and Storage Co. lease at former Gateway Manufacturing facility, Hampton 134,589 square feet on a 95 month lease (cancellable based on contract) at $4.35 p.s.f., NNN. Northrop Grumman (Newport News Ship) anchor tenant lease of Enterchange Hampton II 240,000 square feet at $4.90 p.s.f. for 180 months. City Electric Company lease of 7,500 square feet at 5875 Adderly Street, Norfolk - $6.25 p.s.f., Modified Net for 60 months. Loomis Fargo and Co. lease of 13,750 square feet at Woodlake Distribution Center Chesapeake - $7.00 p.s.f., NNN for 120 months. RENTS FOR AVAILABLE SPACES BY SIZE RANGE Begin Size (s.f.) > 5,000 $6.34 $7.16 $6.95 $7.30 $7.75 $7.85 $7.90 5,000-20,000 $4.46 $5.80 $5.89 $6.20 $6.50 $6.75 $ ,000-40,000 $4.35 $4.99 $5.21 $5.45 $5.75 $5.85 $ ,000-60,000 $4.15 $4.13 $4.44 $4.75 $4.95 $5.00 $4.75 > 60,000 $3.24 $3.43 $3.15 $4.00 $4.30 $4.35 $4.25 PERCENTAGE OF AVAILABLE SPACES BY SIZE RANGE Begin Size (s.f.) > 5,000 30% 15% 32% 25% 30% 25% 20% 5,000-20,000 40% 52% 44% 40% 42% 30% 15% 20,000-40,000 15% 18% 12% 15% 13% 15% 20% 40,000-60,000 9% 8% 7% 8% 6% 10% 20% > 60,000 6% 7% 5% 12% 9% 20% 25% HAMPTON ROADS Real Estate Market Review
36 ODU-MarketReview2008-FINAL2:ODUMarketReview2005 2/14/08 11:53 AM Page 35 Average market asking rents for small and medium size spaces (less than 30,000 square feet) continued to rise during Rates for larger spaces continued to be higher than other outside markets, but the rates for larger spaces have been moderated this year by the availability of the aforementioned new, high bay projects. This trend and the negative rent impact on larger spaces should continue in 2008 and, perhaps, 2009, depending on how demand develops. The variance between asking lease rates and final negotiated rates, which are highly dependent on the age and location of a particular building, continued to be between 0% and 15% in 2007 with the wider ranges applying to the larger, new facilities. Five new projects were announced to begin in 2008 but whether they, in fact, start depend largely on market demand. LAND SALES Industrial land sale highlights for 2007 included: 22 acres in Greenmount Industrial Park (James City County) sold to user for $45,454 per acre. 6 acres to Earthcore Industries in Cavalier Industrial Park from the City of Chesapeake at $107,500 per acre ($645,000). Chesapeake Deep Water Terminal 81 acres (useable) to International Bio-Energy Virginia Real Estate, LLC for intended development of Ethanol plant - $6,075,000 ($75,000 per acre). 240 acre Britt site on Route 58 in Suffolk sold to McDonald Development for $8,100,000 ($33,750/acre). INVESTMENT SALES Overall, 2007 was a very active year for industrial investment sales, as compared with the quieter 2006 year. Among the investment projects trading hands were the following: MB Handy property - a 60,000 square foot, 2 tenant property including General Electric Supply in the Norfolk Industrial Park, sold to Helmsman Properties; The 62,000 square foot Greenbrier Distribution Center (Jamad II), in Greenbrier sold to a local investor; The 146,000 square foot Airport Industrial Center II property, anchored by Federal Express, sold by Krieder-Schockey to Cambridge-Hanover. The 41,500 square foot Carrier-Mid Atlantic property in Norfolk Industrial Park, sold to a local investor. FORECAST Our forecast for 2008, based on the above, is as follows: 1. Continued strong investor and prospect interest in Hampton Roads because of its diversified industrial base, including defense, port-related distribution and industrial supplies. 2. Strength in all market areas, with the exception of the larger, high-bay warehouse segment, which will experience intense competition for quality tenants and, thus, lower than expected rental rates for new space and the potential flattening of rates for older, less modern space INDUSTRIAL 35

37 ODU-MarketReview2008-FINAL2:ODUMarketReview2005 2/14/08 11:53 AM Page 36
38 ODU-MarketReview2008-FINAL2:ODUMarketReview2005 2/14/08 11:53 AM Page 37 INDUSTRIAL SUBMARKETS Southside Suffolk Portsmouth West Norfolk Central Norfolk Cavalier Bainbridge Norfolk Industrial Park Airport Industrial Park Greenbrier Cleveland Lynnhaven Peninsula Copeland Oakland Oyster Point Williamsburg Extended 2008 INDUSTRIAL 37

39 ODU-MarketReview2008-FINAL2:ODUMarketReview2005 2/14/08 11:53 AM Page 38 HAMPTON ROADS Real Estate Market Review


40 ODU-MarketReview2008-FINAL2:ODUMarketReview2005 2/14/08 11:53 AM Page 39 OFFICE 2008 HAMPTON ROADS REAL ESTATE MARKET REVIEW Acknowledgements Author Donald R. Crigger, CCIM Senior Director, Office Properties GVA Advantis Norfolk, VA Christopher Bendit Director, Office Properties GVA Advantis Newport News, VA Financial Support The E. V. Williams Center for Real Estate and Economic Development (CREED) functions and reports are funded by donations from individuals, organizations and the CREED advisory board. 39


41 ODU-MarketReview2008-FINAL2:ODUMarketReview2005 2/14/08 11:53 AM Page OFFICE General Overview I n 2007, the Hampton Roads Office Market paralleled the statistical performance of the overall national market which continued a modest growth pattern. While stable, this growth curve flattened last year compared with previous years as net absorption was only slightly positive. Historically, 500,000 square feet (s.f.) has been the market average net absorption in the Hampton Roads market and our region managed barely more than 100,000 s.f. last year on the heels of a below average 300,000 square foot in With nearly 600,000 s.f. of new office product delivering during 2007, this minimal absorption led to a nearly 2% increase in overall market vacancy. While still healthy in the 10% range, it marks the end of several consecutive years of decreasing vacancy. This trend of increasing vacancy is This trend of increasing vacancy is likely to continue into likely to continue into 2008 as speculative projects under 2008 as speculative projects under construction are more construction are more prevalent than in previous years. prevalent than in previous years. Fortunately, these projects Fortunately, these projects are spread across the region and should be appropriately sized to meet the demand in are spread across the region and should be appropriately selected submarkets. sized to meet the demand in selected submarkets. In a region bounded by water, land scarcity is continuing to drive prices of the choicest remaining property sites even higher. Combining this with higher construction costs is leading to unprecedented asking rental rates for new projects both in the suburbs and downtown. In most cases, new construction rents are more than 20% higher than rates in existing class A buildings. HAMPTON ROADS Real Estate Market Review

42 ODU-MarketReview2008-FINAL2:ODUMarketReview2005 2/14/08 11:53 AM Page 41 DEFINITIONS OF TERMS BUILDING CLASSES CLASS A: Most prestigious buildings competing for premium office users with rents above the average for the area. Buildings have high quality standard finishes, state of the art systems, exceptional accessibility and a definite market presence. In addition, Class A Buildings in this survey: Blackhawk building in Norfolk 1. Command rents at the highest level. 2. Were generally constructed since 1996 if low rise or since 1980 if high rise. 3. Have interior appointments and standards representative of the top of the market. 4. Are multi-story buildings with high quality exterior materials and landscaping. 5. Are professionally managed and maintained. 6. Are in an excellent location within the submarket. 7. Offer building amenities such as food service, conference room, fitness center. CLASS B: Buildings competing for a wide range of users with rents in the average range for the area. Building finishes are fair to good for the area and systems are adequate, but the building does not compete with Class A at the same price. In addition, Class B buildings in this survey: 1. Achieve rents generally $2-$3 below Class A buildings. 2. Are primarily low-rise and flex-type properties, except in Downtown locations. 3. Were generally constructed prior to Have good quality interior appointments and standards. 5. Are professionally managed and maintained. 6. Have good quality exterior materials. CLASS C: Buildings competing for tenants requiring functional space at rents below the average for the area. In addition, Class C buildings in this survey: 1. Have rents at the lowest range of competitive office space; generally $4-5 below Class A buildings. 2. Were constructed prior to 1986 and modestly maintained. 3. Have systems and interior appointments that are dated. 4. May not provide handicap access or meet other current building core requirements due to grandfather code provisions. REGION Hampton Roads: The Hampton Roads region comprises the cities of Chesapeake, Norfolk, Portsmouth, Suffolk, Virginia Beach, and Isle of Wight County to the South; the cities of Hampton, Newport News, Poquoson, and Williamsburg and the counties of Gloucester, James City, Mathews, and York to the north on the Virginia Peninsula; and Currituck County, North Carolina. Office properties in Chesapeake, Norfolk, Portsmouth, Suffolk, Virginia Beach, Hampton, Newport News, James City County, and York County are included in this report OFFICE 41
43 ODU-MarketReview2008-FINAL2:ODUMarketReview2005 2/14/08 11:53 AM Page OFFICE Table I MULTI-TENANT CLASS A, B, AND C DOWNTOWN NORFOLK By Class CLASS A CLASS B CLASS C AVG AVG AVG NLA % Vac. RENT NLA % VAC RENT NLA % VAC RENT Downtown Norfolk 1,690, % $ ,507, % $ , % $11.40 SOUTHSIDE By Class CLASS A CLASS B CLASS C AVG AVG AVG NLA % Vac. RENT NLA % VAC RENT NLA % VAC RENT Airport/Northampton 176, % $ , % $ , % $11.00 Central Norfolk N/A N/A N/A 877, % $ , % $11.84 Chesapeake/Greenbrier 997, % $ ,036, % $ , % $11.50 Corporate Landing N/A N/A N/A 69, % $15.93 N/A N/A N/A Hilltop/Oceanfront 132, % $ , % $ , % $9.00 Kempsville 122, % $ , % $13.05 N/A N/A N/A Little Neck N/A N/A N/A 502, % $ , % $11.76 Lynnhaven 865, % $ , % $13.78 N/A N/A N/A Military Circle 216, % $ , % $ , % $10.85 Newtown/Witchduck 1,089, % $ , % $ , % $10.00 Pembroke/ Central Business District 984, % $ ,204, % $ , % $10.33 Portsmouth 88, % $ , % $ , % $11.00 Suffolk 408, % $ , % $16.65 N/A N/A N/A PENINSULA By Class CLASS A CLASS B CLASS C AVG AVG AVG NLA % Vac. RENT NLA % VAC RENT NLA % VAC RENT Coliseum Central 211, % $ , % $10.64 N/A N/A N/A Downtown Hampton 158, % $ , % $ , % $10.00 Downtown Newport News N/A N/A N/A 135, % $14.00 N/A N/A N/A Hampton Roads Center 557, % $ , % $ , % $9.81 Newmarket N/A N/A N/A 670, % $ , % $13.50 Oyster Point 1,477, % $ ,135, % $ , % $14.13 Suburban Newport News N/A N/A N/A 236, % $ , % $7.43 Williamsburg/James City/ York County 262, % $ , % $14.05 N/A N/A N/A HAMPTON ROADS Real Estate Market Review

44 ODU-MarketReview2008-FINAL2:ODUMarketReview2005 2/14/08 11:53 AM Page 43 Table II CLASS A & B ONLY DOWNTOWN NORFOLK - Class A & B YE 2006 YE 2007 AVG AVG SUBMARKET NLA % VAC RENT NLA % VAC RENT Downtown Norfolk 3,217, % $ ,197, % $20.33 SOUTHSIDE - Class A & B YE 2006 YE 2007 AVG AVG SUBMARKET NLA % VAC RENT NLA % VAC RENT Airport/Northampton 298, % $ , % $19.24 Central Norfolk 875, % $ , % $12.96 Chesapeake/Greenbrier 2,931, % $ ,034, % $16.83 Corporate Landing 69, % $ , % $15.93 Hilltop/Oceanfront 436, % $ , % $19.95 Kempsville 442, % $ , % $16.03 Little Neck 502, % $ , % $14.03 Lynnhaven 1,760, % $ ,760, % $16.39 Military Circle 270, % $ , % $16.63 Newtown/Witchduck 2,092, % $ ,085, % $17.12 Pembroke/ Central Business District 2,288, % $ ,189, % $19.70 Portsmouth 467, % $ , % $15.35 Suffolk 817, % $ , % $13.82 PENINSULA - Class A & B YE 2006 YE 2007 AVG AVG SUBMARKET NLA % VAC RENT NLA % VAC RENT Coliseum Central 515, % $ , % $12.93 Downtown Hampton 206, % $ , % $16.40 Downtown Newport News 153, % $ , % $14.00 Hampton Roads Center 1,041, % $ ,060, % $17.23 Newmarket 670, % $ , % $15.66 Oyster Point 2,578, % $ ,612, % $16.68 Suburban Newport News 236, % $ , % $12.28 Williamsburg/James City/ York County 533, % $ , % $ OFFICE 43
45 ODU-MarketReview2008-FINAL2:ODUMarketReview2005 2/14/08 11:53 AM Page O F F I C E Downtown Norfolk Market Continued stability remained Downtown Norfolk s trademark even though the numerical results were less than spectacular. The secret to Downtown s success is that companies rarely leave once becoming accustomed to the pedestrian environment with amenities galore. This retention rate has led building owners to reinvest in their assets, renewing finishes and infrastructure with the promise of higher rents as vacancies remained low. While the proposed mixed-use Wachovia Center is still more than two and a half years from delivering, its planned 22-story office tower is already having its effect. With proposed rental rates above $30 per square foot (p.s.f), the new building will set a new high water mark for rents in the region and existing Downtown buildings are increasing rates to reflect this new found headroom. For example, existing class A buildings 150 West Main, Dominion Tower and World Trade Center all increased asking rates significantly in 2007, while class B buildings also increased rates. Net absorption Downtown was flat in 2007, however leasing activity increased during the second half of the year. We are forecasting conditions to remain stable in 2008 with vacancy dropping further into the single digits. DOWNTOWN NORFOLK MARKET OVERVIEW NET LEASABLE % OF DOWNTOWN AREA (SQ. FT.) NORFOLK INVENTORY Class A Multi-Tenant 1,690, % Class B Multi-Tenant 1,507, % Class C Multi-Tenant 96, % Subtotal Multi-Tenant 3,294, % Owner Occupied 869, % Total 4,164, % The reported overall vacancy rate and average rents for the Downtown Norfolk by building class are as follows: YE 2006* YE 2007* AVG. RENT % VACANT AVG. RENT % VACANT Class A $ % $ % Class B $ % $ % Class C $ % $ % Total $ % $ % A & B Only $ % $ % * weighted averages HAMPTON ROADS Real Estate Market Review
46 ODU-MarketReview2008-FINAL2:ODUMarketReview2005 2/14/08 11:53 AM Page 45 Southside Suburban Market Suburban vacancy increased in 2007 for the second consecutive year to just above 10% as new construction deliveries outpaced market demand. The few speculative projects delivering in 2007 captured the modest demand and achieved stabilized occupancy. Most noteworthy among these was the Convergence Center III (99,000 s.f.) in the Pembroke/CBD submarket which reached 90% occupancy upon opening in the 4th quarter. Among other significant new deliveries were the MAST One Building (60,000 s.f.) in the Tri-Cities area, the Gallery II (30,000 s.f.) in the Newtown/Witchduck submarket and the Circle South Building (32,000 s.f.) at Military Circle. Fortunately, 2008 promises to be a more robust year in terms of new construction with a number of class A projects already in motion during the first quarter. While 2007 was a modest year in terms of net absorption, most of the growth was attributable to the Southside Suburban locations. As in recent years, however, activity was not evenly spread as gains in certain submarkets were offset by losses in others. Chesapeake/Greenbrier remained a steady performing area buoyed by the largest lease transaction of the year as American Funds (50,000 s.f. expansion) continued to grow in the Liberty Executive Park. SOUTHSIDE MARKET OVERVIEW NET LEASABLE % OF SOUTHSIDE AREA (SQ. FT.) INVENTORY Class A Multi-Tenant 5,081, % Class B Multi-Tenant 8,558, % Class C Multi-Tenant 352, % Subtotal Multi-Tenant 13,992, % Owner Occupied 1,533, % Total 15,525, % The reported overall vacancy rate and average rents for the Southside by building class are as follows: YE 2006* YE 2007* AVG. RENT % VACANT AVG. RENT % VACANT Class A $ % $ % Class B $ % $ % Class C $ % $ % Total $ % $ % A & B Only $ % $ % * weighted averages 2008 OFFICE 45

47 ODU-MarketReview2008-FINAL2:ODUMarketReview2005 2/14/08 11:53 AM Page OFFICE Peninsula Submarkets The total office inventory on the Virginia Peninsula for Class A & B multi-tenant space is approximately 6 million s.f. with a 2007 overall vacancy rate of 12% compared to 8.4% at the end of Oyster Point and Hampton Roads Center continue to be the primary submarkets on the Peninsula accounting for 78% of all Class A space and 49% of all Class B space. Oyster Point remains the largest submarket on the Peninsula containing 2,612,196 s.f. of Class A & B office space. The second largest submarket is Hampton Roads Center, which contains 1,060,990 s.f. of Class A & B office space. Combined, these two submarkets possess 3,673,186 s.f. or 61% of the total office inventory for Classes A and B. The balance of 2,439,642 s.f. is divided among seven other submarkets stretching from Downtown Hampton to Williamsburg/James City County. Oyster Point saw the Class A vacancy rate increase dramatically from 3.08% at the end of 2006 to 12.6% at the end of 2007 on a base of 1,477,085 s.f.. The major factor affecting Oyster Point was the re-delivery of the Symantec Building containing 100,000 s.f. Class A space in Oyster Point had negative absorption of 28,980 s.f. Class B space had positive absorption of 2,417 s.f. during The most notable office activity in Oyster Point in 2007 was the delivery of Two City Center, a 76,320 feet of office/retail facility. The facility contains 12,720 s.f. of retail space on the first floor and 63,600 s.f. of office on floors two through five. The office component is 36% leased at rents in the $22.50 p.s.f. range with a tenant improvement allowance of $27.00 p.s.f. below a finished ceiling. Lastly, the Turner Building containing 19,000 s.f. was delivered in 2007 and is 65% leased at rates in the $18.00 per rentable s.f. range. Class A space in Hampton Roads Center had negative absorption of 7,450 s.f. on a base of 538,722 s.f.. Vacancy rates for Class A space increased from 8.7 in 2006 to 10.2% in Vacancy rates for Class B space jumped from 5% in 2006 to 12.4% in 2007 on a base of 503,268 s.f. The majority of the increase in vacancy is attributable to the Raytheon Building placing 15,000 s.f. of space on the market, Hampton II had an increase in vacancy of 9,000 s.f. and Hampton Technology Center has 7,260 s.f. available. The only new construction in Hampton Roads Center is the development of the Proton Therapy Institute containing 96,000 s.f. and scheduled for delivery at the end of In 2008, rental rates will decrease in Oyster Point due to an abundance of available space. Tenant improvement packages will increase since market conditions have loosened. Hampton Roads Center will see rental rates decrease and tenant improvement packages increase due to additional office space being available in the market. PENINSULA MARKET OVERVIEW NET LEASABLE % OF PENINSULA AREA (SQ. FT.) INVENTORY Class A Multi-Tenant 2,667, % Class B Multi-Tenant 3,449, % Class C Multi-Tenant 326, % Subtotal Multi-Tenant 6,444, % Owner Occupied 432, % Total 6,877, % HAMPTON ROADS Real Estate Market Review
48 ODU-MarketReview2008-FINAL2:ODUMarketReview2005 2/14/08 11:53 AM Page 47 The reported overall vacancy rate and average rents for the Peninsula by building class are as follows: YE 2006* YE 2007* AVG. RENT % VACANT AVG. RENT % VACANT Class A $ % $ % Class B $ % $ % Class C $ % $ % Total $ % $ % A & B Only $ % $ % * weighted averages ABSORPTION 2007 SUBMARKET # SF LEASABLE # SF LEASABLE SF VACANT SPACE VACANT SPACE VAC ABSORBTION SPACE YE 2006 SPACE YE 2007 CHANGE YE 2006 YE 2007 CHANGE YE 07 Downtown Norfolk 3,314,224 3,294,224 20, , ,598 32,393 12,393 Airport/Northampton 320, ,342 (38,035) 33,311 69,546 (36,235) 1,800 Central Norfolk 984, ,503 (2,000) 143, ,035 (49,002) (47,002) Chesapeake/Greenbrier 2,973,835 3,076,713 (102,878) 308, ,753 (49,775) 53,103 Hilltop/Oceanfront 446, ,236 (18,240) 20,039 44,231 (24,192) (5,952) Corporate Landing 69,756 69, ,978 (5,978) (5,978) Kempsville 442, , ,220 23,060 6,160 6,160 Lynnhaven 1,760,940 1,760, , ,826 (57,597) (57,597) Little Neck 530, , ,939 24,731 (8,792) (8,792) Military Circle 336, ,528 (146,531) 29,065 46,808 (17,743) 128,788 Newtown/Witchduck 2,110,452 2,103,702 6, , ,235 (61,926) (68,676) Pembroke/Central Business District 2,224,632 2,224, , ,424 (38,084) (38,084) Portsmouth 488, ,266 (76,000) 64,924 84,041 (19,117) 56,883 Suffolk 817, ,314 (41,260) 52,800 35,661 17,139 58,399 Downtown Hampton 218, , ,565 21,415 1,150 1,150 Downtown Newport News 153, ,864 17,578 45,353 30,000 15,353 (2,225) Hampton Roads Center 1,077,823 1,096,823 (19,000) 110, ,798 (44,189) (25,189) Coliseum Central 515, ,676 (62,000) 52,921 45,376 7,545 69,545 Newmarket 820, , , , Oyster Point 2,659,234 2,692,846 (33,612) 157, ,862 (113,539) (79,927) Suburban Newport News 284, , ,850 27,243 3,607 3,607 Williamsburg/James City/ York County 533, ,888 (84,667) 16,834 51,166 (34,332) 50,335 Total 23,083,508 23,663,403 2,047,033 2,524,187 (477,154) 102, O F F I C E 47

49 ODU-MarketReview2008-FINAL2:ODUMarketReview2005 2/14/08 11:53 AM Page 48

50 ODU-MarketReview2008-FINAL2:ODUMarketReview2005 2/14/08 11:53 AM Page 49 OFFICE SUBMARKETS Southside 1 Airport/Northampton 2 Chesapeake/Greenbrier 3 Downtown Norfolk 4 Central Norfolk 5 Hilltop/Oceanfront 6 Corporate Landing 7 Kempsville 8 Little Neck 9 Lynnhaven Peninsula 15 Downtown Hampton 16 Hampton Roads Center 17 Coliseum Central 18 Downtown Newport News 19 Newmarket 20 Oyster Point 21 Suburban Newport News 22 Williamsburg/James City Co./ York County 10 Military Circle 11 Newtown/Witchduck 12 N. Suffolk 13 Pembroke 14 Portsmouth 2008 O F F I C E 49
51 ODU-MarketReview2008-FINAL2:ODUMarketReview2005 2/14/08 11:53 AM Page O F F I C E The following is a list of the properties included in this year s survey. DOWNTOWN NORFOLK CLASS A 150 West Main Street ,183 Crown Center ,000 Dominion Tower ,276 Main Street Tower ,000 Norfolk Southern Tower ,463 Town Point Center ,266 World Trade Center ,941 CLASS B 101 Granby Street , Granby Mall Building , W. Freemason , E. Main St. (Former SunTrust) , Plume Street ,000 Anders Williams Building ,000 Bank of America ,892 City Centre ,138 Duke Grace Building ,417 Ghent-Olney Building ,000 Lonsdale Building ,000 Monticello Arcade ,500 Monticello Office Building ,000 Plume Center West ,375 RBC Centura Tower ,600 Seaboard Center ,000 St. Paul Building ,308 Tazewell Building ,000 The Helena Building ,100 Towne Bank Building (109 E. Main St.) ,698 Wainwright Building ,151 York Street Center ,293 CLASS C 220 West Freemason Street , Granby Street , Boush Street , Monticello Avenue ,760 Norfolk Community Services ,192 OWNER OCCUPIED AAA Headquarters ,000 AT&T ,000 Atlantic Building ,000 Decker Building ,000 Dominion Enterprises ,000 Landmark Communications ,500 Norfolk Telcom Center ,000 Peta25,000 Standard Forms ,000 Two Commercial Place ,450 AIRPORT/ NORTHAMPTON CLASS A Twin Oaks I ,000 Twin Oaks II ,000 Circle South ,000 CLASS B Airport Executive Center ,609 HRSA-ILA Bldg (Longshoremen s) ,678 Northhampton Executive Center ,035 CLASS C Electrical Workers Corporation Office ,020 OWNER OCCUPIED CMA/CGM (USA) ,000 USAA Building ,000 Zim-American Israeli Shipping ,000 CENTRAL NORFOLK CLASS B 5360 Robin Hood Road ,000 Almeda Business Center (flex) ,000 Commerce Park Place(flex) ,783 Gateway II(flex) ,000 Lafayette Executive Center ,641 Lawson Building ,022 Norfolk Business Center (flex) ,000 Norfolk Business Center II (flex) ,926 Norfolk Commerce Center I(flex) ,000 Norfolk Commerce Center III(flex) ,000 Norfolk Commerce Center IV(flex) ,980 Norfolk Commerce Center V(flex) ,000 CLASS C 4100 Building ,614 Atlas Building ,476 Blair Building ,000 Southern Office Building ,061 Time Building ,000 OWNER OCCUPIED American Funds Building ,000 CHESAPEAKE/ GREENBRIER CLASS A 1403 Greenbrier Parkway (Gateway Bank) , Crossways Blvd ,000 BECO Corp HQ (609 Independence) ,400 CHKD Health Center (Volvo Park VI) ,000 Chubb Building ,500 Crossways Center ,702 Dendrite One ,000 Dendrite Two ,000 Greenbrier Tower I ,900 Greenbrier Tower II ,976 HR Realtors Association Bldg (638 Independence) ,000 Lake Center I ,000 Lake Center II ,000 Liberty One ,000 HAMPTON ROADS Real Estate Market Review
52 ODU-MarketReview2008-FINAL2:ODUMarketReview2005 2/14/08 11:53 AM Page 51 Liberty Three ,000 Liberty Two ,000 CLASS B 1580 Crossways Blvd , Volvo Parkway ,000 Atlantic Business Center ,000 Battlefield Corporate Center ,000 Battlefield Lakes Tech Center I ,500 Battlefield Lakes Tech Center II ,000 Battlefield Lakes Tech Center III ,000 Battlefield Technology Center ,578 Battlefield Technology Center I ,000 Battlefield Technology Center II (MCI) ,478 Branch Executive Quarter-Hamilton ,600 Branch Executive Quarter-Jefferson ,838 Branch Executive Quarter-Madison ,788 Chelsea Commons WCMB ,400 Crossways Commerce Center I (Office Annex) ,000 Crossways Commerce Center II ,300 Crossways I ,007 Crossways II (flex) ,751 Crossways III ,992 Eden North Center ,700 Greenbrier Business Center ,000 Greenbrier Business Centre (flex) ,561 Greenbrier Circle Corporate Center ,138 Greenbrier I & II ,276 Greenbrier Square ,250 Greenbrier Tech Center One (flex) ,414 Greenbrier Tech Center Two (Flex) ,340 Heritage Bank Building ,654 Independence Technology Center I ,000 Knells Ridge Plaza ,500 Knells Ridge Square ,000 Old Greenbrier Village ,015 Riverwalk Professional Bldg ,000 Rose and Womble Business Center ,432 SunTrust Bank Building ,500 Volvo Park (Progressive Drive) ,000 Volvo VII ,000 Woodbrier Terrace ,000 CLASS C 2125 Smith Avenue ,423 OWNER OCCUPIED Cox Communications ,000 First Data ,557 Household Finance ,000 Panasonic Call Center ,000 Towers Perrin ,000 Volvo Penta ,000 HILLTOP/OCEANFRONT CLASS A Pavilion Center (Towne Bank) ,177 Potter Professional Center ,500 William E. Wood Building ,000 CLASS B 1092 Laskin Road , Laskin Road Executive Center ,000 Beach Tower ,000 Birdneck Office Park ,182 Birdneck Square ,285 Colonial Mill Professional Center ,555 Damalas Centre ,900 First Colonial Office Park ,000 General Booth Professional Center ,000 Gibson Pavilion ,000 Great Neck Professional Bldg ,000 Heritage Commons ,000 Hilltop West Executive Center ,000 Mill Dam Crossing ,037 Rudd Building ,000 Sandpiper Key Associates Bldg ,000 CLASS C Oceana East ,360 CORPORATE LANDING CLASS B Princess Anne Executive Park ,756 Verizon Building ,000 OWNER OCCUPIED Al-Anon ,000 Approved Financial ,000 GEICO ,000 KEMPSVILLE CLASS A Chadwick Building ,000 Grayson Building ,000 CLASS B 1201 Lake James Office , Holland Road , Providence Road (Providence South)....12,000 Arrowhead Office Court ,000 Atrium of College Park Square ,379 Central Park I (552 Central Dr) ,000 Central Park II (544 Central) ,000 College Park Square III ,150 Courtyard at Providence ,879 Fairfield Square ,933 Holland South ,843 Holland/Taft Professional Center ,850 Kempsville Office Park ,722 Oxford Square ,544 Woolpert Building ,700 LYNNHAVEN CLASS A AMSEC Park West ,180 Lynnhaven Commons (office bldg) ,000 Lynnhaven Commons Complex ,000 Lynnwood Plaza , O F F I C E 51
53 ODU-MarketReview2008-FINAL2:ODUMarketReview2005 2/14/08 11:53 AM Page O F F I C E Marsh Landing ,117 Oceana Center One ,928 Oceana Place ,369 Pinehurst Centre ,000 Reflections I ,924 Reflections II ,676 Reflections III ,000 Reflections IV ,000 Viking Building ,900 Windwood Center ,348 CLASS B 2700 Internation Parkway , Lynnhaven Pkwy ,910 Advanced Technology Building ,000 Basgier Bldg. I ,200 Basgier Bldg. II ,000 Bennett Office Building (120 S. Lynnhaven) ,522 Commercial Place ,400 Gateway Bank Building (641 Lynnhaven) ,000 Lynnhaven Corporate Center I ,046 Lynnhaven Corporate Center II ,300 Lynnhaven Executive Center ,000 Lynnhaven Five ,549 Lynnhaven North ,000 Lynnhaven Professional Center ,000 Lynnhaven Station ,226 Parkway Center 3 and ,567 Parkway Center I & II ,112 Parkway III (Unisys) ,428 Parkway West (flex) ,563 RBM Building ,170 Sabre Street I ,000 Sabre Street II ,000 Sabre Street III ,000 Sabre Street IV ,000 South Lynnhaven Business Park ,000 U.S. Commerce Center (Tidewater Tech) ,819 Yorktown Commerce Center (228 N. Lynnhaven) ,529 OWNER OCCUPIED Cenit Bank Bldg ,000 Eastern ,000 Global Technical Systems ,000 Hall Automotive ,865 SAIC ,000 LITTLE NECK CLASS B 101 North Lynnhaven (Lynnhaven Station) , Building (Virginia Beach Blvd.) ,000 King s Grant Office Building ,000 Little Neck Office Park (3300 Bldg) ,000 Little Neck Office Park (3300 South) ,000 Little Neck Office Park (3400 Bldg) ,000 Little Neck Towers ,860 NEXCOM Building ,000 NEXCOM Expansion ,000 Plaza Trail Office Building ,975 Rose Hall Commons ,266 Rose Hall Professional Center ,000 Rosemont Interstate Center I ,400 Rosemont Interstate Center II ,835 Rosemont Interstate Center III* ,000 Sun Building ,600 Transouth Building (3615 VB Blvd) ,500 CLASS C Birchwood Office Park ,688 Byler Building ,592 OWNER OCCUPIED TAF Group ,000 MILITARY CIRCLE CLASS A Portfolio Recovery Bldg (140 Corporate Blvd) ,002 Riverside Commerce Center (120 Corporate Blvd.)70,000 Riverside Corporate Center ,682 Riverside Crossing (130 Corporate Blvd) ,847 CLASS B Centura Bank Building ,442 Circle East ,047 College Park Executive Center ,000 I.T.T. Building ,379 FBI Building ,000 CLASS C Executive Office - Janaf ,800 Janaf Office Building ,329 OWNER OCCUPIED Sentara ,000 Union Mission (former VA Natural Gas)....75,403 NEWTOWN/WITCHDUCK CLASS A AAA Headquarters ,045 Amelia Building ,660 Amerigroup Building I ,000 Amerigroup Building II ,000 BB&T Building ,000 Expressway Corporate Center ,658 Gallery I ,000 Greenwich Center ,000 Greenwich Commons ,000 Greenwich Station ,000 Halifax Building ,100 Mass Mutual Building ,500 Smithfield Building ,000 Verizon Center ,000 Westmoreland Building ,436 CLASS B 144 Business Park Drive , Business Park Drive ,300 HAMPTON ROADS Real Estate Market Review
54 ODU-MarketReview2008-FINAL2:ODUMarketReview2005 2/14/08 11:53 AM Page Business Park Drive , Business Park Drive , Business Park Drive , Witchduck Road , Newtown Road ,181 American Teleservices Building ,232 Azalea Village ,000 BCF Building ,000 BPC Building ,074 Colonial Corporate Center ,772 Commerce Centre ( Expressway Ct)...35,500 Commonwealth Building ,000 Executive Cove ,000 Interstate Corporate Center ,000 Parliament Drive Professional Bldg ,000 TRC Center I ,000 TRC Center II ,884 TRC Center III ,000 Witchduck Crossing ,326 CLASS C Witchduck Office Court ,000 OWNER OCCUPIED Copy Data (Ikon) ,000 Cox Cable Building ,000 Cox Expansion ,000 Lendman ,000 Newtown Square ,000 Resource Bank Plaza ,315 Six Columbus Center ,000 Southport Center ,000 Ticketmaster ,000 Town Center (222 Central Park) ,900 Town Center North Tower ,000 CLASS B VST Building , Holland Road , Columbus , Columbus St , Columbus St ,000 Corporate Center I ,000 Corporate Center II ,475 Corporate Center III ,000 Corporate Center IV ,012 Dragas Office Park ,896 Haygood Executive Park ,472 Holland Commerce Center ,000 Holland Office Park ,000 Holland Plaza Office Building ,513 Independence Business Center ,000 Independence Technology Center - Technocenter I ,000 Independent Plaza ,655 Larkspur Village ,184 Old Donation Executive Park ,347 Pembroke Office Park ,000 Pocahontas Center ,800 Prism Plaza ,000 Southgate Centre ,200 Southport Business Center(flex) (Baskin Bldg) ,683 Southport Trade Center(flex) ,883 Thalia One ,408 Thalia Professional Center ,000 The Meadows ,433 OWNER OCCUPIED Alantec Financial Fed Credit Union ,000 AVIS ,000 Coastal Training Technologies ,000 Commonwealth College ,000 Electronic Systems Building ,000 ISC 40,000 QED Building ,000 REIN Building ,500 PORTSMOUTH CLASS A BB&T Building (500 Crawford) ,327 Harbourfront Corporate Center (801 Water St)..53,000 CLASS B 307 County Street , Crawford Street Building , Crawford Street ,171 Boyette Professional Center ,000 Bristol Square ,800 JJH Building ,563 New Kirn Building ,000 Port Trade Center ,223 PortCentre I (flex) ,000 The Seaboard Building ,000 Towne Bank Building (200 High St) ,000 Wachovia Bank ,000 PEMBROKE/ CENTRAL BUSINESS DISTRICT CLASS A 249 Central Park Avenue ,000 Convergence Center ,000 Convergence Center II ,000 Five Columbus Center ,000 One Columbus Center ,000 Pembroke Commercial Bldg. (4425 Corporation Lane) ,760 CLASS C Beacon Building (VA Pilot) ,200 Haygood Buildings ,392 CLASS C Crawford Executive Center ,340 SUFFOLK CLASS A JTASC Building ,365 CLASS B Bridgeway Technology Center I ,000 Bridgeway Technology Center II , O F F I C E 53
55 ODU-MarketReview2008-FINAL2:ODUMarketReview2005 2/14/08 11:53 AM Page OFFICE Bridgeway Technology Center III ,384 Brinkley Building ,500 Brinkley Building II ,000 Harbor View Professional Center (1033 & 1035) ,000 Harbour Breeze Professional Center ,265 Lake View Technology GSA Center ,000 Main Street Center ,800 Washington Street Center ,000 OWNER OCCUPIED Lockheed Martin ,000 Overton Building ,940 Rose & Womble Building ,000 Towne Bank Center ,000 DOWNTOWN HAMPTON CLASS A Harbour Centre ,855 CLASS B W. Queens Way , W. Queens Way ,500 Mill Point Center ,000 One Mallory Street ,000 CLASS C 55 W. Queens Way ,132 DOWNTOWN NEWPORT NEWS CLASS B 2600 Building ,018 Wachovia Bank Building ,846 OWNER OCCUPIED Newport News Shipbuilding, Bldg ,000 HAMPTON ROADS CENTER CLASS A 1001 N Campus Parkway ,000 6 Manhattan Square ,106 Allstate Building ,000 HealthNet Building ,482 Lakefront Plaza I ,442 Morgan Marrow Building ,000 Olympia Place ,395 Oxford Plaza ,297 Parkway Executive Center ,000 Research Quad - Building One ,000 Research Quad - Building Three ,000 CLASS B 400 Butler Farm Road , Butler Farm Road ,715 Hampton I ,532 Hampton II ,000 Hampton III ,000 Hampton Technology Center I ,575 NDS Building ,000 Raytheon ,000 Research Office Building ,000 CLASS C 3217 Armistead Avenue ,043 NASA Langley Research Center ,790 COLISEUM CENTRAL CLASS A Executive Tower ,164 Pinewood Plaza ,500 CLASS B 2115 Executive Drive , Tower Place ,500 Bank of America Building ,434 Colony Square of Hampton ,050 Riverdale Complex ,000 Sheraton Office Bldg ,673 Todds Lane Professional Center ,500 West Telemarketing ,855 OWNER OCCUPIED Langley Federal Credit Union ,800 NEWMARKET CLASS B NetCenter ,171 Newmarket Building ,262 UPS Call Center ,000 CLASS C Rouse Tower ,000 OWNER OCCUPIED NN Shipbuilding Employee Credit Union ,000 OYSTER POINT CLASS A 601 Thimble Shoals Boulevard ,000 Atrium At Oyster Point ,971 Cedar One ,467 Contemporary Cybernetics ,000 Ferguson Corporate Center II ,000 Fountain Plaza One ,000 Fountain Plaza Three ,000 Fountain Plaza Two ,000 Langley Federal Centre ,982 Merchants Walk ,000 One City Center ,000 One Oyster Point ,226 Oyster Point Interstate Center ,000 Patrick Henry Corporate Center ,883 Peninsula Professional Building ,800 Rock Landing Corporate Center II ,476 SunTrust Building ,955 HAMPTON ROADS Real Estate Market Review
56 ODU-MarketReview2008-FINAL2:ODUMarketReview2005 2/14/08 11:53 AM Page 55 Symantec Corp. Building ,000 Tower Park (733 &735 Thimble Shoals) ,667 TowneBank Center ,000 Turner Bldg (1060 Loftis) ,000 Two City Center ,600 Two Oyster Point ,137 Wachovia Building ,921 William E Wood Building (1030 Loftis) ,000 CLASS B Jefferson Avenue , Bluecrab (flex) ,000 BB&T Plaza (603 Pilot House) ,348 Cale Colony ,000 Canon Place ,000 Comb-Bay Park ,000 Dunwoody Place ,798 Executive Center ,399 Fishing Point Complex(flex) ,000 International Distribution Center ,000 McCale Professional Park ,000 Middle Ground Business Center ,000 Oyster Point Business Center ,000 Oyster Point Center ,000 Oyster Point Place (flex) ,000 Oyster Point West ,560 Park Central Executive Center ,425 Park Place (751 & 753 Thimble Shoals) ,000 Peninsula Business Center I (flex) ,817 Peninsula Business Centre II (flex) ,475 Peninsula Business Centre III (flex) ,000 Rock Landing Corporate Center IV ,125 Rock Landing Corporate Center V ,125 Technology Center (flex) ,000 Thimble Shoals Business Center (flex) ,377 Thimble Shores Lakefront ,000 CLASS C J.Clyde Morris Blvd ,000 Drucker & Falk Building ,000 Pilgrim Landing ,650 Regent Park ,000 OWNER OCCUPIED Applied Research Center ,000 Fountain Plaza Two ,000 Muller Martini Building ,000 Peninsula Retail Credit ,000 SUBURBAN NEWPORT NEWS CLASS B Bay Savings Bank Building ,000 Colony Square of Denbigh II ,100 Denbigh Professional Park ,598 Ferguson Enterprises ,800 MCI Building ,000 Tidewater Tech (616 Denbigh Blvd) ,778 CLASS C Mariner Building ,000 Teagle Building ,000 OWNER OCCUPIED CNU Building ,000 WILLIAMSBURG/ JAMES CITY/ YORK COUNTY CLASS A 263 McLaws Circle ,967 Atrium Building ,000 Casey New Town - SunTrust ,000 Courthouse Green Office Park II ,000 Design Center (4350 New Town Ave) ,700 First Union Center ,000 Langley Federal Credit Union ,000 Patriot Park Business Center ,000 William E. Wood Building ,000 Williamsburg Commerce Center ,000 CLASS B 104 Bypass Road , George Washington Memorial Highway...10,000 Chartertowne Professional Center ,800 Greens Springs Office Park ,000 Kristinsand Office Park ,221 Packets Executive Center ,000 Quarterland Commons Office Condos ,000 Rivergate Center ,000 Wachovia Bank ,500 Williamsburg Office Park ,600 Disclaimer: The information in this report is deemed reliable. Old Dominion University Real Estate Center makes no representation or warranty as to its accuracy. BOLD indicates change/addition from last year 2008 OFFICE 55


57 ODU-MarketReview2008-FINAL2:ODUMarketReview2005 2/14/08 11:53 AM Page 56 HAMPTON ROADS Real Estate Market Review

 functions and reports are funded by donations from")
58 ODU-MarketReview2008-FINAL2:ODUMarketReview2005 2/14/08 11:53 AM Page 57 RESIDENTIAL 2008 HAMPTON ROADS REAL ESTATE MARKET REVIEW Acknowledgements Author Bea Hopkins Director Residential DataBank Data Analysis/Layout Bea Hopkins Residential DataBank Blair Hardesty Residential DataBank Financial Support The E. V. Williams Center for Real Estate for Real Estate and Economic Development (CREED) functions and reports are funded by donations from individuals, organizations and the CREED Advisory Board. Disclosure Data collection from December November

59 ODU-MarketReview2008-FINAL2:ODUMarketReview2005 2/14/08 11:54 AM Page RESIDENTIAL General Overview TThe Hampton Roads Residential Market statistics covered in this report analyze the new home building industry and the existing home sales activity for a twelve month period beginning with December 2006 through November Data from the prior twelve months is used for comparison. Included are the cities of Chesapeake, Hampton, Newport News, Norfolk, Poquoson, Portsmouth, Suffolk, Virginia Beach, and Williamsburg, and the counties of Isle of Wight, James City, Southampton, and York. New this year is Gloucester and the numbers have been recalculated to include Gloucester during the prior year. The new construction data contained in this report was gathered from the actual deeds recorded and from the building permits issued by each city or county. The existing home closings data was gathered from the Real Estate Information Network. National numbers were provided by the National Association of Realtors. The Year in Review The Hampton Roads Housing Market during the year of 2007 was a year of challenge for some and opportunity for others. The recent housing boom that occurred between 2003 and 2005 was fueled by low interest rates and a tight supply of homes for sale. The fast sales pace of both new construction and existing homes fueled activity by an inordinate number of investors, speculators, first time home owners, and move up buyers. When the interest rates started to climb, the market began to slow. Corrections and adjustments that began in 2006 continued through the year of Residential building permits were down during the first quarter by 39.2%, and the second and third quarters were down by 5.0% and 11.0% when compared to the prior year. The price points with the greatest number of sales for The twelve months ending in November 2007 show a final loss in permit activity of 31.0% with a total of 5,150 building permits issued. As a single-family detached homes were in a range from direct result of the housing downswing, builders have pulled back on $300K to $499K. The highest number of attached new production until sales improve rather than overextend for additional construction unit sales occurred in the price points that projects. The smaller losses in permit activity during the second and third quarters indicate that excess inventory is shrinking and the market in Hampton Roads is absorbing the majority of standing were less than $300K. product. Looking at closings for the year, the new construction market is down 16.0% with a total of 4,189 closings. The price points with the greatest number of sales for single-family detached homes were in a range from $300K to $499K. The highest number of attached new construction unit sales occurred in the price points that were less than $300K. High-end single-family detached homes priced above $500K continue to show HAMPTON ROADS Real Estate Market Review

60 ODU-MarketReview2008-FINAL2:ODUMarketReview2005 2/14/08 11:54 AM Page 59 the biggest loss in closing activity. At the end of November the existing home market ended the twelve month period with a loss of 14.8%. A total of 19,006 resale homes closed for a drop of 3,309 closings. For six straight years the existing home market in Hampton Roads experienced significant increases year after year. Unable to sustain this growth as the market slowed, in 2006 the resale market began to correct. The number of closings for the past twelve months reflect a market very similar to the years of 2000 and 2001, when the market was not just stable, but thriving. The majority, or 66% of all sales for existing single-family detached homes during the year fell in the price ranges below $300K. Sales of attached existing homes were concentrated in the price points below $200K with 91.0% of all sales. Table I NEW CONSTRUCTION PERMIT AND CLOSING ACTIVITY (December 2005 through November 2006 compared to December 2006 Through November 2007) ALL PRODUCT TYPES % % PERMITS PERMITS DIFFERENCE CLOSINGS CLOSINGS DIFFERENCE Chesapeake % % Gloucester % % Hampton % % Isle of Wight County % % James City County 1, % % Newport News % % Norfolk % % Portsmouth % % Southampton County % % Suffolk % % Virginia Beach 1, % 1,028 1, % Williamsburg % % York County % % TOTALS 7,462 5, % 4,986 4, % Table II TOP 10 SUBDIVISIONS BY PERMITS THROUGH NOVEMBER Virginia Beach Ridgley Manor 145 James City County Colonial Heritage 130 Suffolk Remington Park 100 James City County Fords Colony 76 James City County Eagle Harbor 75 James City County Windsormeade 74 Virginia Beach Woodbridge Pointe 73 Newport News Patrick Henry Place 64 James City County Stonehouse 59 Virginia Beach Studio RESIDENTIAL 59

61 ODU-MarketReview2008-FINAL2:ODUMarketReview2005 2/14/08 11:54 AM Page RESIDENTIAL AVERAGE PRICES The average price for a new construction single-family detached home in Hampton Roads is now $437,315, down a slight 0.4% compared to the same twelve month time period last year. The area with the highest average price for a new construction single-family detached home is Virginia Beach with $529,432. Condominium prices have increased 0.01%, from $336,498 to $336,688, and townhome units now carry an average price of $388,737, down 10.6% from last year. The Hampton Roads combined average price for all types of new construction is $388,737, a small decrease of 1.8%. The Hampton Roads combined average price for all More than 60% of all areas in Hampton Roads carry an average price types of new construction is $388,737, a small greater than $400,000 for single-family detached homes. decrease of 1.8%. Existing home average prices show increases for all types of units. Singlefamily detached existing homes are now $282,538, up 4.6%. Condominium units have an average price of $219,785, up 0.01%, and townhomes units have an average price of $185,546, up 4.4%. The average closing price in Hampton Roads for all types of housing is $260,545, up 4.4% from the same time last year. THE NATIONAL HOUSING MARKET Total existing home sales were up 0.4% from October 2007 with 5,000,000 for the month of November. However, this number is 20.0% below the 6,250,000 sales level reported in November The inventory of existing homes for sale in November stands at 10.3 months, down from 10.7 months in October From the peak in the market during 2006, housing prices nationwide have declined 3.4% through the 3rd quarter of 2007, according to the Shiller Real Housing Price Index. In November, the nationwide median price for an existing home was $210,200. Nationally, new construction sales are off by 25% from year ago numbers and at the end of November, there was a 9.3 month supply. The median sales price for a new single-family detached home during the month of November was $239,100, with a twelve month average of $242,617. Single-family housing starts are down by 24.6% from November 2006 and nearly 50% from the record high at the beginning of last year. Adding stress to the market, investors/speculators have been unloading new construction homes bought during the market boom, onto the existing homes market. Additionally, tight mortgage market conditions have increased home sale cancellations according to David Seiders, the chief economist for the National Association of Home Builders. In addition, the tight credit conditions in the home mortgage market are creating tightening conditions in the financial markets for land acquisition, land development and construction loans. HAMPTON ROADS Real Estate Market Review
62 ODU-MarketReview2008-FINAL2:ODUMarketReview2005 2/14/08 11:54 AM Page 61 Chart I 2007 SINGLE FAMILY HOME AVERAGE CLOSING VALUES NC RS VARIENCE NEW CONSTRUCTION VERSUS EXISTING $600,000 $540,000 $529,995 New Construction Resale Variance $480,000 $420,000 $360,000 $300,000 $240,000 $180,000 $120,000 $60,000 $358,572 $171,423 $434,342 $305,266 $129,076 $441,973 $286,757 $155,216 $252,657 $191,233 $61,424 $402,763 $235,080 $167,683 $458,864 $312,685 $146,179 $285,532 $169,418 $116,114 $319,695 $202,024 $117,671 $309,933 $220,744 $89,189 $459,659 $399,708 $59,951 $453,162 $360,584 $92,578 $432,042 $431,224 $325,075 $259,553 $65,522 $0 $818 Virginia Beach Chesapeake Suffolk Portsmouth Norfolk Isle of Wight SHC Hampton Newport News James City County York County Wburg. Gloucester INDIVIDUAL MARKET SEGMENTS Single-Family Detached homes continued to dominate the new construction market with 70% of all permits issued. Off by 19.1% this year, only one area showed growth in the single-family detached market: Hampton increased by 6.5%. Closings were down 20.4% but there were some bright spots, namely Virginia Beach up 15.4%, Norfolk up 20.8%, and York County up 30.9%. While closings were off, the average price of a new single-family detached home remained nearly level at $437,315, down a mere 0.4% from one year ago. Area builders have introduced smaller, less expensive product lines and there has been a marked decrease in the number of high end, custom homes. Condominium units experienced a loss of 49.5% in permit activity. This sharp decline in numbers can be attributed to an unusually large number of permits issued during 2006 for projects such as The Westin, The Sanctuary at False Cape, and The Spectrum at Willoughby Spit. Closings for condominium units totaled 1,435, down from one year ago by 9.1%. However, the average price for a condominium increased 0.1% from the same time last year to $336,688. Condominium closings command 34% of the new construction market and in the future, this number is expected to be even higher. With municipalities advocating the need for affordable housing paired with increasing land costs, the condominium market is an undeniable necessity to meet the demand. Townhomes in the Hampton Roads area experienced activity almost identical to condominium units. Permits were down 45.9% with a total of 346 issued. Closings declined 9.5% with 342. The average closing price for a townhome unit decreased from last year by 10.6%. The average price is now $264, R E S I D E N T I A L 61

63 ODU-MarketReview2008-FINAL2:ODUMarketReview2005 2/14/08 11:54 AM Page RESIDENTIAL THE TOTAL MARKET Hampton Roads ended the twelve month period of December 2006 through November 2007 with a total of 23,195 closings for both new construction and existing homes. This number represents a loss in market activity of 15.0% compared to year ago numbers. The average combined price for a home in the area has increased to $288,692, a gain of 4.6% It has been said many times recently that all housing markets are local. What this means is that conditions within each market determine the strength or weakness of that market and the buying and selling of homes is dependent on several factors. Job growth, the supply of homes, mortgage interest rates, and the quantity of available mortgage products are all key segments. When some or all of these factors are favorable, demand is created. Hampton Roads is unique in many ways. The economic picture is significantly influenced by the presence of the military and the various Department of Defense contractors. A second area of employment and economic strength is centered on the shipyards and the various shipping ports found in Norfolk, Portsmouth, and Newport News. Ranked number seven in the nation for tonnage, the Hampton Roads ports have advanced the local economy and created auxiliary enterprises in the areas of trucking, warehousing, distribution, and storage. Because of the unique, fairly stable economic base found in this area, Hampton Roads is usually sheltered from the many fluctuations of the National economy. The housing market in this area is also relatively quite stable. Without the draw of a sizeable amount of heavy industry in the area, growth in the housing market is largely the result of military movements, the national defense budget, job growth, and the normal cycles of life. Graph II AVERAGE MARKET TIME FOR EXISTING HOMES 1993 TO 2007 DAYS ON MARKET HAMPTON ROADS Real Estate Market Review

64 ODU-MarketReview2008-FINAL2:ODUMarketReview2005 2/14/08 11:55 AM Page 63 Table III VIRGINIA BEACH TOP 5 SUBDIVISIONS RANKED BY CLOSINGS Community No. Closed Average Price 1. Ridgely Manor 235 $294, Lexington 96 $342, The Orchard at Glenwood 82 $397, Woodbridge Pointe 74 $406, Sanctuary at False Cape 57 $792,006 For the past 15 years the new construction market in Hampton Roads has closed around 5,000 new homes per year. Even during the recent boom the number of closed transactions for new construction in this area increased from the norm by less than 1,400 closings, a relatively small amount compared to growth in other sectors of the country. Areas in California, Nevada, Arizona, and Florida led the nation in sales and pricing. Over the course of two or three years they grew too fast and experienced price increases that could not be supported. Now they are leading in foreclosures. Hampton Roads was far behind when compared to these super hot markets. As a result, this area has contracted very little. The average price of a new home has decreased less than 2% over the past year and the average price for an existing home has actually increased by over 4.0%. Foreclosure problems from subprime mortgage instruments have created major difficulties nationwide during the past year. There may be more to come this year, but fortunately the majority of home loans do not fall into the subprime category. This year will almost certainly see another reduction in the mortgage interest rates. This can only help the industry. The housing market may continue to go through a period of stabilization during the first half of the year. Building permits should begin to increase during the second half as the final stock of inventory is absorbed. As activity improves in the new construction market, sales will pick up for existing homes as well. The good thing about the market at this time is that it is certainly a buyers market. Builders are offering incentives in the form of upgrades, closing cost assistance, and free options that make buying a home now very attractive. Table IV CHESAPEAKE TOP 5 SUBDIVISIONS RANKED BY CLOSINGS Community No. Closed Average Price 1. The Hampshires 48 $286, Eagle Point at Cahoon Pl 44 $354, North Trail at Arboretum 27 $332, Olde Mill Run 22 $401, Preserve on the Elizabeth 21 $554,764 Table V PENINSULA TOP 5 SUBDIVISIONS; RANKED BY CLOSINGS (JAMES CITY COUNTY (JC); YORK COUNTY (Y)) Community No. Closed Average Price 1. Colonial Heritage (JC) 132 $383, Stonehouse (JC) 62 $513, Felgate Woods (Y) 61 $352, New Town (JC) 58 $331, Pocahontas Square (JC) 56 $163,925 Table VI ISLE OF WIGHT (I), NORFOLK (N), PORTSMOUTH (P), SUFFOLK (S) TOP 5 SUBDIVISIONS RANKED BY CLOSINGS Community No. Closed Average Price 1. Eagle Harbor (I) 102 $327, The Row at Ghent (N) 79 $261, East Beach (N) 43 $775, Villas of Smithfield (N) 39 $256, Mansfield Farms (S) 35 $316, RESIDENTIAL 63
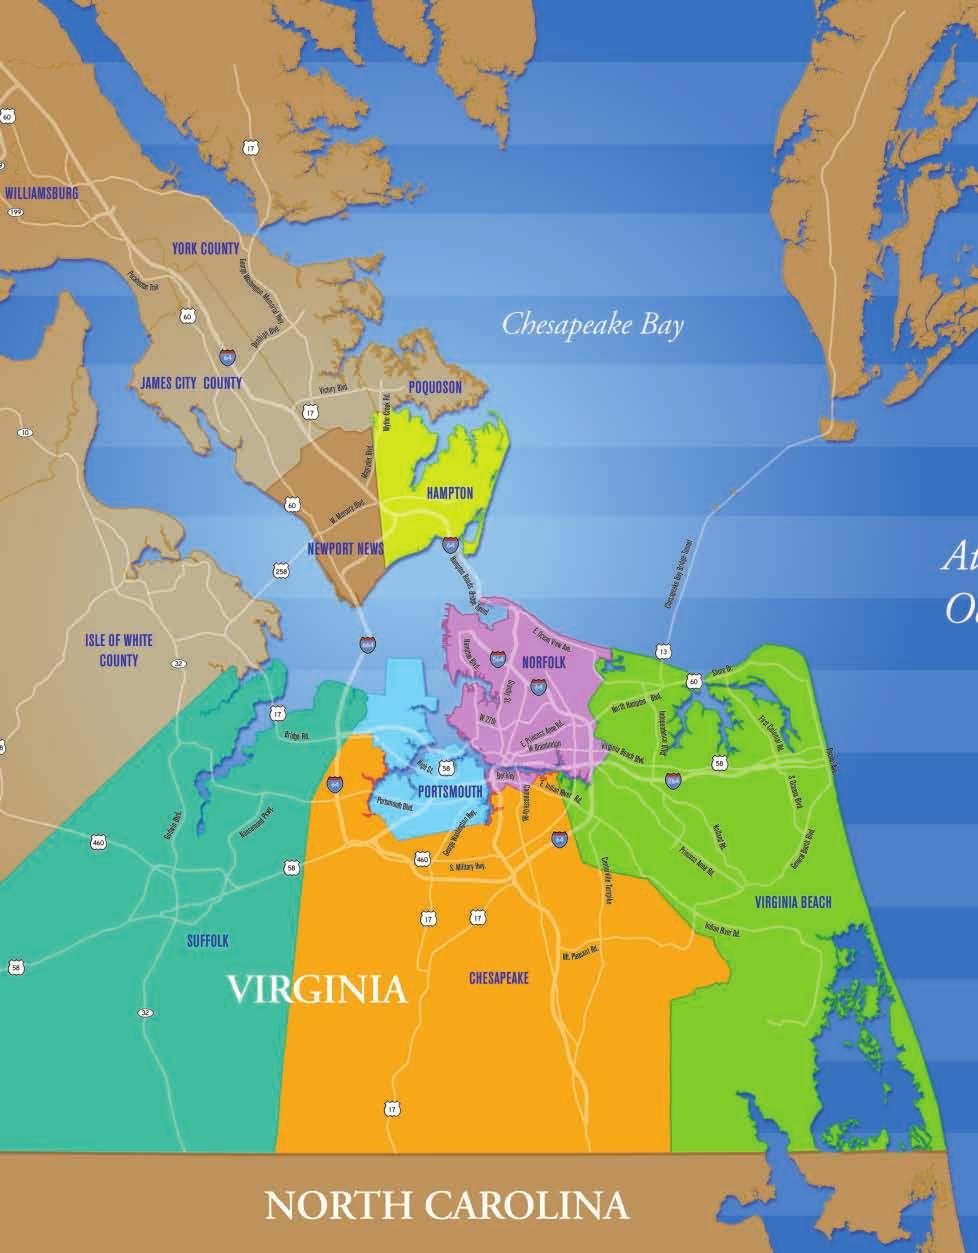
65 ODU-MarketReview2008-FINAL2:ODUMarketReview2005 2/14/08 11:55 AM Page 64
66 ODU-MarketReview2008-FINAL2:ODUMarketReview2005 2/14/08 11:55 AM Page 65 RESIDENTIAL SUBMARKETS Southside Suffolk Portsmouth Norfolk Chesapeake Isle of Wight Co. Franklin/So. Hampton Virginia Beach Peninsula Newport News Hampton James City County York County 2008 RESIDENTIAL 65
67 ODU-MarketReview2008-FINAL2:ODUMarketReview2005 2/14/08 11:55 AM Page RESIDENTIAL Graph III 15 YEAR CLOSING HISTORY RESA LE NEW CONSTRUCTION Nov Proj Table VII EXISTING HOMES National Hampton Roads Median Price¹ $210,200 $215,000 % Change -3.30% -0.46% YTD Closings² 63,260,000 17,529 % Change % % Inventory 10.3 months 6.6 months Table VIII NEW HOMES National Hampton Roads Median Price³ $217,800 $369,149 % Change -8.64% 4.06% YTD Sales² 8,679,000 4,503 % Change % -8.18% Inventory 9.3 months 10.1 months ¹ November January to November 3 October 2007 HAMPTON ROADS Real Estate Market Review
68 ODU-MarketReview2008-FINAL2:ODUMarketReview2005 2/14/08 11:55 AM Page 67 Table IX TOP 25 HAMPTON ROADS BUILDERS BY PERMITS AND CLOSINGS PERMITS ISSUED CLOSINGS # OF CLOSINGS TOTAL REVENUE BUILDER PERMITS ISSUED BUILDER PERMITS ISSUED BUILDER PERMITS ISSUED 1 Chesapeake Homes Dragas Associates Dragas Associates 102,760,071 2 Centex Homes Chesapeake Homes Centex Homes 102,230,302 3 Dragas Associates Centex Homes Chesapeake Homes 91,401,433 4 Lennar Corp Franciscus Co Inc Lennar Corp 50,934,982 5 Franciscus Co Inc 99 5 Lennar Corp The Futura Group Llc 49,740,148 6 K B S Inc 77 6 L L Bldg Corp 94 6 Franciscus Co Inc 42,468,143 7 Mcq Bldrs & Dev Inc 72 7 Terry/Peterson Res 75 7 L L Bldg Corp 30,352,955 8 L L Bldg Corp 67 8 The Futura Group Llc 69 8 Ainslie-Widener Inc 25,960,749 9 Hearndon Constr Corp 65 9 Atlantic Homes Corp 64 9 Terry/Peterson Residen 24,431, Beco Construction Inc Health E Community Ent Virginia Ent Inc 23,725, Atlantic Homes Corp Bristol Development Lifestyle Homes Llc 21,625, Lifestyle Homes Llc Virginia Ent Inc Atlantic Homes Corp 20,421, Associated Contr Svc Inc Ainslie-Widener Inc Ryan Homes 19,612, Ryan Homes Eagle Construction Solid Concepts Inc 18,907, Armada Hoffler Mcq Bldrs & Dev Inc Hearndon Constr Corp 18,348, W M Jordan Co Inc Pace Constr & Dev Corp Bishard Development Co 18,179, Bush Constr Corp Lifestyle Homes Llc Eagle Construction 17,859, Solid Concepts Inc Hearndon Constr Corp Wayne Harbin Bldr Inc 17,595, Hhhunt Homes Lynnhaven Homes Inc Beco Construction Inc 17,543, Home Associates Of Va Villa Development S B Ballard Inc 17,426, Regent Ent Inc Bishard Dev Corp Sadler Bldg Corp 17,220, Ashdon Builders Inc Collins Ent Inc Mcq Bldrs & Dev Inc 16,365, R & R Constr Corp Beco Construction Inc Bristol Development 16,231, Stephen Alexander Homes Home Associates Of Va Home Associates Of Va 16,086, Virginia Ent Inc Ryan Homes Collins Ent Inc 14,598, RESIDENTIAL 67


69 ODU-MarketReview2008-FINAL2:ODUMarketReview2005 2/14/08 11:55 AM Page 68 HAMPTON ROADS Real Estate Market Review

 reports are funded by donations from")
70 ODU-MarketReview2008-FINAL2:ODUMarketReview2005 2/14/08 11:55 AM Page 69 MULTI-FAMILY 2008 HAMPTON ROADS REAL ESTATE MARKET REVIEW Acknowledgements Author Charles Dalton Data Analysis/Layout Real Data Financial Support Old Dominion University E.V. Williams Center for Real Estate and Economic Development (CREED) reports are funded by donations from individuals, organizations and the CREED Advisory Board. 69


71 ODU-MarketReview2008-FINAL2:ODUMarketReview2005 2/14/08 11:55 AM Page MULTI-FAMILY General Overview The Virginia Beach-Norfolk-Newport News Multi-Family Report, published by Real Data, is a detailed analysis of the rental market within conventional apartment communities in the Hampton Roads region. The area has been divided into nine submarkets: Chesapeake, Hampton, Newport News, Norfolk, Portsmouth, Suffolk, Virginia Beach, Williamsburg and York County. Combined, these areas contain a survey base of over 80,000 units within conventional apartment communities of 50 or more units each. The Virginia Beach-Norfolk-Newport News market is divided into two portions by the James River. The Peninsula area is north of the James River and contains Hampton, Newport News, Williamsburg and York County. The Tidewater area is south of the James River and contains Chesapeake, Norfolk, Portsmouth, Suffolk and Virginia Beach. The submarket with the highest concentration of units is Virginia Beach, which accounts for one-quarter of the regions apartment units. The occupancy rate in the Hampton Roads region is consistently one of the highest in the southeast. As of October 2007, the average occupancy rate was 94.9%. There was an upswing in development activity in 2007 with 1,169 new units started compared to only 640 units in As of October 2007, there were over 1,112 units under construction, and an additional 1,800 units were proposed. The average quoted rental rate is $862, with one-bedroom rents averaging $770 per month, two-bedroom units with an average rental rate of $869, and threebedroom units reporting an average quoted rental rate of $1,015. Rental rates from existing inventory increased $34 in the last twelve months. Hampton 12% Newport News 22% Submarket Percentages Chesapeake 11% York County 2% Norfolk 15% Williamsburg 4% Suffolk 1% Virginia Beach 25% Portsmouth 8% HAMPTON ROADS Real Estate Market Review 2008

72 ODU-MarketReview2008-FINAL2:ODUMarketReview2005 2/14/08 11:55 AM Page 71 Historical Apartment Development Virginia Beach-Norfolk-Newport News A total of 83,876 units were surveyed for this report. Development of apartment units in this market peaked during two time periods, the early 1970s and the late 1980s. Development during the 1990s and so far in the 2000s is minor compared to past development. Approximately 18% of the apartment units in this region were built after Table I HISTORICAL APARTMENT DEVELOPMENT NUMBER OF UNITS 25,000 20,000 15,000 10,000 5,000 0 Pre MULTI-FAMILY 71
73 ODU-MarketReview2008-FINAL2:ODUMarketReview2005 2/14/08 11:55 AM Page MULTI-FAMILY Multi-Family Permit Activity Historical Multi-Family Building Permits Virginia Beach-Norfolk-Newport News Overall housing development in the region was at its peak from with more than 10,000 permits issued annually for single and multi-family housing. With the slow down in the overall housing market, residential permits issued fell to 7,689 in 2006 which was a 32% decrease compared to the peak of activity in Based on year to date numbers for 2007, overall housing permits in 2007 will be below the 2006 levels. Multi-family permit activity, which includes rental and for-sale units, was strongest in Much of the permit activity has not been rental apartments, but instead for-sale condominiums and townhouses, especially in recent years when a decline in interest rates made it easier for many people to get into the for-sale arena. Multifamily permits have continued to slow in the last twelve months with the number of permits issued in the last six months at only one-third the prior period. Table II ANNUAL MULTI-FAMILY PERMIT ACTIVITY PERMITS ISSUED 3,200 3,000 2,800 2,600 2,400 2,200 2,000 1,800 1,600 1,400 1,200 1, ,421 1,102 1,216 1, ,519 2,355 2,292 2,339 3,085 1, HAMPTON ROADS Real Estate Market Review
74 ODU-MarketReview2008-FINAL2:ODUMarketReview2005 2/14/08 11:55 AM Page 73 Table III MULTI-FAMILY PERMITS ISSUED PAST 12 MONTHS NUMBER OF PERMITS NOV DEC JAN FEB MAR APR MAY 2007 JUN JUL AUG SEP OCT Apartment Development Activity As of October, there were over 1,100 apartment units under construction within seven communities in the Virginia Beach-Norfolk-Newport News market. There are an additional 3,300 apartment units in the planning stage. Table IV APARTMENT DEVELOPMENT ACTIVITY (OCTOBER 2007) 1, NUMBER OF UNITS Chesapeake Hampton Newport News Norfolk Portsmouth Suffolk Virginia Beach Williamsburg York 2008 M U LT I - FA M I LY 73
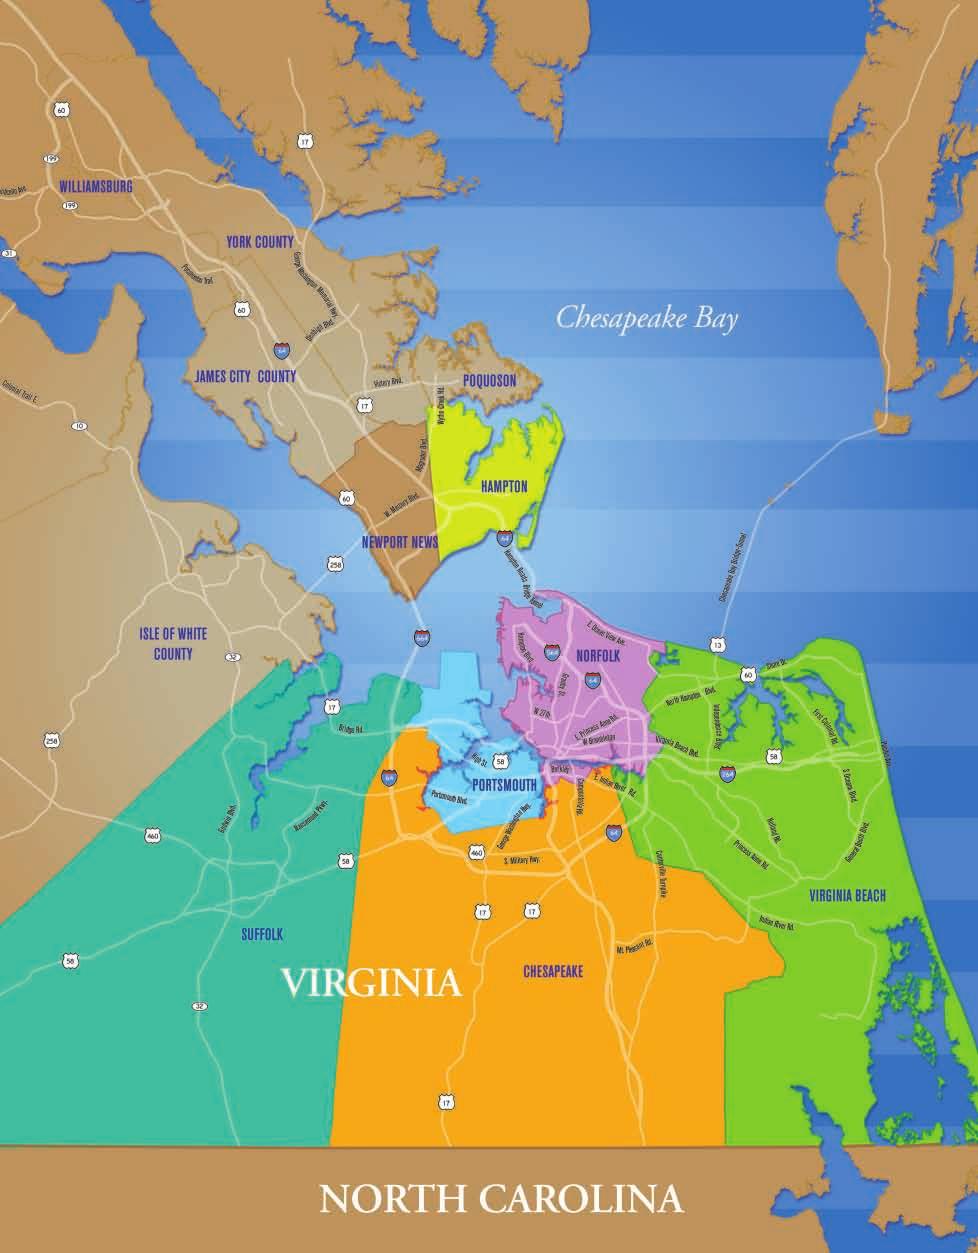
75 ODU-MarketReview2008-FINAL2:ODUMarketReview2005 2/14/08 11:55 AM Page 74
76 ODU-MarketReview2008-FINAL2:ODUMarketReview2005 2/14/08 11:55 AM Page 75 MULTI-FAMILY SUBMARKETS Southside Suffolk Portsmouth Norfolk Chesapeake Isle of Wight Co. Franklin/So. Hampton Virginia Beach Peninsula Newport News Hampton James City County York County 2008 MULTI-FAMILY
77 ODU-MarketReview2008-FINAL2:ODUMarketReview2005 2/14/08 11:56 AM Page MULTI-FAMILY Absorption Demand for housing can be measured by calculating the number of housing units absorbed within a given time frame. Absorption is defined as the net change in occupied units. Therefore, positive absorption occurs when previously vacant or newly built dwellings become occupied. Based on the current state of the economy and historical performance, the Virginia Beach-Norfolk-Newport News area is expected to absorb between 600 and 900 units annually. The 828 units absorbed over the past year falls within the expected absorption levels. Table V ABSORPTION 1,400 1,300 1,200 1,100 1,000 NUMBER OF UNITS The Hampton submarket, which reported the most new units coming on-line, had the highest level of absorption in the last year. Although Portsmouth reported the weakest demand with the loss of (-214) renters, this was due in large part to the closing of one community in anticipation of redeveloping the site. HAMPTON ROADS Real Estate Market Review
78 ODU-MarketReview2008-FINAL2:ODUMarketReview2005 2/14/08 11:56 AM Page 77 Table VI SUBMARKET ABSORPTION OCTOBER ABSORPTION (ANNUAL) Chesapeake Hampton Newport News Norfolk Portsmouth Suffolk Virginia Beach Williamsburg York Vacancy The overall vacancy rate for the Virginia Beach-Norfolk-Newport News market as of October 2007 was 5.1%. While this is the highest the vacancy rate has been in nearly 10 years, the market is still very healthy. Based on the current development pipeline, vacancy rates are expected to rise slightly but should remain at or below 6%. Table VII OVERALL VACANCY VACANCY RATE Every area saw an increase in vacancy rate over the past six months with the exception of Virginia Beach and Newport News. The most significant increase in vacancy was in Hampton and Williamsburg which was the result of recent new developments coming on line in those submarkets M U LT I - FA M I LY 77
79 ODU-MarketReview2008-FINAL2:ODUMarketReview2005 2/14/08 11:56 AM Page M U LT I - FA M I LY Table VIII SUBMARKET VACANCY RATES NUMBER OF UNITS 7% 6% 5% 4% 3% 2% 1% 0% October 2006 October 2007 Chesapeake Hampton Newport News Norfolk Portsmouth Virginia Beach Williamsburg York Overall Rental Rates As of October, the average rental rate in Virginia Beach-Norfolk-Newport News was $862. Although rent growth remains healthy at more than 4% in the last year, the rate of growth has been shrinking since peaking at nearly 6% in Table IX AVERAGE RENTAL RATES AVERAGE RENTAL RATE $900 $800 $700 $600 $500 $400 $300 $200 $100 $ Average Rents Average overall rents ranged from a low of $768 in Newport News to a high of $957 in Virginia Beach. Newport News, Portsmouth, Norfolk, Williamsburg, and Hampton all reported rents lower than the average rent of $862, while Suffolk, Chesapeake, York and Virginia Beach all reported rents higher than the average overall rent. HAMPTON ROADS Real Estate Market Review
80 ODU-MarketReview2008-FINAL2:ODUMarketReview2005 2/14/08 11:57 AM Page 79 Table X AVERAGE RENT BY SUBMARKET OCTOBER 2007 AVERAGE RENTAL RATE $1,000 $900 $800 $700 $600 $500 $400 $300 $200 $100 $0 Newport News Portsmouth Norfolk Williamsburg Hampton Overall Suffolk Chesapeake York County Virginia Beach Management There were nearly 450 conventional apartment communities with more than 50 units surveyed in the Hampton Roads region in October. Out of more than 80,000 apartment units surveyed, the top fifteen management firms manage close to 70% of these units in the Virginia Beach-Norfolk-Newport News apartment market. The top five management firms manage 35% of the surveyed market. Table XI TOP 10 MANAGEMENT COMPANIES MARKET SHARE S.L. Nusbaum Great Atlantic Drucker & Falk Lawson Companies AIMCO WMCI Perrel Management Breeden Management Ripley-Heatwole Kotarides Companies 0% 1% 2% 3% 4% 5% 6% 7% 8% 9% 10% REGIONAL TRENDS Richmond Occupancy rates have steadily risen over the last several years in Richmond and are 95% as of August New development activity in the area has been limited and demand has been strong. Rent growth has been in the 3-4% annually and is expected to remain healthy as occupancy rates remain at or near 95%. Development activity is concentrated in the downtown area with conversions of older industrial buildings into new residential units. Developers are also active in Chesterfield County along Highway 288 and we would expect to see more development in Petersburg area in anticipation of the expansion at Fort Lee. Roanoke Occupancy rates and rental rates are improving in Roanoke with occupancies reaching 94% as of April 2007 and rental rates increasing nearly 4% for the year. There have been no new apartment developments of any significant size in Roanoke in the last few years M U LT I - FA M I LY 79


81 ODU-MarketReview2008-FINAL2:ODUMarketReview2005 2/14/08 11:57 AM Page 80 The Prerequisite for doing business in Hampton Roads HAMPTON ROADS Real Estate Market Review


82 ODU-MarketReview2008-FINAL2:ODUMarketReview2005 2/14/08 11:57 AM Page 81 INVESTMENT 2008 HAMPTON ROADS REAL ESTATE MARKET REVIEW Acknowledgements Author J. Scott Adams, CCIM President - Mid-South Region CB Richard Ellis 81

.")
83 ODU-MarketReview2008-FINAL2:ODUMarketReview2005 2/14/08 11:57 AM Page I N V E S T M E N T General Overview The real estate story making all of the national headlines at this time is in the residential market, not the commercial real estate market. But this overview will discuss how the nationwide slowdown in housing does actually impact our commercial market through the capital markets. But even with this correlation, commercial real estate should continue to perform strongly as an investment class nationally. And within that context, Hampton Roads should continue to perform well as a market area overall and within each of the four core product types (office, industrial, retail, and multifamily). COMMERCIAL VERSUS RESIDENTIAL While the "spin-doctors" of commercial real estate began to say during 2007 that there was minimal to no connection between the falling residential markets and the healthy commercial markets, no experts are saying that in With that said, the severe change in the residential market is not expected in the commercial market. Dennis Yes key, national director of Deloitte & Touche LLP's Real Estate Capital Markets Group, recently noted that "The commercial real estate industry as caught a Since 2004, commercial real estate construction has cold from all the coughing and sneezing of the housing market, which is deathly ill." The differing levels of sickness can best be explained by picked up but still arguably at controlled levels which three key differentiators. can be absorbed without significant market correction. The first key differentiator between the commercial and residential markets is the amount of new supply over the last 7 years. While new residential construction doubled nationally from 2001 through 2006, new commercial real estate construction was minimal and flat from 2001 to 2004 still largely recovering from the last slowdown of commercial real estate started in the late 1990's. Since 2004, commercial real estate construction has picked up but still arguably at controlled levels which can be absorbed without significant market correction. The severe slowdown in the residential market nationally has impacted the Hampton Roads area also although not the same extent of other markets where overbuilding was even more rampant over the last 5 to 7 years. The following chart shows the controlled new commercial real estate construction nationally as compared to the residential construction boom. HAMPTON ROADS Real Estate Market Review


84 ODU-MarketReview2008-FINAL2:ODUMarketReview2005 2/14/08 11:57 AM Page 83 CONSTRUCTION ACTIVITY $700 $650 $600 $550 BILLION $500 $450 $400 $350 CRE HOUSING $300 $250 $ The second key differentiator between the commercial and residential markets is the disappearance of a large sector of the buyer pool for residential properties. Speculative investors with no intent to occupy the properties or own them long term were a substantial percentage of residential buyers, particularly in the highly publicized condominium market. The demand for commercial property has been far more diverse and driven by solid fundamentals as a core asset class which will be discussed to a greater extent in a section below. The third key differentiator between the commercial and residential markets was the aggressiveness of the lending community during the boom of 2001 to As aggressive as lending and underwriting was for commercial property during that time period, most commercial lenders continued to require minimum equity of 0% to 20% while residential investors could buy with 0% to 5% equity. With the fall off in demand for residential properties after a period of massive new supply, prices have begun to fall and foreclosures have begun to be prevalent. By contrast, commercial investors have more substantial equity at risk and are in a better position to weather potential declines in pricing. And with that said, the lack of new construction and high cost of any potential further new construction has been a buffer for commercial prices. CAPITAL MARKETS The massive over-leverage in residential real estate is the key driver for the changes in the capital markets we are now experiencing. The soaring housing and mortgage finance markets with low interest rates and high origination volume are now a thing of the past. Recent estimates project the losses stemming from the sub-prime residential mortgage meltdown to be as high as $400 billion. While this story will continue to make national headlines and further erode national consumer confidence, it should be noted that the $400 billion in losses represent only 3% of U.S. gross domestic product which is currently $13 trillion. This perspective allows more sophisticated investors to put this market correction actually in favorable contrast to previous financial crises such as the S&L crisis of the 1990's R E TA I L 83
85 ODU-MarketReview2008-FINAL2:ODUMarketReview2005 2/14/08 11:57 AM Page I N V E S T M E N T On the commercial side, delinquencies and defaults are actually near record lows. The turbulence in the capital markets is a perhaps unwanted but necessary wake-up call to further tighten the lending fundamentals but not to leave the market entirely. Commercial loans had until recently allowed lower near-term debt service coverage ratios with the expectations that occupancy and in-place rents would grow substantially during the loan period. The reliance on future improvements in Net Operating Income can best be illustrated by the significant increase in interest-only loans between 2003 and These loans reduced (i.e. partial interest-only) or eliminated (i.e. full interest-only) the requirement that the borrower pay down loan principal each year. The following chart shows that the percentage of conduit loans that had interest-only terms grew from less than 25% in 2003 to over 80% in LAX UNDERWRITING & AGGRESSIVE LENDING Percentage of Conduit Loans with Interest-Only Terms 90% 80% 70% 60% 50% 40% 30% 20% 10% Partial IO Full IO 0% The availability and price of commercial real estate loans has changed dramatically since the sub-prime residential melt-down began. Commercial loans made on a go-forward basis will focus more on the in-place rent roll and require higher amounts of investor equity (likely 25% to 30%) with more significant reserves for future contingencies. Buyers are much more cautious to tie down their financing assumptions before proceeding on deals today, and buyers are very frustrated with the lack of clear and speedy response the lenders are giving them today. Peter Ruggiero, national managing director for Colliers International's investment services group, recently stated, "The market is not sick; it's just indecisive." COMMERCIAL REAL ESTATE AS INVESTMENT CLASS While commercial lenders are frustrated that their hands are being tied far more than solid commercial fundamentals should dictate, the key issue for commercial real estate as an investment class is that the capital markets do remain open for commercial investments. Commercial market fundamentals remain healthy, and the predictable and transparent contractual cash flows of commercial real estate still appear relatively attractive to alternative investment opportunities. Commercial real estate as an investment class has boomed from 2001 through 2007 primarily through a mix of portfolio and one-off investments. The entire 6 year period was also highlighted by strong growth in the public Real Estate Investment Trust sector, but the availability and low cost of private debt and equity led to a "privatization" boom for the REIT s that began in 2005.These privatizations were effectively large portfolio acquisitions and were primarily done by real estate investors planning to flip" the assets on a one-off or smaller portfolio basis at even higher prices. The following chart prepared by Real Capital Analytics, a New York-based research firm, shows the huge increase in U.S. commercial property sales over $5 Million in value since HAMPTON ROADS Real Estate Market Review
86 ODU-MarketReview2008-FINAL2:ODUMarketReview2005 2/14/08 11:57 AM Page 85 US COMMERCIAL PROPTERTY SALES $450 $400 $81 $350 BILLION $300 $250 $200 $150 $37 $149 $7 $56 $215 $26 $63 $234 $119 $210 PRIVATIZATION PORTFOLIO ONE-OFF $100 $50 0 $18 $63 $23 $79 $23 $ The run-up in commercial real estate investment was fueled in part by a massive wall of liquidity looking for a home. In the United States during 2006, for instance, for every dollar that was spent on buying commercial real estate, there were two more dollars that did not get placed. Commercial real estate has been viewed very favorably relative to other asset classes, and investors viewed the available returns as perfectly acceptable even as cop rates and expected yields declined during the boom period. Capital supply and demand fundamentals gave sellers the Since 2004, commercial real estate construction has upper hand during this period, and that trend is expected to be largely over although the supply of investors will continue to be plentiful. With average yield rates on commercial real estate investments picked up but still arguably at controlled levels which still expected to be higher than those for many other investment can be absorbed without significant market correction. alternatives, commercial real estate likely will continue to be a preferred investment class from a risk-adjusted basis. A recent National Real Estate Investor survey of more than 1,000 private and institutional real estate investors shows that a majority still want to invest more funds in the sector while only 7 percent plan to decrease their investments in real estate over the next 12 months. This survey was conducted after the first national recognition of the slowdown in the U.S. economy as evidenced by anemic job growth figures. As investors aim to move forward in this period of uncertainty, the key question for each potential transaction is what is fair market pricing. At the current time, most commercial owners are still optimistic that strong fundamentals will keep sales prices on par with recent records if not continuing to climb, while most buyers believe that a market correction will lead to better purchase opportunities in the coming months. Accordingly, most buyers and sellers aren't seeing eye-to-eye, and each side appears to be waiting for the other side to blink. Within this overall pricing gap environment, disparities are accentuated in lesser quality assets. The quality of assets can be reviewed in this regard in terms of geographic area and submarket within that area as well as the physical condition, tenancy, and other relevant features. Assets in marginal locations or with significant deferred maintenance or downside risk will be most negatively impacted, as investors flock to quality and security in times of uncertainty I N V E S T M E N T 85
87 ODU-MarketReview2008-FINAL2:ODUMarketReview2005 2/14/08 11:57 AM Page I N V E S T M E N T ANALYSIS OF INVESTMENT RETURNS LAST 5 YEARS VS. NEXT 5 YEARS 16 5YEAR HOLD, % RETURN TOTAL RETURN YIELD NOI GROWTH CAP RATE CONTRIBUTION -2 Last 5 Years Next 5 Years A large part of the rise in commercial pricing in recent years has been from investors' willingness to accept lower returns rather than real growth in asset operating performance. Going forward, commercial real estate investors will have to work harder to achieve above-market returns. With the combination of less generous capital market pricing and slowing economic growth, the question is not whether cap rates will rise, but rather the timing and magnitude of the increases. A recent Torto Wheaton analysis highlighted that declining capitalization rates were the largest positive contributor to total returns over the last 5 years but certainly are not expected to be over the next 5 years. OFFICE PROPERTIES During the last 5 years, commercial real estate investment in office properties has increased dramatically in terms of volume while also seeing cap rates decline dramatically. The following chart using data gathered by Real Capital Analytics, a New York-based research firm, shows the evolution in the office investment market from 2003 to During this 5 year period, office landlords have enjoyed falling vacancies and rising rents with limited new construction adding supply to the market. While office fundamental remain sound, the softening U.S. economy will lead to slower growth in rents and lower space absorption levels. TOTAL PRICE (IN BILLIONS) OFFICE MARKET $250 $200 $150 $100 $50 $ Source: Real Capital Analytics 9.0% 8.0% 7.0% 6.0% 5.0% 4.0% 3.0% Average Cap. Rate HAMPTON ROADS Real Estate Market Review

88 ODU-MarketReview2008-FINAL2:ODUMarketReview2005 2/14/08 11:57 AM Page 87 While these factors will impact the Hampton Roads market also, the area has clearly benefited from the nationally favorable trends. CB Richard Ellis market research tracked 7 office investment sales of $15 Million or more during These sales included the largest downtown and largest suburban office sales in our market's history OFFICE SALES OF $15 MILLION OR MORE Property Name Purchase Price s.f. $/s.f. Seller Purchaser Gee s Group Portfolio $61,100, ,335 $181 Gee s Group Guardian Realty Investors 150 West Main $56,000, ,450 $247 St. Joe Commercial EOLA Capital Greenbrier Office/Flex Portfolio $36,000, ,106 $110 Brookfield Real Estate First Potomac Realty Investment LP Starmount Portfolio $32,379, ,086 $121 Starmount Company CBL & Associates 500 E. Main St. $29,820, ,541 $130 Harbor Group International NPV/Direct Invest Patrick Henry Corporate Center $18,575,000 98,883 $188 Carr Properties/JP Morgan KBS REIT Patrick Henry Corporate Center $16,378,700 98,883 $166 Columbia Equity Trust Carr Properties/JP Morgan INDUSTRIAL PROPERTIES During the last 5 years, commercial real estate investment in industrial properties has also increased dramatically in terms of volume while also seeing cap rates decline dramatically. The following chart using data gathered by Real Capital Analytics, a New York-based research firm, shows the evolution in the industrial investment market from 2003 to During this 5 year period, industrial landlords have enjoyed robust absorption levels but have also seen significant amounts of new construction and less robust growth in rents. The national slowdown in consumer demand, industrial production, and the overall economy will negatively impact absorption and rental rates as well. One remaining positive factor is that global exports have been particularly buoyed by the weak U.S. dollar. TOTAL PRICE (IN BILLIONS) INDUSTRIAL/WAREHOUSE MARKET $40 $35 $30 $25 $20 $15 $10 $5 $ Source: Real Capital Analytics 9.0% 8.0% 7.0% 6.0% 5.0% 4.0% 3.0% Average Cap. Rate 2008 I N V E S T M E N T 87

89 ODU-MarketReview2008-FINAL2:ODUMarketReview2005 2/14/08 11:58 AM Page I N V E S T M E N T The Hampton Roads market should continue to be a national leader in the warehouse market with the positive trends in global trade and the excellent infrastructure of the Ports of Virginia. While CB Richard Ellis market research tracked only 2 industrial investment sales of $15 Million or more during 2007, there were another 5 industrial sales transactions under $15 Million but over $5 Million INDUSTRIAL SALES OF $15 MILLION OR MORE Property Name Purchase Price s.f. $/s.f. Seller Purchaser Commonwealth Storage Portfolio $36,000, ,780 $55.15 Commonwealth Storage, Inc. Not Disclosed Stock Building Supply $16,450, ,600 $57.60 Kempsville Building Materials Marc Realty, LLC RETAIL PROPERTIES RETAIL MARKET During the last 5 years, commercial real estate investment in retail properties has also increased dramatically in terms of volume while also seeing cap rates decline dramatically. The following chart using data gathered by Real Capital Analytics, a New York-based research firm, shows the evolution in the retail investment market from 2003 to TOTAL PRICE (IN BILLIONS) $80 $70 $60 $50 $40 $30 $20 $10 $ Source: Real Capital Analytics 9.0% 8.0% 7.0% 6.0% 5.0% 4.0% 3.0% Average Cap. Rate HAMPTON ROADS Real Estate Market Review
90 ODU-MarketReview2008-FINAL2:ODUMarketReview2005 2/14/08 11:58 AM Page 89 During this 5 year period, retail landlords have enjoyed robust absorption levels and rent growth while consumers defied economists' expectations and kept raising their level of spending despite rising energy prices. But with employment growth slowing and the appreciation in home values clearly on a reverse course, retail vacancy is up and rents are likely to decrease. One trend that is clearly a result of the worsening economy is that shopping center landlords expect bankruptcy filings to increase and are becoming more proactive with struggling retailers. The Hampton Roads market should continue to have strong retail market fundamentals, and national investors continue to look for opportunities to invest in Hampton Roads. Our CB Richard Ellis market research tracked 5 retail investment sales of $15 Million or more during 2007 including major properties both in South Hampton Roads and on the Peninsula RETAIL SALES OF $15 MILLION OR MORE Property Name Purchase Price s.f. $/s.f. Seller Purchaser Denbigh Village $35,951, ,287 $113 Developers Diversified Inland Real Estate Corp. Lynnhaven North $32,000, ,191 $185 North Mall Associates Steven D. Bell & Co. Cypress Point $23,748, ,958 $201 Edens & Avant DLC Management Corp. Best Buy - Jefferson Ave $21,100, ,017 $192 Townsend, LLC IM Properties Crossroads at Chesapeake Square $19,180, ,985 $160 Crossroads at Chesapeake Square, LLC Inland Real Estate Corp. MULTIFAMILY PROPERTIES RETAIL MARKET During the period of 2003 to 2005, commercial real estate investment in multifamily (apartment) properties also increased dramatically in terms of volume while also seeing cap rates decline dramatically. Since 2005, multifamily investment volume and cap rates have been consistently strong. The -following chart using data gathered by Real Capital Analytics, a New York-based research firm, shows the evolution in the multifamily investment market from 2003 to TOTAL PRICE (IN BILLIONS) $120 $100 $80 $60 $40 $20 $ Source: Real Capital Analytics 9.0% 8.0% 7.0% 6.0% 5.0% 4.0% 3.0% Average Cap. Rate 2008 I N V E S T M E N T 89
91 ODU-MarketReview2008-FINAL2:ODUMarketReview2005 2/14/08 11:58 AM Page I N V E S T M E N T During this 5 year period, multifamily landlords have enjoyed strong occupancy and rental rate growth, particularly in areas with high barriers to entry in terms of new supply and areas with above-average economic growth. Going forward, the slowdown in the housing market features both good news and bad news for the multifamily market. The good news is that when the housing market falters, the apartment market typically benefits from higher demand as more people are forced to rent rather than pursue home ownership. The bad news is that when the housing market falters, more homeowners decide to place their houses or condominiums that they would prefer to sell on the rental market. This unplanned supply of potential rental competition effectively serves as "shadow competition" and may impact multifamily absorption and changes in rental rates. The Hampton Roads market should continue to have strong multifamily market fundamentals including low current vacancies and very limited amounts of new construction. CB Richard Ellis market research tracked 11 multifamily investment sales of $15 Million or more during 2007 including major properties both in South Hampton Roads and on the Peninsula APARTMENT SALES OF $15 MILLION OR MORE Property Name Purchase Price s.f. $/s.f. Seller Purchaser Marina Shores $80,750, $205,995 BNP Residential Properties Babcock & Brown Bristol at Ghent $48,300, $180,224 Bristol Development Group Associated Estates Realty Latitudes $45,906, $102,470 BNP Residential Properties Babcock & Brown Myrtles at Olde Towne $33,091, $134,518 Prudential/Roseland Triple Net Properties Mayflower Seaside Towers $33,000, $124,528 Colonial Properties Trust Fairfield Residential Watermans Crossing $24,686, $94,949 America First Investors Sentinel Real Estate Jefferson Point $24,100, $115,865 Harbor Group International AEW Capital Heights at Olde Towne $19,908, $134,518 Prudential/Roseland Triple Net Properties Dockside $18,500, $97,368 Bluestone Realty Urdang/Breeden Oyster Point Place $15,801, $56,839 Praedium Group National Commercial Ventures Heritage at Freemason Harbour $15,600, $84,783 Collins Enterprises ING Clarion Partners HAMPTON ROADS Real Estate Market Review
92 ODU-MarketReview2008-FINAL2:ODUMarketReview2005 2/14/08 11:58 AM Page 91
93 ODU-MarketReview2008-FINAL2:ODUMarketReview2005 2/14/08 11:58 AM Page 92
RETAIL 2011 RETAIL. Author. Survey Collection. Data Analysis/ Layout. Financial Support. Disclosure. David Machupa Cushman & Wakefield/THALHIMER
 RETAIL Author Survey Collection Data Analysis/ Layout Financial Support Disclosure David Machupa Cushman & Wakefield/THALHIMER Kyllie Brinkley E.V. Williams Center for Real Estate and Economic Development
Kyllie Brinkley E.V. Williams Center for Real Estate and Economic Development Old Dominion University
 HAMPTON ROADS MARKET REVIEW RETAIL Author Survey Collection Data Analysis/ Layout Financial Support Disclosure David Machupa Cushman & Wakefield THALHIMER Kyllie Brinkley E.V. Williams Center for Real
RETAIL. Acknowledgements. Authors: Christopher C. Read CB Richard Ellis of Virginia, Inc. Susan P. Pender. NAI Harvey Lindsay
 The E. V. Williams Center for Real Estate and Economic Development wishes to acknowledge all of the firms, individuals and organizations for providing the necessary real estate information and assistance.
E. V. WILLIAMS CENTER FOR REAL ESTATE AND ECONOMIC DEVELOPMENT
 H A M P T O N R O A D S E. V. WILLIAMS CENTER FOR REAL ESTATE AND ECONOMIC DEVELOPMENT WWW.ODU.EDU/CREED CONTENTS ASSOCIATE PUBLISHER Mike Herron Inside Business 757.222.3991 SPECIAL PROJECTS MANAGER
2011 HAMPTON ROADS REAL ESTATE MARKET REVIEW
 2011 HAMPTON ROADS REAL ESTATE MARKET REVIEW 2011 HAMPTON ROADS REAL ESTATE MARKET REVIEW CONTENTS ASSOCIATE PUBLISHER Mike Herron Inside Business 757.222.3991 SPECIAL PUBLISHING MANAGER Olga Currie GRAPHIC
Old Dominion University
 Old Dominion University E. V. Williams Center for Real Estate and Economic Development E. V. Williams Center for Real Estate and Economic Development www.odu.edu/creed CONTENTS 5 Message From The Director
INDUSTRIAL. Acknowledgements. Author: Billy King, SIOR. Data Preparation: Stephanie Sanker. Survey Coordination Clay Culbreth, CCIM, SIOR
 HAMPTON ROADS 2006 INDUSTRIAL M A R K E T S U R V E Y Acknowledgements Author: Billy King, SIOR Data Preparation: Stephanie Sanker Survey Coordination Clay Culbreth, CCIM, SIOR Financial Support: The E.
Old Dominion University Hampton Roads Real Estate Market Review and Forecast 2005
 Old Dominion University Hampton Roads Real Estate Market Review and Forecast 2005 Presented by: The Center for Real Estate and Economic Development Real Estate Centers University of Pennsylvania Samuel
INDUSTRIAL. Acknowledgements MARKET SURVEY. Author. Data Preparation. Survey Coordination. Financial Support HAMPTON ROADS.
 INDUSTRIAL 2007 HAMPTON ROADS MARKET SURVEY Acknowledgements Author Billy King, SIOR Data Preparation Stephanie Sanker Survey Coordination Clay Culbreth, CCIM, SIOR Financial Support The E. V. Williams
MARKET SURVEY OLD DOMINION UNIVERSITY CENTER FOR REAL ESTATE AND ECONOMIC DEVELOPMENT. Center for Real Estate & Economic Development
 2004 MARKET SURVEY OLD DOMINION UNIVERSITY CENTER FOR REAL ESTATE AND ECONOMIC DEVELOPMENT Center for Real Estate & Economic Development Some commercial real estate firms can help you with a particular
INDUSTRIAL. Stephanie Sanker, SIOR, CCIM. Stephanie Sanker, SIOR, CCIM
 2011 HAMPTON ROADS REAL ESTATE MARKET REVIEW INDUSTRIAL Author Data Preparation Survey Coordination William C. Throne, SIOR, CCIM, ALC Vice President, Cushman & Wakefield/THALHIMER Stephanie Sanker, SIOR,
Inside Business. Old Dominion University Hampton Roads Real Estate Market Review and Forecast. Executive Committee. Programs Committee
 Old Dominion University Hampton Roads Real Estate Market Review and Forecast Presented by: The Center for Real Estate and Economic Development Executive Committee Melody Bobko Ron Bray Craig Cope John
REAL ESTATE MARKET REVIEW
 MULTIFAMILY 2014 HAMPTON ROADS REAL ESTATE MARKET REVIEW Author Charles Dalton Data Analysis Real Data Financial Support The E.V. Williams Center for Real Estate and Economic Development (CREED) functions
INVESTMENT. Acknowledgements. Authors: Jonathan Guion, SIOR Senior Advisor Sperry Van Ness Commercial Real Estate Advisors
 HAMPTON ROADS 2006 INVESTMENT M A R K E T S U R V E Y Acknowledgements Authors: Jonathan Guion, SIOR Senior Advisor Sperry Van Ness Commercial Real Estate Advisors 87 2006 INVESTMENT GENERAL OVERVIEW T
Hampton Roads Real Estate Market Review and Forecast
 Old Dominion University Hampton Roads Real Estate Market Review and Forecast 2011 Presented by: E.V. Williams Center for Real Estate and Economic Development Welcome! John R. Lombard, Ph.D. Director E.V.
Residential. Acknowledgements. Author Data Analysis/ Layout. Financial Support. Disclosure. Blair Hardesty Director Residential DataBank
 Residential Acknowledgements Author Data Analysis/ Layout Financial Support Disclosure Blair Hardesty Director Residential DataBank The E. V. Williams Center for Real Estate and Economic Development (CREED)
MULTIFAMILY 2012 MULTI-FAMILY HAMPTON ROADS MARKET REVIEW. Author. Data Analysis. Financial Support. Disclosure. Charles Dalton.
 HAMPTON ROADS MARKET REVIEW MULTIFAMILY Author Data Analysis Financial Support Disclosure Charles Dalton Real Data The E. V. Williams Center for Real Estate and Economic Development (CREED) functions and
RESIDENTIAL. Acknowledgements 2008 HAMPTON ROADS REAL ESTATE MARKET REVIEW. Author Bea Hopkins Director Residential DataBank
 ODU-MarketReview2008-FINAL2:ODUMarketReview2005 2/14/08 11:53 AM Page 57 RESIDENTIAL 2008 HAMPTON ROADS REAL ESTATE MARKET REVIEW Acknowledgements Author Bea Hopkins Director Residential DataBank Data
3 RD QUARTER 2016 RICHMOND RETAIL MARKET REPORT FORECAST 5.3% VACANCY 349,524 SF UNDER CONSTRUCTION (137,905) SF NET ABSORPTION
 SF NET ABSORPTION") 3 RD QUARTER 2016 RICHMOND RETAIL MARKET REPORT FORECAST All signs indicate a stabilized market that continues to support well-located new development. The majority of absorption in the 3rd quarter was
3 RD QUARTER 2016 RICHMOND RETAIL MARKET REPORT FORECAST All signs indicate a stabilized market that continues to support well-located new development. The majority of absorption in the 3rd quarter was
MULTI-FAMILY DEFINITIONS. Acknowledgements. The following terminology and sources are used in the CREED Apartment Report:
 DEFINITIONS The following terminology and sources are used in the CREED Apartment Report: Absorption Net change in occupied units within comparable communities within a specific time frame. New units that
INVESTMENT OFFERINGS CUSHMAN & WAKEFIELD THALHIMER CAPITAL MARKETS GROUP THIRD QUARTER 2016
 CUSHMAN & WAKEFIELD THALHIMER CAPITAL MARKETS GROUP INVESTMENT OFFERINGS THIRD QUARTER 2016 ERIC ROBISON Senior Vice President (804) 697 3475 eric.robison@thalhimer.com MICHAEL EARLY First Vice President
Multi-Family. Acknowledgements. Author. Data Analysis/ Layout. Financial Support. Disclosure. Charles Dalton. Real Data
 Multi-Family Acknowledgements Author Charles Dalton Data Analysis/ Layout Real Data Financial Support Disclosure The E. V. Williams Center for Real Estate and Economic Development (CREED) functions and
Charleston. Retail Loves the Holy City. Fourth Quarter 2017 Retail. Vacancy Rates. Net Absorption. Asking Rent $ , %
 Retail Loves the Holy City Even with 158,000 plus square feet (sf ) hitting the market in the fourth quarter of 2017, the vacancy rate continued its march downward dropping 0.8% to! Much of the rising
3 RD QUARTER 2015 RICHMOND RETAIL MARKET REPORT FORECAST 5.7% VACANCY 509,220 SF UNDER CONSTRUCTION 370,165 SF NET ABSORPTION
 3 RD QUARTER 2015 RICHMOND RETAIL MARKET REPORT FORECAST As 2015 winds down, the vacancy rates are approaching an all time low. Retail inventory is down causing an increase in construction with national
INVESTMENT OFFERINGS CUSHMAN & WAKEFIELD THALHIMER CAPITAL MARKETS GROUP SECOND QUARTER 2016
 CUSHMAN & WAKEFIELD THALHIMER CAPITAL MARKETS GROUP INVESTMENT OFFERINGS SECOND QUARTER 2016 ERIC ROBISON Senior Vice President (804) 697 3475 eric.robison@thalhimer.com CATHARINE SPANGLER Senior Associate
Shopping Center Occupancy Study of the Greater Hagerstown Area
 Shopping Occupancy Study of the Greater Hagerstown 2015 Prepared By City of Hagerstown Planning & Code Administration Department November 2015 Shopping Occupancy Study of the Greater Hagerstown - 2015
Charleston. Retail Is Still Thriving. Fourth Quarter 2018 Retail
 Retail Is Still Thriving The region s vacancy rate crept up slightly from the previous quarter, while the availability rate dropped marginally. Asking NNN rental rates dropped over $1.50 per square foot
MARKET SURVEY OLD DOMINION UNIVERSITY CENTER FOR REAL ESTATE AND ECONOMIC DEVELOPMENT. Center for Real Estate & Economic Development
 2004 MARKET SURVEY OLD DOMINION UNIVERSITY CENTER FOR REAL ESTATE AND ECONOMIC DEVELOPMENT Center for Real Estate & Economic Development Some commercial real estate firms can help you with a particular
INVESTMENT. Acknowledgements MARKET SURVEY. Author HAMPTON ROADS
 INVESTMENT 2007 HAMPTON ROADS MARKET SURVEY Acknowledgements Author Jonathan Guion, SIOR Managing Director Sperry Van Ness Commercial Real Estate Advisors 2007 INVESTMENT General Overview This report analyzes
3/18/2012 WELCOME. Stephanie Sanker, CCIM, SIOR S.L. Nusbaum Realty Co.
 E.V. Williams Center for Real Estate and Economic Development (CREED) Old Dominion University Presents the 17 TH ANNUAL HAMPTON ROADS REAL ESTATE MARKET REVIEW AND FORECAST Wednesday, March 14, 2012 WELCOME
Slover Library opened January 2015 WHAT S
 Slover Library opened January 2015 WHAT S NeW Summer 2015 THE MAIN Coming in 2017 WATERSIDE LIVE! THE COURTHOUSE HARBOR S EDGE Announcing Harbor s Edge Phase II in Fort Norfolk Coming Summer 2016 NEWRETAIL
The CoStar Retail Report
 The CoStar Retail Report T H I R D Q U A R T E R 2 0 1 1 Kansas City Retail Market Kansas City Retail Market THIRD QUARTER 2011 KANSAS CITY Table of Contents Table of Contents....................................................................
Upstate, SC 2Q17. Industrial Market Report. Q2 Industrial. Upstate Economy in 2Q17* Industrial Sector in 2Q17. Trends for 2Q17
 Upstate, SC 2Q17 Industrial Market Report The industrial market for the Upstate of South Carolina saw continued growth for the second quarter of 217. While there was a positive net absorption of 67,53
MARKET INSIGHT LOUISVILLE, KENTUCKY MULTIFAMILY REPORT THIRD QUARTER 2017
 CUSHMAN & WAKEFIELD COMMERCIAL KENTUCKY LOUISVILLE MULTIFAMILY RESEARCH MARKET INSIGHT MULTIFAMILY REPORT THIRD QUARTER 217 The Cushman & Wakefield Commercial Kentucky Multifamily Research Team provides
Time for Retail to Take Stock
 Q1 2013 RETAIL LAS VEGAS NEVADA RESEARCH & FORECAST REPORT Time for Retail to Take Stock It is heartening to say, after five years of a bad economy, that the first quarter of 2013 s 119,649 square feet
The CoStar Retail Report
 The CoStar Retail Report Y E A R - E N D 2 0 1 1 YEAR-END 2011 KANSAS CITY Table of Contents Table of Contents.................................................................... A Methodology........................................................................
WINCHESTER STATION WINCHESTER, FREDERICK COUNTY, VIRGINIA
 OFFERING SUMMARY WINCHESTER, FREDERICK COUNTY, VIRGINIA Best-In-Class Merchandising Mix 95% of GLA Occupied by National Tenants Significant Base Rental Rate Spreads On Recent Backfill of Former HHGregg
Lower Norfolk County Time Line by Donald W. Moore, CG
 Lower Norfolk Time Line 1607 first landing of Jamestown colonist at Cape Henry 1 1635 Adam Thoroughgood patent 2 1636 New Norfolk 3 1637 Lower and Upper Norfolk 4 first Lower Norfolk court 5 1639 first
The Upstate, South Carolina
 The Upstate, South Carolina Investment Progressing with Infrastructure and Manufacturing Expansions Following a trend started in 2015, net absorption remains positive, but has slowed pace in the last two
Charleston. Retail Continues to Thrive. First Quarter 2018 Retail
 Retail Continues to Thrive Internet sales continue to have an effect on brick and mortar locations causing retailers to close non-performing locations, downsize or be sold. In other cases, retailers are
4Q 16. Columbus Market Report. 605 S Front St Suite 200 Columbus OH
 4Q 16 Columbus Market Report 605 S Front St Suite 200 Columbus OH 43215 www.ohioequities.com 614 224 2400 Columbus Table of Contents 01 Office Market Report 02 Retail Market Report 03 Industrial Market
Los Angeles Basin Retail Market Continues To Witness Decreasing Vacancy Rates
 RETAIL GREATER LOS ANGELES BASIN MARKET REPORT Continues To Witness Decreasing Vacancy Rates MARKET INDICATORS - VACANCY 6.0% NET ABSORPTION 1,605,200 CONSTRUCTION 2,111,970 RENTAL RATE $2.03 P NNN UNEMPLOYMENT
SOUTHWEST CORNER OF CAPITOL DRIVE & 124TH STREET BROOKFIELD (SUBURBAN MILWAUKEE), WISCONSIN
, WISCONSIN") SOUTHWEST CORNER OF CAPITOL DRIVE & 124TH STREET BROOKFIELD (SUBURBAN MILWAUKEE), WISCONSIN INVESTMENT HIGHLIGHTS S U B J E C T O F F E R I N G Mid-America Real Estate Corporation, in cooperation with
SOUTHWEST CORNER OF CAPITOL DRIVE & 124TH STREET BROOKFIELD (SUBURBAN MILWAUKEE), WISCONSIN INVESTMENT HIGHLIGHTS S U B J E C T O F F E R I N G Mid-America Real Estate Corporation, in cooperation with
Homestretch: Office Market Set to Finish Strong
 Research & Forecast Report RENO OFFICE Q3 2016 Homestretch: Office Market Set to Finish Strong >> Vacancy drops significantly the largest drop quarter over quarter in 2016 >> Rental rates are not increasing
SHOPS OF BERRYHILL OFFERING MEMORANDUM
 OFFERING MEMORANDUM 1890 BERRYHILL RD, CORDOVA, TN 38016 EAST RETAIL SUBMARKET RETAIL SHOPPING CENTER 17,360 sf INVESTMENT OPPORTUNITY CHIMNEY ROCK BLVD BERRYHILL RD N For more information, please contact:
>> Greater Los Angeles Retail Ends 2016 With Mixed Results
 Research & Forecast Report GREATER LOS ANGELES RETAIL Q4 2016 Accelerating success. >> Greater Los Angeles Retail Ends 2016 With Mixed Results Greater Los Angeles Retail Market The Los Angeles Basin retail
SUMMIT POINTE CHESAPEAKE, VA 23320
 CONTACT US OFFICE LEASING PERRY FRAZER Executive Vice President +1 757 228 1833 perry.frazer@cbre-norfolk.com PAT MUGLER Executive Vice President +1 757 228 1831 pat.mugler@cbre-norfolk.com RETAIL LEASING
Investor Presentation 2017
 Investor Presentation 2017 BACKGROUND 2017 Broad Street Realty, LLC l 2 BACKGROUND BROAD STREET REALTY OVERVIEW Michael Jacoby (based in Bethesda) and Tom Yockey (based in Denver) founded Broad Street
SINGLE TENANT INVESTMENT OPPORTUNITY
 SINGLE TENANT INVESTMENT OPPORTUNITY FAIRFIELD, ALABAMA(BIRMINGHAM MSA) JIM SCHUCHERT SENIOR ASSOCIATE SRS NATIONAL NET LEASE GROUP 610 Newport Center Drive, Suite 1500 Newport Beach, CA 92660 DL: 949.270.8204
The CoStar Retail Report
 The CoStar Retail Report M I D - Y E A R 2 0 0 9 Southwest Florida Retail Market Southwest Florida Retail Market MID-YEAR 2009 SOUTHWEST FLORIDA Table of Contents Table of Contents....................................................................
>> Greater Los Angeles Retail Continues to Witness Declining Vacancy
 Research & Forecast Report GREATER LOS ANGELES RETAIL Accelerating success. >> Greater Los Angeles Retail Continues to Witness Declining Vacancy Greater Los Angeles Retail Market The Los Angeles Basin
>> Greater Los Angeles Retail Starts 2017 At A Slow Pace
 Research & Forecast Report GREATER LOS ANGELES RETAIL Q1 2017 Accelerating success. >> Greater Los Angeles Retail Starts 2017 At A Slow Pace Greater Los Angeles Retail Market The Los Angeles Basin retail
1st Quarter Updated February 2019 CAPITAL MARKETS. Investment Offerings
 CAPITAL MARKETS Investment Offerings 1st Quarter 2019 Updated February 2019 OFFICE Vistas I& II One Holland Place Commonwealth Medical Park Northpointe Center Petersburg, VA Dumfries, VA 154,653 SF, 95%
EASTRIDGE PLAZA - PORTERVILLE, CA
 EASTRIDGE PLAZA - PORTERVILLE, CA DuBois Gianulias www.cbre.com/dg ACCEPTING OFFERS IMMEDIATELY Exclusively Offered By Jon Gianulias Senior Vice President 916.446.8787 jon.gianulias@cbre.com John DuBois
Good Year, Poor Quarter
 Q4 2013 RETAIL LAS VEGAS NEVADA RESEARCH & FORECAST REPORT Good Year, Poor Quarter After nine quarters of positive net absorption, Southern Nevada s retail market fell into negative net absorption territory
RALEIGH-DURHAM MULTIFAMILY Year End 2017
 Research Report -DURHAM MULTIFAMILY Year End 2017 Multifamily Growth Expected to Continue in 2018, Despite a Moderate Decrease in Permitting Totals Emily Bostic Research Analyst Raleigh-Durham Key Takeaways
MARKET WATCH SOUTHERN CALIFORNIA & PHOENIX
 SOUTHERN CALIFORNIA & PHOENIX COMMERCIAL REAL ESTATE MARKET FOURTH QUARTER 217 MARKET WATCH SOUTHERN CALIFORNIA & PHOENIX 1.888.659.DAUM WWW.DAUMCOMMERCIAL.COM D/AQ Corp. # 1129558 DAUM TABLE OF CONTENTS
Sites Listed on the Virginia Beach Historical Register - By Address As of January 26, 2018 (Year listed shown in parenthesis)
") Sites Listed on the Virginia Beach Historical Register - By Address As of January 26, 2018 (Year listed shown in parenthesis) 411 16 th Street (2004) 301 20 th Street, Nita Fay House (2005) removed from
Sites Listed on the Virginia Beach Historical Register - By Address As of January 26, 2018 (Year listed shown in parenthesis) 411 16 th Street (2004) 301 20 th Street, Nita Fay House (2005) removed from
MARKET WATCH. Market Highlights
 MARKET WATCH Market Highlights Office Total Inventory 362,968,225 SF Total Vacancy Rate 14.10% Average Rate $24.32 PSF YTD Net Absorption 2,081,326 SF Industrial Total Inventory 804,891,880 SF Total Vacancy
Miami-Dade County Retail Market Report 3Q Real Capital Partners Real Estate Services. *Data Source CoStar Miami-Dade County Retail Market Report
 Miami-Dade County Retail Market Report 3Q 216 Real Capital Partners Real Estate Services *Data Source CoStar Miami-Dade County Retail Market Report 3Q 216 Miami-Dade County Retail Market Report Overview
3 RD QUARTER 2015 RICHMOND INDUSTRIAL MARKET REPORT
 3 RD QUARTER FORECAST As the U.S. economy continued to show positive economic growth through the third quarter, the Richmond, VA Industrial market saw demand for warehouse and flex properties increase
INVESTOR PRESENTATION Broad Street Realty, LLC l 1
 INVESTOR PRESENTATION 2018 2018 Broad Street Realty, LLC l 1 BACKGROUND Experts in the complex and challenging world of commercial real estate 2018 Broad Street Realty, LLC l 2 BACKGROUND BROAD STREET
Shelby Corners. Northwest Corner of Hall Road and Schoenherr Road Utica (Detroit MSA), Michigan. Ben Wineman (630)
, Michigan. Ben Wineman (630)") Shelby Corners Northwest Corner of Hall Road and Schoenherr Road Utica (Detroit MSA), Michigan For further information contact owner s exclusive representatives Ben Wineman (630) 954-7336 bwineman@midamericagrp.com
Shelby Corners Northwest Corner of Hall Road and Schoenherr Road Utica (Detroit MSA), Michigan For further information contact owner s exclusive representatives Ben Wineman (630) 954-7336 bwineman@midamericagrp.com
WEST COUNTY MARKETPLACE
 INVESTMENT SUMMARY Retail Investment Opportunity Offering Memorandum WEST COUNTY MARKETPLACE 2004 Veterans Memorial Parkway (Highway 78), Birmingham, AL $5,168,600 9.8% CAP RATE PRESENTED BY: Josh Randolph,
>> Greater Los Angeles Retail Continues to Witness Declining Vacancy
 Research & Forecast Report GREATER LOS ANGELES RETAIL Accelerating success. >> Greater Los Angeles Retail Continues to Witness Declining Vacancy Greater Los Angeles Retail Market The Los Angeles Basin
Las Vegas Valley Executive Summary
 ARROYO MARKET SQUARE Las Vegas Valley Executive Summary Retail Market 4th Quarter 2013 THE DISTRICT AT GREEN VALLEY RANCH January 23, 2014 Re: Commercial Real Estate Survey: 4th Quarter, 2013 Dear Reader,
17th Annual Real Estate Review & Forecast
 2017 17th Annual Real Estate Review & Forecast This Year s Sponsors Member FDIC Construction: Review & Forecast 2017 Page 2 Permits Issued 142 New Commercial Construction Permits issued for all Elkhart
NORFOLK COMMERCE PARK PORTFOLIO
 INVESTMENT OFFERING OPPORTUNITY SEPTEMBER 2018 NORFOLK COMMERCE PARK PORTFOLIO NORFOLK,VA AN INSTITUTIONALLY-SIZED OFFICE/FLEX PORTFOLIO Hampton Roads Military Circle Mall JANAF NORTHAMPTON BLVD. PRINCESS
New and improved approach to retail
 Research & Forecast Report GREENVILLE SPARTANBURG ANDERSON, SC RETAIL Q4 2017 New and improved approach to retail Crystal Baker Research Coordinator South Carolina Key Takeaways > > Rents remain stable
SINGLE TENANT VIRGINIA NNN INVESTMENT OPPORTUNITY POWHATAN ACTUAL SITE
 SINGLE TENANT NNN INVESTMENT OPPORTUNITY POWHATAN VIRGINIA EXCLUSIVELY MARKETED BY JIM SCHUCHERT FIRST VICE PRESIDENT SRS NATIONAL NET LEASE GROUP 610 Newport Center Drive, Suite 1500 Newport Beach, CA
WAKE UNION PLACE WAKE FOREST, NORTH CAROLINA LAND FOR SALE ±65.43 ACRES SITE WAKE FOREST PRESBYTERIAN CHURCH. Smithfield s CHICKEN N BAR-B-Q
 WAKE FOREST, NORTH CAROLINA LAND FOR SALE ±65.43 ACRES WAKE FOREST PRESBYTERIAN CHURCH SITE KEARNEY ROAD CAPITAL BOULEVARD WAKE FOREST CROSSING Smithfield s CHICKEN N BAR-B-Q MARKET OF WAKE FOREST DURHAM
Indianapolis MARKETBEAT. Office Q Economy. Market Overview INDIANAPOLIS OFFICE
 INDIANAPOLIS OFFICE Economic Indicators Market Indicators (Direct, All Classes) Direct Net Absorption/Direct Asking Rent 4-QTR TRAILING AVERAGE Direct Vacancy Q3 17 Q3 18 MSA Employment 1.05M 1.07M MSA
Gaining Traction Gradually in 2018
 Research & Forecast Report RENO OFFICE Q1 2018 Gaining Traction Gradually in 2018 >> Overall vacancy increased slightly to 12.3% >> Negative net absorption of 13,792 square feet >> Rental rates remained
RETAIL MARKET ANALYSIS
 RETAIL MARKET ANALYSIS Portland State University Despite the doom and gloom warnings of a retail apocalypse, the national story for retail is that things are stable. Nationwide vacancy is at 5.2 percent
San Diego County Vol. XX, Issue I Rental Trends Executive Summary March 2007
 Real Estate Research and Consulting for over 25 years Vol. XX, Issue I Rental Trends Executive Summary Editor: Robert D. Martinez- Director of Research s institutional grade rental complexes experienced
Industrial Real Estate Portfolio
 Industrial Real Estate Portfolio Portfolio Coverage Page 7 6565 Echo Avenue, Reno, NV Property Summary Address: Size (SF): Office Finish: HVAC Space: Year Built: 2003 Site Area: 6565 Echo Avenue Reno,
>> Greater Los Angeles Retail Starts 2016 On a Positive Note
 Research & Forecast Report GREATER LOS ANGELES RETAIL Accelerating success. >> Greater Los Angeles Retail Starts 2016 On a Positive Note Greater Los Angeles Retail Market The Los Angeles Basin retail market
Miami-Dade County Retail Market Report 4Q Real Capital Partners Real Estate Services. *Data Source CoStar Miami-Dade County Retail Market Report
 Miami-Dade County Retail Market Report 4Q 216 Real Capital Partners Real Estate Services *Data Source CoStar 4Q 216 Miami-Dade County s Vacancy Decreases to 4.% Net Absorption Positive 1,155,8 SF in the
101 E Washington Street, Ste 400 Greenville, SC Q 18. Market Report
 101 E Washington Street, Ste 400 Greenville, SC 29601 2Q 18 Market Report GREENVILLE/SPARTANBURG 2Q18 OFFICE REPORT * MARKET SUMMARY The Greenville Spartanburg Office market remained fairly steady at the
Westgate Center. Southwest Corner of Division Street & 25th Avenue South St. Cloud, Minnesota
 Westgate Center Southwest Corner of Division Street & 25th Avenue South St. Cloud, Minnesota For further information contact owner s exclusive representatives. Joe Girardi 630.954.7392 j.girardi@midamericagrp.com
HISTORICAL VACANCY VS RENTS $1.75 2Q10 2Q11 2Q12 2Q13 2Q14
 www.colliers.com/greaterlosangeles RETAIL GREATER LOS ANGELES BASIN MARKET REPORT Vacancy Decreases and Net Absorption Increases From Previous Quarter MARKET INDICATORS - VACANCY 6. NET ABSORPTION 732,000
INDUSTRIAL QUICK STATS SUMMARY & OUTLOOK MARKET TRENDS VACANCY & NET ABSORPTION ECONOMIC STATS. Current Quarter. Direct Vacancy 2.
 ORANGE COUNTY INDUSTRIAL SECOND QUARTER 218 QUICK STATS Direct Vacancy 2.2% Overall Vacancy 2.5% Lease Rate NNN $.95 Gross Absorption Under Construction MARKET TRENDS Current Quarter 2,956,71 SF 1,367,18
INVESTMENT OVERVIEW PROPERTY OVERVIEW MAJOR TENANTS
 OFFERING SUMMARY INVESTMENT OVERVIEW HFF is pleased to exclusively offer 5000 South Hulen (the Property ), a 86,943 square foot shopping center located within the most established and recognized retail
Catawba Area Plan Market Analysis. Prepared for: Catawba Area Plan Citizen Advisory Group October 23, 2008
 Catawba Area Plan Market Analysis Prepared for: Catawba Area Plan Citizen Advisory Group October 23, 2008 Completed Development Almost 98% of the housing units are single-family. There are currently no
Washington DC Market Office Report
 Washington DC Market Office Report Market Overview The Office Market The Washington Office Market includes the District of Columbia and adjacent suburban submarkets in Maryland and Virginia. The Washington
Riverstone Marketplace II
 Riverstone Marketplace II VANCOUVER, WASHINGTON EXCELLENT SYNERGY WITH SEVERAL NATIONAL BRANDS INCLUDING NATURAL GROCERS, BANK OF AMERICA, AND PROVIDENCE MEDICAL PLAZA Overview Riverstone Marketplace
ACTUAL SITE. Shops At Highpointe Park Plaza Thornton, CO
 Shops At Highpointe Park Plaza Thornton, CO CONTENTS 2 CONTENTS INVESTMENT SUMMARY...3 HIGHLIGHTS...4 PROPERTY DESCRIPTION...5 AERIAL VIEW & SITE PLAN...6 AREA OVERVIEW...12 ROLL...13 PRICING SUMMARY...14
Year-End 2017 / Office Market Report. Regional Economic Activity
 Year-End 207 / Office Market Report County Market Facts 27.6 MSF Total inventory in the County office market 793,46 SF Direct net absorption for 207.42% Overall Vacancy $43.36 PSF Average asking lease
For Lease. Center Oak Plaza 1119 Johnnie Dodds Blvd Mount Pleasant, South Carolina LOCATED IN THE HEART OF MOUNT PLEASANT
 For Lease Center Oak Plaza 1119 Johnnie Dodds Blvd Mount Pleasant, South Carolina 29464 LOCATED IN THE HEART OF MOUNT PLEASANT For More Information, Contact: Vitré Ravenel Stephens Senior Vice President
Los Angeles Basin Retail Market Continues To Witness Decreasing Vacancy Rates
 RETAIL GREATER LOS ANGELES BASIN MARKET REPORT Continues To Witness Decreasing Vacancy Rates MARKET INDICATORS - VACANCY 6. NET ABSORPTION 588,800 CONSTRUCTION 3,312,470 RENTAL RATE $2.04 P NNN UNEMPLOYMENT
MONTGOMERY TRACE CENTER EVA ST. MONTGOMERY, TX 77356
 FOR SALE $10,675,000 8.0 % CAP RATE A GROCERY A GROCERY ANCHORED ANCHORED NEIGHBORHOOD SHOPPING SHOPPING CENTER CENTER FOR MORE INFORMATION CONTACT: Jeff Tinsley Jeff Beard, CCIM 92% OCCUPOIED OCCUPIED
INDUSTRIAL QUICK STATS SUMMARY & OUTLOOK MARKET TRENDS VACANCY & NET ABSORPTION ECONOMIC STATS
 PHOENIX, ARIZONA INDUSTRIAL THIRD QUARTER 217 QUICK STATS Direct Vacancy 8.7% Overall Vacancy 9.% Lease Rate NNN $.54 Gross Absorption Under Construction MARKET TRENDS Current Quarter 5,991,128 SF 4,751,494
1Q 17. Long Island Market Report
 1Q 17 Long Island Market Report Long Island Office 1Q 217 Long Island 1Q17 Office Office Report The Long Island Office market ended the first quarter 217 with a vacancy rate of 7.1%. The vacancy rate was
Los Angeles Basin Retail Market Witnessed A Slight Increase In Vacancy Rates
 RETAIL GREATER LOS ANGELES BASIN MARKET REPORT Witnessed A Slight Increase In Vacancy Rates MARKET INDICATORS - VACANCY 6.2% NET ABSORPTION -551,200 CONSTRUCTION 1,946,000 RENTAL RATE $1.96 P NNN UNEMPLOYMENT
Indianapolis MARKETBEAT. Office Q Economy. Market Overview INDIANAPOLIS OFFICE
 INDIANAPOLIS OFFICE Economic Indicators Q2 17 Q2 18 MSA Employment 1.1M 1.1M MSA Unemployment 3.3% 3.0% U.S. Unemployment 4.3% 3. Market Indicators (Direct, All Classes) Q2 17 Q2 18 Total Market Vacancy
Houston Summer Retail. Office. July 2016 Commercial Markets. Independent Valuations for a Variable World Page 1. Summary Q1 Statistics
 July 2016 Commercial Markets In This Issue Commercial Markets Retail Office Industrial Multifamily Housing Trends Single Family Housing Lot Supply & New Home Data % 10% 8% 6% 4% 2% 0% Retail 2007 Q1 2008
Reno, NV UNIVERSITY OF NEVADA, RENO DOWNTOWN RENO MIDTOWN. S Virginia St. Washoe s Wurst. S Wells Ave OFFERING MEMORANDUM GREATER NEVADA FIELD
 DOWNTOWN UNIVERSITY OF NEVADA, GREATER NEVADA FIELD MIDTOWN S Virginia St Washoe s Wurst S Wells Ave SITE RENDERING OFFERING MEMORANDUM Washoe s Wurst Reno, NV TABLE OF CONTENTS PROPERTY HIGHLIGHTS 1 PROPERTY
Year End Deliveries Drive Leasing Activity In the Raleigh-Durham Market
 Research Report RALEIGH-DURHAM OFFICE Q4 2018 Accelerate Success Year End Deliveries Drive Leasing Activity In the Raleigh-Durham Market Kelsey Rogers Senior Research Analyst Raleigh-Durham Market Indicators
SINGLE TENANT STATESVILLE INVESTMENT OPPORTUNITY NORTH CAROLINA ACTUAL SITE
 SINGLE TENANT INVESTMENT OPPORTUNITY STATESVILLE NORTH CAROLINA ACTUAL SITE EXCLUSIVELY MARKETED BY: JIM SCHUCHERT FIRST VICE PRESIDENT SRS NATIONAL NET LEASE GROUP 610 Newport Center Drive, Suite 1500
2015 FORT WAYNE, INDIANA RETAIL MARKET SURVEY
 215 FORT WAYNE, INDIANA RETAIL MARKET SURVEY REVIEW FORECAST PREPARED WITH THE ASSISTANCE OF The period of October 214 - June 215 was an active time for retail transactions in the Fort Wayne area; however,