INDUSTRIAL. Acknowledgements MARKET SURVEY. Author. Data Preparation. Survey Coordination. Financial Support HAMPTON ROADS.
|
|
|
- Thomasina Houston
- 5 years ago
- Views:
Transcription
 functions and reports are funded by donations from individuals, organizations and the CREED Advisory Board.")
1 INDUSTRIAL 2007 HAMPTON ROADS MARKET SURVEY Acknowledgements Author Billy King, SIOR Data Preparation Stephanie Sanker Survey Coordination Clay Culbreth, CCIM, SIOR Financial Support The E. V. Williams Center for Real Estate and Economic Development (CREED) functions and reports are funded by donations from individuals, organizations and the CREED Advisory Board. Statistical data provided by Society of Office and Industrial Realtors (SIOR) Comparative Statistics Market Survey. Research data provided by Real Capital Analytics through Sperry Van Ness.
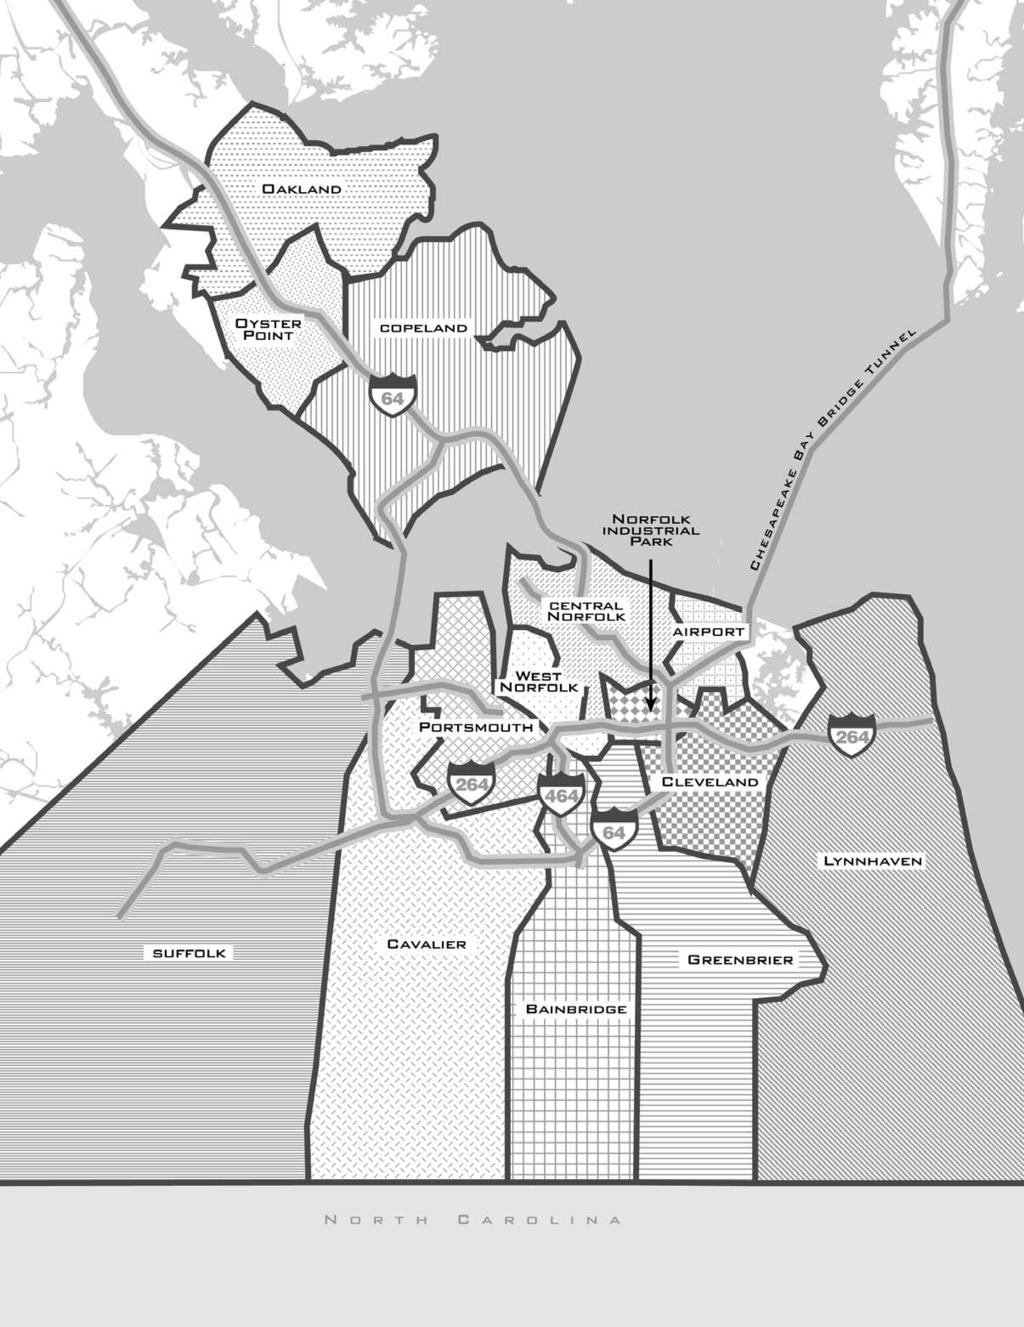
2 2007 INDUSTRIAL General Overview This report analyzes the 2006 industrial real estate conditions within the Virginia Beach-Norfolk-Newport News, VA-NC Metropolitan Statistical Area (the MSA ) that is also known as Hampton Roads. It provides inventory, vacancy, rent, sale and other data for the MSA. The survey includes properties in the cities of Chesapeake, Hampton, Newport News, Norfolk, Poquoson, Portsmouth, Suffolk, Virginia Beach, and Williamsburg, plus the counties of Gloucester, James City, York and Isle of Wight. METHODOLOGY This survey includes the following types of properties: Office-warehouse, industrial and shop facilities of 5,000 square feet or greater, although some facilities of less than 5,000 square feet may be included. Properties must have less than 80% office space to be included in the SIOR/ODU survey. Both owner-occupied and leased properties are included. Owner-occupied is defined as a property that is 100% occupied by a business that is the same as or is related to the owner of the building. All properties that are available and are listed for sale or lease regardless of whether they are occupied, unless they are strictly available for sale as an investment property. For example, a property that is available for sale and is currently occupied on a short-term lease is included. All properties that have commenced construction (foundations installed minimum). The survey excludes the following types of properties: Land Warehouse or shop facilities on shipyard properties Warehouse or other industrial facilities on federal government property (e.g., military installations) Industrial facilities on government property (e.g., Norfolk International Terminal, Newport News Marine Terminal) Functional submarket delineations are determined with minimal regard to city boundaries. The entire market is divided into 16 submarkets defined by industrial building concentrations, the transportation network, and pertinent physical features. The area map included in this report provides a location key for reference. The E. V. Williams Center for Real Estate and Economic Development (CREED) has been tracking the inventory of the Hampton Roads industrial market since The results of the 2007 survey collected during the 4th quarter of 2006 indicate that the Hampton Roads industrial market currently encompasses 100,237,510 total square feet of space located in 2,699 buildings throughout the Region. This is an increase of 3,410,235 square feet, or 3.51% from the last year s survey. The increase is primarily due to expansions of existing buildings and new construction started in the marketplace. As a counter to these increases, there was an elimination of buildings that were demolished or converted to alternative uses (multi-family and retail) INDUSTRIAL 30
3 HAMPTON ROADS OVERVIEW As part of the SIOR National Industrial Survey, the Hampton Roads industrial market is within the South-Atlantic region of the United States, which includes twenty-seven major submarkets spanning from Maryland through Florida. This year, Hampton Roads vacancy rate increased to 5.87% from 5.21% in last year s survey. Last year (2005) was the lowest vacancy rate that has been recorded for the area since the survey started in This year s 2006 vacancy rate of 5.87% is still a historically low rate. The vacancy rate was up in 11 out of 16 area submarkets covered, with 5 submarkets down as compared to Total Hampton Roads market absorption this year was 2.80% or 2,566,823 square feet, as compared with 2.03% (1,826,089 square feet) in This represents a 38% increase in absorption. If 2005 could be termed a break-through year for our Hampton Roads Market, this year was commitment year for Hampton Roads. This is signified by 1) the start-up and substantial completion of 7 major speculative industrial/distribution projects, including high-bay and bread and butter office-warehouse projects and 2) the continuing escalation of lease rates in existing buildings for the vast majority of the market that is served adequately by their existing space. Sale prices of user (owner-occupied) properties continued to escalate beyond even the prices experienced in a remarkable The speculative projects started and substantially completed and referred to above are summarized as follows: 1. Indian River Distribution Center by Ashley Capital 230,741 square feet 2. Enterchange No. 1 - Hampton by Schneider National and Devon Group 243,219 square feet 3. Northgate Logistics Center by George Powers 300,000 square feet 4. Waverton Industrial Village by Waverton Properties 58,800 square feet 5. Shirley T. Holland Commerce Center by Johnson Development 329,766 square feet 6. Chesapeake Industrial Center by West Essex Management 186,000 square feet 7. Bridgeway Commerce Center III by Liberty Property Trust 168,000 square feet Total New Projects Completed and Under Construction 1,515,726 square feet Two projects that had been announced in last year s survey that were not built are the South Suffolk Distribution project by Triumph and the 14 acre Trade Street distribution project in Chesapeake. Overall, 2006 was a quieter year for industrial investment sales, as compared with the watershed year of Among the investment projects trading hands were the First Data Corp property, a 54,000 square feet former user property in Greenbrier which sold as a high-end flex building to First Potomac Realty Trust, and the 90,000 square foot Woodlake Distribution Center, also in Greenbrier, which was sold to a local investor. On the Peninsula in Hampton, the West Park Project of 515,485 square feet (2 buildings) was sold to High Street Equity Advisors for $32,300,000 ($62.47/square feet) Industrial leasing highlights included the following: Lease of the former Dan River Inc. warehouse in PortCentre Commerce Park, Portsmouth to Massimo Zannetti Beverage USA (228,000 square feet) Expansion of Laufen Tiles at Commonwealth Storage (120,000 square feet) Lease by Barton Mines in Chesapeake on Diamond Hill Road (D.D. Jones/First Potomac Realty Trust) (100,000 square feet) Lease of Givens, Inc. at 400 Woodlake Circle, Chesapeake (80,500 square feet) Lease of NYK Logistics to kick-off major Norfolk Logistics Center project in Chesapeake (130,000 square feet) Lease of former Dana Corp. space at Bridgeway Commerce I, Suffolk by Walker International (3PL) (80,000 square feet) 31
4 2007 INDUSTRIAL The breakdown of available space by unit size continues to change from year to year. The most recognizable change in the past year has been a decrease in the smaller spaces available (5,000 20,000 sf), as well as an increase in the largest units (greater than 60,000 sf). The percentages of buildings that are available in each size range are as follows: PERCENTAGE OF AVAILABLE BUILDING BY SIZE RANGE Begin Size (SF) < 5,000 30% 15% 32% 25% 30% 25% 5,000-20,000 40% 52% 44% 40% 42% 30% 20,000-40,000 15% 18% 12% 15% 13% 15% 40,000-60,000 9% 8% 7% 8% 6% 10% > 60,000 6% 7% 5% 12% 9% 20% Industrial land sale highlights included: usable acres purchased in Northgate Commerce Park by a local development partnership at $932,215 or $89,808 per acre. 34 acres purchased on Yadkin Road, east of Cavalier Park in Chesapeake, by ProLogis at $5,780,000+ or $170,000 per acre for The Norfolk Logistics Center acre Glenn site on Kenyon Road, Suffolk bought by McDonald Windward Partners for $2,350,000 ($20,506/Acre) acres purchased by the City of Suffolk at 803 Carolina Road for $1,188,714 ($21,532/Acre). Availability of lease space in the larger size ranges (above 40,000 square feet) was pushed up considerably this year because of the delivery of several new large, high-bay buildings noted above. For Sale opportunities continued to be scarce in all size ranges. As mentioned above, land availability is extremely limited in close-in, central core portions of the Hampton Roads market. This continues to push developers and users to consider and to execute purchases in such outlying submarkets as Suffolk and Isle of Wight. Average market asking rents for small spaces (less than 20,000 square feet) rose substantially during Rates for larger spaces were strong and not yet negatively impacted by the availability of the new projects noted above. This should change in 2007 and Also, an increase in asking rents for all size units is reflective of the decrease in the overall availability. The variance between asking lease rates and final negotiated rates, highly dependent on the age and location of a particular building, has been between 0% and 10% in RENTS FOR AVAILABLE BUILDING BY SIZE RANGE Begin Size (SF) < 5,000 $6.34 $7.16 $6.95 $7.30 $7.75 $7.85 5,000-20,000 $4.46 $5.80 $5.89 $6.20 $6.50 $ ,000-40,000 $4.35 $4.99 $5.21 $5.45 $5.75 $ ,000-60,000 $4.15 $4.13 $4.44 $4.75 $4.95 $5.00 > 60,000 $3.24 $3.43 $3.15 $4.00 $4.30 $ INDUSTRIAL 32
5 SALES OVERVIEW The 2006 sales activity for industrial buildings continued to show price escalations even as compared with Industrial building sales prices predominated in the $35 p.s.f. to $65 p.s.f. range. There were sales that were finalized higher in the $95 p.s.f. to $135 p.s.f. range, as a result of either high-end location, developed yard or surplus land area. Available modern industrial buildings for purchase remained very hard to find in 2006 in all size ranges. PERCENTAGE OF AVAILABLE BUILDING BY SIZE RANGE DATE LOCATION SQ. FT. PRICE $/SF ACRES 2/06 Verizon 31,000 $880,000 $ /06 Viasys 10,293 $1,400,000 $ /06 Sherwin-Williams 16,000 $800,000 $ /06 First Data 54,000 $5,100,000 $ /06 L.A. Services 48,800 $2,200,000 $ /06 IBS America 14,400 $915,000 $ /06 American Road Markings 21,334 $550,000 $ Rent Basis: NNN 33
6

7 INDUSTRIAL SUBMARKETS Southside Suffolk Portsmouth West Norfolk Central Norfolk Cavalier Bainbridge Norfolk Industrial Park Airport Industrial Park Greenbrier Cleveland Lynnhaven Peninsula Copeland Oakland Oyster Point Williamsburg Extended 35
INDUSTRIAL. Acknowledgements. Author: Billy King, SIOR. Data Preparation: Stephanie Sanker. Survey Coordination Clay Culbreth, CCIM, SIOR
 HAMPTON ROADS 2006 INDUSTRIAL M A R K E T S U R V E Y Acknowledgements Author: Billy King, SIOR Data Preparation: Stephanie Sanker Survey Coordination Clay Culbreth, CCIM, SIOR Financial Support: The E.
INDUSTRIAL. Stephanie Sanker, SIOR, CCIM. Stephanie Sanker, SIOR, CCIM
 2011 HAMPTON ROADS REAL ESTATE MARKET REVIEW INDUSTRIAL Author Data Preparation Survey Coordination William C. Throne, SIOR, CCIM, ALC Vice President, Cushman & Wakefield/THALHIMER Stephanie Sanker, SIOR,
REAL ESTATE MARKET REVIEW
 MULTIFAMILY 2014 HAMPTON ROADS REAL ESTATE MARKET REVIEW Author Charles Dalton Data Analysis Real Data Financial Support The E.V. Williams Center for Real Estate and Economic Development (CREED) functions
MULTI-FAMILY DEFINITIONS. Acknowledgements. The following terminology and sources are used in the CREED Apartment Report:
 DEFINITIONS The following terminology and sources are used in the CREED Apartment Report: Absorption Net change in occupied units within comparable communities within a specific time frame. New units that
Multi-Family. Acknowledgements. Author. Data Analysis/ Layout. Financial Support. Disclosure. Charles Dalton. Real Data
 Multi-Family Acknowledgements Author Charles Dalton Data Analysis/ Layout Real Data Financial Support Disclosure The E. V. Williams Center for Real Estate and Economic Development (CREED) functions and
MULTIFAMILY 2012 MULTI-FAMILY HAMPTON ROADS MARKET REVIEW. Author. Data Analysis. Financial Support. Disclosure. Charles Dalton.
 HAMPTON ROADS MARKET REVIEW MULTIFAMILY Author Data Analysis Financial Support Disclosure Charles Dalton Real Data The E. V. Williams Center for Real Estate and Economic Development (CREED) functions and
INVESTMENT. Acknowledgements. Authors: Jonathan Guion, SIOR Senior Advisor Sperry Van Ness Commercial Real Estate Advisors
 HAMPTON ROADS 2006 INVESTMENT M A R K E T S U R V E Y Acknowledgements Authors: Jonathan Guion, SIOR Senior Advisor Sperry Van Ness Commercial Real Estate Advisors 87 2006 INVESTMENT GENERAL OVERVIEW T
INVESTMENT. Acknowledgements MARKET SURVEY. Author HAMPTON ROADS
 INVESTMENT 2007 HAMPTON ROADS MARKET SURVEY Acknowledgements Author Jonathan Guion, SIOR Managing Director Sperry Van Ness Commercial Real Estate Advisors 2007 INVESTMENT General Overview This report analyzes
Residential. Acknowledgements. Author Data Analysis/ Layout. Financial Support. Disclosure. Blair Hardesty Director Residential DataBank
 Residential Acknowledgements Author Data Analysis/ Layout Financial Support Disclosure Blair Hardesty Director Residential DataBank The E. V. Williams Center for Real Estate and Economic Development (CREED)
INDUSTRIAL QUICK STATS SUMMARY & OUTLOOK MARKET TRENDS VACANCY & NET ABSORPTION ECONOMIC STATS
 PHOENIX, ARIZONA INDUSTRIAL THIRD QUARTER 217 QUICK STATS Direct Vacancy 8.7% Overall Vacancy 9.% Lease Rate NNN $.54 Gross Absorption Under Construction MARKET TRENDS Current Quarter 5,991,128 SF 4,751,494
3 RD QUARTER 2015 RICHMOND INDUSTRIAL MARKET REPORT
 3 RD QUARTER FORECAST As the U.S. economy continued to show positive economic growth through the third quarter, the Richmond, VA Industrial market saw demand for warehouse and flex properties increase
MARKET WATCH SOUTHERN CALIFORNIA & PHOENIX
 SOUTHERN CALIFORNIA & PHOENIX COMMERCIAL REAL ESTATE MARKET FOURTH QUARTER 217 MARKET WATCH SOUTHERN CALIFORNIA & PHOENIX 1.888.659.DAUM WWW.DAUMCOMMERCIAL.COM D/AQ Corp. # 1129558 DAUM TABLE OF CONTENTS
Old Dominion University Hampton Roads Real Estate Market Review and Forecast 2005
 Old Dominion University Hampton Roads Real Estate Market Review and Forecast 2005 Presented by: The Center for Real Estate and Economic Development Real Estate Centers University of Pennsylvania Samuel
MARKETBEAT INDUSTRIAL SNAPSHOT
 9.1 4.9 7.3 4.5 7. 1.3 8.1 1.3 1.7.3 msf MARKETBEAT INDUSTRIAL SNAPSHOT LAS VEGAS, NV A Cushman & Wakefield Alliance Research Publication Q1 215 ECONOMIC OVERVIEW The U.S. economy continued to add jobs
RESIDENTIAL. Acknowledgements 2008 HAMPTON ROADS REAL ESTATE MARKET REVIEW. Author Bea Hopkins Director Residential DataBank
 ODU-MarketReview2008-FINAL2:ODUMarketReview2005 2/14/08 11:53 AM Page 57 RESIDENTIAL 2008 HAMPTON ROADS REAL ESTATE MARKET REVIEW Acknowledgements Author Bea Hopkins Director Residential DataBank Data
3 RD QUARTER 2016 RICHMOND INDUSTRIAL MARKET REPORT
 3 RD QUARTER 2016 RICHMOND INDUSTRIAL MARKET REPORT FORECAST The Richmond Industrial market continued trending in the positive direction in the third quarter, with the absorption of over 320,000 square
OFFICE QUICK STATS SUMMARY & OUTLOOK MARKET TRENDS VACANCY & NET ABSORPTION ECONOMIC STATS
 INLAND EMPIRE OFFICE THIRD QUARTER 217 QUICK STATS Direct Vacancy 11.4% Overall Vacancy 11.7% Lease Rate FSG $1.83 Gross Absorption Under Construction MARKET TRENDS Current Quarter 529,634 SF 45,24 SF
INDUSTRIAL QUICK STATS SUMMARY & OUTLOOK MARKET TRENDS VACANCY & NET ABSORPTION ECONOMIC STATS. Current Quarter. Direct Vacancy 2.
 LOS ANGELES NORTH INDUSTRIAL THIRD QUARTER 218 QUICK STATS Direct Vacancy 2.3% Overall Vacancy 2.6% Lease Rate NNN $1.1 Gross Absorption Under Construction MARKET TRENDS Current Quarter 1,632,564 SF 595,199
INDUSTRIAL QUICK STATS SUMMARY & OUTLOOK MARKET TRENDS VACANCY & NET ABSORPTION ECONOMIC STATS
 ORANGE COUNTY INDUSTRIAL FOURTH QUARTER 217 QUICK STATS Direct Vacancy 2.3% Overall Vacancy 2.7% Lease Rate NNN $.91 Gross Absorption Under Construction MARKET TRENDS Current Quarter 4,283,991 SF 963,138
Economic growth driving tighter market conditions
 Metro Philadelphia Industrial, 217 Economic growth driving tighter market conditions Net Absorption 1.8 Million sq. ft. Vacancy Rate 5.4% Asking Lease Rate (NNN) $4.35 Development 2.2 Million sq. ft. Figure
INDUSTRIAL QUICK STATS SUMMARY & OUTLOOK MARKET TRENDS VACANCY & NET ABSORPTION ECONOMIC STATS
 VENTURA COUNTY INDUSTRIAL FOURTH QUARTER 217 QUICK STATS Direct Vacancy 2.1% Overall Vacancy 2.4% Lease Rate NNN $.7 Gross Absorption Under Construction MARKET TRENDS Current Quarter 1,332,957 SF 774,362
Inside Business. Old Dominion University Hampton Roads Real Estate Market Review and Forecast. Executive Committee. Programs Committee
 Old Dominion University Hampton Roads Real Estate Market Review and Forecast Presented by: The Center for Real Estate and Economic Development Executive Committee Melody Bobko Ron Bray Craig Cope John
OFFICE QUICK STATS SUMMARY & OUTLOOK MARKET TRENDS VACANCY & NET ABSORPTION ECONOMIC STATS
 ORANGE COUNTY OFFICE THIRD QUARTER 217 QUICK STATS Direct Vacancy 12.1% Overall Vacancy 12.9% Lease Rate FSG $2.61 Gross Absorption Under Construction MARKET TRENDS Current Quarter 2,479,293 SF 379, SF
CoStar Industrial Statistics. Y e a r - E n d Brownsville/Harlingen Industrial Market
 CoStar Industrial Statistics Y e a r - E n d 2 0 1 7 Brownsville/Harlingen Industrial Market Brownsville/Harlingen Industrial Market Year-End 2017 Brownsville/Harlingen Table of Contents Table of Contents.................................................................
WINTER 2016 OMAHA, NEBRASKA INDUSTRIAL MARKET REPORT
 WINTER 2016 OMAHA, NEBRASKA INDUSTRIAL MARKET REPORT By Kevin Stratman OMAHA S THRIVING INDUSTRIAL MARKET SHOWS NO SIGNS OF SLOWING DOWN It is difficult to find one aspect of the Omaha industrial market
INDUSTRIAL QUICK STATS SUMMARY & OUTLOOK MARKET TRENDS VACANCY & NET ABSORPTION ECONOMIC STATS. Current Quarter. Direct Vacancy 2.
 ORANGE COUNTY INDUSTRIAL SECOND QUARTER 218 QUICK STATS Direct Vacancy 2.2% Overall Vacancy 2.5% Lease Rate NNN $.95 Gross Absorption Under Construction MARKET TRENDS Current Quarter 2,956,71 SF 1,367,18
Metropolitan Milwaukee Office Market Report Third Quarter 2015
 Metropolitan Milwaukee Office Market Report Third Quarter 2015 RETAIL OFFICE INDUSTRIAL LAND INVESTMENT NAI MLG COMMERCIAL 414 347 9400 757 N BROADWAY, SUITE 700, MILWAUKEE, WI 53202 MLGCOMMERCIAL.COM
Homestretch: Office Market Set to Finish Strong
 Research & Forecast Report RENO OFFICE Q3 2016 Homestretch: Office Market Set to Finish Strong >> Vacancy drops significantly the largest drop quarter over quarter in 2016 >> Rental rates are not increasing
Miami-Dade County Office Market Report 1Q Real Capital Partners Real Estate Services
 -Dade County Office Report 1Q 216 Real Capital Partners Real Estate Services 1Q 216 -Dade County Office Report Overview -Dade County s Vacancy Increases to 1.4% Net Negative (11,64) SF in the Quarter The
Monthly Market Snapshot
 SEPTEMBER 2018 Vacancy continues to fall. Nearing the end of the third quarter, the vacancy rate dropped 10 basis points to 6.4%, compared to this time last month at 6.5%. Occupancy of the 1.1 million
Second Quarter: Suburban Maryland s Uptick in Leasing has yet to be Realized in Absorption Numbers
 Q2 2013 OFFICE SUBURBAN MARYLAND SUBURBAN MARYLAND MARKET REPORT Second Quarter: Suburban Maryland s Uptick in has yet to be Realized in Numbers Updated May 2012 MARKET INDICATIONS Q2 2013 Q3 2013 (p)
HOUSTON INDUSTRIAL MARKET
 REAL ESTATE OUTLOOK HOUSTON INDUSTRIAL MARKET FIRST QUARTER 217 Industrial Sector Continues Push Forward Flex Market Softening under Pressure from Office Market Availability OV E R V I E W Industrial gains
January 2018 longandfoster.com
 January 218 longandfoster.com 78 -2% % % 7% 1% 3% 4% % 3% 2% 4% 4% 3% 3% 7% 9% 11% 13% 1 1% % - Median Sale Price Percent Change Year/Year 79 $219, $212,25 $225, $237, $226, $232, $24,75 $234,3 $238,625
Colliers International 6250 N. River Road Suite Rosemont, IL Phone Fax No warranty or representation is made
 Colliers International 6250 N. River Road Suite 11-100 Rosemont, IL 60018 Phone 847 698 8444 Fax 847 698 8445 O Hare Quarter in Review» The O'Hare submarket continues to set new vacancy records. Significant
Industrial Snapshot 2Q 2016
 CHARLOTTE INDUSTRIAL Warehouse Market Indicators Warehouse Net Absorption/Asking Rent 4Q TRAILING AVERAGE 1,800 1,600 1,400 1,200 1,000 800 600 400 200 0-200 2011 2012 2013 2014 2015 2016 Net Absorption,
CoStar Industrial Statistics. Y e a r - E n d McAllen/Edinburg/Pharr Industrial Market
 CoStar Industrial Statistics Y e a r - E n d 2 0 1 7 McAllen/Edinburg/Pharr Industrial Market Year-End 2017 McAllen/Edinburg/Pharr Table of Contents Table of Contents.................................................................
MARKET REPORT FIRST QUARTER Market Ripe for Speculative Construction Falling Demand for Obsolete Product Not Indicative of Market Health
 SHENANDOAH MARKET REPORT VALLEY Q1 2015 NORTH SHENANDOAH INDUSTRIAL VALLEY NORTH INDUSTRIAL MARKET REPORT FIRST QUARTER 2015 Market Ripe for Speculative Falling Demand for Obsolete Product Not Indicative
Sarasota-Manatee, FL 3rd Quarter 2015 INDUSTRIAL. Market Trends COMMERCIAL REAL ESTATE INFORMATION
 Sarasota-Manatee, FL 3rd Quarter 2015 INDUSTRIAL Market Trends COMMERCIAL REAL ESTATE INFORMATION Table of Contents/Methodology of Tracked Set Table of Contents/Methodology of Tracked Set Sarasota-Manatee
Houston Summer Retail. Office. July 2016 Commercial Markets. Independent Valuations for a Variable World Page 1. Summary Q1 Statistics
 July 2016 Commercial Markets In This Issue Commercial Markets Retail Office Industrial Multifamily Housing Trends Single Family Housing Lot Supply & New Home Data % 10% 8% 6% 4% 2% 0% Retail 2007 Q1 2008
SALT LAKE CITY MARKET
 INDUSTRIAL SALT LAKE CITY MARKET FOURTH QUARTER 2017 Year-End 2017 Salt Lake City Table of Contents Table of Contents................................................................. A Methodology......................................................................
MAR KET GLANCE SAN DIEGO OFFICE MARKET REPORT PROPERTY SERVICES DEVELOPMENT INVESTMENT FOURTH QUARTER 2015 PROPERTY SERVICES DEVELOPMENT INVESTMENT
 AT A SAN DIEGO OFFICE MARKET REPORT FOURTH QUARTER 215 AT A NEW SUPPLY PUSHES VACANCY RATES HIGHER San Diego s regional economy has been buzzing and added a net total of 37,8 jobs in the 12 months ending
TRANSWESTERN OUTLOOK DC AT Q1O8
 TRANSWESTERN OUTLOOK DC AT Q1O8 Even With Soft Office Absorption, Vacancy Remains Low; Rents Continue to Edge Up The District of Columbia s office market experienced steady conditions during the 1st quarter
Tenant: Address: Size (SF): Submarket: NYK Logistics (Americas), Inc Victor Hill Road 100,000 Spartanburg
: Submarket: NYK Logistics (Americas), Inc Victor Hill Road 100,000 Spartanburg") NAI Earle MEMBER Furman, NAME LLC Industrial Office Report Report First Second Quarter Quarter 2007 2009 Upstate Market TRENDS: STATISTICS: Vacancy Rate Net Absorption Construction Number of Buildings...3,910
NAI Earle MEMBER Furman, NAME LLC Industrial Office Report Report First Second Quarter Quarter 2007 2009 Upstate Market TRENDS: STATISTICS: Vacancy Rate Net Absorption Construction Number of Buildings...3,910
The CoStar Office Report. T h i r d Q u a r t e r Greensboro/Winston-Salem Office Market
 The CoStar Office Report T h i r d Q u a r t e r 2 0 1 4 Greensboro/Winston-Salem Office Market Third Quarter 2014 Greensboro/Winston-Salem Table of Contents Table of Contents.................................................................
OFFICE QUICK STATS SUMMARY & OUTLOOK MARKET TRENDS VACANCY & NET ABSORPTION ECONOMIC STATS
 LOS ANGELES SAN GABRIEL VALLEY OFFICE SECOND QUARTER 218 QUICK STATS Direct Vacancy 11.1% Overall Vacancy 11.4% Lease Rate FSG $2.32 Gross Absorption Under Construction MARKET TRENDS Current Quarter 345,68
The Improvement of the Industrial Market
 Research & Forecast Report Long Island industrial MARKET Q2 2015 The Improvement of the Industrial Market Rose Liu Research & Financial Analyst Long Island Takeaways The overall economy on Long Island
Nashville the #5 Market to Watch in 2019
 Research & Forecast Report NASHVILLE INDUSTRIAL 4 th Quarter Nashville the #5 Market to Watch in 2019 Industrial Market The industrial real estate sector is currently undergoing one of the greatest expansionary
Industrial Outlook. An in-depth look at the Louisville industrial market. Analysis includes leasing, sales, construction and employment.
 Industrial Outlook Louisville An in-depth look at the Louisville industrial market. Analysis includes leasing, sales, construction and employment. JLL Research Insight Industrial market quick out of the
MARKET UPDATE Q4 2018
 THE KLABIN COMPANY MARKET UPDATE Q4 2018 SOUTH BAY LOS ANGELES THE KLABIN COMPANY KLABIN.COM A TRADITION OF TRUST HOT TOPICS 1 Full Employment 2 Falling Interest Rates 3 Trade War 4 Lack of Supply 5 Credit
Indianapolis MARKETBEAT. Office Q Economy. Market Overview INDIANAPOLIS OFFICE
 INDIANAPOLIS OFFICE Economic Indicators Market Indicators (Direct, All Classes) Direct Net Absorption/Direct Asking Rent 4-QTR TRAILING AVERAGE Direct Vacancy Q3 17 Q3 18 MSA Employment 1.05M 1.07M MSA
Upstate, SC 1Q16. Industrial Market Report. Industrial. Upstate Economy in 1Q16* Industrial Sector in 1Q16. Trends for 1Q16
 Market Report The industrial market for the Upstate of South Carolina saw continued growth for the first quarter of 2016. While there was a positive net absorption of 1,024,708/SF, the Upstate industrial
INDUSTRIAL MARKET REPORT. San Antonio. 4th Quarter Q4 Market Trends 2016 by Xceligent, Inc. All Rights Reserved
 INDUSTRIAL MARKET REPORT San Antonio 4th Quarter 2015 Table of Contents/ Methodology of Tracked Set Xceligent is a leading provider of verified commercial real estate information which assists real estate
Strong Industry and Robust Development Benefit Industrial Market at Mid-Year 2016
 Research & Forecast Report NASHVILLE INDUSTRIAL 2nd Quarter 2016 Strong Industry and Robust Development Benefit Industrial Market at Mid-Year 2016 2Q 2016 Summary > > The tightening market coupled with
The CoStar Industrial Report
 The CoStar Industrial Report F I R S T Q U A R T E R 2 0 1 1 Miami-Dade County Industrial Market Miami-Dade County Industrial Market FIRST QUARTER 2011 MIAMI-DADE COUNTY Table of Contents Table of Contents....................................................................
OFFICE QUICK STATS SUMMARY & OUTLOOK MARKET TRENDS VACANCY & NET ABSORPTION ECONOMIC STATS
 LOS ANGELES CENTAL/SOUTHEAST OFFICE THIRD QUARTER 218 QUICK STATS Direct Vacancy 14.7% Overall Vacancy 15.2% Lease Rate FSG $3.16 Gross Absorption Under Construction MARKET TRENDS Change from Last Quarter
OFFICE QUICK STATS SUMMARY & OUTLOOK MARKET TRENDS VACANCY & NET ABSORPTION ECONOMIC STATS
 VENTURA COUNTY OFFICE THIRD QUARTER 217 QUICK STATS Direct Vacancy 13.9% Overall Vacancy 14.3% Lease Rate FSG $2.25 Gross Absorption Under Construction MARKET TRENDS Current Quarter 34,43 SF 18,112 SF
INDUSTRIAL REAL ESTATE TRENDS
 INDUSTRIAL REAL ESTATE TRENDS Presented to: 2015 CCIM Commercial Real Estate Outlook Conference Presented by: CBRE, INC. Michael Silver, SIOR First Vice President Industrial Brokerage Services January
Upstate, SC 2Q17. Industrial Market Report. Q2 Industrial. Upstate Economy in 2Q17* Industrial Sector in 2Q17. Trends for 2Q17
 Upstate, SC 2Q17 Industrial Market Report The industrial market for the Upstate of South Carolina saw continued growth for the second quarter of 217. While there was a positive net absorption of 67,53
Las Vegas Valley Executive Summary
 ARROYO MARKET SQUARE Las Vegas Valley Executive Summary Retail Market 4th Quarter 2013 THE DISTRICT AT GREEN VALLEY RANCH January 23, 2014 Re: Commercial Real Estate Survey: 4th Quarter, 2013 Dear Reader,
BOSTON INDUSTRIAL MARKET
 BOSTON INDUSTRIAL MARKET THIRD QUARTER 217 INDSTATUS INLAND FREIGHT Inside... Industrial vacancy drops slightly. Positive absorption seen 11 of the past 13 quarters. Warehouse space in The Boroughs remains
The CoStar Office Report
 The CoStar Office Report Y E A R - E N D 2 0 0 8 YEAR-END 2008 PHOENIX Table of Contents Table of Contents.................................................................... A Methodology........................................................................
Leasing Activity Ticked Up with A Large Upswing of Absorption
 Research & Forecast Report LONG ISLAND INDUSTRIAL MARKET Leasing Activity Ticked Up with A Large Upswing of Absorption Rose Liu Director of Finance & Research Long Island Takeaways > > The outlook of the
FURY'S FERRY OFFICE SPACE
 Fury's Ferry Medical Office Space FURY'S FERRY OFFICE SPACE President & Broker EXECUTIVE SUMMARY OFFERING SUMMARY Available SF: Lease Rate: Lot Size: 2,700-16,200 SF Negotiable 1.39 Acres PROPERTY OVERVIEW
Solid Fundamentals Keep Nashville Industrial Market Competitive in 1Q
 Research & Forecast Report NASHVILLE INDUSTRIAL 1st Quarter Solid Fundamentals Keep Nashville Industrial Market Competitive in 1Q 1Q Summary >> Nashville s industrial vacancy rate increased slightly in
Office Market Report OFFICE MARKET REPORT. Boston. The Stevens Group. Ten Post Office Square Boston MA
 OFFICE MARKET REPORT Office Market Report Boston The Stevens Group First Quarter 2017 The Stevens Group Ten Post Office Square Boston MA 02109 617-886-9300 Our Difference Is Your Advantage First Quarter
Office Market Heats Up as Temperatures Cool
 Research & Forecast Report RENO OFFICE Q3 2017 Office Market Heats Up as Temperatures Cool >>Vacancy decreased to 11.8% >>Positive net absorption of 36,041 square feet >>Construction is imminent with limited
Industrial Market Report
 Industrial Market Report West Michigan Q4 - Year End 017 Wisinski of West Michigan Commercial Real Estate Services, Worldwide. 100 Grandville Ave SW Suite 100 Grand Rapids, MI 49503 616. 776. 0100 www.naiwwm.com
Miami-Dade County Retail Market Report 3Q Real Capital Partners Real Estate Services. *Data Source CoStar Miami-Dade County Retail Market Report
 Miami-Dade County Retail Market Report 3Q 216 Real Capital Partners Real Estate Services *Data Source CoStar Miami-Dade County Retail Market Report 3Q 216 Miami-Dade County Retail Market Report Overview
The CoStar Office Report
 The CoStar Office Report T H I R D Q U A R T E R 2 0 1 2 THIRD QUARTER 2012 PHOENIX Table of Contents Table of Contents.................................................................... A Methodology........................................................................
Real Estate Market Analysis
 One of the challenges facing the West Berkeley shuttle is to consider whether to expand the service beyond the current operations serving major employers, to a system that provides access to a more diverse
2017 FORT WAYNE, INDIANA OFFICE MARKET SURVEY
 2017 FORT WAYNE, INDIANA OFFICE MARKET SURVEY 2017 REVIEW 2018 FORECAST PREPARED WITH THE ASSISTANCE OF Overall, the market conditions have stabilized. The most significant development for the Fort Wayne
Research. New product, high rents CLEVELAND 1Q16 INDUSTRIAL MARKET. Current Conditions
 New product, high rents The Greater Cleveland industrial market absorbed 556,046 square feet in the first quarter of 2016, the 14th consecutive quarter of positive tenancy gains for the market. The positive
The CoStar Office Report
 The CoStar Office Report Y E A R - E N D 2 0 1 1 YEAR-END 2011 JACKSONVILLE Table of Contents Table of Contents.................................................................... A Methodology........................................................................
CoStar Office Statistics. Y e a r - E n d McAllen/Edinburg/Pharr Office Market
 CoStar Office Statistics Y e a r - E n d 2 0 1 7 McAllen/Edinburg/Pharr Office Market Year-End 2017 McAllen/Edinburg/Pharr Table of Contents Table of Contents.................................................................
The CoStar Industrial Report. T h i r d Q u a r t e r Asheville Industrial Market
 The CoStar Industrial Report T h i r d Q u a r t e r 2 0 1 4 Third Quarter 2014 Asheville Table of Contents Table of Contents................................................................. A Methodology......................................................................
OFFICE QUICK STATS SUMMARY & OUTLOOK MARKET TRENDS VACANCY & NET ABSORPTION ECONOMIC STATS
 LOS ANGELES NORTH OFFICE FOURTH QUARTER 217 QUICK STATS Direct Vacancy 11.8% Overall Vacancy 12.5% Lease Rate FSG $2.75 Gross Absorption Under Construction MARKET TRENDS Current Quarter 1,6,941 SF 89,158
KEY TOWER SALE highlights start of 2017
 KEY TOWER SALE highlights start of 2017 Demand for office space in the Greater Cleveland office market remained strong as 2016 wound down and transitioned into the first quarter of 2017. After netting
Market Research. OFFICE First Quarter 2010
 colliers international LAS VEGAS, NV Market Research OFFICE First Quarter 2010 Market Indicators Net Absorption Construction Rental Rate Q1-10 Q2-2010 Projected Clark County Economic Data Jan-10 Jan-09
Apex distribution center Houston, Texas Executive Summary. premier class a project developed by crow holdings industrial in northwest houston
 Apex distribution center Houston, Texas Executive Summary premier class a project developed by crow holdings industrial in northwest houston Apex distribution center HFF is pleased to offer for sale Apex
First Quarter 2017 Industrial Market Report. Chicago. Economic Overview
 Chicago Market Facts 5.3% Chicago s unemployment rate continued to trend downward. Recorded at 5.3% as of February 2017. 17 MSF The number of completed projects increased to 5.1 msf and projects currently
Gaining Traction Gradually in 2018
 Research & Forecast Report RENO OFFICE Q1 2018 Gaining Traction Gradually in 2018 >> Overall vacancy increased slightly to 12.3% >> Negative net absorption of 13,792 square feet >> Rental rates remained
2018 NORTHEAST INDIANA INDUSTRIAL MARKET SURVEY
 2018 NORTHEAST INDIANA INDUSTRIAL MARKET SURVEY 2017 REVIEW 2018 FORECAST PREPARED WITH THE ASSISTANCE OF 2017 was a solid year for industrial real estate in Northeast Indiana. The vacancy rate at the
The CoStar Industrial Report. Y e a r - E n d St. Louis Industrial Market
 The CoStar Industrial Report Y e a r - E n d 2 0 1 6 Year-End 2016 St. Louis Table of Contents Table of Contents................................................................. A Methodology......................................................................
2018: The Year of Office Sales
 Research & Forecast Report RENO OFFICE Q4 2018 2018: The Year of Office Sales >> Multiple significant office sales over 10,000 square feet >> Large blocks of space returned to the market increasing vacancy
GRAND PLAZA BUSINESS PARK
 LEASED INVESTMENT OFFERING RARE 27,200 SQ. FT. ORANGE COUNTY MULTI-TENANT BUSINESS PARK GRAND PLAZA BUSINESS PARK 200-220 S. GRAND AVE., SANTA ANA, CA Exclusively Presented By: Mike Hefner, SIOR Executive
Oakland Chamber of Commerce 2015 Economic Development Summit The Oakland Advantage. Garrick Brown. Commercial Market Overview
 Oakland Chamber of Commerce 2015 Economic Development Summit The Oakland Advantage Garrick Brown Commercial Market Overview Oakland Convention Center Oakland, CA March 20, 2015 Vice President, Research
June Published by the Virginia REALTORS Data recorded July 20,
 Data recorded July 20, 2018 1 The Virginia REALTORS association publishes monthly and quarterly home sales reports to provide our members, the media, and real estate-related industries with current data
Rite Aid. offering memorandum Halprin Drive - NORFOLK, VIRGINIA ACTUAL PROPERTY
 Rite Aid offering memorandum ACTUAL PROPERTY Buyer must verify the information and bears all risk for any inaccuracies. Marcus & Millichap is a trademark of 2016 Marcus & Millichap. Activity ID: Y0330263
CoStar Industrial Statistics. Y e a r - E n d Pittsburgh Industrial Market
 CoStar Industrial Statistics Y e a r - E n d 2 0 1 7 Year-End 2017 Pittsburgh Table of Contents Table of Contents................................................................. A Methodology......................................................................
2018 CCIM President. Carole Brill, CCIM
 2018 CCIM President Carole Brill, CCIM 2018 Commercial Real Estate Forecasts Presented by Melissa Molyneaux Melissa Molyneaux, SIOR, CCIM Senior Vice President Executive Managing Director Office Services
SHOPS OF BERRYHILL OFFERING MEMORANDUM
 OFFERING MEMORANDUM 1890 BERRYHILL RD, CORDOVA, TN 38016 EAST RETAIL SUBMARKET RETAIL SHOPPING CENTER 17,360 sf INVESTMENT OPPORTUNITY CHIMNEY ROCK BLVD BERRYHILL RD N For more information, please contact:
3 RD QUARTER 2016 RICHMOND RETAIL MARKET REPORT FORECAST 5.3% VACANCY 349,524 SF UNDER CONSTRUCTION (137,905) SF NET ABSORPTION
 SF NET ABSORPTION") 3 RD QUARTER 2016 RICHMOND RETAIL MARKET REPORT FORECAST All signs indicate a stabilized market that continues to support well-located new development. The majority of absorption in the 3rd quarter was
3 RD QUARTER 2016 RICHMOND RETAIL MARKET REPORT FORECAST All signs indicate a stabilized market that continues to support well-located new development. The majority of absorption in the 3rd quarter was
INDUSTRIAL QUICK STATS SUMMARY & OUTLOOK MARKET TRENDS VACANCY & NET ABSORPTION ECONOMIC STATS
 INLAND EMPIRE INDUSTRIAL FOURTH QUARTER 217 QUICK STATS Direct Vacancy 5.1% Overall Vacancy 5.3% Lease Rate NNN $.57 Gross Absorption Under Construction MARKET TRENDS Current Quarter 9,23,744 SF 16,31,563
The CoStar Industrial Report
 The CoStar Industrial Report F I R S T Q U A R T E R 2 0 1 4 FIRST QUARTER 2014 DALLAS/FT. WORTH Table of Contents Table of Contents....................................................................
100% LEASED INDUSTRIAL BUILDING TOTALING 181,486 SF S. RIVERSIDE DR. MODESTO, CA
 100% LEASED INDUSTRIAL BUILDING TOTALING 181,486 SF 107 S. RIVERSIDE DR. MODESTO, CA EXECUTIVE SUMMARY Newmark Knight Frank is pleased to present the opportunity to purchase a 100% leased industrial building
The CoStar Office Report
 The CoStar Office Report Y E A R - E N D 2 0 0 9 YEAR-END 2009 SALT LAKE CITY Table of Contents Table of Contents.................................................................... A Methodology........................................................................
Chicago s industrial market thrives during the third quarter.
 CHICAGO INDUSTRIAL MARKET MONITOR THIRD QUARTER 2015 Chicago s industrial market thrives during the third quarter. Demand across the Chicago industrial market remains high sending absorption up and vacancy
Our Housing Market Turns the Corner
 Our Housing Market Turns the Corner OUR HOUSING MARKET TURNS THE CORNER After a very difficult half decade characterized by falling sales and prices, a surge in foreclosures and many underwater homeowners,
100% OCCUPIED - 2 TENANT INDUSTRIAL INVESTMENT. Sun MCLEOD BUSINESS CENTER E. Post Road, Las Vegas, Nevada Commercial Real Estate, Inc.
 0% OCCUPIED - TENANT INDUSTRIAL INVESTMENT Sun Commercial Real Estate, Inc. MCLEOD BUSINESS CENTER 70 E. Post Road, Las Vegas, Nevada 890 Contact Team Lisa Hauger Senior Vice President 70-968-7333 LisaH@suncommercialre.com
Office Market Continues to Improve
 Research & Forecast Report LAS VEGAS OFFICE Q3 2016 Office Market Continues to Improve > > Southern Nevada s office market is improving at a steady rate > > Net absorption has been positive in twelve of