2011 HAMPTON ROADS REAL ESTATE MARKET REVIEW
|
|
|
- Raymond Jesse Garrett
- 5 years ago
- Views:
Transcription

1 2011 HAMPTON ROADS REAL ESTATE MARKET REVIEW

2

3 2011 HAMPTON ROADS REAL ESTATE MARKET REVIEW CONTENTS ASSOCIATE PUBLISHER Mike Herron Inside Business SPECIAL PUBLISHING MANAGER Olga Currie GRAPHIC DESIGN Pico Design & Illustration DIRECTOR OF SALES Bill Blake ADVERTISING SALES Robin Simmons John Kinsley BUSINESS MANAGER Debbi Wilson Message From The Director CREED Executive Committee CREED IPAC Members CREED Council Members Hampton Roads Retail Market Survey Hampton Roads Industrial Market Survey Hampton Roads Office Market Survey Hampton Roads Residential Market Survey Hampton Roads Multi-Family Market Survey Commercial Real Estate Investment Market Review Inside Business 150 W. Brambleton Avenue Norfolk, Virginia E. V. Williams Center for Real Estate & Economic Development Data for Old Dominion University E.V. Williams Center for Real Estate and Economic Development Market Survey was collected in the fourth quarter


4
5 MESSAGE FROM THE DIRECTOR Welcome and thank you for joining us for the 2011 Old Dominion University E. V. Williams Center for Real Estate and Economic Development (CREED) Hampton Roads Real Estate Market Review and Forecast. This is our 16th annual market report and review and we sincerely appreciate your continued support. Hampton Roads is officially designated the Virginia Beach Norfolk Newport News VA-NC MSA by the Office of Management and Budget. It encompasses 2,628 square miles, has a population of more than 1.6 million and a workforce of nearly 800,000. Hampton Roads is the fourth largest MSA in the southeast US, comprised of 16 cities and counties in Southeastern Virginia and Northeastern North Carolina, and is the largest consumer market between Washington D.C. and Atlanta. Our report this year features an expanded residential overview to a new section reviewing existing home sales. The Real Estate Information Network (REIN) has graciously provided us with the data and analysis by James Pritchard. This information, in conjunction with our ongoing evaluation of residential development, now provide you with a more informative and comprehensive overview of the residential market. Growth and development at CREED is driven significantly by support from our members. In 2010, the Industry Professional Advisors to the Center (IPAC) and the CREED Council numbered 114. Together, these membership bodies are dedicated to creating a nationally prominent center of excellence in real estate research and education here at Old Dominion University. The high degree of support and involvement demonstrated by our membership is positioning CREED to invest greater resources in research, additional educational programming, networking opportunities, and practical applications that benefit the Industry as a whole and sustain the real estate community here at Old Dominion University. CREED membership continues to be one of the most cost effective networking organizations you can ever support. There are many benefits to CREED membership, including complimentary registration to CREED events such as the Hampton Roads Real Estate Market Review and Forecast and the annual CREED Business Meeting and Luncheon. Moreover, there are several opportunities to meet promising students for possible internships or career symposiums. CREED Council and IPAC membership also provides further opportunity for those of you who want to see real estate establish itself as an academic major of choice for Old Dominion University students. With member support, CREED continues to expand student offerings and member services and programming. In 2010, CREED invited several industry leaders to campus and sponsored numerous events in the College of Business and Public Administration including a guest speaker series. In June, CREED welcomed Dr. Susan Wachter, former United States Assistant Secretary of Housing and Urban Development, to advise our membership on navigating the turbulent economic climate. Looking ahead to 2011, CREED is expanding its partnership with the local chapter of the Urban Land Institute, in addition to many other regional industry partners. Dr. Michael J. Seiler, the Robert M. Stanton Chair of Real Estate, continues his cutting edge research in areas of consumer behavior and the home purchase process. His research appears in top level publications all the while enhancing the reputation of real estate related research in the College and University. There are many people to thank for their contributions to this report and the annual market review. Many writers, speakers, and event planners make this program such a success. Of course, a special thank you to all the volunteers within the real estate and economic development community for providing their expertise and sharing their data. None of this is possible without your commitment. In closing, please note that we have changed the way we present some of our information. Every effort is made to provide the most accurate information in these reports. If you find an error, or have a suggestion on how to improve upon these reports, please contact me with comments. Your continued support is truly appreciated. John R. Lombard, Ph.D. John R. Lombard, Ph.D. Associate Professor and Chair Department of Urban Studies and Public Administration Director, E. V. Williams Center for Real Estate and Economic Development Old Dominion University College of Business and Public Administration Norfolk, VA Direct line: (757) Center line: (757)


 683-5352")
6 To obtain additional copies of this report, please go to our website: Send to: Kyllie Brinkley Program Manager E. V. Williams Center for Real Estate and Economic Development Old Dominion University 2088 Constant Hall Norfolk, VA Telephone: (757)

7 THE 2011 EXECUTIVE COMMITTEE OF THE CREED COUNCIL The purpose of the Creed Council is to provide professional expertise in various aspects of real estate and economic development to make recommendations to the University concerning policy and operations of the CREED as well as the University s real estate curriculum. The 2011 Officers And Members Of CREED Are As Follows: Executive Committee Chair... Brad Sanford Director... John Lombard Program Chair... Stephanie Sanker Publications Chair... Brian Dundon Membership Chair... Craig Cope Curriculum Co-Chairs... Jon Crunkleton... Brad Sanford By-Laws Chair... Andrew Keeney Past Chair... Tom Dillon At-Large... Jonathan Guion... Billy King... Aubrey Layne Market Review Committee Industrial... William C. Throne and... Stephanie Sanker Office... Maureen G. Rooks Retail... David Machupa and... David Chapman Multi-family... Charles Dalton/Real Data Residential... Blair Hardesty, James Pritchard and Van Rose Investment... Scott Adams Staff...Kyllie Brinkley Research/Editorial Committee Kyllie Brinkley Nancy Gossett John Lombard Lane Shea David Chapman Elizabeth Hancock Sandi Prestridge Kristi Sutphin Albert Duncan Janice Hurley Maureen Rooks Brian Dundon Joy Learn Brad Sanford 5
8 INDUSTRY PROFESSIONAL ADV Honorary Member Robert M. Stanton, CSM and CPM Stanton Partners, Inc. Jeff Ainslie Ainslie Group G. Robert Aston, Jr. TowneBank Ramon W. Breeden, Jr. The Breeden Company Sanford (Sandy) M. Cohen Divaris Real Estate, Inc. Craig Cope Liberty Property Trust Cecil V. Cutchins Olympia Development Corporation Robert L. Dewey Willcox & Savage, PC Thomas M. Dillon Fulton Bank N. Joseph Dreps BB&T Pamela J. Faber LeClair Ryan Joel T. Flax, CPA Goodman and Company David M. Gianascoli Gee s Group Real Estate Development John L. Gibson, III Ellis-Gibson Development Group Warren Harris City of Virginia Beach Economic Development Aubrey L. Layne, Jr. Great Atlantic Management, LLC Miles B. Leon S. L. Nusbaum Realty Company THANK YOU 2011 SPONSORS 2011 Hampton Roads Real Estate Market Review 6
9 ISORS TO THE CENTER (IPAC) Michael W. McCabe Harvey Lindsay Commercial Real Estate Michael Newsome Clark Whitehill Enterprises, Inc. Harrison J. Perrine Perrine Investments Don Perry Continental Development Victor L. Pickett Grandbridge Real Estate Capital, LLC Thomas E. Robinson Robinson Development Group Jim V. Rose Rose & Womble Realty Co., LLC Bradley R. Sanford, MAI Dominion Realty Advisors Burrell F. Saunders CMSS Architects, PC Reese Smith Reese Smith & Associates Tony Smith Robinson Development Group Deborah K. Stearns, CPM, SIOR Harvey Lindsay Commercial Real Estate Richard Thurmond William E. Wood & Associates Jon S. Wheeler Wheeler Interests Robert T. Williams Tri City Developers, LLC Rod Woolard City of Norfolk Economic Development Steven Wright City of Chesapeake Economic Development 7
10 CREED COUNCIL MEMBERS J. Scott Adams CB Richard Ellis/Hampton Roads Tom Atherton MEB General Contrators Stewart Buckle, II The Morgan Real Estate Group M. Albert Carmichael Harvey Lindsay Commercial Real Estate W. Page Cockrell Hurt & Proffitt David Collier First Atlantic Restoration Lawrence J. Colorito, Jr., MAI Axial Advisory Group, LLC Hahns L. Copeland DARVA Group LLC Ann K. Crenshaw Kaufman & Canoles, P.C. Don Crigger, CCIM CB Richard Ellis of Virginia, Inc. Jon R. Crunkleton, Ph.D. Old Dominion University Kim Curtis Tidewater Home Funding William G. Darden Hearndon Construction Co. Laura B. de Graaf Bank of America Merrill Lynch Michael Divaris Divaris Real Estate, Inc. Helen Dragas The Dragas Companies Brian Dundon Dundon & Associates Frederick D. Facka Tuckahoe Asset Management Sandra Ferebee GSH Residential Sales Bart Frye, Jr. Frye Properties, Inc. Brian E. Gordineer, A.A.S City of Hampton, Office of the Assessor Howard E. Gordon Williams Mullen Dennis W. Gruelle Appraisal Consultation Group Jonathan S. Guion, SIOR Jonathan Commercial Properties Elizabeth O. Hancock Office of Real Estate Assessor, Norfolk Russell G. Hanson, Jr. Hanson Capital, LLC Carl Hardee Lawson Realty Corporation John Harry John C. Harry, Inc. Dorcas T. Helfant-Browning DTH Properties, LLC Virginia P. Henderson, MAI Commercial First Appraisers, LLC Charles Hutchison Vanasse Hangen Brustlin, Inc. Michael A. Inman Inman & Strickler, P.L.C. Cherie James Cherie James, CPA Terry Johnson Abbitt Realty Mallory Kahler City of Portsmouth Economic Development E. Andrew Keeney Kaufman & Canoles, P.C. R. I. King, II Cushman & Wakefield/ THALHIMER William E. King, SIOR Harvey Lindsay Commercial Real Estate April Koleszar Koleszar Properties, Inc. Barry M. Kornblau Summit Realty Group, Inc. Tyler Leinbach Meredith Construction Company 2011 Hampton Roads Real Estate Market Review 8
11 John R. (Jack) Lewis, II ECS Mid-Atlantic, LLC Harvey Lindsay, Jr. Harvey Lindsay Commercial Real Estate Jeffrey R. Mack The CIM Group Mike Mausteller G. Cliff Moore Virtexco Corporation Michael Nice George Nice and Sons, Inc. Thomas O Grady KBS, Inc. James N. Owens, CCIM Harvey Lindsay Commercial Real Estate Robert L. Philips, Jr. Cushman & Wakefield/THALHIMER Sandra Prestridge City of Norfolk Economic Development Chris Read CB Richard Ellis/Hampton Roads F. Craig Read Read Commercial Properties John C. Richards, Jr. CB Richard Ellis/Melody & Co. Rennie Richardson Richardson Real Estate Corporation Maureen G. Rooks Jones Lang LaSalle J. Randy Royal Kimley-Horn and Associates Robert J. Ruhl City of Virginia Beach Economic Development Stephanie Sanker, SIOR, CCIM S.L. Nusbaum Realty Co. Robert M. Sherman III, CPM Harrison & Lear, Inc. Kenneth Sisk, P.E. Bowman Consulting Group Anthony W. Smith Robinson Development Group Robert M. Stanton Stanton Partners, Inc. Jeremy R. Starkey Monarch Bank Commercial Real Estate Finance/Monarch Capital, LLC Daniel R. Stegall Daniel Richard Stegall, A Professional Law Corporation Terrie L. Suit The Office of Commonwealth Preparedness Leo Sutton Historic Ventures, LLC Michael Sykes Bank of Hampton Roads Robert M. Thornton, CRE, CCIM, SIOR Cushman & Wakefield/THALHIMER William C. Throne, SIOR, CCIM, ALC Cushman & Wakefield/THALHIMER Jamie Tollenaere Clancy & Theys Construction Stewart Tyler, ASA Right of Way Acquisitions & Appraisals George D. Vick, III Harvey Lindsay Commercial Real Estate Edward W. Ware Norfolk Redevelopment and Housing H. Mac Weaver, II Wells Fargo Real Estate Group Edward M. Williams William E. Wood & Associates F. Blair Wimbush Norfolk Southern Corporation Peter E. Winters, Jr. Bank of Hampton Roads Chris Wood JD & W John P. Wright Waverton Associates 9


12

13 RETAIL Author Survey Collection Data Analysis/ Layout Financial Support Disclosure David Machupa Cushman & Wakefield/THALHIMER Kyllie Brinkley E.V. Williams Center for Real Estate and Economic Development David Chapman Old Dominion University The E. V. Williams Center for Real Estate and Economic Development (CREED) functions and reports are funded by donations from individuals, organizations and the CREED Council. The data used for this report are deemed reliable; however, neither Old Dominion University, the E. V. Williams Center for Real Estate and Economic Development, nor sponsoring companies and/or individuals makes any representation or warranty as to its accuracy RETAIL


14 General Overview This report analyzes the 2010 retail real estate conditions within the Virginia Beach Norfolk Newport News, Virginia Metropolitan Statistical Area (the MSA ), which is commonly known as Hampton Roads. It provides supply, vacancy, construction, absorption and rent data for the MSA to provide a comparison of the data for Southside and Peninsula areas of Hampton Roads for specific submarkets and product types. The survey includes properties from the Southside of Hampton Roads located in the cities of Chesapeake, Norfolk, Portsmouth, Smithfield, Suffolk and Virginia Beach. Properties are also included from the Peninsula of Hampton Roads in Gloucester, Hampton, Newport News, Poquoson, Williamsburg and York County. This survey is believed to be the most comprehensive analysis of retail real estate trends in the MSA. The report includes information on all retail product types including regional malls, freestanding buildings and strip centers of various classifications. The scope of the report also includes a summary of new retail construction, an analysis of absorption, and a review of retail investment sales that have occurred in the region. This survey gathered information about strip shopping centers and regional malls located in the METHODOLOGY MSA that were generally 30,000 square feet in size or larger. Additionally, information on retailoriented freestanding buildings at least 23,000 square feet and freestanding buildings that contained furniture stores, discounters, grocery stores or category killer retailers that met the established size criteria were included in the survey. Automotive uses and buildings containing downtown storefronts were not included. Although available retail space in many submarkets (e.g., Ghent) is best described as a collection of small specialty shops, storefronts or freestanding buildings, practical limitations dictated that the focus of the survey be on larger product types. The survey data was collected between October 2010 and January Questionnaires were mailed to owners, leasing agents and property managers responsible for retail properties meeting the selection criteria. Direct contact was utilized as a follow-up to the mailing to encourage participation. Information on square footage for freestanding buildings was obtained from building owners, tax records, store managers and retail real estate representatives. Sales information was obtained from property owners, real estate agents, appraisers, and real estate assessors Hampton Roads Real Estate Market Review 12
15 2011 R E TA I L DEFINITIONS OF TERMS Asking Rates: The market rate per square foot of a retail property (excluding freestanding buildings and malls), exclusive of additional rents that may be paid under a triple net lease. Interpretation of average retail rates in different product types and submarkets should be viewed cautiously given the tremendous variability in rates for like products and for properties located within the same submarket. Factors such as visibility, co-tenancy and accessibility are some of the many sources of variation in market rates which should be considered. Big Boxes: Contiguous retail space that is at least 23,000 square feet and located in any one of the identified product types. Retailers occupying big boxes include, but are not limited to, the following: category killers, specialty stores, discounters, furniture stores, grocery stores and theaters. Bowling alleys, automotive uses, roller rinks and ice-skating rinks were not included. CAM: Common Area Maintenance Product Types: Properties were classified according to one of the following nine retail product types. The International Council of Shopping Centers defined the first six categories. Three additional categories were included to accurately categorize the remaining properties. Neighborhood Center Community Center Fashion/Specialty Center Power Center Theme Festival Center Outlet Center Freestanding Mall Other 30,000 to 150,000 square feet; supermarket anchored 100,000 to 350,000 square feet; discount department store, supermarket or drug store anchored 80,000 to 250,000 square feet; fashion anchored 250,000 to 600,000 square feet; category killer, home improvement and discount department store anchored 80,000 to 250,000 square feet; restaurants, entertainment anchored 50,000 to 400,000 square feet; manufacturer s outlet store anchored Individual building not considered a shopping center Shopping center with area designed for pedestrian use only Any center that does not fit into a typical category Regional Mall Node: Submarket anchored by regional mall. Small Shop: In-line retail space usually less than 10,000 square feet located in a multi-tenanted shopping center. Submarkets: Hampton Roads is divided into 35 retail submarkets (25 Southside submarkets and 10 Peninsula submarkets) which reflected general concentrations, pockets or corridors of retail product type. Geographical boundaries of the retail submarkets were influenced by density of existing retail product, physical or geographical obstacles, existing transportation networks, municipal boundaries, population concentrations and retailers perceptions of the MSA. Final determination of specific boundaries of each submarket was made by a subcommittee of retail real estate professionals who are actively involved in the MSA. Also highlighted were specific submarkets that are anchored by regional malls. A map which identifies the general location of each submarket is included in the centerfold of this report. Triple Net Lease: Type of lease under which a tenant pays its pro-rata share of real estate taxes, insurance and common area maintenance RETAIL 13

16 YEAR IN REVIEW Moving into 2010 the market was cautiously optimistic. The prior year had left us with increased vacancy rates and reduced rental rates; the appetite of lenders was almost nonexistent for developments or acquisitions and, from a national level, there was a concern that the commercial real estate market bubble was going to burst as did the residential market. This concern further slowed the recovery of the Hampton Roads market, yet the market did recover. Savvy tenants made the most of the market as landlords were willing to make concessions to fill vacant units; the result was decreased vacancy for the overall market and a slightly decreased average rental rate. In 2009 Dillard s closed both Chesapeake Square locations; in 2010, we welcomed Burlington Coat Factory to one of the stores and the other location is in the process of being redeveloped into a state of the art movie theater. TJ Maxx and PetSmart built new stores in the Harborview submarket, and Restaurant Depot opened in the former Value City in Virginia Beach. Departing from past years, 2010 did not have a great deal of Big Box activity. Wal-Mart broke ground on a site they purchased in 2008 in the Edinburgh submarket. The Fresh Market relocation in Williamsburg was the only grocery store to commence construction in Hampton Roads. Having said that, we ended the year with the home improvement stores once again touring the market and evaluating sites. Investment sales in the Hampton Roads retail market were few and far between. We have heard on a number of occassions that lenders are going to foreclose on nonperforming assets; this belief is keeping many buyers on the sideline. Buyers appear to be searching for the bottom of the market, waiting to swoop in and get the banks nonperforming loans, yet the banks have not foreclosed in the large scale that we have been told will take place. The properties that were taken back are the same Williamsburg properties that struggled last year. The Williamsburg market was over built and that submarket continues to face challenges. As we faced last year with Circuit City, one thing that we did not see this year was the exodus of a large retailer. We continue to watch Blockbuster, as the long-term viability of their product line is suspect. Blockbuster, like Circuit City, has some good sites and we can expect many of those to be re-tenanted in short order. Overall, the Hampton Roads retail market remains stable. Due to our military presence, retailers tend to outperform overall national sales levels; these same military personnel provide a stable work force. As we settle into what we believe is the new reality, our expectations must remain realistic. Positive growth will take place next year, albeit at a slower rate than the market is accustomed and 2011 should outperform 2010 just as 2010 outperformed HAMPTON ROADS MARKET SURVEY The Hampton Roads retail market contains approximately 51,983,981 square feet of gross leasable area ( GLA ) in 412 properties with an average asking rental rate of $16.00 triple net. The US Census Bureau indicates the population of Hampton Roads is approximately 1.7 million resulting in a square feet of retail supply per person. Certain methodological differences (e.g., the inclusion of freestanding buildings and malls in this survey) make it difficult to compare per capita supply in the MSA to the national average statistics. Hampton Roads consist of two markets, the Southside and Peninsula. The Southside market has approximately 33,435,574 square feet, roughly 66% of the total square footage in the market, in 274 properties. The average asking rent for small shop space decreased by $.16 over 2009 numbers to $16.16 per square foot triple net. The decrease in rental rates was a boon to tenants and, as a result, the overall vacancy rate on the Southside decreased. In 2010 there was a decrease in the vacancy rate of.67% to 7.42%, while new construction added just 18,880 square feet to the Southside market. The Peninsula also experienced some changes this past year. The 138 properties surveyed on the Peninsula had a total of 18,548,407 square feet of product. The average asking price of small shop space decreased $.17 to $15.65 per square foot triple net Hampton Roads Real Estate Market Review 14
17 2011 R E TA I L Market Overview Table New Number of Construction Occupied Absorption Properties GLA in SF Vacant SF % Vacant in SF in SF in SF Southside ,019,555 2,523, % 18,880 31,495, ,035 Peninsula ,548,407 2,175, % - 16,372, ,361 Total ,567,962 4,699, % 18,880 47,868,415 1,279,396 Southside ,535,280 2,714, % 302,352 30,820,766 (288,440) Peninsula ,160,963 2,392, % 981,463 15,768, ,777 Total ,696,243 5,107, % 1,283,815 46,589,019 74,337 Southside ,265,028 2,155, % 275,252 31,109, ,525 Peninsula ,112,012 1,706, % - 15,405,476 (109,898) Total ,377,040 3,862, % 275,252 46,514, ,627 Southside ,086,160 2,215, % 1,038,291 30,870, ,596 Peninsula ,133,079 1,617, % 1,009,000 15,515, ,485 Total ,219,239 3,833, % 2,047,291 46,386, ,081 Southside ,407,761 1,876, % 1,552,392 30,531,085 1,741,962 Peninsula ,895,155 1,480, % 1,042,451 15,414, ,788 Total ,302,916 3,356, % 2,594,843 45,945,974 2,318,750 Southside ,852,210 2,063, % 593,520 28,789,123 1,280,869 Peninsula ,337,458 1,499, % 618,179 14,838, ,097 Total ,189,668 3,562, % 1,211,699 43,627,224 1,967,966 Southside ,184,395 2,676, % 271,610 27,508, ,736 Peninsula ,799,778 1,648, % 185,000 14,151, ,338 Total ,984,173 4,324, % 456,610 41,659, ,074 Southside ,336,266 3,169, % 419,458 27,166, ,138 Peninsula ,094,161 2,027, % 330,000 14,066, ,018 Total ,430,427 5,197, % 749,458 41,233, ,156 Southside ,180,691 3,433, % 574,400 26,747, ,167 Peninsula ,546,085 1,891, % 676,000 13,654, ,008 Total ,726,776 5,324, % 1,250,400 40,402,046 1,467,175 Southside ,760,443 3,548, % 828,800 26,212,213 1,185,818 Peninsula ,906,530 2,183, % 202,750 12,722, ,563 Total ,666,973 5,732, % 1,031,550 38,934,871 1,428,381 Southside ,436,515 3,760, % 918,100 25,676,428 (158,181) Peninsula ,477,970 1,997, % 212,229 12,480, ,115 Total ,914,485 5,757, % 1,130,329 38,156,523 (11,066) Southside ,816,383 2,933, % 2,064,727 25,883,089 1,344,209 Peninsula ,249,617 2,012, % 758,370 13,236, ,785 Total ,066,000 4,945, % 2,823,097 39,120,069 1,636,994 Southside ,089,939 2,551, % 1,414,805 24,538,880 1,961,927 Peninsula ,548,482 1,604, % 1,253,342 12,944,195 1,592,805 Total ,638,421 4,155, % 2,668,147 37,483,075 3,554,732 Southside ,463,588 2,886, % No Data 22,576,953 No Data Peninsula ,952,845 1,601, % No Data 11,351,390 No Data Total ,416,433 4,488, % No Data 33,928,343 No Data 2011 RETAIL 15
18 We saw a greater decrease in the vacancy rate on the Peninsula. The vacancy rate dropped 1.45% to 11.73%, and interest remains very strong for select submarkets. Despite adverse lending conditions, we will welcome two new projects to the Peninsula in In 2009, we were left with a vacancy rate of 9.88% for the overall retail market in Hampton Roads, the highest we have experienced in the past decade. Landlords did not want a repeat of 2009 and became more aggressive at deal making. Savvy tenants took advantage of favorable market conditions thereby reducing the market vacancy rate to 8.94%. While we will face many of the same challenges as 2010 retail sales are up, supply is slowly reducing. Tenants continue to express interest in the Hampton Roads market. We continue to move forward acknowledging that 2011 may bring some challenges with the unknowns of the capital markets and lender viability; however, the Hampton Roads retail market is more stable. As we are trending in all the right directions, the worst is now behind us. RETAIL SUBMARKETS SOUTHSIDE SUBMARKETS There were 25 retail submarkets on the Southside this year. The largest Southside markets were Greenbrier and Military Highway, with combined square footage of 7,026,016 square feet. The overall average size of the submarkets was 1,337,423 square feet. The Greenbrier/Battlefield submarket, at 4,243,816 square feet, has one of the lowest vacancy rates at 4.88% and one of the highest small shop asking rates, $20.03 per square foot triple net. The range of vacancy rates in the Southside submarkets can be seen in the table below. Southside By Submarket Average Number of Small Shop Properties GLA in SF Vacant SF % Vacant Rate PSF Bay Front 5 283,551 3, % $17.53 Birdneck/Oceanfront 4 191,655 11, % $10.95 Campostella 6 332,904 80, % $12.56 Chesapeake Square 9 2,218,786 82, % $17.00 Churchland-Portsmouth/Harborview ,880 47, % $15.08 Dam Neck 7 1,509,037 28, % $18.57 Downtown 4 1,329,283 31, % $14.83 Ghent 9 391,588 41, % $17.81 Great Bridge 17 1,363, , % $16.30 Greenbrier/Battlefield Boulevard 24 4,243, , % $20.03 Hilltop/Great Neck 12 1,485,168 88, % $21.36 Holland/Green Run ,663 50, % $13.67 Indian River/College Park ( Including Chesapeake) 5 666,183 74, % $14.20 Kempsville 12 1,233, , % $15.75 Little Creek Road /Wards Corner/Ocean View 18 1,867, , % $14.38 Little Neck 11 1,435, , % $17.38 Lynnhaven Road (Virginia Beach Boulevard To Holland Road) 8 1,822, , % $18.80 Middle Portsmouth 15 1,768, , % $12.75 Military Highway/Janaf 16 3,366, , % $13.24 Newtown ,344 91, % $12.82 ODU 1 39,691 8, % $19.00 Pembroke 23 2,716, , % $15.90 Princess Anne Road (From Kempsville Road To Holland Road) 15 1,854,589 46, % $17.88 Smithfield 5 279,764 5, % $17.00 Suffolk 13 1,130,660 91, % $16.80 Total ,019,555 2,523, % $ Hampton Roads Real Estate Market Review 16

19 2011 R E TA I L PENINSULA SUBMARKETS There were 10 retail submarkets on the Peninsula with an average size of 1,854,841 square feet. The two largest Peninsula submarkets are now Patrick Henry and Williamsburg. While the Patrick Henry submarket is anchored by a regional mall, and has the lowest vacancy rate on the Peninsula, Williamsburg continues to struggle with over development. The Patrick Henry submarket continues to be one of the most highly desired submarkets in Hampton Roads with 4,427,594 square feet and a vacancy rate of just 3.03%. During the past year, the Coliseum Central Submarket showed improvement with a reduction of the vacancy rate from 21.56% to 12.00%. This reduction decline can be attributed to the opening of Peninsula Towne Center. Peninsula By Submarket Average Number of Small Shop Properties GLA in SF Vacant SF % Vacant Rate PSF Coliseum Central 15 3,505, , % $17.38 Denbigh 15 1,785, , % $13.27 Foxhill/Buckroe/East Mercury 7 711, , % $13.80 Gloucester 8 894, , % $14.38 Hampton Misc 2 118,972 19, % $10.75 Newmarket/Main (To Include Hampton) 13 1,389, , % $10.29 Patrick Henry/Oyster Point/Kiln Creek 32 4,427, , % $17.76 Poquoson 2 108,521 10, % $15.00 Williamsburg 33 4,794, , % $19.10 York County ,703 52, % $14.25 Total ,548,407 2,175, % $15.65 RETAIL PRODUCT TYPE The Neighborhood Center, as a product type, remains the predominant with 160 properties containing over 12 million square feet of GLA. The Community Center comprised over 10 million square feet. Both product types showed a decrease in vacancy in RETAIL 17
20 Total Retail Product By Type New Average Number of Construction Small Shop Average Properties GLA in SF in SF Vacant SF % Vacant Rate PSF CAM PSF Neighborhood Center ,224,492 18,880 1,379, % $15.11 $2.54 Community Center 58 10,073,618-1,218, % $15.79 $2.39 Fashion/Specialty Center 10 1,488, , % $23.78 $3.94 Power Center 29 10,350, , % $20.41 $3.27 Theme Festival Center 1 100, No data No data No data Outlet Center 1 349, No data No data No data Other 64 2,391, , % $15.67 $2.92 Freestanding 77 8,050, , % $12.44 $3.08 Mall 10 7,538, , % $20.50 $17.75 Total ,567,962 18,880 4,699, % $16.00 $2.70 Southside By Type New Average Number of Construction Small Shop Average Properties GLA in SF in SF Vacant SF % Vacant Rate PSF CAM PSF Neighborhood Center 115 8,781,549 18, , % $15.30 $2.55 Community Center 37 6,159, , % $15.60 $2.38 Fashion/Specialty Center 8 1,005,711-54, % $23.50 $3.94 Power Center 19 6,267, , % $20.15 $3.27 Theme Festival Center 1 100, No data No data No data Outlet Center No data No data No data Other 44 1,556, , % $15.90 $2.95 Freestanding 43 4,499,135-61, % $13.63 $3.08 Mall 7 5,649, , % $20.50 $18.86 Total ,019,555 18,880 2,523, % $16.16 $2.79 Peninsula By Type New Average Number of Construction Small Shop Average Properties GLA in SF in SF Vacant SF % Vacant Rate PSF CAM PSF Neighborhood Center 47 3,442, , % $14.66 $2.15 Community Center 21 3,914, , % $16.12 $2.35 Fashion/Specialty Center 2 483,000-60, % $26.00 $5.03 DPower Center 10 4,083, , % $20.85 $2.79 Theme Festival Center No data No data No data Outlet Center 1 349, No data No data No data Other , , % $15.20 $2.38 Freestanding 34 3,551, , % $11.25 $2.24 Mall 3 1,888,842-87, % No data $17.75 Total ,548,407-2,175, % $15.65 $ Hampton Roads Real Estate Market Review 18
21 2011 R E TA I L Big Box Vacancy Big Box Vacancy in Hampton Roads decreased in 2010 to 1,717,593 square feet, a decrease of 373,805 square feet over last year s numbers. This number represents 37% of the total retail vacancy in the market. We did see some Big Box activity this past year. Wal-Mart is under construction at Edinburgh in Chesapeake on a site purchased in 2009 and Restaurant Depot opened in the former Value City on Virginia Beach Boulevard. Big Box Vacancy 4,000,000 Vacant Square Feet 3,500,000 3,000,000 2,500,000 2,000,000 1,500,000 1,000, ,000 0 Southside Peninsula TOTAL Big Box Vacancy Southside 1,513,523 1,142, , , ,688 1,102, ,568 Peninsula 1,141, , , , , , ,025 TOTAL 2,654,730 2,124,582 1,777,050 1,775,648 1,788,493 2,091,398 1,717, RETAIL 19

22 Retail Submarkets Southside 1 Bayfront 2 Birdneck/Oceanfront 3 Campostella 4 Chesapeake Square 5 Churchland/Harbourview 6 Dam Neck 7 Downtown Norfolk 8 Ghent 9 Great Bridge 10 Greenbrier/Battlefield Boulevard 11 Hilltop/Great Neck 12 Holland/Green Run 13 Indian River/College Park 14 Kempsville 15 Little Creek Road/ Wards Corner 16 Little Neck 17 Lynnhaven 18 Middle Portsmouth 19 Military Highway/Janaf 20 Newtown 21 ODU 22 Pembroke 23 Princess Anne 24 Smithfield 25 Suffolk Peninsula 26 Coliseum Central 27 Denbigh 28 Foxhill/Buckroe 29 Gloucester 30 Hampton Miscellaneous 31 Patrick Henry 32 Poquoson 33 Newmarket/Main 34 Williamsburg 35 York County 2011 Hampton Roads Real Estate Market Review 20
23 The following is a list of the properties included in this year s survey listed by submarket with a code representing the type of property. The GLA of the property is also listed. A Neighborhood Center B Community Center C Fashion/Specialty Center D Power Center E Theme Festival SOUTHSIDE F Outlet Center G Other H Freestanding I Mall BAY FRONT Bayside I & II A 79,397 Cape Henry Plaza A 58,424 Kroger H 47,000 Lake Shores Plaza Shopping Center A 58,230 Marina Shores G 40,500 BIRDNECK / OCEANFRONT Birdneck SC A 65,460 Farm Fresh H 29,296 Harris Teeter H 48,000 Linkhorn Shops A 48,899 CAMPOSTELLA Atlantic Commons A 63,393 Bainbridge Marketplace A 46,444 Campostella Corner A 43,375 George Washington Commons A 44,942 Holly Point SC A 65,321 Southgate Plaza A 69,429 CHESAPEAKE SQUARE BJ s H 115,660 Chesapeake Center B 270,602 Chesapeake Square Mall I 800,000 Crossroads Center at Chesapeake Square D 332,464 Food Chesp. Sq. H 45,000 Home Depot H 130,060 Lowes H 115,000 Taylor Road Plaza A 60,000 Wal-Mart Supercenter/Sam s Club H 350,000 CHURCHLAND / PORTSMOUTH / HARBOURVIEW Academy Crossing G 45,483 Churchland Place Shoppes G 21,000 Churchland SC A 149,741 Churchland Square A 72,189 Grand H 30,000 Harbourview Station East D 217,308 Harbourview Station West D 83,007 Marketcenter at Harbourview A 65,750 Marketplace Square A 12,461 Planet Fitness Plaza A 52,966 Poplar Hill Plaza B 102,326 Sterling Creek A 75,660 Town Point Square A 58,989 DAM NECK Dam Neck Crossing B 138,571 Dam Neck Square A 67,917 General Booth Plaza A 73,320 Red Mill Commons D 750,000 Red Mill Walk B 240,000 Sandbridge SC A 66,800 Strawbridge Marketplace A 172,429 DOWNTOWN Berkley Center A 47,945 Church Street Crossing A 51,000 MacArthur Center Mall I 1,100,000 Waterside Festival Marketplace I 130,338 GHENT 201 Twenty One A 15,616 21st Street Pavilion G 21,000 Center Shops A 139,081 Colley Village A 44,585 Ghent Place G 13,000 Harris Teeter H 27,000 Palace Shops I, II C 71,794 Palace Station G 38,000 The Corner Shops G 21,512 GREAT BRIDGE Cahoon Commons D 278,023 Cedar Lakes Center A 35,659 Centerville Crossing A 50,000 Crossings at Deep Creek A 68,970 Dominion Marketplace A 73,103 Dominion Plaza SC A 63,733 Glenwood Square A 73,859 Great Bridge SC A 156,937 Hanbury Village A 100,560 Harbor Watch Shoppes G 21,505 Las Gaviotas A 82,000 Millwood Plaza G 16,930 Mt. Pleasant Shopping Center A 100,000 Mt. Pleasant Village A 39,970 Wilson Village A 52,500 Woodford Shoppes B 9,760 Woodford Square B 139,623 GREENBRIER / BATTLEFIELD BOULEVARD Battlefield Marketplace G 30,000 Chesapeake Crossing B 287,679 Country Club Square H 12,600 Crossways Center I & Eden Way Shops D 438,725 Crossways II D 152,686 Edinburgh Commons D 195,111 Edinburgh East D 133,000 Gainsborough Square A 88,862 Greenbrier Mall I 899,665 Greenbrier Market Center D 487,580 Greenbrier South SC A 97,500 Home Depot H 130,060 K-Mart/OfficeMax H 165,000 Knell s Ridge Square G 40,000 Lowes H 114,000 Orchard Square A 88,910 Greenbrier A 83,711 Regal Cinemas H 60,763 The Shoppes at Greenbrier G 40,000 Towne Place at Greenbrier C 127,109 Village Square G 15,000 Volvo Parkway SC G 41,874 Wal-Mart Way Crossing G 80,160 Wal-Mart/Sam s Club/Kohl s D 433,821 HILLTOP / GREAT NECK Great Neck Square A 93,887 Great Neck Village A 73,836 Hilltop East C 100,000 Hilltop North B 202,511 Hilltop Plaza B 152,025 Hilltop Square B 220,413 Hilltop West G 60,000 La Promenade C 63,280 Marketplace at Hilltop C 113,000 Regency Hilltop B 236,549 Renaissance Place G 47,667 Target H 122,000 HOLLAND / GREEN RUN Auburn Place A 42,709 Chimney Hill B 207,175 Green Run Square A 75,000 Holland Plaza SC A 165,663 Holland Windsor Crossing B 47,400 Lowes H 125,323 Lynnhaven Green A 50,838 Rosemont Center A 12,700 Shipps Corner A 63,355 Timberlake SC A 73,500 INDIAN RIVER / COLLEGE PARK College Park I & II B 181,902 College Park Square H 183,874 Indian River Plaza B 126,017 Indian River SC A 123,752 Tidewater Plaza A 50,638 KEMPSVILLE Arrowhead Plaza A 97,006 Fairfield SC B 239,763 Kemps Corner Shoppes G 25,929 Kemps River Center A 62,507 Kemps River Crossing B 245,268 Kempsville Crossing A 111,394 Kempsville Plaza A 60,778 21
24 Parkway Marketplace A 26,602 Providence Square SC A 135,915 University Shoppes A 26,100 Witchduck Exchange A 50,000 Woods Corner A 152,314 LITTLE CREEK ROAD / WARDS CORNER / OCEAN VIEW Ames/Kroger B 140,568 Dollar Tree Shopping Center A 51,415 East Beach Shoppes A 63,000 Farm Fresh - Little Creek H 66,000 Glenwood Shoppes A 53,255 Little Creek and Tidewater Shops B 119,820 Little Creek East SC B 202,000 Little Creek Square A 82,300 Meadowbrook S C G 27,260 Mid-Town A 75,768 Mid-Way SC G 31,000 Ocean View SC A 73,658 Roosevelt Gardens SC A 109,175 Southern Shopping Center B 239,719 Suburban Park B 116,113 Super Wal-Mart H 225,000 Wards Corner Strip A 61,540 Wedgewood SC A 130,000 LITTLE NECK Birchwood SC A 358,635 Home Depot H 130,060 Kroger H 45,000 London Bridge Plaza B 114,584 Lowes H 160,000 Lynnhaven 2600 A 13,326 Lynnhaven Convenience G 36,900 Lynnhaven Shopping Center B 191,136 Princess Anne Plaza West C 77,558 Regatta Bay Shops G 60,000 Sam s Club Plaza D 248,604 LYNNHAVEN ROAD Lynnhaven Crossing G 55,550 Lynnhaven East B 97,303 Lynnhaven Mall I 1,293,100 Lynnhaven North B 176,254 Lynnshores Shopping Center G 12,692 Lynnway Place G 30,213 Parkway Plaza G 44,227 Wal-Mart H 113,112 MIDDLE PORTSMOUTH Afton SC A 106,500 Airline Marketplace A 69,000 Airline Plaza A 99,549 Alexander s Corner Shopping Center A 50,826 Elmhurst Square A 66,250 Gilmerton Square G 43,236 Manor Commerce Center G 67,060 Manor Shops G 14,573 Old Towne Marketplace A 42,000 Rodman SC A 45,000 Super Wal-Mart H 200,000 Triangle SC A 82,430 Victory Crossing D 500,000 Victory West Shopping Center A 167,102 Williams Court B 214,739 MILITARY HIGHWAY / JANAF 3455 Azalea Garden Road A 73,180 Best Square B 140,030 Broad Creek SC D 205,417 Bromley SC A 106,200 CostCo H 110,000 Dump/Mega Office G 115,854 Farm Fresh H 60,000 Food Lion #170 H 41,000 Grand Outlet H 35,000 Janaf D 878,381 Lowes H 115,000 Military Crossing D 195,003 Military Triangle G 10,061 Super K-Mart & Shoppes B 200,000 Super Wal-Mart H 224,513 The Military Circle I 856,542 NEWTOWN Cypress Plaza SC A 59,012 Cypress Point A 117,958 Diamond Springs North (Shopping Center) A 23,880 Diamond Springs Shoppes H 18,840 Newpointe SC A 92,978 Newtown Baker Crossing A 91,687 Newtown Center G 19,876 Newtown Convenience Center G 19,800 Northampton Business Center G 85,000 Thomas Corner SC G 23,557 Weblin Square G 31,552 Wesleyan Commons Shopping Center A 54,204 ODU First Floor Retail Shops at University Village Apartments 39,691 PEMBROKE Aragona SC A 69,700 Best Buy H 45,000 Circuit City H 38,414 Collins Square A 123,870 Columbus Village East A 63,000 Columbus Village Entertainment Center E 100,000 Dean Plaza (Former HQ) D 140,000 Former Bloom Brothers H 50,400 Giant Square B 150,000 Goodwill H 34,000 Haverty s H 55,000 G Haygood SC B 178,533 Haynes H 228,000 Hunter s Mill Shoppes G 22,827 Loehmann s Plaza C 139,380 Northern Super Center G 36,588 Pembroke East B 27,200 Pembroke Mall I 570,000 Pembroke Meadows SC A 81,592 Pembroke Place B 165,000 Pembroke Plaza G 34,900 Roomstore H 50,000 The Town Center of Virginia Beach C 313,590 PRINCESS ANNE ROAD Brenneman Farm SC A 228,197 Courthouse Marketplace A 122,000 Home Depot H 260,000 Kempsville Marketplace A 71,460 Landstown Commons D 505,766 Lynnhaven Square S C G 22,933 Parkway SC A 64,820 Pleasant Valley Marketplace A 88,107 Princess Anne Marketplace B 209,500 Princess One SC A 84,725 Salem Crossing D 92,407 Salem Lakes Marketplace A 42,087 Salem Lakes SC A 37,087 Woodtide SC A 25,500 SMITHFIELD Cypress Run SC G 25,000 Eagle Harbor A 77,400 Shoppes at Eagle Harbor A 23,000 Smithfield Plaza B 89,120 Smithfield Square A 65,244 SUFFOLK Bennetts Creek Crossing A 109,812 Bennetts Creek Food Lion A 64,544 Harbor View Shoppes A 17,000 Holland Plaza A 69,345 Kensington Square A 60,000 Lowes H 150,000 Oak Ridge A 38,700 Suffolk Plaza B 174,221 Suffolk Plaza West A 60,000 Suffolk SC B 165,803 Suffolk Specialty Shops G 15,200 Suffolk Village SC G 11,875 Wal-Mart Super Center H 194,160 PENINSULA COLISEUM CENTRAL Coliseum Corner A 49,267 Coliseum Crossing B 221,004 Coliseum Marketplace A 86, Hampton Roads Real Estate Market Review 22
25 Coliseum Specialty Shops G 15,026 Coliseum Square G 45,041 Hampton Towne Centre D 376,100 Hampton Woods A 89,092 Home Depot H 130,060 Peninsula Towncenter I 994,235 Riverdale Plaza D 280,133 Sports Authority H 40,000 Target H 122,000 The Power Plant D 621,150 Todd Center & Todd Lane Shops B 242,000 Wal-Mart Super Center H 193,316 DENBIGH Beaconsdale SC A 28,000 Denbigh Speciality Shops G 24,504 Denbigh Village Centre B 334,299 Denbigh Village Shopping Center H 327,322 Ferguson Center G 118,000 Former Hills Denbigh H 86,589 Jefferson Crossing (formerly Denbigh Crossing) A 145,000 Kmart H 115,854 Lee Hall Plaza A 36,000 Newport Crossing B 200,088 Richneck Shopping Center A 63,425 Stoneybrook Shopping Center A 74,340 Turnberry Crossing A 53,775 Village Square A 40,000 Warwick Denbigh SC B 137,925 FOXHILL / BUCKROE / EAST MERCURY Buckroe SC A 76,000 Farm Fresh Phoebus H 39,000 Kmart H 94,500 Langley Square A 154,103 Nickerson A 70,450 Nickerson Plaza A 83,849 Willow Oaks Village Square S.C. B 193,728 GLOUCESTER Food Lion H 40,000 Hayes Plaza SC A 52,651 Hayes SC A 100,000 Home Depot H 100,000 Lowe s H 125,000 Shoppes at Gloucester B 82,025 Wal-Mart Super Center H 220,000 York River Crossing B 175,000 Brentwood SC A 53,600 Dresden SC G 35,000 Forest Park Square B 150,000 Francisco Village A 55,865 Hampton Plaza B 173,199 Hilton SC A 74,000 Midway Shopping Center G 58,780 Newmarket South D 368,085 Newmarket B 117,377 Warwick Center A 150,000 Warwick Village A 75,400 PATRICK HENRY / OYSTER POINT / KILN CREEK Bayberry Village A 72,883 Best Buy Building H 135,000 City Center C 230,000 Commonweatlh Center G 30,279 Fairway Plaza G 37,950 Glendale SC G 30,000 Grand Furniture H 35,000 Harris Teeter H 52,334 Haverty s H 45,000 Haynes H 170,000 Hidenwood SC A 108,000 Jefferson Commons D 400,000 Jefferson Greene G 57,430 Jefferson Plaza D 178,200 Kroger H 55,000 Lowes H 120,000 Market Oyster Point A 69,660 Newport Marketplace D 450,000 Newport Square B 184,126 Office Depot H 30,122 Oyster Point Plaza A 73,197 Oyster Point Square A 83,089 Patrick Henry Mall I 714,607 Patrick Henry Place A 96,391 Sam s Club H 133,880 The Shoppes at Oyster Point G 30,000 Victory Kiln Creek A 61,000 Village Kiln Creek B 263,000 Villages of Kiln Creek G 45,300 Wal-Mart Super Center H 201,146 Yoder Plaza SC D 235,000 POQUOSON Poquoson SC A 57,458 Wythe Creek Plaza SC A 51,063 James York Plaza B 137,708 Kingsgate Green B 138,348 Lowes H 163,000 Marketplace Shoppes G 32,026 Marketplace Shopping Center A 36,000 Monticello Marketplace B 299,792 Monticello SC A 82,000 New Town Shops on Main C 253,000 Norge Crossing H 52,000 Olde Towne SC G 30,000 Prime Outlets F 349,927 Quarterpath Crossing A 85,600 Settlers Market at New Town B 195,000 Staples H 37,400 The Marquis (Phase I) D 1,000,000 The Shops at High Street B 114,449 Village Shops at Kingsmill G 82,200 Wal-Mart SuperCenter H 210,000 Williamsburg Crossing A 149,933 Williamsburg Farm Fresh A 79,188 Williamsburg Marketcenter B 120,920 Williamsburg Outlet Mall I 180,000 Williamsburg Pavillion Shops G 50,000 Williamsburg SC I & II B 251,000 Williamsburg Towne and Cnty A 49,802 WindsorMeade Marketplace D 174,379 Yankee Candle H 42,000 YORK COUNTY Grafton SC A 32,000 Heritage Square A 73,665 Kiln Creek Center A 45,700 Lakeside 17 H 8,400 Yorktown A 73,050 Patriots Square A 47,231 Shady Banks SC A 56,634 Wal-Mart SuperCenter H 220,000 Washington Square Shopping Center B 183,403 York Square A 48,720 Yorkshire Downs G 23,900 HAMPTON MISCELLANEOUS Kecoughtan SC A 64,327 The Shops at Hampton Harbor G 54,645 NEWMARKET / MAIN 4113 W Mercury Blvd. H 49, W. Mercury Blvd. H 28,080 WILLIAMSBURG Colony Square A 66,806 Ewell Station A 68,048 Festival Marketplace G 16,216 Gallery Shops G 18,187 Governor s Green SC A 100,000 Home Depot H 130,000 23


26


27 2011 HAMPTON ROADS REAL ESTATE MARKET REVIEW INDUSTRIAL Author Data Preparation Survey Coordination William C. Throne, SIOR, CCIM, ALC Vice President, Cushman & Wakefield/THALHIMER Stephanie Sanker, SIOR, CCIM Industrial Brokerage, S.L. Nusbaum Realty Co. Stephanie Sanker, SIOR, CCIM Industrial Brokerage, S.L. Nusbaum Realty Co. Reporters Greenbrier Christine Kaempfe Bainbridge/S. Elizabeth River Area Chip Worley Cavalier Industrial Park Pat Mumey Norfolk Commerce Park/Central Norfolk Area Worth Remick Norfolk Industrial Park Charles Dickinson West Side/MidTown Norfolk Area Billy King Lynnhaven Brian Baker Greenwich/Cleveland Streets Area Bobby Beasley Airport Industrial Area Bobby Beasley Portsmouth Sam Walker Suffolk Bill Throne Isle of Wight Billy King Copeland/Lower Peninsula Clay Culbreth Oyster Point/Middle Peninsula Area Bobby Philips Oakland/Upper Peninsula Area Clay Culbreth Williamsburg Extended Area Bobby Phillips Financial Support Disclosure The E. V. Williams Center for Real Estate and Economic Development (CREED) functions and reports are funded by donations from individuals, organizations and the CREED Council. The data used for this report are deemed reliable; however, neither Old Dominion University, the E. V. Williams Center for Real Estate and Economic Development, nor sponsoring companies and/or individuals makes any representation or warranty as to its accuracy INDUSTRIAL


28 General Overview This report analyzes the 2010 industrial real estate conditions within the Virginia Beach-Norfolk-Newport News, VA-NC Metropolitan Statistical Area (the MSA), also known as Hampton Roads. It provides inventory, vacancy, rent, sale and other data for the MSA. The survey includes properties in the cities of Chesapeake, Hampton, Newport News, Norfolk, Poquoson, Portsmouth, Suffolk, Virginia Beach and Williamsburg, plus the counties of Gloucester, James City, York and Isle of Wight. METHODOLOGY This survey includes the following types of properties: Office-warehouse, industrial and shop facilities of 5,000 square feet or greater, although some facilities of less than 5,000 may be included. Properties must have less than 80% office space to be included in the ODU survey. Both owner-occupied and leased properties are included. Owner-occupied is defined as property that is 100% occupied by a business that is the same as or is related to the owner of the building. Leased properties are defined as all properties that are available and are listed for sale or lease regardless of whether they are occupied, unless they are strictly available for sale as an investment property, for example, a property that is available for sale and is currently occupied on a short term lease is included. All properties that have commenced construction (foundations installed as a minimum). The survey excludes the following types of properties: Land Warehouse or shop facilities on shipyard properties. Warehouse or industrial facilities on federal government property (e.g. military installations). Industrial facilities on government property (e.g. Norfolk International Terminal or Newport News Marine Terminal) Hampton Roads Real Estate Market Review 26
29 2011 I N D U S T R I A L Functional submarket delineations are determined with some regard to city boundaries, but boundaries are not determinative. The entire market is divided into 16 submarkets defined by industrial building concentrations, the transportation network, and pertinent physical features. The area map included in this report provides a location for key reference. The E.V. Williams Center for Real Estate and Economic Development (CREED) at Old Dominion University has been tracking the inventory of the Hampton Roads industrial market since The results of this year s survey (collected during the 4th quarter of 2010) indicate that the Hampton Roads industrial market currently encompasses 106,691,857 square feet of space located in 2,866 buildings throughout the Region. This is a decrease of 2,030,258 square feet, or 1.9% from last year s survey. The decrease is primarily due to the demolition of approximately 1 million square feet on the former Ford plant and increased accuracy of surveyors over previous years. Totals may differ from other market surveys due to the self-imposed limitations established by the ODU CREED methodology described above. INTRODUCTION The Hampton Roads industrial market continues to grow in complexity, while 2010 was mired in mediocrity. In 2010, overall vacancy rates remained essentially steady at 12.48%, deal velocity and absorption slowed, rents and sales prices declined, and there were no substantial deliveries. On the other side of the coin, interest in the Region continues from outside the area with a number of companies considering Hampton Roads for new manufacturing and distribution centers. Port volumes are increasing and a few large transactions took place in anticipation of a market rebound. John Wright, President of Waverton Associates, developer of a world class 300 acre, rail served industrial park in Suffolk relates: Interest in Waverton Commerce Park has not abated over the last few years, and in 2010 we got close to landing two national prospects. We see the increase in manufacturing nationwide and the upturn in export traffic through the Port of Virginia as a good leading edge indicator of where Hampton Roads can go in the next few years. VACANCIES In 2010, the Hampton Roads Region saw vacancy rates decrease marginally from a 2009 level of 12.94% to 12.48%. Only four of the 16 submarkets were spared increasing vacancy rates. Submarkets that improved: Norfolk Commerce Park/Central Norfolk saw a decrease in vacancy rate from 38.41% to 16.3%. The former Ford manufacturing plant demolished almost 1.6 million square feet of obsolete space. The result was a decrease in total square footage of space, a reduction in vacant space, and the decline in vacancy rate. Suffolk saw a minor reduction from 19.13% to 18.27% with modest absorption. Caspari, Inc., a distribution company, leased 60,762 square feet at the Regional Commerce Center off Rt. 58 and Rt Northern Suffolk (Northgate and Bridgeway Commerce Park) also saw absorption. Oyster Point/Middle Peninsula maintained strong occupancy rates, with only 157,203 square feet available in a market of 4.3 million square feet. Isle of Wight. Cost Plus took their excess space off the market, thereby reducing vacancy in the market by 240,000 square feet. Markets that fared significantly worse in 2010 include: The City of Chesapeake (Greenbrier, Cavalier, and Bainbridge/South Elizabeth River) saw overall vacancy rise from 1,795,076 square feet to 2,429,786 square feet, a 35% increase from 8.8% to 11.88%. The addition of the Chesapeake Hardwoods accounted for much of the increase, with Greenbrier and Cavalier each adding vacant space. Airport Industrial Park, Virginia Beach. Vacancy rates increased to 18.35% from 9.67%. 318,000 square feet of (primarily) older warehouse and distribution space came on line in Southside Hampton Roads finished 2010 with a vacancy rate of 13.24% compared to 14.29% for 2009, improving slightly. The Peninsula edged up to 10.59% from 9.49% a year ago. Overall Hampton Roads actual vacancy in 2010 reached 13,313,836 square feet compared to 14,071,871 in INDUSTRIAL 27
30 TABLE ODU Hampton Roads Industrial Survey Submarket Totals Bldgs Submarket City Surveyed Reporter Total Sq Ft Vacancy Sq Ft Vacancy % Greenbrier Area Chesapeake 283 Kaempfe 8,587, , % Bainbridge/S. Elizabeth River Area Chesapeake 143 Worley 5,835, , % Cavalier Industrial Park Area Chesapeake 189 Mumey 6,075, , % Norfolk Commerce Park/ Norfolk 144 Remick 5,442, , % Central Norfolk Area Norfolk Industrial Park Area Norfolk 352 Dickinson 10,196,224 1,201, % West Side/Midtown Norfolk Area Norfolk 271 King 6,418, , % Lynnhaven Area Virginia Beach 283 Baker 8,132,331 1,141, % Greenwich/Cleveland Streets Area Virginia Beach 125 Beasley 3,063, , % Airport Industrial Park Area Virginia Beach 72 Beasley 3,637, , % City of Portsmouth Portsmouth 161 Walker 4,221, , % City of Suffolk Suffolk 124 Throne 11,578,012 2,115, % Isle of Wight Isle of Wight 30 King 2,970, , % Southside Totals 2,177 76,158,895 10,081, % Copeland/Lower Peninsula Area Peninsula 370 Culbreth 12,139,266 2,038, % Oyster Point/Middle Peninsula Area Peninsula 123 Phillips 4,330, , % Oakland/Upper Peninsula Area Peninsula 134 Culbreth 4,940, , % Williamsburg Extended Area Peninsula 62 Phillips 9,123, , % Peninsula Totals ,532,962 3,232, % Totals 2,866 Sanker 106,691,857 13,313, % Building Sales Sales activity levels fell in Total sales transactions are shown below for the past four years, comparing number of building sales with average sales prices. Year Total Sales Average Size Average Price Per Square Foot ,901 $ ,828 $ ,377 $ ,200 $27.63 A few analytical notes: 1. Number of Sales: The data certainly reflects the general economy and national industrial market trends. Financing in Hampton Roads has been problematic. Hopefully the trend line has bottomed in Average Size: The 2010 average of 48,200 square feet is a result of four buildings sold over 100,000 square feet, and one over 450,000. At the peak of the market in 2008, only three buildings sold exceeded 100,000 square feet Hampton Roads Real Estate Market Review 28
31 2011 I N D U S T R I A L 3. Average Price Per Square Foot: Buildings sold in 2010 tended to be larger, clearly distressed properties such as 201 West Dexter Street in Chesapeake, 3800 Village Avenue in Norfolk and 2211 Elliott Avenue in Portsmouth. All suffered from a combination of functional obsolescence/deferred maintenance and were deeply discounted. In contrast, few quality industrial buildings from 10,000 to 30,000 square feet (arguably the core size range for industrial users in Hampton Roads) traded in In 2008, 24 buildings sold in this square footage range. In 2010, only three traded. One possible conclusion: sellers who sell are truly distressed and buyers who buy are looking for deep discounts. Many companies are choosing to stand pat in lieu of selling and relocating. Reasons include: 1. Uncertainty in the future of business regulation and taxation; 2. Growth and expansion as a corporate goal has generally been replaced with a drive toward greater efficiency and reduction in debt; 3. A depressed real estate market; 4. A shortage of prospective buyers, causing concern about extended marketing periods; 5. Banking pressures to reduce overall debt load, including operational debt, lines of credit, equipment and real estate; 6. Difficulty in obtaining acquisition financing with favorable terms to fund expansion and/or renovation. As a result, the industrial market has produced a self-induced drag on sales: Healthy companies choosing or needing to wait, and the lack of buyers forcing prices downward, in turn restricting their ability to sell and move to better facilities. Representative Building Sales As a result, the industrial market has produced a self-induced drag on sales: Healthy companies choosing or needing to wait, and the lack of buyers forcing prices downward, in turn restricting their ability to sell and move to better facilities. 201 Dexter Street, Chesapeake December ,501 SF $6,000,000 $13.11 per SF 215 Suburban Drive, Suffolk December ,055 SF $4,150,000 $40.66 per SF 2211 Elliot Avenue, Portsmouth April ,046 SF $1,600,000 $21.04 per SF 3800 Village Avenue, Norfolk March ,000 SF $2,000,000 $20.00 per SF 715 Industrial Park Drive, Newport News January ,480 SF $305,000 $68.08 per SF 1201 West Olney Road, Norfolk April ,979 SF $350,000 $70.30 per SF 615 Chautauqua Avenue, Portsmouth July ,206 SF $360,000 $43.87 per SF Miller Store Road, Virginia Beach October ,000 SF $2,915,000 $72.83 per SF Leasing As expected, current vacancy rates have driven lease rates downward as landlords have worked to attract or retain tenants. In 2009 smaller spaces were less susceptible to rate retreat, but in 2010, all square foot sizes were vulnerable. High bay distribution buildings continued to suffer, with older obsolete buildings begging for tenants. In outlying areas, rents could be found as low as $1.00 per square foot. Free rent is a preferred concession, with financing for high levels of tenant improvements difficult to obtain for some landlords. One to two months of free rent for each year of lease term is not uncommon INDUSTRIAL 29
32 Representative Leasing 1140 Azalea Garden Road, Norfolk 44,450 SF $ years 1431 Baker Road, Virginia Beach 38,580 SF $ years 6701 Bridgeway Business Center, Suffolk 20,450 SF $ years 3732 Cook Boulevard, Chesapeake 23,580 SF $ years 905 Live Oak Drive, Chesapeake 5,000 SF $ years 4840 Brookside Court, Norfolk 18,900 SF $ years 3745 Progress Road, Norfolk 32,000 SF $ years 680 Carolina Road, Suffolk 7,695 SF $ years 6900 Harbour View, Suffolk 31,500 SF $ years 2101 Aluminum Avenue, Hampton 32,000 SF $ years 720 Greenlawn Avenue, Hampton 44,000 SF $ years Rents For Available Spaces By Size Range 2010 <5,000 square feet $5.00-$6.50 5,000 to 20,000 square feet $4.50-$ ,000-40,000 square feet $3.25-$ ,000-60,000 square feet $2.00-$4.50 >60,000 square feet $1.00+ Major Market Activity Aside from normal market transactions, there have been a number of significant industrial market developments worthy of note. 1. Jacoby Development, former Ford Plant. Purchase of the property was imminent as 2010 came to a close by Atlanta Developer Jacoby Development. The City of Norfolk approved bond financing of $12 million to assist in the purchase, demolition and improvement of the property including the demolition of 1.6 million square feet in specialized manufacturing space, while 662,450 square feet of warehouse and manufacturing space remains along with acreage available for development. 2. International Paper. A major employer in western Hampton Roads, this closure was a blow to the employment market. In addition to the Franklin mill, International Paper owns a number of other available industrial buildings in Hampton Roads in Cavalier Industrial Park in Chesapeake, Suffolk and Newport News submarkets. The International Paper property is not included in the ODU Survey due to its location in Isle of Wight County traditionally outside the survey boundaries. 3. Kinder Morgan purchased 41 acres to add to their terminaling operations on Freeman Avenue in Chesapeake along the Elizabeth River West Dexter Street, Chesapeake. The sale of this 457,501 square foot industrial building on 21 acres on South Dexter Street demonstrates that creativity helps in today s market. The sale included a corporate bankruptcy filing; a sale of debt on the property; an auction of the real estate; and investors looking for a great deal to hold for future development. Ultimate sales price: $6 million, or $13.11 per square foot Suburban Drive, Suffolk. One local company expanded in 2010 with the purchase of a 102,000 square foot building in eastern Suffolk. Kerma Medical relocated from Portsmouth almost doubling in size and achieving greater manufacturing efficiencies. 6. Becton Dickenson. One that got away. Becton Dickenson was searching for 600,000 square feet with expansion to 1,000,000 square feet in Virginia and North Carolina. North Carolina got the requirement. This deal reflects the strengths and some of the challenges facing Hampton Roads in attracting top quality industrial companies to the area Hampton Roads Real Estate Market Review 30
33 2011 I N D U S T R I A L Regional Influences on the Local Market Beyond real estate transactions, the following events occurred in 2010 that will influence the Hampton Roads Industrial market for years to come. 1. The Port of Virginia MAERSK/Port of Virginia lease. In Fall 2010, the Port of Virginia and APM Terminals signed a 20 year lease agreement assigning operational control of this state of the art terminal to Virginia International Terminals, the operating arm of the Port of Virginia. The APM facility is equipped with advanced automated cranes and immediate rail access to the CSX and Norfolk Southern Class I rail lines. TEU volumes (import and export) at the Port of Virginia were up in 2010 by 8.9% to 1,859,018 TEU s, but still less than 2005 levels. Export volume exceeded import volume 54% to 46%. Commenting on port volumes, Neil Doyle of CenterPoint Properties relates: Though port volumes, as measured by the Virginia Port Authority in TEU s, seem to indicate a clear rebound in trade in 2010, its effect on the industrial real estate market in Hampton Roads has yet to be realized. Or has it? One would argue that the local industrial market is undersized for the port volumes, yet we still see double digit vacancy. There is disconnect there (be it product type, location, or other factor) with space offered to users and 2012 should offer us a few more pieces of this puzzle and begin to foreshadow the future of the ports and the local industrial real estate market allowing those with a vested interest a road map going forward. Norfolk Southern and the Heartland Corridor. In September, trains rolled to Columbus, Ohio and Chicago, Illinois along the new Heartland Corridor. An investment of $320 million in both public and private funds allow double stacked trains to reduce the distance to Chicago by 230 miles, cutting delivery time by a day and a half, and doubling the potential container volume per car. Conclusion: HREDA and the Year Ahead The Hampton Roads Economic Development Alliance December Business Attraction Report for 2010 is one report card for the Region. Reporting on activity for 2010 as it compares to previous years, the report presents the following: Project Year YTD December 2010 Projects n/a Prospect Visits Announcements Capital Investment (millions) $94.27 $18.75 $8.2 Square footage 772, ,700 88,100 Clearly the Hampton Roads industrial market is suffering. Whether 2010 represented bottom is open to speculation. The last time the local industrial market experienced vacancy rates above 12%, the recovery took three years to return to less than 10%, and another five years to reach a norm of around 7%. Looking forward to 2011, ground level business users are looking at varied economic indicators in the marketplace to gauge where their businesses are going. Industrial companies in the Hampton Roads MSA are setting their sights on a wide variety of market influences, including trend lines in sales volumes, energy costs and production expenditures, in projecting performance levels in For industrial companies, both large and small, the instability in the marketplace experienced during the last several years has changed the structure of how business is done. Recovery efforts and sales volume in 2010 indicate that the trend line is pointed in the right direction offering a modest degree of optimism for 2011 and beyond. As we move out of 2010, the Industrial real estate market is looking for measured steady growth back to health INDUSTRIAL 31

34 Industrial Submarkets Southside Airport Industrial Park Bainbridge Cavalier Central Norfolk Cleveland Greenbrier Lynnhaven Norfolk Industrial Park Portsmouth Suffolk West Norfolk Peninsula Copeland Oakland Oyster Point Williamsburg Extended

 functions and")


35 2011 HAMPTON ROADS REAL ESTATE MARKET REVIEW OFFICE Author Data Analysis Maureen G. Rooks Vice President, Jones Lang LaSalle Nicolas Politas Research & Financial Analyst Jones Lang LaSalle Financial Support Disclosure The E. V. Williams Center for Real Estate and Economic Development (CREED) functions and reports are funded by donations from individuals, organizations and the CREED Council. The data used for this report are deemed reliable; however, neither Old Dominion University, the E. V. Williams Center for Real Estate and Economic Development, nor sponsoring companies and/or individuals makes any representation or warranty as to its accuracy OFFICE 33


36 General Overview TThe Hampton Roads office market ended 2010 with relative stability and with statistical performance reflecting a slow yearend turn towards recovery and potential growth in Representing a tenant-oriented marketplace driven by economic incentives, a notable inventory of new supply, and stagnant leasing activity, the Hampton Roads office market is looking to market performance during the first two quarters of 2011 as an important predictor of overall market recovery characterized by positive absorption and decreasing vacancy rates. The overall office vacancy rate for Hampton Roads remained a steady 14.6 percent at year-end 2010 bearing little traction from the year-end 2009 vacancy rate of 14.5 percent for the region. However, Hampton Roads did outperform the National Office Market vacancy of 16.2 percent and demonstrated relative market strength in comparison with other regional markets The information in this report relies on market reports from the Brookings Institution, CoStar METHODOLOGY and individual interviews of local office brokers. The methodology or parameters of size included in the report for all of Hampton Roads were 19,000 SF and higher for the largest completed lease transactions in 2010; 5,000 SF and higher were included for the top completed office building sales transactions in 2010; approximately five acres and higher were included for the top completed office land sales transactions in 2010; and 19,000 SF and higher were included for top new construction deliveries in OFFICE MARKET ACTIVITY LIKELY TO PICK UP IN 2011 Economy The economy in Hampton Roads has remained resilient, and was recently recognized in a study by the Brookings Institution as a top performing region in the United States. The study analyzed economic performance during the recession and during post-recession recovery, focusing on data representing employment and economic output. Unemployment in Hampton Roads has dropped to 7.0 percent, from its peak rate of 7.4 percent in August The dust has started to settle around the disestablishment of United States Joint Forces Command (USJFCOM), and initial fears have subsided as the potential consequences may prove to be less of an economic impact than initially anticipated. Uncertainty following the announced disestablishment of the USJFCOM prompted tenants and investors in the market to step back and observe how the market would be affected. There is still a level of residual uncertainty surrounding a potential spike in vacancy from tenants tied to USJFCOM causing some government contractor office tenants to close, downsize, or discontinue any expansions planned for fourth quarter 2010 and the first half of Hampton Roads Real Estate Market Review 34
37 2011 O F F I C E New and existing Hampton Roads tenants are preparing to backfill vacancies created by USJFCOM s exodus in the Harbour View area of Suffolk. In addition, Hampton Roads looks forward to the benefits of the completion of the Norfolk Southern Heartland Corridor which will be a direct rail connection from the Virginia ports to Chicago. Market Conditions In many ways, 2010 represented a settling period in the market. Other than medical sector growth, some government contractors, and private colleges and universities entering and expanding in the Hampton Roads area, there has been little economic growth by way of office tenants. There were fewer lease transactions completed in the last quarter of 2010 than any other since the beginning of 2009, resulting in a fairly stagnant market. The overall vacancy rate remained a steady 14.6 percent, which is still below the National Office Market vacancy of 16.2%. Rental rates remained flat throughout the year, and large rent abatements remain prevalent. Despite the lack of leasing activity, brokers in the market reported a surge in tour activity. The increase in tour activity due to new tenants entering the market will hopefully translate into positive absorption and continued increases in activity in Outlook Market performance during the first two quarters of 2011 will be especially important in measuring overall market recovery and potential growth in Hampton Roads. Leasing activity is expected to increase as tenants gain more confidence in the market. Rent rates will likely remain relatively flat over the next 12 months, and tenants will continue to expect highly attractive rent concessions. The market has become less dependent on blend and extend renewals and it is possible that fundamentals will begin to shift as early as the fourth quarter of 2011 or the beginning of Pricing Demand Supply Key Market Indicators Supply 26,816,106 sf Direct vacancy rate 13.7% Total vacancy rate 14.6% Under construction 80,742 sf Leasing activity 12 mo. % change -14.7% YTD net absorption 281,916 sf 12-month overall rent % change -4.1% Class A overall asking rent Class B overall asking rent $21.37 psf $16.09 psf 12-month forecast *Please note the above statistics were derived and referenced from the Brookings Institution. They offered the overall office vacancy rate of Hampton Roads at 14.6%. CoStar s statistics, which are also referenced in this report, differed by 2% offering an overall office vacancy rate of 12.6%. The percentage difference is the utilization of A,B,C & F office properties with Brookings and only A,B & C office properties with CoStar. Net New Supply, Net Absorption and Total Vacancy 1,500,000 20% Leasing Activity vs. Sublease Vacant Space 1,000,000 15% 2,000,000 Leasing Activity Sublease Space Square Feet 500, , Net New Supply Total Vacancy Net Absorption 10% 5% 0% Square Feet 1,500,000 1,000, , OFFICE Sublease space includes vacant space. 35
38 Tenant Perspective As the Hampton Roads market continues to stabilize, tenants remain in the driver seat with a significant advantage in the market. Economic uncertainty surrounding the disestablishment of USJFCOM and overall high vacancy has put pressure on landlords to offer greater incentives to keep the tenants they currently have and to compete for tenants entering the market. Free rent and high tenant improvement allowances have become commonplace and will remain in place over the next 12 months, most likely tightening during the course of The bottomed-out rental rates and high competition among landlords continues to present the opportunity for tenants to trade up to higher class space at similar or cheaper costs than currently experienced. The next two quarters will become the optimal timing for tenants looking to renew and cut rent costs as economic incentives should begin a decline within the third quarter of Landlord Perspective Landlords must focus on keeping the tenants they have, while offering attractive rates and rent abatements to aggressively lure tenants entering the market. As the market in Hampton Roads bottomed out, the lack of new leasing activity extended landlords struggle to maintain high occupancy rates. In order to stay competitive, landlords have been forced to drop rental rates below what they were at the end of 2006, and offer more free rent plus larger tenant improvement allowances. The aftermath of the recession has left landlords with large debt obligations that must become top priority. With over 4.6 million square feet in new supply added to the market since the start of 2007, it is highly unlikely that there will be any speculative office construction in the next months. Landlords are currently at the bottom of the market slowly moving up; and those owning top quality spaces can expect fundamentals to begin to shift as early as the fourth quarter of Class A Overall Asking Rents $25 Peninsula Southside $20 Class A Tenant Improvement Allowance $20 Peninsula Southside $ Per Square Feet $15 $10 $5 $ Per Square Feet $10 $ $ Class A Free Rent Months 8 Peninsula Southside Class A Blocks of Vacant Contiguous Space Number of Blocks ,000-50,000 SF Peninsula 4 50, ,000 SF Southside 100, ,000 SF 0 0 > 200,000 SF 2011 Hampton Roads Real Estate Market Review 36
39 2011 O F F I C E Submarket Leverage Market History and Forecast Submarket Newport News Hampton Williamsburg Yorktown Norfolk Virginia Beach Portsmouth Chesapeake Suffolk Property Clock Current Market Conditions Landlord Leverage Peaking Market Rising Market Falling Market Bottoming Market Peninsula Southside Tenant Leverage Landlord-favorable conditions Tenant-favorable conditions Balanced conditions Largest Completed Lease Transactions Tenant Address Submarket SF Type Labels Unlimited 2505 Hawkeye Court Virginia Beach 65,000 Expansion Verizon Wireless 240 Clearfield Avenue Virginia Beach 52,329 Renewal Monarch Bank 1435 Crossways Boulevard Chesapeake 52,000 Relocation Tidewater Physicians Multi-Specialty Group Discovery Park Drive Williamsburg 40,000 Build-to-suit Booz Allen Hamilton Inc 5800 Lake Wright Drive Norfolk 34,577 Renewal ISHPI 6900 Harbour View Boulevard Suffolk 31,500 Relocation Strayer University 676 Independence Parkway Chesapeake 25,622 New Amerigroup 4433 Corporation Lane Virginia Beach 23,532 New URS Federal Technical Services Inc Progress Road Norfolk 23,116 Renewal Towne Insurance 301 Bendix Road Virginia Beach 19,000 Relocation Co-Writers: Nicolas Politas; Research & Finance Analyst; Maureen Rooks, Vice President, Jones Lang LaSalle Sources: CoStar Group, Inc. Top Completed Office Building Sales/Transactions Address Submarket Buyer / Seller SF $ PSF 2600 Washington Avenue Newport News Sage Realty Partners / Berkadia Comm Mtg LLC 134,172 $ Independence Parkway Chesapeake First Potomac Realty Trust / VJM LLC 96,720 $ Crossways Blvd Chesapeake Monarch Bank / Crossways Center LLC 50,882 $ Harbour View Blvd Suffolk HC REIT / Harbour View Medical Arts LLC 49,000 $ Robin Hood Road Norfolk Robin Hood Road LLC / Undisclosed 42,000 $ Fishing Point Drive Newport News Fishing Pt LLC / Oysterpoint Med Ctr LLC 32,174 $ Jefferson Avenue Newport News BBK Enterprises LLC / JSA Four LLC 20,311 $ Marshall Avenue Newport News Wright Real Estate Hldgs LLC / JMC Comm LLC 19,256 $ J Clyde Morris Blvd Newport News Tidewater PT Inc / Helmuth W Treishmann Jr 18,000 $ W Freemason Street Norfolk US Old Pt Natl Bank of Phoeb / Zemanian Peter G 8,457 $ E Plume Street Norfolk KJR Plume LLC / SL Nusbaum Realty Co 4,884 $ OFFICE
40 Top Completed Office Land Sales/Transactions Address Submarket Buyer / Seller Acres $ PSF Princess Anne Rd / S. Ind Blvd Virginia Beach Wells Fargo Bank NA / Spence Family Farm LP $ Jefferson Avenue Newport News WM Jordan Company / W&M Real Estate Foundation 43.5 $ Carolina Road Suffolk Better Health Care Family Svcs LLC / 4.43 $17.88 L Walton & H Ismael 1600 Richmond Road Williamsburg CVS Caremark / Americas Best Value Inn 4.04 $ International Blvd Norfolk Edward Street LLC / Park Crescent Associates LP 7.70 $ Monticello Avenue Williamsburg New Town Six LLC / Exxon Mobil Corporation 4.92 $10.73 Top Select New Construction Deliveries (2010) Address Submarket Broker / Developer SF The Wells Fargo Center Norfolk SL Nusbaum Realty Co 299,887 Medical Office Tower Norfolk Lauth Property Group 196,000 Virginia Natural Gas Bldg Virginia Beach Divaris Real Estate Inc 48, Production Road Yorktown Harvey Lindsay Commercial Real Estate 30, Holland Road Virginia Beach Thalhimer 27,844 Towne Bank Suffolk TowneBank Foundation 19,318 Class A Office Market Statistics Hampton Roads (Year-end 2010) Market Existing Inventory Vacancy YTD net YTD Under Quoted Absorption Deliveries Const SF Rates # Blds Total r.b.a. Direct SF Total SF Vac % Peninsula 35 2,956, , , % 18, $20.93 Southside ,863,360 1,670,016 1,727, % 353, ,887 0 $21.46 Totals ,820,084 2,068,313 2,134, % 372, ,887 0 Class B Office Market Statistics Hampton Roads (Year-end 2010) Market Existing Inventory Vacancy YTD net YTD Under Quoted Absorption Deliveries Const SF Rates # Blds Total r.b.a. Direct SF Total SF Vac % Peninsula 654 8,477, ,662 1,007, % 33,607 47,332 48,000 $15.87 Southside ,579,924 1,971,750 2,018, % (53,274) 119, $16.25 Totals ,057,556 2,942,412 3,026, % (19,667) 166, Hampton Roads Real Estate Market Review 38
41 2011 O F F I C E Class C Office Market Statistics Hampton Roads (Year-end 2010) Market Existing Inventory Vacancy YTD net YTD Under Quoted Absorption Deliveries Const SF Rates # Blds Total r.b.a. Direct SF Total SF Vac % Peninsula 403 2,159, , , % (28,443) 0 0 $11.78 Southside 1,018 6,381, , , % (62,282) 0 0 $13.60 Totals 1,421 8,540, , , % (90,725) 0 0 Total Office Market Statistics Hampton Roads (Year-end 2010) Market Existing Inventory Vacancy YTD net YTD Under Quoted Absorption Deliveries Const SF Rates # Blds Total r.b.a. Direct SF Total SF Vac % Peninsula 1,092 13,593,414 1,600,275 1,645, % 23,870 47,332 48,000 $16.69 Southside 1,894 31,825,215 4,017,937 4,124, % 237, ,394 47,501 $18.36 Totals 2,986 45,418,629 5,618,212 5,770, %* 261, ,726 95,501 *Please note the above statistics were derived and referenced from the Brookings Institution. They offered the overall office vacancy rate of Hampton Roads at 14.6%. CoStar s statistics, which are also referenced in this report, differed by 2% offering an overall office vacancy rate of 12.6%. The percentage difference is the utilization of A,B,C & F office properties with Brookings and only A,B & C office properties with CoStar. Class A - Significant Office Market Statistics Hampton Roads (Year-end 2010) Market Existing Inventory Vacancy YTD net YTD Under Quoted Absorption Deliveries Const SF Rates # Blds Total r.b.a. Direct SF Total SF Vac % Downtown Norfolk 11 2,650, , , % 44, ,887 0 $23.38 Harbour View 11 1,055, , , % 19, $22.18 Oyster Point 16 1,128, , , % (4,829) 0 0 $21.69 VA Beach CBD 14 1,297,764 99, , % 100, $23.43 Totals 52 6,132, , , % 159, ,887 0 Class B - Significant Office Market Statistics Hampton Roads (Year-end 2010) Market Existing Inventory Vacancy YTD net YTD Under Quoted Absorption Deliveries Const SF Rates # Blds Total r.b.a. Direct SF Total SF Vac % Downtown Norfolk 53 1,912, , , % (57,781) 0 2,000 $16.40 Harbour View ,967 41,494 41, % 21,308 32,578 12,930 $18.92 Oyster Point 197 3,089, , , % (40,851) 0 0 $15.93 VA Beach CBD ,684 67,259 71, % 15, $18.35 Totals 292 6,168, , , % (61,402) 32,578 14, OFFICE 39
42 Class C - Significant Office Market Statistics Hampton Roads (Year-end 2010) Market Existing Inventory Vacancy YTD net YTD Under Quoted Absorption Deliveries Const SF Rates # Blds Total r.b.a. Direct SF Total SF Vac % Downtown Norfolk ,262 38,845 38, % (1,111) 0 0 $12.69 Harbour View 4 14,120 3,893 3, % (1,873) 0 0 $12.75 Oyster Point ,329 36,424 36, % (7,123) 0 0 $12.30 VA Beach CBD 3 8, % (15,000) 0 0 N/A Totals 190 1,110,519 79,162 79, % (25,107) 0 0 Significant Office Market Statistics Hampton Roads (Year-end 2010) Market Existing Inventory Vacancy YTD net YTD Under Quoted Absorption Deliveries Const SF Rates # Blds Total r.b.a. Direct SF Total SF Vac % Downtown Norfolk 103 4,947, , , % (14,507) 299,887 2,000 $20.50 Harbour View 38 1,574, , , % 39,137 32,578 12,930 $21.77 Oyster Point 357 4,920, , , % (52,803) 0 0 $17.65 VA Beach CBD 36 1,968, , , % 101, $21.09 Totals ,411,307 1,825,418 1,868, % 73, ,465 14,930 Source: CoStar Group, Inc Jones Lang LaSalle IP, Inc. All rights reserved. All information contained herein is from sources deemed reliable; however, no representation or warranty is made to the accuracy thereof. Hampton Roads methodology: Inventory includes all Class A, B, & C office properties Regional Office Market Comparison The relative vitality of the Hampton Roads office market can be more clearly illustrated by comparing the area s 2010 performance to the nearby Virginia market of Richmond, the District of Columbia, as well as the North Carolina markets of Raleigh-Durham and Charlotte. Clearly our regional competitive areas fared well in comparison to the United States national office vacancy rate of 16.2% in All combined, this select regional vacancy rate was 12.3%. All data is gathered from the Brookings Institution and CoStar. Q Data From CoStar Office Market Report The office vacancy rate in the Richmond, VA office market area decreased to 11.3% at the end of the fourth quarter The vacancy rate was 11.9% at the end of the third quarter 2010, 12.3% at the end of the second quarter 2010, and 12.0% at the end of the first quarter The office vacancy rate in the Raleigh-Durham, NC office market area decreased to 12.6% at the end of the fourth quarter The vacancy rate was 12.7% at the end of the third quarter 2010, 13.2% at the end of the second quarter 2010, and 13.4% at the end of the first quarter The office vacancy rate in the Charlotte, NC office market area decreased to 14.0% at the end of the fourth quarter The vacancy rate was 14.2% at the end of the third quarter 2010, 14.7% at the end of the second quarter 2010, and 14.1% at the end of the first quarter Hampton Roads Real Estate Market Review 40
43 2011 O F F I C E The office vacancy rate in the District of Columbia (Washington D.C.) office market area decreased to 10.9% at the end of the fourth quarter The vacancy rate was 11.6% at the end of the third quarter 2010, 11.9% at the end of the second quarter 2010, and 11.6% at the end of the first quarter The office vacancy rate in the Hampton Roads office market area decreased to 12.6% at the end of the fourth quarter The vacancy rate was 12.7% at the end of the third quarter 2010, 12.7% at the end of the second quarter 2010, and 12.2% at the end of the first quarter Regional Office Market Comparison Office Vacancy Rate 2010 Hampton Roads, VA Washington DC Richmond, VA Raleigh-Durham, NC Charlotte, NC 1st Quarter 12.2% 11.6% 12.0% 13.4% 14.1% 2nd Quarter 12.9% 11.9% 12.3% 13.2% 14.7% 3rd Quarter 12.7% 11.6% 11.9% 12.7% 14.2% 4th Quarter 12.6% 10.9% 11.3% 12.6% 14.0% Peninsula Class A Average Rental Rates DIRECT SPACES SUBLET SPACES TOTAL # Spaces Min Avg Max # Spaces Min Avg Max Avg Off/Med Triple Net 8 $22.00 $22.00 $ $22.00 Office Full Service Gross 69 $16.00 $19.84 $ $9.00 $13.24 $22.00 $19.66 Modified Gross 3 $16.95 $16.95 $ $16.95 Negotiable Retail Triple Net 1 $13.50 $13.50 $ $13.50 Vacancy Rate Peninsula Vacancy Rates 16% 14% 12% 10% 8% 6% 4% 2% 0% 2010 Q Q Q3 Q4 Direct/Relet Vacancy Sublet Vacancy Total Vacancy CUR QUTR Occupancy Existing Bldgs: 35 # Spaces: 88 Existing RBA: 2,956,724 Vacant: <389,936> 13% Occupied: 2,566,788 87% Leased: 2,596,988 88% Availability Vacant Avail: 367,959 12% Total Avail: 390,244 13% Direct Avail: 382,021 13% Sublet Avail: 8,223 0% Average Time: 25.8 Months Leasing activity Leasing YTD: 17,045 1% Net Absorp YTD: 16,584 1% Direct gross rent Office range: $16.00-$31.34/yr Office Avg: $21.06/yr South Hampton Roads Vacancy Rates Vacancy Rate 16% 14% 12% 10% 8% 6% 4% 2% 0% 2010 Q Q Q3 Q4 Direct/Relet Vacancy Sublet Vacancy Total Vacancy CUR QUTR Occupancy Existing Bldgs: 117 # Spaces: 314 Existing RBA: 10,863,360 Vacant: <1,661,000> 15% Occupied: 9,202,360 85% Leased: 9,348,257 86% Availability Vacant Avail: 1,567,167 14% Total Avail: 1,947,667 18% Direct Avail: 1,857,310 17% Sublet Avail: 90,357 1% Average Time: 23.4 Months Leasing activity Leasing YTD: 27,791 0% Net Absorp YTD: 66,691 1% Direct gross rent Office range: $15.50-$29.50/yr Office Avg: $21.61/yr 2011 OFFICE 41
44 Peninsula Class A - Average Rental Rates DIRECT SPACES SUBLET SPACES TOTAL # Spaces Min Avg Max # Spaces Min Avg Max Avg Off/Med Full Service Gross 17 $21.00 $25.16 $ $22.38 $22.38 $22.38 $25.07 Negotiable Plus Cleaning 2 $17.95 $18.11 $ $18.11 Triple Net 6 $16.50 $17.14 $ $17.14 Office/Ret Full Service Gross 1 $24.95 $24.95 $ $24.95 Modified Gross 3 $22.00 $22.68 $ $22.68 Office + Elec & Clean 1 $17.25 $17.25 $ $17.25 Full Service Gross 216 $16.00 $21.32 $ $14.00 $16.23 $23.00 $20.98 Modified Gross 1 $17.50 $17.50 $ $17.50 Negotiable Net 4 $15.50 $17.14 $ $17.14 Plus Cleaning $18.50 $18.50 $18.50 $18.50 TBD 9 $20.00 $20.56 $ $20.56 Triple Net 12 $13.50 $21.23 $ $21.23 Retail Full Service Gross Triple Net 4 $21.00 $21.00 $ $21.00 Utilities & Char 2 $22.50 $22.50 $ $22.50 Peninsula Class B - Average Rental Rates DIRECT SPACES SUBLET SPACES TOTAL # Spaces Min Avg Max # Spaces Min Avg Max Avg Off/Med Full Service Gross 1 $16.00 $16.00 $ $16.00 Modified Gross 5 $12.00 $13.53 $ $13.53 Net 9 $16.50 $17.66 $ $17.66 Plus All Utilities 4 $10.46 $14.49 $ $14.49 Triple Net 5 $12.85 $13.79 $ $13.79 Utilities & Char 1 $13.50 $13.50 $ $13.50 Office/Ret Full Service Gross 4 $20.00 $20.00 $ $20.00 Modified Gross 4 $11.95 $16.55 $ $16.55 Triple Net 1 $16.00 $16.00 $ $16.00 Office + Elec & Clean 8 $10.00 $13.13 $ $13.13 Double Net 6 $11.25 $14.96 $ $14.96 Full Service Gross 128 $8.00 $16.28 $ $12.95 $13.35 $16.50 $16.16 Modified Gross 49 $9.00 $14.21 $ $12.00 $12.85 $13.75 $14.16 Negotiable Net 13 $10.00 $10.95 $ $13.00 $13.26 $13.50 $11.23 Plus All Utilities 21 $8.67 $13.40 $ $13.40 Plus Cleaning 2 $10.00 $10.68 $ $10.68 Plus Electric 5 $12.48 $15.70 $ $15.70 TBD 9 $12.31 $13.56 $ $13.56 Triple Net 45 $7.94 $14.24 $ $14.24 Utilities & Char 21 $10.00 $12.25 $ $12.25 Retail Modified Gross 1 $19.00 $19.00 $ $19.00 Net 2 $16.00 $16.00 $ $16.00 Triple Net 7 $10.00 $10.00 $ $ Hampton Roads Real Estate Market Review 42
45 Vacancy Rate Peninsula Class B Vacancy Rates 14% 12% 10% 8% 6% 4% 2% 0% 2010 Q Q Q3 Q4 Direct/Relet Vacancy Sublet Vacancy Total Vacancy CUR QUTR Occupancy Existing Bldgs: 657 # Spaces: 385 Existing RBA: 8,489,034 Vacant: <1,026,225> 12% Occupied: 7,462,809 88% Leased: 7,550,970 89% Availability Vacant Avail: 975,283 11% Total Avail: 1,122,314 13% Direct Avail: 1,083,844 13% Sublet Avail: 38,469 0% Average Time: 28.8 Months Leasing activity Leasing YTD: 27,062 0% Net Absorp YTD: (4,844) (0%) Direct gross rent Office range: Office Avg: $7.94-$34.77/yr $15.34/yr Vacancy Rate South Hampton Roads Class B Vacancy Rates 14% 12% 10% 8% 6% 4% 2% 0% 2010 Q Q Q3 Q4 Direct/Relet Vacancy Sublet Vacancy Total Vacancy CUR QUTR Occupancy Existing Bldgs: 762 # Spaces: 656 Existing RBA: 14,677,776 Vacant: <1,996,473> 14% Occupied: 12,681,303 86% Leased: 12,852,609 88% Availability Vacant Avail: 1,872,873 13% Total Avail: 2,390,831 16% Direct Avail: 2,317,735 16% Sublet Avail: 67,454 0% Average Time: 21.9 Months Leasing activity Leasing YTD: 17,198 0% Net Absorp YTD: (13,222) (0%) Direct gross rent Office range: Office Avg: $6.00-$40.00/yr $15.59/yr South Hampton Roads Class A - Average Rental Rates DIRECT SPACES SUBLET SPACES TOTAL # Spaces Min Avg Max # Spaces Min Avg Max Avg Med Full Service Gross 10 $18.00 $21.31 $ $21.31 Utilities & Char 1 $18.00 $18.00 $ $18.00 Triple Net 6 $16.50 $17.14 $ $17.14 Off/Med Double Net 2 $15.50 $15.50 $ $15.50 Full Service Gross 23 $12.00 $18.96 $ $18.96 Modified Gross 4 $12.88 $14.74 $ $14.74 Negotiable Net 1 $13.75 $13.75 $ $13.75 Plus All Utilities 3 $12.00 $12.75 $ $12.75 Plus Cleaning 1 $20.00 $20.00 $ $20.00 Tenant Electric 1 $13.00 $13.00 $ $13.00 Triple Net 8 $12.00 $17.53 $ $18.00 $18.00 $18.00 $17.61 Utilities & Char 4 $17.00 $18.57 $ $11.00 $11.00 $11.00 $16.62 Office/Ret Double Net 1 $14.95 $14.95 $ $14.95 Full Service Gross 2 $16.00 $17.30 $ $17.30 Modified Gross 2 $10.00 $12.30 $ $12.30 Negotiable Net 1 $18.00 $18.00 $ $18.00 Plus Cleaning 2 $22.50 $22.50 $ $22.50 TBD Triple Net 3 $9.95 $17.63 $ $17.63 Office + Elec & Clean 26 $12.00 $14.20 $ $14.20 Double Net 5 $11.95 $12.10 $ $12.10 Full Service Gross 292 $11.00 $16.33 $ $12.50 $16.50 $20.00 $16.34 Modified Gross 54 $8.55 $15.55 $ $15.55 Negotiable 40 $12.86 $12.86 $ $12.86 Net 41 $10.00 $12.51 $ $12.51 Plus All Utilities 8 $11.29 $11.68 $ $11.68 Plus Cleaning 16 $12.95 $15.15 $ $15.15 Plus Electric 9 $10.00 $14.11 $ $14.11 TBD 5 $14.00 $16.10 $ $14.50 $14.50 $14.50 $15.93 Tenant Electric 2 $13.00 $13.00 $ $13.00 Triple Net 51 $6.00 $12.68 $ $17.00 $17.00 $17.00 $12.71 Utilities & Char 17 $9.95 $15.00 $ $15.00 Retail Full Service Gross 1 $22.00 $22.00 $ $22.00 TBD 1 $16.00 $16.00 $ $16.00 Triple Net 4 $12.00 $20.46 $ $ OFFICE 43
46 Peninsula Class C - Average Rental Rates DIRECT SPACES SUBLET SPACES TOTAL # Spaces Min Avg Max # Spaces Min Avg Max Avg Med Modified Gross 1 $11.50 $11.50 $ $11.50 Off/Med Double Net 1 $13.00 $13.00 $ $13.00 Triple Net 2 $10.00 $10.00 $ $10.00 Office/Ret Full Service Gross 2 $10.00 $11.00 $ $11.00 Negotiable Triple Net 1 $12.50 $12.50 $ $12.50 Office + Elec & Clean 1 $12.00 $12.00 $ $12.00 Double Net 1 $9.50 $9.50 $ $9.50 Full Service Gross 57 $7.20 $10.37 $ $12.00 $12.00 $12.00 $10.39 Modified Gross 22 $8.00 $12.32 $ $12.32 Negotiable Net 11 $9.50 $12.20 $ $12.20 Plus All Utilities 4 $6.40 $9.25 $ $9.25 Plus Cleaning 1 $22.91 $22.91 $ $22.91 Plus Electric 1 $15.00 $15.00 $ $15.00 Triple Net 9 $8.00 $13.07 $ $13.07 Utilities & Char 17 $9.50 $10.99 $ $13.50 $13.50 $13.50 $11.18 Vacancy Rate Peninsula Class C Vacancy Rates 12% 10% 8% 6% 4% 2% 0% 2010 Q Q Q3 Q4 Direct/Relet Vacancy Sublet Vacancy Total Vacancy CUR QUTR Occupancy Existing Bldgs: 412 # Spaces: 144 Existing RBA: 2,209,180 Vacant: <234,653> 11% Occupied: 1,974,527 89% Leased: 2,003,886 91% Availability Vacant Avail: 206,029 9% Total Avail: 252,879 11% Direct Avail: 249,642 11% Sublet Avail: 3,235 0% Average Time: 14.6 Months Leasing activity Leasing YTD: 31,141 1% Net Absorp YTD: (2,602) (0%) Direct gross rent Office range: Office Avg: $6.40-$22.91/yr $11.73/yr South Hampton Roads Class C Vacancy Rates Vacancy Rate 14% 12% 10% 8% 6% 4% 2% 0% 2010 Q Q Q3 Q4 Direct/Relet Vacancy Sublet Vacancy Total Vacancy CUR QUTR Occupancy Existing Bldgs: 1028 # Spaces: 237 Existing RBA: 6,517,087 Vacant: <406,477> 6% Occupied: 6,110,610 94% Leased: 6,109,614 94% Availability Vacant Avail: 409,553 6% Total Avail: 555,053 9% Direct Avail: 546,476 8% Sublet Avail: 2,080 0% Average Time: 16.7 Months Leasing activity Leasing YTD: 2,674 0% Net Absorp YTD: (12,020) (0%) Direct gross rent Office range: $6.00-$26.23/yr Office Avg: $12.94/yr 2011 Hampton Roads Real Estate Market Review 44
47 2011 O F F I C E South Hampton Roads Class C - Average Rental Rates DIRECT SPACES SUBLET SPACES TOTAL # Spaces Min Avg Max # Spaces Min Avg Max Avg Med Plus Cleaning 1 $23.25 $23.25 $ $23.25 Off/Med Full Service Gross 1 $18.00 $18.00 $ $18.00 Modified Gross 4 $12.75 $13.84 $ $13.84 Net 2 $16.00 $16.00 $ $16.00 Plus All Utilities 1 $18.50 $18.50 $ $18.50 Plus Electric 1 $12.00 $12.00 $ $12.00 Triple Net 2 $6.86 $10.67 $ $10.67 Office/Ret Modified Gross 1 $13.00 $13.00 $ $13.00 Negotiable Plus All Utilities 3 $11.20 $12.00 $ $12.00 Plus Electric 1 $12.00 $12.00 $ $12.00 Triple Net 8 $9.09 $13.15 $ $13.15 Utilities & Char 2 $12.00 $12.32 $ $12.32 Office + Elec & Clean 8 $12.00 $15.09 $ $15.09 Full Service Gross 44 $8.42 $13.84 $ $8.42 $8.42 $8.42 $13.67 Modified Gross 27 $6.00 $12.42 $ $12.42 Negotiable Net 16 $8.00 $11.57 $ $11.57 Plus All Utilities 10 $10.20 $14.05 $ $14.05 Plus Cleaning 9 $12.00 $13.22 $ $22.80 $22.80 $22.80 $13.56 Plus Electric 9 $9.79 $11.95 $ $11.95 TBD 7 $11.86 $11.86 $ $11.86 Triple Net 43 $7.50 $11.50 $ $11.50 Retail Full Service Gross 1 $12.95 $12.95 $ $12.95 Triple Net 2 $10.00 $11.74 $ $ OFFICE 45
48 2010 Office Building Directory DOWNTOWN NORFOLK CLASS A 150 West Main Street ,183 Bank of America ,000 Crown Center ,000 Dominion Tower ,276 Fort Norfolk Medical Office Tower ,000 Main Street Tower ,000 Norfolk Southern Tower ,463 Town Point Center ,266 World Trade Center ,941 Wells Fargo Center ,000 CLASS B 101 Granby Street , W. Virginia Beach Blvd. (ABC Building) , Granby Mall Building , W. Brambleton Avenue , W. Freemason , Plume Street , E. Main St. (BB&T) ,000 City Centre ,138 Hague Medical Center ,659 Madison Office Building ,000 Monticello Arcade ,500 The Monticello Building ,000 Plume Center West ,375 RBC Centura Tower ,600 St. Paul Building ,308 Seaboard Center ,000 Tazewell Building ,000 The Helena Building ,100 Towne Bank Building ,698 Wainwright Building ,151 York Street Center ,293 CLASS C 220 West Freemason Street , Granby Street , Gresham Drive (The Medical Building) , Monticello Avenue , Boush Street ,825 Anders Williams Building ,000 Duke Grace Building ,417 Ghent-Olney Building ,000 Lonsdale Building ,000 Norfolk Community Services ,192 Wainwright Building ,318 OWNER OCCUPIED AT&T ,000 Atlantic Building ,000 Decker Building ,000 Dominion Enterprises ,000 Landmark Communications ,500 Norfolk Telcom Center ,000 Peta ,000 Standard Forms ,000 Two Commercial Place ,450 Virginian Pilot Building ,141 AIRPORT/NORTHAMPTON CLASS A Twin Oaks I ,000 Twin Oaks II ,000 The Concourse ,000 CLASS B Airport Executive Center ,609 Circle South ,000 HRSA-ILA Bldg (Longshoremen s) ,678 Northhampton Executive Center corrected buiding size ,904 CLASS C Electrical Workers Corporation Office ,020 OWNER OCCUPIED CMA/CGM (USA) ,000 Commander Corporate Center ,000 Silver Oak ,200 Zim-American Israeli Shipping ,000 CENTRAL NORFOLK CLASS B 100 Kingsley Lane, DePaul Health Park , Kingsley Lane, DePaul Medical Building , Lingsley Lane, DePaul Medical Atrium , Corporate Blvd. (VA Eye Development) , Majestic Avenue , Robin Hood Road ,000 Almeda Business Center (flex) ,000 Central Center Office Building ,815 Commerce Park Place(flex) ,783 Gateway II(flex) ,000 Lafayette Executive Center ,641 Lawson Building ,022 Norfolk Business Center (flex) ,000 Norfolk Business Center II (flex) ,926 Norfolk Commerce Center I(flex) ,000 Norfolk Commerce Center III(flex) ,000 Norfolk Commerce Center IV(flex) ,980 Norfolk Commerce Center V(flex) ,000 CLASS C 4100 Building ,614 Atlas Building ,476 Blair Building ,000 Southern Office Building ,061 Time Building ,000 OWNER OCCUPIED American Funds Building ,000 CHESAPEAKE/GREENBRIER CLASS A BECO Corp HQ (609 Independence) ,400 Crossways Center ,702 CHKD Health Center (Volvo Park VI) ,000 Chubb Building ,500 Dendrite One ,000 Dendrite Two ,000 EDS Crossways Blvd ,000 Greenbrier Tower I ,900 Greenbrier Tower II ,976 HR Realtors Association Bldg (638 Independence)..40,000 Independence Place ,345 Lake Center I ,000 Lake Center II ,000 Liberty One ,000 Liberty Two ,000 Liberty Three , Greenbrier Parkway (Gateway Bank) ,000 CLASS B Atlantic Business Center ,000 Battlefield Corporate Center ,000 Battlefield Lakes Tech Center I ,500 Battlefield Lakes Tech Center II ,000 Battlefield Lakes Tech Center III ,000 Battlefield Technology Center ,578 Battlefield Technology Center I ,000 Battlefield Technology Center II (MCI) ,478 Branch Executive Quarter-Hamilton ,600 Branch Executive Quarter-Jefferson ,838 Branch Executive Quarter-Madison ,788 Chelsea Commons WCMB , Crossways Blvd ,800 Crossways Commerce Center II ,300 Crossways Commerce Center I ,000 Crossways I ,007 Crossways II (flex) ,751 Crossways III ,992 Dominion Business Center ,000 Eden North Center ,700 Greenbrier Business Centre (flex) ,561 Greenbrier Circle Corporate Center ,138 Greenbrier Executive Center II (I was torn down for a hotel) ,787 Greenbrier Point II ,000 Greenbrier Tech Center One (flex) ,414 Greenbrier Tech Center Two (flex) ,340 Hanbury Office Park ,000 Hanbury Road Business Center ,000 Independence Technology Center I ,000 Rose and Womble Business Center ,432 SunTrust Bank Building , Volvo Parkway ,000 Volvo Park (Progressive Drive) ,000 Volvo VII ,000 Greenbrier Business Center ,000 Greenbrier Square ,250 Heritage Bank Building ,654 Riverwalk Professional Bldg ,000 Woodbrier Terrace ,000 Wright Building ,000 CLASS C 2125 Smith Avenue ,423 Knells Ridge Plaza ,500 Old Greenbrier Village ,015 OWNER OCCUPIED Cox Communications ,000 Dollar Tree ,000 First Data ,557 Household Finance ,000 Panasonic Call Center ,000 HILLTOP/OCEANFRONT CLASS A Pavilion Center (Towne Bank) ,177 Potter Professional Center ,500 William E. Wood Building ,000 CLASS B 1206 Laskin Road Executive Center ,000 Beach Health Pavilion ,800 Beach Tower ,000 Birdneck Office Park ,182 Birdneck Square ,285 Camelot Professional Center ,725 Colonial Mill Professional Center ,555 Damalas Centre ,900 First Colonial Office Park ,000 General Booth Professional Center ,000 Gibson Pavilion ,000 Great Neck Professional Bldg ,000 Heritage Commons ,000 Hilltop West Executive Center ,000 Louisa Avenue Building One ,000 Louisa Avenue Building Two ,000 Louisa Avenue Building Three ,195 Mill Dam Crossing ,037 Rudd Building ,000 Sandpiper Key Associates Bldg , Laskin Road ,240 CLASS C Oceana East ,360 CORPORATE LANDING CLASS B Executive Center at Corporate Landing ,000 Princess Anne Executive Park ,756 Verizon Building ,000 OWNER OCCUPIED Al-Anon ,000 Liberty Tax Service ,000 GEICO ,000 KEMPSVILLE CLASS A Chadwick Building ,000 Grayson Building ,000 Metroplex ,000 CLASS B 1201 Lake James Office , Holland Road , Providence Road (Providence South) ,000
49 Arrowhead Office Court ,000 Atrium of College Park Square ,379 Central Park I (552 Central Dr) ,000 Central Park II (544 Central) ,000 College Park Square III ,150 Courtyard at Providence ,879 Fairfield Square ,933 Holland South ,843 Holland/Taft Professional Center ,850 Kempsville Office Park ,722 Oxford Square ,544 Woolpert Building ,700 LYNNHAVEN CLASS A Chase Building ,910 Lynnhaven Commons Complex ,000 Lynnhaven Commons (office bldg) ,000 Lynnhaven II ,000 Lynnwood Plaza ,157 Marsh Landing ,117 Oceana Center One ,928 Oceana Place ,369 Park West AMSEC ,180 Pinehurst Centre ,000 Reflections I ,924 Reflections II ,676 Reflections III ,000 Reflections IV ,000 Viking Building ,900 Windwood Center ,348 CLASS B 2700 International Parkway ,000 Advanced Technology Building ,000 Basgier Bldg. I ,200 Basgier Bldg. II ,000 Bennett Office Building (120 S. Lynnhaven) ,522 Commercial Place ,400 Gateway Bank Building (641 Lynnhaven) ,000 Lynnhaven Corporate Center I ,046 Lynnhaven Corporate Center II ,300 Lynnhaven Executive Center ,000 Lynnhaven Five ,549 Lynnhaven North ,000 Lynnhaven Professional Center ,000 Lynnhaven Station ,226 Parkway Center 3 and ,567 Parkway Center I & II ,112 Parkway III (Unisys) ,428 Parkway West (flex) ,563 RBM Building ,170 Sabre Street I ,000 Sabre Street II ,000 Sabre Street III ,000 Sabre Street IV ,000 South Lynnhaven Business Park ,000 U.S. Commerce Center (Tidewater Tech) ,819 Yorktown Commerce Center (228 N. Lynnhaven) ,529 OWNER OCCUPIED Cenit Bank Bldg ,000 Global Technical Systems ,000 Hall Automotive ,865 SAIC ,000 LITTLE NECK CLASS B 3300 Building (Virginia Beach Blvd.) ,000 King s Grant Office Building ,000 Little Neck Office Park (3300 Bldg) ,000 Little Neck Office Park (3300 South) ,000 Little Neck Office Park (3400 Bldg) ,000 Little Neck Towers ,860 Lynnhaven Station 101 North Lynnhaven ( ,000 NEXCOM Building ,000 NEXCOM Expansion ,000 Plaza Trail Office Building ,975 Rose Hall Commons ,266 Rose Hall Professional Center ,000 Rosemont Interstate Center I ,400 Rosemont Interstate Center II ,835 Rosemont Interstate Center III* ,000 Sun Building ,600 Transouth Building (3615 VB Blvd) ,500 CLASS C Birchwood Office Park ,688 Byler Building ,592 OWNER OCCUPIED Plan-It Building ,000 MILITARY CIRCLE CLASS A Riverside Commerce Center (120 Corporate Blvd.).70,000 Riverside Corporate Center ,682 CLASS B Centura Bank Building ,442 Circle East ,047 College Park Executive Center ,000 FBI Building ,000 I.T.T. Building ,379 CLASS C Executive Office - Janaf ,800 Janaf Office Building ,329 OWNER OCCUPIED Portfolio Recovery Building ,850 Sentara ,000 Union Mission (former VA Natural Gas) ,403 NEWTOWN/WITCHDUCK CLASS A AAA Headquarters ,045 Amelia Building ,660 Amerigroup Building I ,000 Amerigroup Building II ,000 BB&T Building ,000 Expressway Corporate Center ,658 Gallery I ,000 Gallery II ,000 Greenwich Center ,000 Greenwich Commons ,000 Greenwich Station ,000 Halifax Building ,100 Mass Mutual Building ,500 Smithfield Building ,000 Verizon Center ,000 Westmoreland Building ,436 CLASS B 144 Business Park Drive , Business Park Drive , Business Park Drive , Business Park Drive , Business Park Drive , Witchduck Road , Newtown Road ,181 American Teleservices Building ,232 Azalea Village ,000 BCF Building ,000 BPC Building ,074 Colonial Corporate Center ,772 Commerce Centre ( Expressway Ct) ,500 Commonwealth Building ,000 Interstate Corporate Center ,000 Parliament Drive Professional Bldg ,000 TRC Center I ,000 TRC Center II ,884 TRC Center III ,000 Witchduck Crossing ,326 CLASS C Witchduck Office Court ,000 OWNER OCCUPIED Cox Cable Building ,000 Cox Expansion ,000 Copy Data (Ikon) ,000 Lendman ,000 Newtown Square ,000 PEMBROKE/ CENTRAL BUSINESS DISTRICT CLASS A 249 Central Park Avenue ,000 Convergence Center ,000 Convergence Center II ,000 Convergence Center III ,000 Corporate Center VI ,000 Five Columbus Center ,000 Fulton Bank Plaza ,315 One Columbus Center ,000 OSS Building (former Ticketmaster) ,000 Six Columbus Center ,000 Southport Center ,000 Town Center (222 Central Park) ,900 Town Center North Tower ,000 Two Columbus Center ,000 CLASS B 4701 Columbus , Columbus Street , Columbus Street ,000 Corporate Center I ,000 Corporate Center II ,475 Corporate Center III ,000 Corporate Center IV ,012 Holland Commerce Center ,000 Holland Office Park ,000 Independence Business Center ,000 Independence Technology Center - Technocenter I.50,000 Independent Plaza ,655 Pembroke Commercial Bldg. (4425 Corporation Lane) 70,760 Pembroke Office Park ,000 Prism Plaza ,000 Southgate Centre ,200 Southport Business Center(flex) (Baskin Bldg)....20,683 Southport Trade Center(flex) ,883 Thalia One ,408 Thalia Professional Center ,000 The Meadows ,433 VST Building ,000 CLASS C 4224 Holland Road ,104 Dragas Office Park ,896 Haygood Buildings ,392 Haygood Executive Park ,472 Holland Plaza Office Building ,513 Old Donation Executive Park ,347 Larkspur Village ,184 Pocahontas Center ,800 OWNER OCCUPIED Alantec Financial Fed Credit Union ,000 AVIS ,000 Coastal Training Technologies ,000 Commonwealth College ,000 Electronic Systems Building ,000 ISC ,000 QED Building ,000 REIN Building ,500 Virginia Natural Gas Building ,242 PORTSMOUTH CLASS A BB&T Building (500 Crawford) ,327 Harbourfront Corporate Center (801 Water St)....53,000 CLASS B 307 County Street , Crawford Street Building , Crawford Street ,171 Boyette Professional Center ,000 Bristol Square ,800
50 Towne Bank Building (200 High St) ,000 JJH Building ,563 New Kirn Building ,000 PortCentre I (flex) ,000 Port Trade Center ,223 The Seaboard Building ,000 Wachovia Bank ,000 CLASS C Crawford Executive Center ,340 SUFFOLK CLASS A MAST One ,000 JTASC Building ,365 CLASS B Bridgeway Technology Center I ,000 Bridgeway Technology Center II ,500 Bridgeway Technology Center III ,384 Brinkley Building ,500 Brinkley Building II ,000 Harbour Breeze Professional Center ,265 Harbour View Medical Arts Center ,000 Harbor View Professional Center (1033 & 1035).23,000 Konikoff Medical Office Building ,675 Lakeview Technology GSA Center ,000 Lakeview Tech Center II ,400 Main Street Center ,800 Washington Street Center ,000 OWNER OCCUPIED Rubicon NGP - Lakeview Technical Center ,075 Lockheed Martin ,000 Overton Building ,940 Rose & Womble Building ,000 Towne Bank Center ,318 DOWNTOWN HAMPTON CLASS A Harbour Centre ,855 CLASS B W. Queens Way , W. Queens Way ,500 Mill Point Center ,000 One Mallory Street ,000 CLASS C 55 W. Queens Way ,132 DOWNTOWN NEWPORT NEWS CLASS B 2600 Building ,018 Wachovia Bank Building ,846 OWNER OCCUPIED Newport News Shipbuilding, Bldg ,000 HAMPTON ROADS CENTER CLASS A 6 Manhattan Square , N Campus Parkway ,000 Allstate Building ,000 HealthNet Building ,482 Lakefront Plaza I ,442 Morgan Marrow Building ,000 Olympia Place ,395 Oxford Plaza ,297 Parkway Executive Center ,000 Research Quad - Building One ,000 Research Quad - Building Three ,000 CLASS B 400 Butler Farm Road , Butler Farm Road , Butler Farm Road ,515 Hampton I ,532 Hampton II ,000 Hampton III ,000 Hampton Technology Center I ,575 NDS Building ,000 Raytheon ,000 Research Office Building ,000 CLASS C NASA Langley Research Center , Armistead Avenue ,043 COLISEUM CENTRAL CLASS A Claiborne Building (Regional Mall Office) ,000 Executive Tower ,164 Pinewood Plaza ,500 CLASS B 2115 Executive Drive , Tower Place ,500 Bank of America Building ,434 Colony Square of Hampton ,050 Riverdale Complex ,000 Sheraton Office Bldg ,673 Todds Lane Professional Center ,500 West Telemarketing ,855 OWNER OCCUPIED Langley Federal Credit Union ,800 NEWMARKET CLASS B Newmarket Building ,262 NetCenter ,171 UPS Call Center ,000 CLASS C Rouse Tower ,000 OWNER OCCUPIED NN Shipbuilding Employee Credit Union ,000 OYSTER POINT CLASS A 601 Thimble Shoals Boulevard ,000 Atrium At Oyster Point ,971 Cedar One ,467 Cedar Two ,000 Contemporary Cybernetics ,000 Ferguson Corporate Center II ,000 Fountain Plaza One ,000 Fountain Plaza Two ,000 Fountain Plaza Three ,000 Langley Federal Centre ,982 Merchants Walk ,000 One City Center ,000 One Oyster Point ,226 Oyster Point Interstate Center ,000 Patrick Henry Corporate Center ,883 Riverside Health Center Building (Warwick) ,500 Peninsula Professional Building ,800 Rock Landing Corporate Center II ,476 SunTrust Building ,955 Symantec Corp. Building ,000 Tower Park (733 &735 Thimble Shoals) ,667 Town Center One ,000 TowneBank Center ,000 Two City Center ,600 Two Oyster Point ,137 Turner Bldg (1060 Loftis) ,000 Wachovia Building ,921 William E Wood Building (1030 Loftis) ,000 CLASS B Jefferson Avenue , Bluecrab (flex) ,000 BB&T Plaza (603 Pilot House) ,348 Cale Colony ,000 Canon Place ,000 Comb-Bay Park ,000 Dunwoody Place ,798 Executive Center ,399 Fishing Point Complex(flex) ,000 International Distribution Center ,000 McCale Professional Park ,000 Middle Ground Business Center ,000 Oyster Point Center ,000 Oyster Point Business Center ,000 Oyster Point Place (flex) ,000 Oyster Point West ,560 Park Central Executive Center ,425 Park Place (751 & 753 Thimble Shoals) ,000 Peninsula Business Center I (flex) ,817 Peninsula Business Centre II (flex) ,475 Peninsula Business Centre III (flex) ,000 Rock Landing Corporate Center IV ,125 Rock Landing Corporate Center V ,125 Technology Center (flex) ,000 Thimble Shoals Business Center (flex) ,377 Thimble Shores Lakefront ,000 CLASS C J.Clyde Morris Blvd ,000 Drucker & Falk Building ,000 Pilgrim Landing ,650 Regent Park ,000 OWNER OCCUPIED Applied Research Center ,000 Fountain Plaza Two ,000 Muller Martini Building ,000 Peninsula Retail Credit ,000 SUBURBAN NEWPORT NEWS CLASS B Bay Savings Bank Building ,000 Colony Square of Denbigh II ,100 Denbigh Professional Park ,598 Ferguson Enterprises ,800 MCI Building ,000 Tidewater Tech (616 Denbigh Blvd) ,778 CLASS C Mariner Building ,000 Teagle Building ,000 OWNER OCCUPIED CNU Building ,000 WILLIAMSBURG/JAMES CITY/YORK COUNTY CLASS A 263 McLaws Circle ,967 Atrium Building ,000 Casey New Town - SunTrust ,000 Courthouse Green ,000 Design Center ,700 First Union Center ,000 Langley Federal Credit Union ,000 Williamsburg Commerce Center ,000 Palladian Office Building ,000 Patriot Park Business Center ,000 Sentara New Town Medical Building ,000 Sun Trust (Courthouse St.) ,000 William E. Wood Building ,000 CLASS B 104 Bypass Road , George Washington Memorial Highway ,000 Chartertowne Professional Center ,800 Greens Springs Office Park ,000 Kristinsand Office Park ,221 Packets Executive Center ,000 Quarterland Commons Office Condos ,000 Rivergate Center ,000 Wachovia Bank ,500 Williamsburg Office Park ,600 Disclaimer: The information in this report is deemed reliable. The Old Dominion University E. V. Williams Center for Real Estate and Economic Development makes no representation or warranty as to its accuracy BOLD indicates change/addition from last year.

51 Office Submarkets Southside 1 Airport/Northampton 2 Chesapeake/Greenbrier 3 Downtown Norfolk 4 Central Norfolk 5 Hilltop/Oceanfront 6 Corporate Landing 7 Kempsville 8 Little Neck 9 Lynnhaven 10 Military Circle 11 Newtown/Witchduck 12 Northern Suffolk 13 Pembroke 14 Portsmouth Peninsula 15 Downtown Hampton 16 Hampton Roads Center 17 Coliseum Central 18 Downtown Newport News 19 Newmarket 20 Oyster Point 21 Suburban Newport News 22 Williamsburg/ James City Co./ York County


52

 functions and reports are funded by donations from individuals,")

53 RESIDENTIAL 2011 HAMPTON ROADS REAL ESTATE MARKET REVIEW New Residential Market Authors Data Analysis/ Layout Blair Hardesty and Ron Wildermuth Residential DataBank Existing Residential Market Author Data Analysis/ Layout James Pritchard Manager, Data & Analytics Real Estate Information Network, Inc. Hampton Roads MLS Financial Support Disclosure The E. V. Williams Center for Real Estate and Economic Development (CREED) functions and reports are funded by donations from individuals, organizations and the CREED Council. The data used for this report are deemed reliable; however, neither Old Dominion University, the E. V. Williams Center for Real Estate and Economic Development, nor sponsoring companies and/or individuals makes any representation or warranty as to its accuracy RESIDENTIAL


54 General Overview The Hampton Roads Residential market statistics covered in this report analyze the new home building industry and the existing home sales activity for the year Included are the cities of Chesapeake, Hampton, Newport News, Norfolk, Poquoson, Portsmouth, Suffolk, Virginia Beach, and Williamsburg, and the counties of Gloucester, Isle of Wight, James City, and York. The new homes portion of the report also includes information for Franklin and Southampton, while the existing homes part of the report contains additional information on Surry, Matthews and Currituck.The new construction data contained in this report was gathered from the actual deeds recorded and from the building permits issued by each city or county. The sales data and existing home closings data was gathered from the Real Estate Information Network. NEW CONSTRUCTION In 2010, home builders withstood more pricing challenges, lower site traffic counts, and cautious, reluctant buyers. Foreclosures and short sales continued to place a drag on new home sales. Builders continued to rethink pricing and features, redesign product, adjust square footages and reevaluate their margin and sales expectations. New construction closings in Hampton Roads declined 13.1 % in 2010 compared to Despite the decline there were many successes. These successes were due to several key factors. Some were the result of fresh new designs with compelling prices; others were due to superior locations, strong amenity packages, attractive community settings, unique and appealing home designs, outstanding sales and marketing teams or combinations of all of these factors. Overall, average sales prices held steady region wide in 2010 for new construction detached, townhomes, duplexes and multi-plex homes. Results varied widely by jurisdiction, and declines, as well as increases, were experienced. Multi-story condominiums withstood further price deterioration due to the wide disparity between supply and demand. The first time homebuyer made a strong showing in the spring thanks to government incentives, but most first time buyers were absent from the market in the summer and fall. During the year the inventory drawdown was dramatic. The inventory of new homes has all but evaporated. Detached new home inventory is below a four month supply and attached new construction priced below $350,000, excluding elevator-served condominiums, is down to a three month supply. Looking ahead to 2011, expect foreclosure numbers to peak. Further pressure on prices is likely. Builder incentives will continue to play a key role in the selling process. Attractively priced lot opportunities will become more abundant as banks continue to adjust their portfolios. The bright spot is that the underlying unmet demand for housing, which has been building for three years, will begin to show itself in the marketplace toward the end of 2011 and into 2012 as consumers gain confidence and the economy gains strength Hampton Roads Real Estate Market Review 52

55 2011 R E S I D E N TIAL AVERAGE PRICES During 2010, the average price of a new construction, single family detached home in Hampton Roads was $357,939, holding steady with the 2009 average price of $358,884. The majority of municipalities have experienced declines in average closing prices year over year. Portsmouth had the largest percent decline in average closing price, down 10.6% to $215,883 for the year. York County also experienced a notable decline with a loss of $33,150 down to $390,440 for the year. The largest percent increase in average closing price occurred in Norfolk where the price increased 6.4% to $340,412. The success at this year s Tidewater Builder s Association Homearama contributed in large part to the increase in average price. East Beach accounted for 25% of Norfolk s new, detached housing in 2010 with 21 closings recorded. These closings averaged $603,021. Virginia Beach had the highest average closing price for a new detached home in Hampton Roads. The average closing price for 2010 was $426,269. The average closing price for a fee simple detached home in Virginia Beach was $440,868. The average price for a detached condominium was $394,295. The average closing price of a multi-story condominium unit in an elevator- served building was $367,576. This is a decline of 28.6% from The average closing price of a multi-story condominium unit in a non-elevator served building was $171,791 during 2010, down 4.8% from year ago numbers. Virginia Beach had the largest decline in average closing price for multi-story condominiums during 2010, down 30.8% to $271,988. TABLE I New Construction Permits And Closing Activity 2009 VERSUS 2010 All Product Types / / - Area Permits Permits % Diff Closings Closings % Diff Chesapeake % % Franklin/Southampton % % Gloucester % % Hampton % % Isle of Wight % % James City County % % Newport News % % Norfolk % % Portsmouth % % Suffolk % % Virginia Beach % % Williamsburg % % York County % % TOTALS 2,912 3, % 2,771 2, % RESIDENTIAL
56 The multi-plex condominium closing prices remained relatively unchanged in 2010 versus The average closing price for a new multi-plex condominium was $229,325, up 0.13%. The majority of municipalities had increases in average closing price with the largest percent increase occurring in York County, where the average price increased 8.2% to $336,490. York County currently has the highest average closing price for multiplexes in Hampton Roads. The largest percent decline occurred in Newport News, down 20.4%; however, only four closings were recorded which is not a large enough data set to conclude an accurate overall average price. Chesapeake had the only significant decline in average price for a multi-plex condominium. The average price was $210,398, down 2.7% from last year. The average price of a new multi-plex condominium unit in Chesapeake has declined over the last five years primarily due to the availability of smaller less expensive homes like The Dragas Companies is currently building in the Kempsville Road area. The average closing price for a new construction townhome or duplex was $268,376 during 2010 in Hampton Roads. This represents a slight increase of 1.3% year over year; however, only Norfolk and Virginia Beach saw increases in average closing prices, with increases of 20.3% and 10% respectively. Newport News had the largest decline in average closing price, with a drop of $28,522 (10.8%) from The current average closing price for a new construction townhome in Newport News is $181,541. In 2010, the City of Virginia Beach had the highest average closing price for a new townhome or duplex in Hampton Roads at $338,092. The City of Portsmouth had the lowest average at $164,415. GRAPH I Hampton Roads Average Closing Price New Single Family Detached GRAPH II Hampton Roads Average Closing Price New Multi-Plex Condominium $500,000 $300,000 $280,000 $450,000 $260,000 Price $400,000 Price $240,000 $350,000 $220,000 $300,000 1Q 2Q 3Q 4Q 1Q 2Q 3Q 4Q 1Q 2Q 3Q 4Q 1Q 2Q 3Q 4Q 1Q 2Q 3Q 4Q $200,000 1Q 2Q 3Q 4Q 1Q 2Q 3Q 4Q 1Q 2Q 3Q Q 08 1Q 09 2Q 09 3Q 09 4Q 09 1Q 10 2Q 10 3Q 10 4Q 10 GRAPH III Hampton Roads Average Closing Price New Multi-Story Condominium GRAPH IV Hampton Roads Average Closing Price New Townhome/Duplex $700,000 $400,000 $375,000 $350,000 $325,000 $300,000 $275,000 $250,000 $225,000 $200,000 $600,000 Price $500,000 $400,000 Price $300,000 $200,000 1Q 2Q 3Q 4Q 1Q 2Q 3Q 4Q 1Q 2Q 3Q 4Q 1Q 2Q 3Q 4Q 1Q 2Q 3Q 4Q Q 2Q 3Q 4Q 1Q 2Q 3Q 4Q 1Q 2Q 3Q 4Q 1Q 2Q 3Q 4Q 1Q 2Q 3Q 4Q Hampton Roads Real Estate Market Review 54

57 2011 RESIDENTIAL $700,000 Hampton Roads Average Closing Price Residential New Construction $600,000 $500,000 x SFD MSCO MPCO TH/DP Average Price $400,000 $300,000 x x x x x x x x x x x x x x x x x x x $200,000 $100,000 1Q 2Q 3Q 4Q 1Q 2Q 3Q 4Q 1Q 2Q 3Q 4Q 1Q 2Q 3Q 4Q 1Q 2Q 3Q INDIVIDUAL MARKET SEGMENTS Single Family Detached homes still account for the majority of new construction in Hampton Roads with 61% of new construction closings and 68% of new construction permits during However, the market share of detached housing has dropped significantly from 2000, when detached housing accounted for 79% of all new residential closings and 82% of new residential building permits. There were 2,108 new single family detached permits issued in Hampton Roads during This is an increase of 9.1% year over year. More than 66% of the permits issued were on the Southside, with Chesapeake accounting for 22.3% of all detached permits issued. James City County experienced the largest increase in detached permits issued, up 52.7% to 342 from last year. Closings for 2010 were down 5.9% versus 2009, with 1,473 recorded in Hampton Roads. James City County had the most notable increase in the number of closings recorded, up 31.6% to 204 closings for the year. The largest percent decline occurred in Gloucester. During 2009 there were only 35 detached closings recorded, versus 89 last year, down 60.7%. Chesapeake continues to account for a significant portion of new detached housing, with 352 closings recorded for a 23.8% market share. Virginia Beach was the second highest with 319 closings and a 21.6% housing market share of new detached homes. The top fee-simple, single family detached subdivision in Hampton Roads for permits and closings was Colonial Heritage by Lennar Corporation in James City County. There were 67 detached permits issued during 2010 in Colonial Heritage and there were 48 detached closings recorded with an average price of $342,991. The top detached condominium subdivision for 2010 was Sajo Farm in Virginia Beach. There were 46 permits issued during the year, 34 for Terry Peterson Residential and 12 for Napolitano Homes. In addition, Terry Peterson Residential was issued 13 permits for Lakeside Cove at Sajo Farm, the paired home component of the neighborhood. Detached homes in Sajo Farm are currently starting in the low 300 s. The top detached condominium subdivision for closings was Sherwood Lakes in Virginia Beach with 42 closings recorded during Home Associates of Virginia Inc closed the majority of the units with 28 closings recorded. These units had an average price of $402,171, with a range of $350,105 to $508,616. HBD Build closed 13 units during 2010 with an average price of $478,368. There was one bank owned new construction closing, for a home built by Commonwealth Custom Home Builders. Ryan Homes was the top builder of new detached fee simple housing during Ryan had 89 permits issued and 62 closings recorded in five communities on the Peninsula. Stonehouse Glen and Fenwick Hills, with 18 detached closings 55 There were 2,108 new single family detached permits issued in Hampton Roads during This is an increase of 9.1% year over year RESIDENTIAL


58 recorded in each community, netted the most closings for Ryan. Fenwick Hills had an average closing price of $287,825 and Stonehouse Glen had an average closing price of $409,521. Most recently, Ryan Homes has begun building at The Settlement at Powhatan Creek and Burlington Woods. Terry Peterson Residential was the top builder of new detached condominiums during Terry Peterson Residential had 54 detached condominium permits issued and 46 closings recorded in four separate communities on the Southside. Their latest community, Gables at Riverfront opened for sales in October. Additionally, Terry Peterson had 26 permits issued and 47 closings recorded for other product types. The Multi-Story Condominium market experienced very little activity during There were 147 permits issued for the year, less than 5% of all new residential permits. Of these, only 21 were for an elevator-served community, Windy Knoll s, in Newport News. The remaining permits were issued to Colonial Crossing in Newport News, Southmoor at Ridgely Manor in Virginia Beach, and Kings Pointe at Western Branch in Chesapeake. There were 144 closings recorded, a decline of 26.5% year over year. There were 79 closings for elevator served buildings and 65 for nonelevator served. Southmoor at Ridgely Manor by The Dragas Companies had the highest number of non-elevator served multi-story condominium closings recorded for the year. There were 55 closings recorded with an average closing price of $176,602. Compared to last year, Southmoor had a 33.7% drop in closings and a 2.2% reduction in average closing price. Old Beach Village by the Ainslie Group in Virginia Beach had the highest number of closings for an elevator-served multi-story condominium community. The community had 12 closings recorded with an average price of $367,363. These units had an average size of 1,601 square feet, yielding a price per square foot of $ The Multi-Plex Condominium market held steady in the number of permits issued during There were 246 permits, only one permit less than There were 233 closings recorded, a decrease GRAPH V 100% 75% 50% 25% 0% of 24.8% from Chesapeake continues to have the most multi-plex activity with 53% of the permits issued and 46% of the closings recorded. The top multi-plex condominium community for permits and closings was Brighton Park at Greenbrier by The Dragas Companies. The community had 71 closings recorded for the year with an average price of $207,549. The Dragas Companies continue to dominate the multi-plex condominium market in Hampton Roads. They currently have three multi-plex communities in Chesapeake Brighton Park, Oakbrooke Crossing, and Kings Pointe. Kings Pointe is their newest community and is expected to open for sales this spring. The builder was issued 121 building permits for new residential multi-plex units during 2010, nearly half of all multi-plex permits. They recorded 95 multiplex condominium closings during the year, representing 40.7% of the Hampton Roads multi-plex market. The number of Townhome and Duplex permits in 2010 was the same as 2009, with 606 issued. Permits were evenly distributed between the Southside and the Peninsula with 306 to the Southside areas and 300 to the Peninsula areas. Virginia Detached The number of Townhome and Duplex permits in 2010 was the same as 2009, with 606 issued. Permits were evenly distributed between the Southside and the Peninsula with 306 to the Southside areas and 300 to the Peninsula areas Market Share for New Construction 2010 Closings by Price Range Attached 36 $500K + $400K to $500K $300K to $400K $200K to $300K <$200, Hampton Roads Real Estate Market Review 56
59 2011 R E S I D E N TIAL Beach had the highest number of permits issued on the Southside with 115 and Newport News had the highest number on the Peninsula with 108. Closings for townhomes and duplexes had the smallest decline of the new attached market. There were 559 closings recorded, down 20% from 699 closings last year. Norfolk had the largest percent decline year over year, down 32.8% to 43 closings. Only Newport News and the City of Williamsburg had small increases in the number of closings. Newport News closings increased 11.1% to 50 recorded closings and the City of Williamsburg increased 75% to 21 closings for the year. Virginia Beach had the largest number of townhome/duplex closings with 152 recorded, 27.1% of the market. The 2010 top townhome/duplex community in Hampton Roads for permits was Meridian Parkside by HHHunt Homes in Newport News with 33 permits issued. For closings, the top community was Lakeside Cove at Sajo Farms in Virginia Beach by Terry Peterson Residential with 26 townhome closings. The Terry Peterson units had an average price of $378,090, an average size of 2,562 square feet, and a price per square foot of $ Ryan Homes had the largest number of townhome GRAPH VI 23% Townhome/ Duplex 10% Multi-Plex 6% Multi-Story New Construction Closings Product Mix % Single Family Detached and duplex permits issued in Hampton Roads during They had 70 permits issued across three communities on the Peninsula: Liberty Crossing, Whitehall, and Riverwalk Townes. Chesapeake Homes was the top builder for closings of townhomes and duplexes. The builder closed 74 units during the year, with a large percentage of the closings occurring in Nichols Park at Lexington in Virginia Beach. The community had 22 closings in 2010 with an average price of $287,905. AGE RESTRICTED COMMUNITIES There are currently 13 age restricted communities in Hampton Roads. During 2010 these communities were issued a total of 205 permits, an increase of 14.5% compared to There were 172 closings recorded, up 33.3% from This yields an absorption rate of 14.3 closings per month and an average of one closing per month per community. Based on the 2010 closing pace and an estimated inventory of 130 units, there is a nine month supply. The top age restricted community in Hampton Roads was Colonial Heritage in James City County by the Lennar Corporation. There were 81 permits issued. The 68 closings recorded during 2010 consisted of 48 detached homes with an average price of $342,991 and 20 attached homes with an average price of $241,306. TOTAL MARKET NUMBERS For all housing types in the for-sale market, new residential permits are up 6.7% from The Southside areas accounted for 65% and the Peninsula accounted for 35%. Closings were down 13.1% year over year, with 2,409 new residential construction closings recorded. The Southside areas closed 1,686 homes or 70% of the market, while the Peninsula closed 723 new homes. The average price for new construction homes in Hampton Roads was $319,896, a slight decline of 0.56% from The average price on the Southside was $329,627, down 1% and on the Peninsula the average price was $297,204 up 1.8%. The top builders for 2010 in Hampton Roads were The Dragas Companies, Ryan Homes and Chesapeake Homes. In terms of permits, Dragas was number one with 235 permits, followed by Ryan Homes with 159 and Chesapeake Homes with 121. In terms of closings, Dragas was number one with 165 closings recorded, followed by Chesapeake with 137 and Ryan with 127. In terms of volume, Chesapeake Homes is number one with $38,690,774, followed by Ryan with $37,088,187 and Dragas with $33,790, RESIDENTIAL
60 TABLE II Southside Top Subdivisions Ranked by Permits TABLE III Peninsula Top Subdivisions Ranked by Permits No. of Permits # Community Builder Issued 1 Kings Pointe, C Dragas Companies 72 2 Southmoor, V Dragas Companies 66 3 Sajo Farm, V Terry Peterson Res 59 & Napolitano Ent 4 Brighton Park, C Dragas Companies 50 5 Sherwood Lakes, V HAV Inc & HBD Build 47 5 Oakbrooke Crossing, C Dragas Companies 47 6 Culpepper Landing, C Various Builders 37 7 Harbour Breeze Estates, C Beco Homes, Ashdon Builders 34 7 Woodbridge Point, V Various Builders 34 8 East Beach, N Various Builders 33 9 Heritage Park, V Various Builders Warrington Hall, C W H Builders & Corinth Homes 29 No. of Permits # Community Builder Issued 1 Colonial Heritage, J Lennar Corp 81 2 Whitehall, J Ryan Homes & 48 HHHunt Homes 3 Fords Colony, J Various Builders 34 4 Hampshire Glen, H Various Builders 33 4 Meridian at Parkside, NN HHHunt Homes 33 4 Colonial Crossing, NN Moody Homes 33 5 Orcutt Avenue, NN NN Redev & Hous Auth 30 6 Village at Quarterpath, W Royal Dominion Homes 29 7 Old Point, H North Shore Constr 27 8 New Town, J GCR Inc & Atlantic Homes 26 8 Riverwalk Townes, Y Ryan Homes 26 9 Greensprings West, J Various Builders 25 TABLE IV Southside Top Subdivisions Ranked by Closings TABLE V Peninsula Top Subdivisions Ranked by Closings No. of Permits Average # Community Builder Issued Price 1 Brighton Park, C Dragas Companies 71 $207,549 2 Sajo Farm, V Terry Peterson Res 60 $400,295 & Napolitano Ent 3 Southmoor, V Dragas Companies 55 $176,602 4 Sherwood Lakes, V HAV Inc & HBD Build 42 $425,940 5 Culpepper Various Builders 37 $339,961 Landing, C 6 Woodbridge Various Builders 33 $383,148 Point, V 7 East Beach, N Various Builders 32 $558,127 8 Grassland Farms, V Pace Constr & Dev 29 $314,800 9 Parkside, S Chesapeake Homes 27 $329,380 9 Harbour Breeze Beco Homes, Estates, C Ashdon Builders 27 $285, Heritage Park, V Various Builders 26 $571, Hampton Roads Terry Peterson Res 26 $232,426 Crossing, S No. of Permits Average # Community Builder Issued Price 1 Colonial Heritage, J Lennar Corp 68 $313,084 2 Whitehall, J Ryan Homes & 37 $263,230 HHHunt Homes 3 Colonial Crossing, Moody Homes 32 $170,418 NN 4 Hampshire Glen, H Various Builders 26 $316,552 4 Michelle Point, J Health E Community 26 $200,450 5 Liberty Crossing, J Ryan Homes 23 $226,259 6 New Town, J GCR Inc & Atlantic Homes22 $271,009 7 Village at Royal Dominion Homes 21 $274,654 Quarterpath, W 7 Riverwalk Townes, Y Ryan Homes 21 $243,761 8 Fenwick Hills, J Affordable Homes 20 $282,983 & Ryan Homes 9 Stonehouse, J Various Builders 19 $413,705 9 Highgrove, Y Centex Homes 19 $262, Hampton Roads Real Estate Market Review 58
61 2011 R E S I D E N TIAL TABLE VI Top Hampton Roads Builders By Permits Issued, Closings Recorded & Total Revenue Permits Issued Closings # Of Closings Total Revenue Builder Permits Issued Builder Closings Builder Total Volume Recorded 1 DRAGAS COMPANIES DRAGAS COMPANIES CHESAPEAKE HOMES ,690,774 2 RYAN HOMES CHESAPEAKE HOMES RYAN HOMES ,088,187 3 CHESAPEAKE HOMES RYAN HOMES DRAGAS COMPANIES ,790,273 4 LENNAR CORP TERRY/PETERSON RES TERRY/PETERSON RES ,897,051 5 TERRY/PETERSON RES LENNAR CORP NAPOLITANO ENT INC ,733,046 6 HHHUNT HOMES FRANCISCUS CO INC LENNAR CORP ,289,686 7 NAPOLITANO ENT INC NAPOLITANO ENT INC MCQ BLDRS & DEV INC ,973,000 8 FRANCISCUS CO INC MCQ BLDRS & DEV INC HOME ASSOCIATES OF VA... 15,186,501 9 MCQ BLDRS & DEV INC HEARNDON CONSTR CORP FRANCISCUS CO INC ,113, BECO CONSTRUCTION INC HHHUNT HOMES HEARNDON CONSTR CORP.. 14,324, HOME ASSOCIATES OF VA L L BLDG CORP HHHUNT HOMES ,214, ASHDON BUILDERS INC PACE CONSTR & DEV CORP AINSLIE GROUP INC ,953, VILLA DEVELOPMENT MOODY DEV CORP PACE CONSTR & DEV CORP.. 12,546, MOODY DEV CORP CENTEX HOMES L L BLDG CORP ,171, CENTEX HOMES HOME ASSOCIATES OF VA BISHARD DEV CORP ,338, PACE CONSTR & DEV CORP BISHARD DEV CORP CENTEX HOMES ,457, BISHARD DEV CORP VILLA DEVELOPMENT VILLA DEVELOPMENT ,334, STEPHEN ALEXANDER HOMES BECO CONSTRUCTION INC ASHDON BUILDERS INC ,612, HEARNDON CONSTR CORP AINSLIE GROUP INC TERRY INDUSTRIES ,497, ROYAL DOMINION HOMES HEALTH E COMMUNITY ENT INC SADLER BLDG CORP ,483, L L BLDG CORP ETHERIDGE CONSTRUCTION L R HILL CUSTOM BLDR ,904, NORTH SHORE CONSTR CO SADLER BLDG CORP STEPHEN ALEXANDER 16 N N REDEV & HOUSING AUTH VIRGINIA ENT INC HOMES INC ,666, SUMMIT CONSTR CORP ASHDON BUILDERS INC SUMMIT CONSTR CORP ,554, SADLER BLDG CORP TERRY INDUSTRIES ETHERIDGE CONSTRUCTION... 8,320, CMH HOMES INC ASSOCIATED CONTR SVC INC VIRGINIA ENT INC ,973, BECO CONSTRUCTION INC.... 7,937, RESIDENTIAL

62 EXISTING HOMES The existing residential real estate market in Hampton Roads experienced early highs, a sharp fall, and ended with signs of stabilizing and promise upon the horizon. The federal first-time homebuyer s tax credit spawned a rush of home purchases during the first third of the year. But, once the tax credit expired, the existing home real estate market dropped sharply as the sting of sales being pulled forward was felt. Once the brunt of displaced sales was tamed, the market began to stabilize and ended with a key leading indicator pointing towards better sales activity in the near future. The number of existing homes actively for sale in the Hampton Roads region declined by 2.6%, as measured at the end of the year, when compared to At the end of 2009, there were 10,077 existing homes for sale, but the active market fell to 9,809 existing homes for sale at the end of The continuing high amount of existing homes for sale, combined with the decline in the number of closings, pushed the months supply of inventory in the Hampton Roads region to 10.9 months. This change represents an increase of two months when compared to the months supply measured at the end of Distressed homes, those that are bank owned or short sales, comprised between 17% and 25% of the active existing homes for sale in the region throughout the year. The monthly percentage distressed homes comprised of the total existing active market in 2010 was larger than any individual month during 2009 when the measure peaked at 16% in December The average percentage distressed homes comprised of the active existing market each month in 2009 was 13%, whereas in 2010, the average percentage climbed to 20% each month and peaked in December at 25% of the existing active market in the region. Distressed homes also continued to affect the market correction process as they increased as both a percentage of existing homes for sale and those that closed in For the year, distressed homes comprised 25.8% of existing residential closings. On a monthly basis, the percentage of closings that were distressed ranged from 21% to 35% per month throughout The total number of existing distressed home closings in 2010 was up 28% to 3,634 when compared to the 2,828 that closed in These distressed home sales had a negative impact on the median sale price of existing homes in the region by pulling it lower due to the median sale price of existing distressed homes for 2010 being $150,000, which is $70,000 lower than the median sale price for existing non-distressed homes. At $220,000, the median sale price of non-distressed homes saw a $5,000 increase from The median sale price of existing distressed homes dropped 9% from 2009 and negated the 2.3% gain in median sale price of non-distressed existing homes that closed in The federal first-time home-buyer s tax credit spawned a rush of home purchases during the first third of the year. But, once the tax credit expired, the existing home real estate market dropped sharply as the sting of sales being pulled forward was felt. Once the brunt of displaced sales was tamed, the market began to stabilize and ended with a key leading indicator pointing towards better sales activity in the near future Hampton Roads Real Estate Market Review 60

63 2011 R E S I D E N TIAL 25,000 20,000 15,000 10,000 5, ,612 18,430 19,604 20,881 $130,000 $109,900 $117,050 $99,999 $51,000 $53,800 $55,200 $49,300 5,538 4,873 3,831 2,801 23,209 24,207 $194,500 $157,900 $215,000 $224,900 $219,900 $208,000 $205,000 $65,100 $67,900 $68,200 $60,300 $56,600 $59,100 $64,199 2,015 2,093 4,313 6,982 9,055 10,077 9, Existing Active Homes for Sale Existing Home Closings Median Sale Price Household Median Income 21,890 18,572 14,517 15,526 14,265 $250,000 $200,000 $150,000 $100,000 $50,000 $0 The 2010 median sale price of all existing homes in the Hampton Roads region was $205,000, a 1.4% decline from The average sale price of all existing homes was relatively flat at $231,552, down 0.7% from The drops in both median and average sales prices were smaller than forecasted at the beginning of the year despite the average sale price to list price ratio remaining steady at 96% in 2010 from Only attached existing home sales experienced a slight decline in average sale price to list price ratio from 97% in 2009 to 96% in Williamsburg showed the only significant increase in the sale price to final list price ratio for individual cities and counties. Williamsburg s percentage increased from 94% in 2009 to 96% in Mathews County and Isle of Wight County also showed gains in the sale price to list price ratio in addition to Williamsburg, though each was less than one percent. At the other end of the spectrum, Hampton and Portsmouth showed the largest declines, 1.9% and 1.4% respectively. The majority of municipalities were relatively flat with the sale price to list price ratio each dropping less than one percent in 2010 from James City County had the highest median existing home sale price at $295,000 in 2010, down from a me RESIDENTIAL
64 Average Days on the Market Existing Real Estate Closings 2,500 2,000 Distressed Closings Closings % of Distressed Closings 40% 35% 30% 1,500 25% 1,000 20% 15% % 5% 0 0% JAN 09 FEB 09 MAR 09 APR 09 MAY 09 JUN 09 JUL 09 AUG 09 SEP 09 OCT 09 NOV 09 DEC 09 JAN 10 FEB 10 MAR 10 APR 10 MAY 10 JUN 10 JUL 10 AUG 10 SEP 10 OCT 10 NOV 10 DEC Hampton Roads Real Estate Market Review 62
65 2011 R E S I D E N TIAL dian of $301,900 in For 2010, only Chesapeake and Surry County experienced rising median sale prices for existing homes of significance, 2% and 29% respectively. Only two other areas avoided drops in median sale prices, Virginia Beach and Isle of Wight County. The median sale price in Virginia Beach was flat year-over-year at $230,000 and Isle of Wight County had a slight increase of 0.4%, otherwise all of the local cities and counties had median price declines when compared to Portsmouth and Mathews County experienced the largest declines in median sale prices of existing homes, 10% and 19% respectively. The average number of days a home spent on the active market for sale, or market time, for existing homes that closed in 2010 in the Hampton Roads region was 87 days, the same as in This was the first year without an increase since The stabilizing of this measure may signify a leveling and strength in the real estate market, but the statistic is susceptible to manipulation and may not be truly indicative of the time it takes to sell a home. For instance, when the same measure is taken for all existing homes that exit the active market (i.e. the home becomes no longer for sale due to closing, listing expiration, contract fall through, or the listing is withdrawn from the active market) the average number of days on market was 128 for 2010, whereas it was 125 days for 2009, much larger than the market time of only those homes that closed. Detached homes accounted for 79% of all existing home closings in 2010, up 2% from The number of closings was down 7% for detached existing homes in 2010 when compared to The median sale price for detached homes in 2010 was $220,000, down 2.2% from 2009 s measure. The Southside s cities and counties comprised 72% of all the existing detached home closings in Virginia Beach had the highest percentage, 26%, for any single city or county for the Hampton Roads region. Existing Homes Median Sale Prices $350,000 $300,000 $250,000 $200,000 $150,000 $225,500 $230,000 $232,500 $213,750 $200,000 $198,350 $169,250 $155,000 $254,950 $256,000 $301,900 $295,000 $265,000 $215,000 $183,900 $172,250 $175,000 $164,900 $293,700 $270,000 $150,500 $135,000 $230,000 $214,800 $135,000 $173,500 $230,000 $230,000 $229,000 $215,500 $290,000 $279,000 $100,00 $50,000 $0 CHES CURR GLOC HAMP IWC JCC MATC NNEW NORF POQ 2009 Median SP 2010 Median SP PORT SUFF SURC VBCH WMBG YORK 2011 RESIDENTIAL 63

66 As for attached homes, the median sale price of existing homes that closed in 2010 was $165,900, a drop of 2.4% from Existing attached home closings were down 17% when compared to As with detached existing homes, the majority of attached existing homes were sold in the Southside cities and counties, 80%. Virginia Beach comprised 55% of all the attached existing home closings in the Hampton Roads region and 68% of the attached existing home closings on the Southside. Looking forward, early 2011 existing real estate closings show promise. This is based, in part, by the rise of homes under contract in December The number of homes that go under contract during a month is often referred to as a key leading indicator of the real estate market. In December 2010, the Hampton Roads region experienced a 1.8% increase over December Though not all of these homes will likely become closed existing home sales, the majority will and that should translate into the beginnings of growth in the residential real estate market for Hampton Roads in Closings By Type and City City/ DET DET ATT ATT County Sold Sold % Sold Sold % Total Total % Change Change Change CHES % % % CURR % 0 0 N/A % GLOC % % % HAMP % % % IWC % % % JCC % % % MATC % 0 0 N/A % NNEW % % % NORF % % % POQ % % % PORT % % % SUFF % % % SURC % 0 0 N/A % VBCH % % % WMBG % % % YORK % % % 2011 Hampton Roads Real Estate Market Review 64
67 2011 R E S I D E N TIAL About the Data: The underlying data the resale home closing statistics are based upon is the collection of those closings belonging to Real Estate Information Network, Inc. (REIN) members only. The data for each sales transaction was input by hand and therefore may contain some errors at the individual home sale level. But, as a collection, this data represents the timeliest and most accurate dataset of resale homes for the entire Hampton Roads region. The strength of the data set lies within its proximity to origin and depth. The MLS (Multiple Listing Service) data is considered the deepest of any resale home database due to the sheer number of rich data fields within the database and the information contained within. The information is also being keyed by either the actual listing agent or administrative staff of the same real estate firm. The combination of these two key elements allows the MLS data to be more precise than many other information repositories and vastly timelier. But, MLS data does have weaknesses. Most notably is the portion of the dataset at the edges of the MLS s boundaries. Usually, MLS membership wanes around the borders of the coverage area, due to overlapping MLSes. In such overlap areas, any given real estate broker may choose to join only one of the two or more MLSes that cover the particular area. For the local MSA and the region covered by REIN, this translates into less than ideal accountability for sales in North Carolina, Northern Neck areas of Virginia, and the Williamsburg area. As for REIN, it is an independent MLS owned by broker stockholder members. Currently, there are approximately 485 real estate firms with over 6,100 real estate agents serving the entire Hampton Roads region RESIDENTIAL

68 To Franklin and Southampton Residential Submarkets (New Construction) Residential Submarkets (Existing Homes) Southside Chesapeake. Franklin/Southampton Isle of Wight Co Norfolk Portsmouth Suffolk Virginia Beach Peninsula Gloucester Hampton James City County Newport News York County Southside Chesapeake Currituck Isle of Wight Co Matthews Norfolk Portsmouth Suffolk Surry Virginia Beach Peninsula Gloucester Hampton James City County Newport News York County
 functions and reports are funded by donations from individuals, organizations and")

69 MULTI-FAMILY 2011 HAMPTON ROADS REAL ESTATE MARKET REVIEW Author Data Analysis/ Layout Financial Support Disclosure Charles Dalton Real Data The E. V. Williams Center for Real Estate and Economic Development (CREED) functions and reports are funded by donations from individuals, organizations and the CREED Council. The data used for this report are deemed reliable; however, neither Old Dominion University, the E. V. Williams Center for Real Estate and Economic Development, nor sponsoring companies and/or individuals makes any representation or warranty as to its accuracy MULTI-FAMILY


70 General Overview The Virginia Beach-Norfolk-Newport News Apartment Report, published by Real Data, is a detailed analysis of the rental market within conventional apartment communities in the Hampton Roads region. The area has been divided into nine submarkets: Chesapeake, Hampton, Newport News, Norfolk, Portsmouth, Suffolk, Virginia Beach, Williamsburg and York. Combined, these areas contain a survey base of over 92,000 units within conventional apartment communities of 50 or more units each. The Virginia Beach-Norfolk-Newport News market is divided into two portions by the James River. The Peninsula area is north of the James River and contains Hampton, Newport News, Williamsburg and York. The Southside area is south of the James River and contains Chesapeake, Norfolk, Portsmouth, Suffolk and Virginia Beach. The cities with the highest concentration of units are Virginia Beach and Newport News, which accounts for nearly one half of the region s apartment units. Like the rest of the country, the Hampton Roads apartment market weakened in 2008 and 2009 as the housing bubble collapsed and the economy entered into a recession. Occupancy rates fell to their lowest level in over ten years in the first quarter of 2009 and rent growth was stagnant for most of 2008 and Since that time, occupancies have steadily improved with average occupancy rising to 94.7% in the fourth quarter of The turnaround is due to strengthening demand for rentals in lieu of home ownership and a limited development pipeline which has kept supply in check. Submarket Percentages Development activity remains moderate. As of October 2010, 2% there were only 1,100 units under construction; however, there were 4% York County more than 4,000 units proposed. Many of the proposed projects are Williamsburg 11% struggling to obtain financing in the current lending environment even 1% Chesapeake Suffolk though market fundamentals look favorable through The average quoted rental rate is $900, with one-bedroom rents 25% Virginia averaging $803 per month, two-bedroom units averaging $905 per Beach month, and three-bedroom units reporting an average rental rate of $1,080 per month. Average rental rates from existing inventory increased by $15.48 in the last twelve months, while this is a modest increase over last year, it does indicate an improving market in terms 8% of rent growth. Approximately 20% of rental communities are offering Portsmouth some type of rental concessions, but in terms of the market as a whole, 14% the concessions are only moderate with overall rents rising. Norfolk 11% Hampton 23% Newport News 2011 Hampton Roads Real Estate Market Review 68

71 2011 M U LTI-FAMILY HISTORICAL APARTMENT DEVELOPMENT Virginia Beach-Norfolk-Newport News Development of apartment units in this market peaked during two time periods, the early 1970s and the late 1980s. Although current development activity is being slowed by tighter lending restrictions, there are more than 5,000 units in some level of planning, many of which are waiting to secure financing. TABLE I Historical Apartment Development 25,000 20,000 Number of Units 15,000 10,000 5,000 0 Pre Year Built 2011 MULTI-FAMILY
72 HISTORICAL APARTMENT DEVELOPMENT Historical Multi-Family Building Permits Virginia Beach-Norfolk-Newport News Overall housing development in the region was at its peak from with more than 10,000 total housing permits issued annually (single and multi-family combined). With the slowdown in the overall housing market, residential permits issued fell to 5,223 in 2009 which is less than half of the activity at the peak of the market in Based on single and multifamily permits issued year to date, the slowdown in new housing starts is expected to continue with less than 4,000 units permitted in Multi-family permit activity, which includes rental and for-sale units, was strongest in However, much of the permit activity up until 2009 had not been rental apartments, but instead for-sale condominiums and townhouses, especially in recent years when a decline in interest rates made it easier for many people to get into the for-sale arena. It is expected that 2010 will record the lowest permit activity since 2000, although most of the permits in the last year are for rentals versus the for-sale market. TABLE II Annual Multi-Family Permit Activity Permits Issued 3,200 3,000 2,800 2,600 2,400 2,200 2,000 1,800 1,600 1,400 1,200 1, ,102 1,216 1, ,519 2,355 2, (thru Nov.) 2,339 3,085 1,159 1,315 1,811 2, Hampton Roads Real Estate Market Review 70
73 2011 M U LTI-FAMILY TABLE III Multi-Family Permits Issued Past Year 500 Number of Permits Nov Dec Jan Feb Mar Apr May 2010 Jun Jul Aug Sep Oct Nov APARTMENT DEVELOPMENT ACTIVITY As of October 2010, there were only 1,106 apartment units under construction within eight communities in the Virginia Beach-Norfolk-Newport News market. There are an additional 4,100 apartment units proposed to start construction within the next year. Norfolk, Chesapeake, and Hampton are the most active areas for new apartment development with 11 communities either underway or in planning. TABLE IV Apartment Development Activity (October 2010) 1,500 1,400 1,300 1,200 1,100 Under Construction Proposed 1,000 Number of Units Chesapeake Hampton Newport News Norfolk Portsmouth Suffolk Virginia Beach Williamsburg York County 2011 MULTI-FAMILY
74 ABSORPTION Absorption is defined as the net change in occupied units. Therefore, positive absorption occurs when previously vacant or newly built dwellings become occupied. Based on historical performance, the Virginia Beach-Norfolk-Newport News area is expected to absorb between 600 and 900 units annually. The collapse of the housing markets nationwide and the weakening economy caused a significant drop in demand for all types of housing in The area experienced a surge in demand for rental units in 2009 and This was due in part to the difficulties in the for-sale housing market. TABLE V Absorption Units Absorbed (Demand) TABLE VI Submarket Absorption Absorption (Annual) Chesapeake Hampton Newport News Norfolk Portsmouth Suffolk Virginia Beach Williamsburg York County 2011 Hampton Roads Real Estate Market Review 72
 7.5 7.0 6.5 6.0 5.5 5.0 4.5 4.0 3.5 3.0 2.5 2.0 1.5 1.0.5 0 2001 2002 2003 2004 2005 2006 2007 2008 2009 2010 73 2011 MULTI-FAMILY")
75 2011 M U LTI-FAMILY VACANCY The overall vacancy rate for the Virginia Beach-Norfolk-Newport News market as of October 2010 was 5.7%, its lowest level since Vacancy rates are expected to remain in the 5-6% range in TABLE VII Overall Vacancy Vacancy Rate (Annual) MULTI-FAMILY
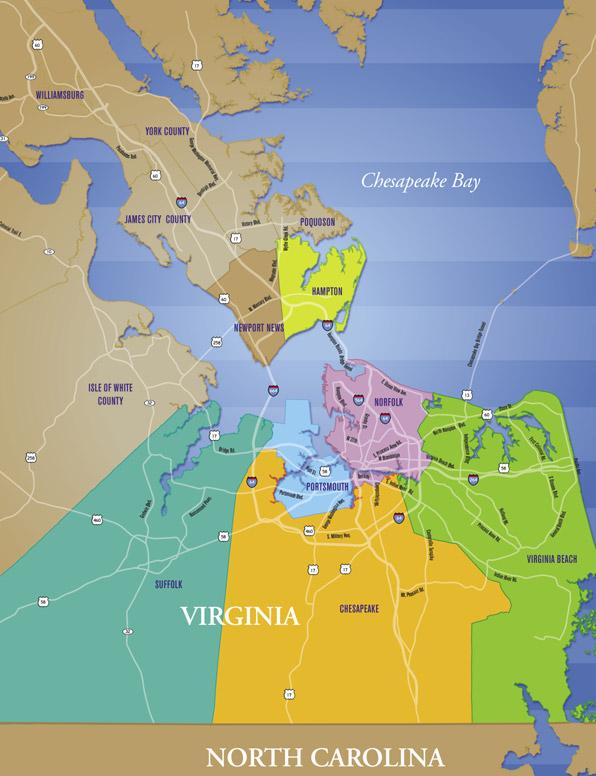
76
77 2011 M U LTI-FAMILY Multi-Family Submarkets Southside Chesapeake Norfolk Portsmouth Suffolk Virginia Beach Williamsburg Peninsula Hampton Newport News York County
78 Most submarkets saw an improvement in vacancy rates over the past year. Chesapeake, Norfolk, Portsmouth, Williamsburg, and Suffolk experienced the greatest improvement in vacancy rates. Newport News saw its vacancy rates rise due to weakened demand in the last year as a number of new communities came on-line. TABLE VIII Vacancy Rate 9% 8% 7% 6% 5% 4% 3% 2% 1% 0% Chesapeake Hampton Newport News Norfolk Portsmouth Suffolk Virginia Beach October 2009 October 2010 Williamsburg York County Overall RENTAL RATES As of October 2010, the average rental rate in Virginia Beach-Norfolk-Newport News was $900. TABLE IX Average Rental Rates (New & Existing Communities) $1000 $900 $800 $700 Average Rental Rate $600 $500 $400 $300 $200 $100 $ Hampton Roads Real Estate Market Review 76
79 2011 M U LTI-FAMILY AVERAGE RENTS Average overall rents ranged from a low of $806 in Newport News to a high of $997 in Chesapeake. Newport News, Portsmouth, Norfolk and Suffolk all reported rents lower than the average rent of $900 per month, while Hampton, Williamsburg, York County, Virginia Beach and Chesapeake all reported rents higher than the average overall rent. TABLE X Average Rent by Submarket October 2010 $1000 $900 Average Rent (Lowest to Highest) $800 $700 $600 $500 $400 $300 $200 $100 $0 Newport News Portsmouth Norfolk Suffolk Overall Hampton Williamsburg York County Virginia Beach Chesapeake MULTI-FAMILY
80 MANAGEMENT There were over 470 conventional apartment communities with more than 50 units surveyed in the Hampton Roads region in October. Of the 92,000 apartment units surveyed, the top five firms manage nearly one-third of these units. TABLE XI Top 10 Management Companies S.L. Nusbaum Great Atlantic Drucker & Falk Lawson Companies Breeden Management WMCI Kotarides Companies Ripley-Heatwole Harbor Group Perrel Management 0% 1% 2% 3% 4% 5% 6% 7% 8% 9% 10% REGIONAL TRENDS Roanoke Roanoke has fewer than 10,000 conventional apartment units among communities of at least 30 units. Roanoke s apartment market coped better than most markets during the past recession. This was due in large part to the fact that there has been minimal new apartment development in Roanoke over the past several years which has kept the rental supply at a manageable level. Occupancy rates in 2010 were 93.5% with rent growth of just under 2% for the year. Richmond Richmond has over 60,000 conventional apartment units within communities of at least 50 units. The area s apartments hit bottom in the fourth quarter of 2009 and first quarter of 2010 when occupancies fell to 90% and rents declined by 3.5% for the year. Since that time Richmond has seen a strong resurgence in rental demand and occupancies reached nearly 93% by August of Rents also showed strong growth in latter half of 2010 with rents now averaging $ Hampton Roads Real Estate Market Review 78

 functions")


81 INVESTMENT 2011 HAMPTON ROADS REAL ESTATE MARKET REVIEW Author J. Scott Adams, CCIM Regional President, CB Richard Ellis/Hampton Roads Financial Support Disclosure The E. V. Williams Center for Real Estate and Economic Development (CREED) functions and reports are funded by donations from individuals, organizations and the CREED Council. The data used for this report are deemed reliable; however, neither Old Dominion University, the E. V. Williams Center for Real Estate and Economic Development, nor sponsoring companies and/or individuals makes any representation or warranty as to its accuracy INVESTMENT 79

82 General Overview The sun is back out again for commercial real estate investment. On nearly every possible metric, commercial real estate showed signs of stabilizing in 2010 with even more optimism for an improved 2011 as well. There is particular optimism within capital markets as national U.S. sales transactions for office, industrial, retail, and multifamily assets doubled in 2010, and many experts believe that volume could more than double again in The health of the commercial real estate industry begins with the health of the overall U.S. economy. By all accounts, the recession has ended and a more protracted expansion phase has begun. The painful reductions in employment have begun to turn around, particularly in the higher growth industries of technology, education, and health care. Many economists expect job growth to accelerate in 2011 as corporate America has been reporting strong profitability and productivity gains that allow more room to make increased people investments. As businesses increase hiring, the commercial real estate markets should show continued positive absorption of space. During 2010 the office and multi-family property types showed particular evidence of recovery. Both of these property types ended 2010 with positive absorption and vacancy factors well below the previous cyclical peak vacancies of the early 1990s. Within the office sector, CB Richard Ellis reported 11 million square feet of positive absorption in 2010, led particularly by the Eastern region of the country. The retail and industrial property types showed signs of stabilization in 2010 with even stronger signs of recovery expected in The industrial and retail markets remained at the highest vacancy rate in the last 20 years at year-end 2010, but the return of bank credit for small businesses, consumer spending, and rising trade volumes all point to better days ahead. While the market resurgence is clearly underway, there remains a sense of survival of the fittest throughout the entire industry. Investors and lenders remain cautious about what to move forward on, although the market optimism to some degree benefits all assets in all markets Hampton Roads Real Estate Market Review 80
83 2011 I N V E S T M E N T INVESTMENT SALES ACTIVITY WITH DRAMATIC GROWTH DURING 2010 While we are coming up from a relatively low base compared to the investment sales peak period of 2005 to 2007, it remains encouraging that sales volume doubled from 2009 to 2010, as reported by Real Capital Analytics ( RCA ) in the below chart. For purposes of this metric, RCA tracks sales of $5 million or more for assets in the office, industrial, retail, and multifamily properties. In fact, December s volume of over $21 billion was the highest monthly amount recorded since the end of Annual Investment Sales Volume $600 $500 $400 Billions $300 $200 $ Source: Real Capital Analytics, Inc Among the many factors that can be attributed to the rise in real estate sales volume, a key factor is the fundamental faith in the economic recovery that allows underwriting of tenant creditworthiness and more accurate prediction of investment returns. Investors remain challenged to find higher yields in alternative investment types, and the low cost of debt allows positive leverage to accentuate real estate investment returns. In terms of favored asset types, not much has changed since There continues to be strong demand for apartments as favorable government-sponsored financing remains available while rental demand is buoyed by the home ownership struggles that unfortunately continue for millions of Americans. Investors also continue to favor well-located grocery anchored retail centers, premier office buildings, medical office properties, and long-term single-tenant leased assets INVESTMENT 81
84 Within these property types, investment volumes have been particularly heavy for premium assets in primary markets. Given investors preference to obtain higher yields with the lowest risk possible, the push toward top-shelf assets is backed by a belief that these assets hold value better in downturns and appreciate more in strong economies. Investment volumes are also rising because more buyers realize that they should not expect huge price discounts on all assets available for sale. NCREIF, a national investment industry organization, reports that overall commercial real estate prices have already risen 30% from their trough, and as much as 50% for the premier properties in premier markets. VOLUME OF DISTRESSED ASSETS HAS STABILIZED A significant area of concern for the commercial real estate investment market has been the dramatic rise in distressed assets that occurred during 2008 and An encouraging sign for the real estate investment markets in 2010 was the clear stabilization of outstanding distress properties, along with increased volume of worked-out loans that are no longer considered in distress. The chart below prepared again by Real Capital Analytics shows that a rising percentage of the overall tracked distress properties has been Outstanding Worked Out worked out either through asset sale, loan restructuring, or loan extension. $250 It is also interesting to note that the rise in 2010 investment volume has a $200 strong correlation to the rise in worked out loans in In fact, RCA reports $150 that over 22% of the total sales volume was of distressed assets. Numerous wellcapitalized investors remain positioned to $50 take advantage of the buying opportunities from distress, but for the most part $0 they have been very disappointed by the 07Q1 08Q1 09Q1 10Q1 limited availability of high-quality investment product through that medium. Rather than a large tidal wave of opportunities in the short term, it appears that the overall maturity wave of loans will more likely lead to lower volumes of sales opportunities over each of the next five years. The reason for that longer time frame is that Foresight Analytics estimates that $1.4 trillion of commercial real estate debt will come due between 2011 and Much of the debt coming due in 2012 and 2013, in particular, had a five year loan term on assets that were acquired at peak market pricing during 2007 and A large number of these associated assets have current values below the current loan balance and remain at risk to become distressed as the loan maturity dates get closer. What is unknown is how the debt industry will change its patterns of dealing with borrowers in the years ahead. To date, many lenders have preferred to extend and amend loans to buy time for market recovery rather than moving forward to take title to the properties. Many experts expect lenders to be less willing to continue to do so if the individual property fundamentals and the borrower cannot show sufficient additional equity to bring to the table. The overlying market recovery should also make a big positive impact on the probability of a successful workout in each of these cases. Cumulative Distress 2011 Hampton Roads Real Estate Market Review 82
85 2011 I N V E S T M E N T POSITIVE SIGNS IN THE COMMERCIAL REAL ESTATE LENDING MARKET The Mortgage Bankers Association ( MBA ) recently reported that the commercial real estate lending spiked in the fourth quarter of 2010 with the highest quarter over quarter increase in lending volume since mid Within that total volume, the MBA noted that the insurance industry originated more loans in the fourth quarter than any time since The year s overall reported volume of over $110 billion was a 36% increase over While the MBA also reported that bank lending remained generally flat during the fourth quarter, most industry experts expect bank lending to show robust growth in 2011 as banks show improved profitability and seek to generate even higher earnings with their excess reserves and low cost of funds. The FDIC reports that year-over-year earnings improved for the fifth consecutive quarter in the third quarter of As with the overall investment sales market, to date lenders have largely preferred to focus on lower leverage loans from well capitalized and experienced investors on premium properties in premium locations. As lenders have more confidence in overall real estate markets, lending volume for other non-premium assets (i.e. Class B properties or secondary market areas) should rise, particularly with more assets expected to be offered for sale in Another encouraging sign in the lending market is the re-emergence of conduit lenders which adds to the market liquidity. Numerous well-known institutions including JP Morgan and Citigroup are rolling out conduit offerings (also referred to as Commercial Mortgage Backed Securities, or CMBS) with attractive loan terms including lower pricing, higher loan-to-value, and non-recourse terms. CMBS volume grew somewhat in 2010, but still 75% below the peak annual level in As with the overall investment sales market, to date lenders have largely preferred to focus on lower leverage loans from well capitalized and experienced investors on premium properties in premium locations. As lenders have more confidence in overall real estate markets, lending volume for other non-premium assets (i.e. Class B properties or secondary market areas) should rise, particularly with more assets expected to be offered for sale in As all areas of lending sources show signs of improvement, the competition among lenders for the better offerings available is expected to lead to less stringent borrower terms. And of course, less stringent borrower terms are expected to add further momentum to the increase in sale prices as buyers have more favorable access to capital INVESTMENT 83
86 Investment Sales Activity in Hampton Roads Area in 2010 Over $151 million of office, industrial, retail, and multifamily assets sold in 2010 transactions of $5 million or more. The eight qualifying transactions are detailed below: Property Name Property Purchase Size $/Size Purchaser Seller Type Price Prime Outlets Williamsburg Retail $78,424, ,000 SF $286.22/SF Simon Property Prime Outlets Group Alta Great Bridge Multi-Family $26,675, Units $138,932/Unit Bell Partners Wood Partners Harbour View Medical Office $12,550,000 48,517 SF $258.67/SF Health Care REIT Lingerfelt Investments Arts Building Southport Center Office $8,300,000 61,594 SF $134.75/SF College Properties, LLC Guardian Realty Battlefield Corporate Center Office $8,000,000 96,720 SF $82.71/SF First Potomac Mackenzie Fibres Realty Trust International Cape Henry Plaza Retail $6,400,000 58,424 SF $109.54/SF Suburban Asset Phillips Edison Management & Company 201 Dexter Street Industrial $6,000, ,000 SF $13.48/SF 201 Dexter, LLC Chesapeake Hardwood Products Battlefield Woods Apartments Multi-Family $5,047, Units $49,485/Unit Lawson Continental Realty Realty Corporation Services TOTAL $151,396,568 The largest sale of the year was a retail complex in Williamsburg that was part of a national portfolio of outlet centers. The Prime Outlets was one of twenty-one outlet store properties in a $2.3 billion transaction by Simon Property Group, a leading national retail owner. Each of the other seven sales was a one-off sale, three of which were two national buyers showing confidence in the Hampton Roads area. Two of the national buyers were public Real Estate Investment Trusts which purchased individual office buildings in the area. Another two of the sales were multi-family transactions, one of which was to a major national buyer based in North Carolina. A local investor purchased the one other qualifying retail asset, a well-located grocery-anchored center in Virginia Beach. It is also of note that two of the qualifying sales were owner-occupant transactions. Both Southport Center and 201 West Dexter (the one qualifying industrial sale) were purchased by investors that intended to occupy a large portion of the building for its own use. Debt financing remains readily available for these types of transactions, and recent changes to financial accounting regulations may point to even more investment sales to space users in the future. We expect that Hampton Roads continued economic stability should attract many national buyers in the months and years ahead as investors move beyond focusing exclusively on the top tier markets. Hampton Roads received national endorsement from the Brookings Institution as one of only five areas in the country that had positive job growth all four quarters of Hampton Roads Real Estate Market Review 84


87

88
RETAIL 2011 RETAIL. Author. Survey Collection. Data Analysis/ Layout. Financial Support. Disclosure. David Machupa Cushman & Wakefield/THALHIMER
 RETAIL Author Survey Collection Data Analysis/ Layout Financial Support Disclosure David Machupa Cushman & Wakefield/THALHIMER Kyllie Brinkley E.V. Williams Center for Real Estate and Economic Development
Kyllie Brinkley E.V. Williams Center for Real Estate and Economic Development Old Dominion University
 HAMPTON ROADS MARKET REVIEW RETAIL Author Survey Collection Data Analysis/ Layout Financial Support Disclosure David Machupa Cushman & Wakefield THALHIMER Kyllie Brinkley E.V. Williams Center for Real
RETAIL. Acknowledgements. Authors: Christopher C. Read CB Richard Ellis of Virginia, Inc. Susan P. Pender. NAI Harvey Lindsay
 The E. V. Williams Center for Real Estate and Economic Development wishes to acknowledge all of the firms, individuals and organizations for providing the necessary real estate information and assistance.
Page 82: Commercial Versus Residential Heading: 6th line should read: The commercial real estate industry has.
 Errata: Page 82: Commercial Versus Residential Heading: 6th line should read: The commercial real estate industry has. Page 85: Chart title should read as US COMMERCIAL PROPERTY SALES. Page 86: Chart at
Hampton Roads Real Estate Market Review and Forecast
 Old Dominion University Hampton Roads Real Estate Market Review and Forecast 2011 Presented by: E.V. Williams Center for Real Estate and Economic Development Welcome! John R. Lombard, Ph.D. Director E.V.
INDUSTRIAL. Acknowledgements. Author: Billy King, SIOR. Data Preparation: Stephanie Sanker. Survey Coordination Clay Culbreth, CCIM, SIOR
 HAMPTON ROADS 2006 INDUSTRIAL M A R K E T S U R V E Y Acknowledgements Author: Billy King, SIOR Data Preparation: Stephanie Sanker Survey Coordination Clay Culbreth, CCIM, SIOR Financial Support: The E.
E. V. WILLIAMS CENTER FOR REAL ESTATE AND ECONOMIC DEVELOPMENT
 H A M P T O N R O A D S E. V. WILLIAMS CENTER FOR REAL ESTATE AND ECONOMIC DEVELOPMENT WWW.ODU.EDU/CREED CONTENTS ASSOCIATE PUBLISHER Mike Herron Inside Business 757.222.3991 SPECIAL PROJECTS MANAGER
Old Dominion University
 Old Dominion University E. V. Williams Center for Real Estate and Economic Development E. V. Williams Center for Real Estate and Economic Development www.odu.edu/creed CONTENTS 5 Message From The Director
INDUSTRIAL. Acknowledgements MARKET SURVEY. Author. Data Preparation. Survey Coordination. Financial Support HAMPTON ROADS.
 INDUSTRIAL 2007 HAMPTON ROADS MARKET SURVEY Acknowledgements Author Billy King, SIOR Data Preparation Stephanie Sanker Survey Coordination Clay Culbreth, CCIM, SIOR Financial Support The E. V. Williams
MARKET SURVEY OLD DOMINION UNIVERSITY CENTER FOR REAL ESTATE AND ECONOMIC DEVELOPMENT. Center for Real Estate & Economic Development
 2004 MARKET SURVEY OLD DOMINION UNIVERSITY CENTER FOR REAL ESTATE AND ECONOMIC DEVELOPMENT Center for Real Estate & Economic Development Some commercial real estate firms can help you with a particular
INDUSTRIAL. Stephanie Sanker, SIOR, CCIM. Stephanie Sanker, SIOR, CCIM
 2011 HAMPTON ROADS REAL ESTATE MARKET REVIEW INDUSTRIAL Author Data Preparation Survey Coordination William C. Throne, SIOR, CCIM, ALC Vice President, Cushman & Wakefield/THALHIMER Stephanie Sanker, SIOR,
Old Dominion University Hampton Roads Real Estate Market Review and Forecast 2005
 Old Dominion University Hampton Roads Real Estate Market Review and Forecast 2005 Presented by: The Center for Real Estate and Economic Development Real Estate Centers University of Pennsylvania Samuel
INVESTMENT. Acknowledgements. Authors: Jonathan Guion, SIOR Senior Advisor Sperry Van Ness Commercial Real Estate Advisors
 HAMPTON ROADS 2006 INVESTMENT M A R K E T S U R V E Y Acknowledgements Authors: Jonathan Guion, SIOR Senior Advisor Sperry Van Ness Commercial Real Estate Advisors 87 2006 INVESTMENT GENERAL OVERVIEW T
REAL ESTATE MARKET REVIEW
 MULTIFAMILY 2014 HAMPTON ROADS REAL ESTATE MARKET REVIEW Author Charles Dalton Data Analysis Real Data Financial Support The E.V. Williams Center for Real Estate and Economic Development (CREED) functions
3/18/2012 WELCOME. Stephanie Sanker, CCIM, SIOR S.L. Nusbaum Realty Co.
 E.V. Williams Center for Real Estate and Economic Development (CREED) Old Dominion University Presents the 17 TH ANNUAL HAMPTON ROADS REAL ESTATE MARKET REVIEW AND FORECAST Wednesday, March 14, 2012 WELCOME
MULTIFAMILY 2012 MULTI-FAMILY HAMPTON ROADS MARKET REVIEW. Author. Data Analysis. Financial Support. Disclosure. Charles Dalton.
 HAMPTON ROADS MARKET REVIEW MULTIFAMILY Author Data Analysis Financial Support Disclosure Charles Dalton Real Data The E. V. Williams Center for Real Estate and Economic Development (CREED) functions and
Residential. Acknowledgements. Author Data Analysis/ Layout. Financial Support. Disclosure. Blair Hardesty Director Residential DataBank
 Residential Acknowledgements Author Data Analysis/ Layout Financial Support Disclosure Blair Hardesty Director Residential DataBank The E. V. Williams Center for Real Estate and Economic Development (CREED)
Inside Business. Old Dominion University Hampton Roads Real Estate Market Review and Forecast. Executive Committee. Programs Committee
 Old Dominion University Hampton Roads Real Estate Market Review and Forecast Presented by: The Center for Real Estate and Economic Development Executive Committee Melody Bobko Ron Bray Craig Cope John
Multi-Family. Acknowledgements. Author. Data Analysis/ Layout. Financial Support. Disclosure. Charles Dalton. Real Data
 Multi-Family Acknowledgements Author Charles Dalton Data Analysis/ Layout Real Data Financial Support Disclosure The E. V. Williams Center for Real Estate and Economic Development (CREED) functions and
MULTI-FAMILY DEFINITIONS. Acknowledgements. The following terminology and sources are used in the CREED Apartment Report:
 DEFINITIONS The following terminology and sources are used in the CREED Apartment Report: Absorption Net change in occupied units within comparable communities within a specific time frame. New units that
3 RD QUARTER 2016 RICHMOND RETAIL MARKET REPORT FORECAST 5.3% VACANCY 349,524 SF UNDER CONSTRUCTION (137,905) SF NET ABSORPTION
 SF NET ABSORPTION") 3 RD QUARTER 2016 RICHMOND RETAIL MARKET REPORT FORECAST All signs indicate a stabilized market that continues to support well-located new development. The majority of absorption in the 3rd quarter was
3 RD QUARTER 2016 RICHMOND RETAIL MARKET REPORT FORECAST All signs indicate a stabilized market that continues to support well-located new development. The majority of absorption in the 3rd quarter was
INVESTMENT. Acknowledgements MARKET SURVEY. Author HAMPTON ROADS
 INVESTMENT 2007 HAMPTON ROADS MARKET SURVEY Acknowledgements Author Jonathan Guion, SIOR Managing Director Sperry Van Ness Commercial Real Estate Advisors 2007 INVESTMENT General Overview This report analyzes
3 RD QUARTER 2015 RICHMOND RETAIL MARKET REPORT FORECAST 5.7% VACANCY 509,220 SF UNDER CONSTRUCTION 370,165 SF NET ABSORPTION
 3 RD QUARTER 2015 RICHMOND RETAIL MARKET REPORT FORECAST As 2015 winds down, the vacancy rates are approaching an all time low. Retail inventory is down causing an increase in construction with national
Time for Retail to Take Stock
 Q1 2013 RETAIL LAS VEGAS NEVADA RESEARCH & FORECAST REPORT Time for Retail to Take Stock It is heartening to say, after five years of a bad economy, that the first quarter of 2013 s 119,649 square feet
Good Year, Poor Quarter
 Q4 2013 RETAIL LAS VEGAS NEVADA RESEARCH & FORECAST REPORT Good Year, Poor Quarter After nine quarters of positive net absorption, Southern Nevada s retail market fell into negative net absorption territory
INVESTMENT OFFERINGS CUSHMAN & WAKEFIELD THALHIMER CAPITAL MARKETS GROUP THIRD QUARTER 2016
 CUSHMAN & WAKEFIELD THALHIMER CAPITAL MARKETS GROUP INVESTMENT OFFERINGS THIRD QUARTER 2016 ERIC ROBISON Senior Vice President (804) 697 3475 eric.robison@thalhimer.com MICHAEL EARLY First Vice President
INVESTMENT OFFERINGS CUSHMAN & WAKEFIELD THALHIMER CAPITAL MARKETS GROUP SECOND QUARTER 2016
 CUSHMAN & WAKEFIELD THALHIMER CAPITAL MARKETS GROUP INVESTMENT OFFERINGS SECOND QUARTER 2016 ERIC ROBISON Senior Vice President (804) 697 3475 eric.robison@thalhimer.com CATHARINE SPANGLER Senior Associate
New and improved approach to retail
 Research & Forecast Report GREENVILLE SPARTANBURG ANDERSON, SC RETAIL Q4 2017 New and improved approach to retail Crystal Baker Research Coordinator South Carolina Key Takeaways > > Rents remain stable
WEST COUNTY MARKETPLACE
 INVESTMENT SUMMARY Retail Investment Opportunity Offering Memorandum WEST COUNTY MARKETPLACE 2004 Veterans Memorial Parkway (Highway 78), Birmingham, AL $5,168,600 9.8% CAP RATE PRESENTED BY: Josh Randolph,
4Q 16. Columbus Market Report. 605 S Front St Suite 200 Columbus OH
 4Q 16 Columbus Market Report 605 S Front St Suite 200 Columbus OH 43215 www.ohioequities.com 614 224 2400 Columbus Table of Contents 01 Office Market Report 02 Retail Market Report 03 Industrial Market
RALEIGH-DURHAM MULTIFAMILY Year End 2017
 Research Report -DURHAM MULTIFAMILY Year End 2017 Multifamily Growth Expected to Continue in 2018, Despite a Moderate Decrease in Permitting Totals Emily Bostic Research Analyst Raleigh-Durham Key Takeaways
Upstate, SC 2Q17. Industrial Market Report. Q2 Industrial. Upstate Economy in 2Q17* Industrial Sector in 2Q17. Trends for 2Q17
 Upstate, SC 2Q17 Industrial Market Report The industrial market for the Upstate of South Carolina saw continued growth for the second quarter of 217. While there was a positive net absorption of 67,53
Charleston. Retail Loves the Holy City. Fourth Quarter 2017 Retail. Vacancy Rates. Net Absorption. Asking Rent $ , %
 Retail Loves the Holy City Even with 158,000 plus square feet (sf ) hitting the market in the fourth quarter of 2017, the vacancy rate continued its march downward dropping 0.8% to! Much of the rising
INVESTOR PRESENTATION Broad Street Realty, LLC l 1
 INVESTOR PRESENTATION 2018 2018 Broad Street Realty, LLC l 1 BACKGROUND Experts in the complex and challenging world of commercial real estate 2018 Broad Street Realty, LLC l 2 BACKGROUND BROAD STREET
Charleston. Retail Is Still Thriving. Fourth Quarter 2018 Retail
 Retail Is Still Thriving The region s vacancy rate crept up slightly from the previous quarter, while the availability rate dropped marginally. Asking NNN rental rates dropped over $1.50 per square foot
Slover Library opened January 2015 WHAT S
 Slover Library opened January 2015 WHAT S NeW Summer 2015 THE MAIN Coming in 2017 WATERSIDE LIVE! THE COURTHOUSE HARBOR S EDGE Announcing Harbor s Edge Phase II in Fort Norfolk Coming Summer 2016 NEWRETAIL
Shopping Center Occupancy Study of the Greater Hagerstown Area
 Shopping Occupancy Study of the Greater Hagerstown 2015 Prepared By City of Hagerstown Planning & Code Administration Department November 2015 Shopping Occupancy Study of the Greater Hagerstown - 2015
Investor Presentation 2017
 Investor Presentation 2017 BACKGROUND 2017 Broad Street Realty, LLC l 2 BACKGROUND BROAD STREET REALTY OVERVIEW Michael Jacoby (based in Bethesda) and Tom Yockey (based in Denver) founded Broad Street
MARKET INSIGHT LOUISVILLE, KENTUCKY MULTIFAMILY REPORT THIRD QUARTER 2017
 CUSHMAN & WAKEFIELD COMMERCIAL KENTUCKY LOUISVILLE MULTIFAMILY RESEARCH MARKET INSIGHT MULTIFAMILY REPORT THIRD QUARTER 217 The Cushman & Wakefield Commercial Kentucky Multifamily Research Team provides
Year End Deliveries Drive Leasing Activity In the Raleigh-Durham Market
 Research Report RALEIGH-DURHAM OFFICE Q4 2018 Accelerate Success Year End Deliveries Drive Leasing Activity In the Raleigh-Durham Market Kelsey Rogers Senior Research Analyst Raleigh-Durham Market Indicators
Homestretch: Office Market Set to Finish Strong
 Research & Forecast Report RENO OFFICE Q3 2016 Homestretch: Office Market Set to Finish Strong >> Vacancy drops significantly the largest drop quarter over quarter in 2016 >> Rental rates are not increasing
Greenville defies the nationwide trend of retail closures
 Research & Forecast Report GREENVILLE SPARTANBURG ANDERSON, SC RETAIL Q3 2017 Greenville defies the nationwide trend of retail closures Crystal Baker Research Coordinator South Carolina Key Takeaways >
For Lease. Center Oak Plaza 1119 Johnnie Dodds Blvd Mount Pleasant, South Carolina LOCATED IN THE HEART OF MOUNT PLEASANT
 For Lease Center Oak Plaza 1119 Johnnie Dodds Blvd Mount Pleasant, South Carolina 29464 LOCATED IN THE HEART OF MOUNT PLEASANT For More Information, Contact: Vitré Ravenel Stephens Senior Vice President
RESIDENTIAL. Acknowledgements 2008 HAMPTON ROADS REAL ESTATE MARKET REVIEW. Author Bea Hopkins Director Residential DataBank
 ODU-MarketReview2008-FINAL2:ODUMarketReview2005 2/14/08 11:53 AM Page 57 RESIDENTIAL 2008 HAMPTON ROADS REAL ESTATE MARKET REVIEW Acknowledgements Author Bea Hopkins Director Residential DataBank Data
The CoStar Retail Report
 The CoStar Retail Report T H I R D Q U A R T E R 2 0 1 1 Kansas City Retail Market Kansas City Retail Market THIRD QUARTER 2011 KANSAS CITY Table of Contents Table of Contents....................................................................
The CoStar Retail Report
 The CoStar Retail Report Y E A R - E N D 2 0 1 1 YEAR-END 2011 KANSAS CITY Table of Contents Table of Contents.................................................................... A Methodology........................................................................
SHOPS OF BERRYHILL OFFERING MEMORANDUM
 OFFERING MEMORANDUM 1890 BERRYHILL RD, CORDOVA, TN 38016 EAST RETAIL SUBMARKET RETAIL SHOPPING CENTER 17,360 sf INVESTMENT OPPORTUNITY CHIMNEY ROCK BLVD BERRYHILL RD N For more information, please contact:
WAKE UNION PLACE WAKE FOREST, NORTH CAROLINA LAND FOR SALE ±65.43 ACRES SITE WAKE FOREST PRESBYTERIAN CHURCH. Smithfield s CHICKEN N BAR-B-Q
 WAKE FOREST, NORTH CAROLINA LAND FOR SALE ±65.43 ACRES WAKE FOREST PRESBYTERIAN CHURCH SITE KEARNEY ROAD CAPITAL BOULEVARD WAKE FOREST CROSSING Smithfield s CHICKEN N BAR-B-Q MARKET OF WAKE FOREST DURHAM
Quick Absorption of Newly Constructed Office Buildings
 Research & Forecast Report CHARLESTON, SC OFFICE Q3 2016 Quick Absorption of Newly Constructed Office Buildings Bryana Mistretta Research Coordinator South Carolina Key Takeaways >> The Interstate 526
Lower Norfolk County Time Line by Donald W. Moore, CG
 Lower Norfolk Time Line 1607 first landing of Jamestown colonist at Cape Henry 1 1635 Adam Thoroughgood patent 2 1636 New Norfolk 3 1637 Lower and Upper Norfolk 4 first Lower Norfolk court 5 1639 first
NORFOLK COMMERCE PARK PORTFOLIO
 INVESTMENT OFFERING OPPORTUNITY SEPTEMBER 2018 NORFOLK COMMERCE PARK PORTFOLIO NORFOLK,VA AN INSTITUTIONALLY-SIZED OFFICE/FLEX PORTFOLIO Hampton Roads Military Circle Mall JANAF NORTHAMPTON BLVD. PRINCESS
17th Annual Real Estate Review & Forecast
 2017 17th Annual Real Estate Review & Forecast This Year s Sponsors Member FDIC Construction: Review & Forecast 2017 Page 2 Permits Issued 142 New Commercial Construction Permits issued for all Elkhart
MARKET WATCH SOUTHERN CALIFORNIA & PHOENIX
 SOUTHERN CALIFORNIA & PHOENIX COMMERCIAL REAL ESTATE MARKET FOURTH QUARTER 217 MARKET WATCH SOUTHERN CALIFORNIA & PHOENIX 1.888.659.DAUM WWW.DAUMCOMMERCIAL.COM D/AQ Corp. # 1129558 DAUM TABLE OF CONTENTS
SUMMIT POINTE CHESAPEAKE, VA 23320
 CONTACT US OFFICE LEASING PERRY FRAZER Executive Vice President +1 757 228 1833 perry.frazer@cbre-norfolk.com PAT MUGLER Executive Vice President +1 757 228 1831 pat.mugler@cbre-norfolk.com RETAIL LEASING
Los Angeles Basin Retail Market Continues To Witness Decreasing Vacancy Rates
 RETAIL GREATER LOS ANGELES BASIN MARKET REPORT Continues To Witness Decreasing Vacancy Rates MARKET INDICATORS - VACANCY 6.0% NET ABSORPTION 1,605,200 CONSTRUCTION 2,111,970 RENTAL RATE $2.03 P NNN UNEMPLOYMENT
The CoStar Retail Report
 The CoStar Retail Report M I D - Y E A R 2 0 0 9 Southwest Florida Retail Market Southwest Florida Retail Market MID-YEAR 2009 SOUTHWEST FLORIDA Table of Contents Table of Contents....................................................................
For Lease. Center Oak Plaza 1119 Johnnie Dodds Blvd Mount Pleasant, South Carolina LOCATED IN THE HEART OF MOUNT PLEASANT
 For Lease Center Oak Plaza 1119 Johnnie Dodds Blvd Mount Pleasant, South Carolina 29464 LOCATED IN THE HEART OF MOUNT PLEASANT For More Information, Contact: Vitré Ravenel Stephens Vice President Retail
RALEIGH-DURHAM OFFICE Q1 2017
 Research & Forecast Report RALEIGH-DURHAM OFFICE Q1 2017 Office Market Remains Stable During First Quarter 2017; Class A Market Continues to Peak Emily Bostic Research Analyst Raleigh-Durham Market Indicators
Miami-Dade County Retail Market Report 4Q Real Capital Partners Real Estate Services. *Data Source CoStar Miami-Dade County Retail Market Report
 Miami-Dade County Retail Market Report 4Q 216 Real Capital Partners Real Estate Services *Data Source CoStar 4Q 216 Miami-Dade County s Vacancy Decreases to 4.% Net Absorption Positive 1,155,8 SF in the
Las Vegas Valley Executive Summary
 ARROYO MARKET SQUARE Las Vegas Valley Executive Summary Retail Market 4th Quarter 2013 THE DISTRICT AT GREEN VALLEY RANCH January 23, 2014 Re: Commercial Real Estate Survey: 4th Quarter, 2013 Dear Reader,
Year-End 2017 / Office Market Report. Regional Economic Activity
 Year-End 207 / Office Market Report County Market Facts 27.6 MSF Total inventory in the County office market 793,46 SF Direct net absorption for 207.42% Overall Vacancy $43.36 PSF Average asking lease
>> Greater Los Angeles Retail Starts 2017 At A Slow Pace
 Research & Forecast Report GREATER LOS ANGELES RETAIL Q1 2017 Accelerating success. >> Greater Los Angeles Retail Starts 2017 At A Slow Pace Greater Los Angeles Retail Market The Los Angeles Basin retail
MARKET SURVEY OLD DOMINION UNIVERSITY CENTER FOR REAL ESTATE AND ECONOMIC DEVELOPMENT. Center for Real Estate & Economic Development
 2004 MARKET SURVEY OLD DOMINION UNIVERSITY CENTER FOR REAL ESTATE AND ECONOMIC DEVELOPMENT Center for Real Estate & Economic Development Some commercial real estate firms can help you with a particular
Robert Kuzman CA Lic
 OFFERING MEMORANDUM 20236 US Highway 18 North, Apple Valley, CA 92307 Exclusively Offered By: NET LEASE INVESTMENT SERVICES Kevin Held kevin.held@cushwake.com +1 858 546 5428 CA Lic. 01240358 Chuck Klein
Charleston. Retail Continues to Thrive. First Quarter 2018 Retail
 Retail Continues to Thrive Internet sales continue to have an effect on brick and mortar locations causing retailers to close non-performing locations, downsize or be sold. In other cases, retailers are
The Office Market Feels The Heat in Q2
 Research & Forecast Report RENO OFFICE Q2 2017 The Office Market Feels The Heat in Q2 >>All major office submarkets have decreased vacancy and positive absorption this quarter >>The overall vacancy decreased
Denver s Retail Sector Keeps Rolling 500, , , , , , , , ,000 50,000. Square Feet
 Research & Forecast Report METRO DENVER RETAIL Q4 2017 s Retail Sector Keeps Rolling Market Overview Net absorption finished the second half of 2017 with strong positive numbers from s Central and Northwest
2015 FORT WAYNE, INDIANA RETAIL MARKET SURVEY
 215 FORT WAYNE, INDIANA RETAIL MARKET SURVEY REVIEW FORECAST PREPARED WITH THE ASSISTANCE OF The period of October 214 - June 215 was an active time for retail transactions in the Fort Wayne area; however,
Former Denny s at Countryside
 Investment Opportunity Offering Memorandum For Sale Former Denny s at Countryside 26489 US HIGHWAY 19 NORTH, CLEARWATER, FLORIDA LOCATION HIGHLIGHTS Located just south of Countryside Mall Densely populated
INDUSTRIAL QUICK STATS SUMMARY & OUTLOOK MARKET TRENDS VACANCY & NET ABSORPTION ECONOMIC STATS. Current Quarter. Direct Vacancy 2.
 ORANGE COUNTY INDUSTRIAL SECOND QUARTER 218 QUICK STATS Direct Vacancy 2.2% Overall Vacancy 2.5% Lease Rate NNN $.95 Gross Absorption Under Construction MARKET TRENDS Current Quarter 2,956,71 SF 1,367,18
>> Greater Los Angeles Retail Continues to Witness Declining Vacancy
 Research & Forecast Report GREATER LOS ANGELES RETAIL Accelerating success. >> Greater Los Angeles Retail Continues to Witness Declining Vacancy Greater Los Angeles Retail Market The Los Angeles Basin
INDUSTRIAL QUICK STATS SUMMARY & OUTLOOK MARKET TRENDS VACANCY & NET ABSORPTION ECONOMIC STATS
 PHOENIX, ARIZONA INDUSTRIAL THIRD QUARTER 217 QUICK STATS Direct Vacancy 8.7% Overall Vacancy 9.% Lease Rate NNN $.54 Gross Absorption Under Construction MARKET TRENDS Current Quarter 5,991,128 SF 4,751,494
Market Research. Industrial Review. Industrial Third Quarter Market Indicators
 colliers international LAS VEGAS, NV Market Research Industrial Third Quarter 2009 Market Indicators Vacancy Net Absorption Construction Rental Rate Q3-09 Q4-2009 Projected Clark County Economic Data Jul-09
>> Greater Los Angeles Retail Continues to Witness Declining Vacancy
 Research & Forecast Report GREATER LOS ANGELES RETAIL Accelerating success. >> Greater Los Angeles Retail Continues to Witness Declining Vacancy Greater Los Angeles Retail Market The Los Angeles Basin
Southside Discount Mall 125,000 SF Retail Center 6525 Tara Boulevard Atlanta, GA $24.80 Per SF 12.5% Cap Rate
 Southside Discount Mall 125,000 SF Retail Center 6525 Tara Boulevard Atlanta, GA $24.80 Per SF 12.5% Cap Rate Theresa Johnson Vice President National Retail Group 404.876.1640 x 109 Theresa@BullRealty.com
Sites Listed on the Virginia Beach Historical Register - By Address As of January 26, 2018 (Year listed shown in parenthesis)
") Sites Listed on the Virginia Beach Historical Register - By Address As of January 26, 2018 (Year listed shown in parenthesis) 411 16 th Street (2004) 301 20 th Street, Nita Fay House (2005) removed from
Sites Listed on the Virginia Beach Historical Register - By Address As of January 26, 2018 (Year listed shown in parenthesis) 411 16 th Street (2004) 301 20 th Street, Nita Fay House (2005) removed from
Cycle Monitor Real Estate Market Cycles Third Quarter 2017 Analysis
 Cycle Monitor Real Estate Market Cycles Third Quarter 2017 Analysis Real Estate Physical Market Cycle Analysis of Five Property Types in 54 Metropolitan Statistical Areas (MSAs). Income-producing real
>> Greater Los Angeles Retail Ends 2016 With Mixed Results
 Research & Forecast Report GREATER LOS ANGELES RETAIL Q4 2016 Accelerating success. >> Greater Los Angeles Retail Ends 2016 With Mixed Results Greater Los Angeles Retail Market The Los Angeles Basin retail
OFFICE QUICK STATS SUMMARY & OUTLOOK MARKET TRENDS VACANCY & NET ABSORPTION ECONOMIC STATS
 INLAND EMPIRE OFFICE THIRD QUARTER 217 QUICK STATS Direct Vacancy 11.4% Overall Vacancy 11.7% Lease Rate FSG $1.83 Gross Absorption Under Construction MARKET TRENDS Current Quarter 529,634 SF 45,24 SF
SOUTHWEST CORNER OF CAPITOL DRIVE & 124TH STREET BROOKFIELD (SUBURBAN MILWAUKEE), WISCONSIN
, WISCONSIN") SOUTHWEST CORNER OF CAPITOL DRIVE & 124TH STREET BROOKFIELD (SUBURBAN MILWAUKEE), WISCONSIN INVESTMENT HIGHLIGHTS S U B J E C T O F F E R I N G Mid-America Real Estate Corporation, in cooperation with
SOUTHWEST CORNER OF CAPITOL DRIVE & 124TH STREET BROOKFIELD (SUBURBAN MILWAUKEE), WISCONSIN INVESTMENT HIGHLIGHTS S U B J E C T O F F E R I N G Mid-America Real Estate Corporation, in cooperation with
RETAIL MARKET ANALYSIS
 RETAIL MARKET ANALYSIS Portland State University Despite the doom and gloom warnings of a retail apocalypse, the national story for retail is that things are stable. Nationwide vacancy is at 5.2 percent
OFFICE QUICK STATS SUMMARY & OUTLOOK MARKET TRENDS VACANCY & NET ABSORPTION ECONOMIC STATS
 LOS ANGELES CENTAL/SOUTHEAST OFFICE THIRD QUARTER 218 QUICK STATS Direct Vacancy 14.7% Overall Vacancy 15.2% Lease Rate FSG $3.16 Gross Absorption Under Construction MARKET TRENDS Change from Last Quarter
Vacancy Inches Higher, Despite Continued Absorption
 Research & Forecast Report GREATER PHOENIX OFFICE 1Q 2017 Vacancy Inches Higher, Despite Continued Absorption Key Takeaways > > Improving conditions in the Greater Phoenix office market took a pause in
VERIZON WIRELESS & CLEAR CHANNEL BILLBOARD. $2,470,000 / 8.2% CAP (8.95% in 2013)
") Dobbins Air Reserve Base Subject Property Subject Property Akers Mill Square Cumberland Mall Subject Property VERIZON WIRELESS & CLEAR CHANNEL BILLBOARD 2009 Construction $2,470,000 / 8.2% CAP (8.95% in
Dobbins Air Reserve Base Subject Property Subject Property Akers Mill Square Cumberland Mall Subject Property VERIZON WIRELESS & CLEAR CHANNEL BILLBOARD 2009 Construction $2,470,000 / 8.2% CAP (8.95% in
Picked Over. ALBUQUERQUE, NM Q Industrial. Research & Forecast Report. Key Takeaways. Market Indicators Relative to prior period
 Research & Forecast Report ALBUQUERQUE, NM Q4 20 Industrial Picked Over Key Takeaways > > Owner user acquisitions strong > > Supply tightens > > New construction projects gaining more momentum The appetite
Market Research. OFFICE First Quarter 2010
 colliers international LAS VEGAS, NV Market Research OFFICE First Quarter 2010 Market Indicators Net Absorption Construction Rental Rate Q1-10 Q2-2010 Projected Clark County Economic Data Jan-10 Jan-09
Office Market Remained Steady in Q4
 Research & Forecast Report Long Island OFFICE MARKET Q4 2015 Office Market Remained Steady in Q4 Rose Liu Research & Financial Analyst Long Island Takeaways Class A & B Continuing the momentum, the Long
MARKET WATCH. Market Highlights
 MARKET WATCH Market Highlights Office Total Inventory 362,968,225 SF Total Vacancy Rate 14.10% Average Rate $24.32 PSF YTD Net Absorption 2,081,326 SF Industrial Total Inventory 804,891,880 SF Total Vacancy
RETAIL MARKET SECOND QUARTER 2018
 RETAIL MARKET SECOND QUARTER 2018 1900 Wright Place, Suite 200 92008 760-929-9700 lee-associates.com/sandiegonorth RETAIL MARKET SECOND QUARTER 2018 MARKET SNAPSHOT North County totals are based on the
Stronger Office Market Looking Into Future
 Research & Forecast Report Long Island OFFICE MARKET Q2 2015 Stronger Office Market Looking Into Future Rose Liu Research & Financial Analyst Long Island Takeaways Class A & B Long Island economic and
San Antonio 4th Quarter 2014 INDUSTRIAL. Market Trends COMMERCIAL REAL ESTATE INFORMATION
 San Antonio 4th Quarter 2014 INDUSTRIAL Market Trends COMMERCIAL REAL ESTATE INFORMATION Table of Contents/Methodology of Tracked Set Table of Contents/Methodology of Tracked Set 2 San Antonio Market Map
Market Research. Market Indicators
 colliers international LAS VEGAS, NV Market Research OFFICE Second Quarter 2009 Market Indicators Net Absorption Construction Rental Rate Q2-09 Q3-2009 Projected Clark County Economic Data UNEMPLOYMENT
VACANCY COMPLETIONS RENTAL RATE. *Projected $1.70. Vacancy Rate 14.9% 14.4% $1.60 $1.50 $1.40 $1.30 $1.20
 Research & Forecast Report RENO OFFICE Q4 A Good Year Overall > Building sale prices are significantly higher than. > Seven buildings over 40,000 sf sold in, more than in previous years. > Many large office
Industrial Real Estate Portfolio
 Industrial Real Estate Portfolio Portfolio Coverage Page 7 6565 Echo Avenue, Reno, NV Property Summary Address: Size (SF): Office Finish: HVAC Space: Year Built: 2003 Site Area: 6565 Echo Avenue Reno,
Gaining Traction Gradually in 2018
 Research & Forecast Report RENO OFFICE Q1 2018 Gaining Traction Gradually in 2018 >> Overall vacancy increased slightly to 12.3% >> Negative net absorption of 13,792 square feet >> Rental rates remained
Overall Industrial Market Off to Solid First Quarter; Flex Market Rebounding
 Research & Forecast Report RALEIGH-DURHAM INDUSTRIAL Overall Industrial Market Off to Solid First Quarter; Flex Market Rebounding Emily Bostic Research Analyst Raleigh-Durham Key Takeaways > > The Triangle
WINCHESTER STATION WINCHESTER, FREDERICK COUNTY, VIRGINIA
 OFFERING SUMMARY WINCHESTER, FREDERICK COUNTY, VIRGINIA Best-In-Class Merchandising Mix 95% of GLA Occupied by National Tenants Significant Base Rental Rate Spreads On Recent Backfill of Former HHGregg
INVESTMENT OVERVIEW PROPERTY OVERVIEW MAJOR TENANTS
 OFFERING SUMMARY INVESTMENT OVERVIEW HFF is pleased to exclusively offer 5000 South Hulen (the Property ), a 86,943 square foot shopping center located within the most established and recognized retail
Market Research. Market Indicators
 colliers international LAS VEGAS, NV Market Research OFFICE Third Quarter 2009 Market Indicators Net Absorption Construction Rental Rate Q3-09 Q4-2009 Projected Clark County Economic Data Jul-09 Jul-08
101 E Washington Street, Ste 400 Greenville, SC Q 18. Market Report
 101 E Washington Street, Ste 400 Greenville, SC 29601 2Q 18 Market Report GREENVILLE/SPARTANBURG 2Q18 OFFICE REPORT * MARKET SUMMARY The Greenville Spartanburg Office market remained fairly steady at the