2013 San Diego Economic Outlook. 29 th Annual Economic Roundtable Marney Cox Chief Economist San Diego Association of Governments January 25, 2013
|
|
|
- Sandra Norris
- 5 years ago
- Views:
Transcription


1 213 San Diego Economic Outlook 29 th Annual Economic Roundtable Marney Cox Chief Economist San Diego Association of Governments January 25, 213

2 US The Problem Slow Economic Growth Gross Domestic Product Potential GDP Trillion$ Annual Gap Actual GDP


3 US Solutions Fiscal & Monetary Policy Federal Government Revenue & Expenditures Expenditures $1.1 Trillion Deficit Excess Bank Reserves Loanable Funds $1.5 Trillion 1 Yr. Treasury & FF Rate FF Rate 1 Year T- Rate Revenues


4 US Results Below Trend Performance Jobs Gap-Trend VS Actual Expansion 132% Begins July 29 Debt / Income Ratio 66% - 8% - 7.1M Jobs Income Gap-Trend VS Actual Expansion Begins July 29 5% - 3% -9.% 1% 4 Months 4 Months


5 Then It s the Economy, Stupid Now It s the Labor Market


6 US Employment-Population Ratio 42% of Adult Population not Employed 4 ppt Drop
7 Labor Force Challenges STRUCTURAL-skill mismatches INCENTIVES-social program expansions
8 Outlook for San Diego

9 SD Payroll Jobs Change Y-O-Y by Quarter , 6, 4, 2, -2, -4, -6, -8, -1,

10 SD 211 Jobs Actual vs Estimate (EDD Non-Agricultural Employment) 25, 2, 15, 1, 211 Est 211 Act 5, -5, Jan Feb Mar Apr May Jun Jul Aug Sep


11 SD Job Change Industries -4, -2, 2, 4, -31,8-9,7-23,3-7,3-13,5-11,7-4,9-1,2 6, 19,6
12 Monthly Unemployment Rates November 211 to 212 (YOY) 14.% 12.% San Diego 9.4% to 8.3% California (SA) 11.3% to 9.8% United States (SA) 8.7% to 7.7% 1.% 8.% 6.% 4.% 2.%.%


13 SD Per Capita Income Real 211$, % Growth over 31 years $5, $45, $4, $35, $3, $25, $2, $15, $1, $5, $
14 SD Venture Capital Funds Resources for High Tech Jobs, M$ per Year $2,5 $2, $1,5 $1, 23Q12 $5 $ ' '2 '4 '6 '8 1 12


15 SD Housing Permits & Prices


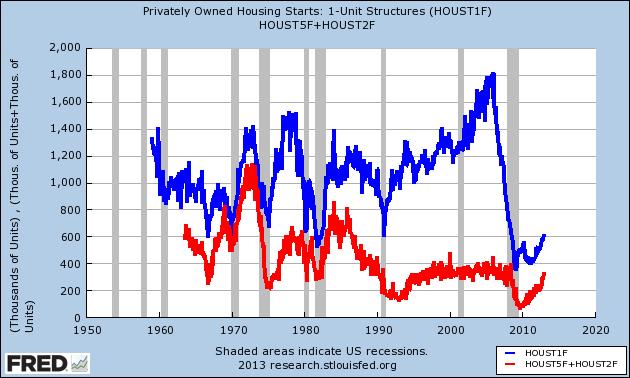
16 US Housing Starts-Gaining Mo SF Starts MF Starts


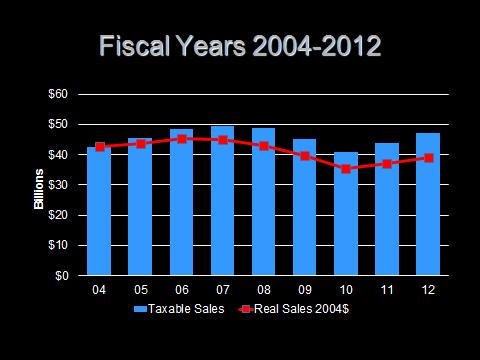
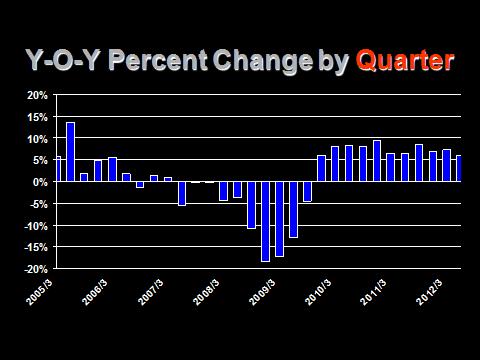
17 SD Taxable Sales


18 Trade with Mexico thru Otay Mesa $35, $3, Trade Value M$ $25, $2, $15, $1, $5, $
19 SD Population Growth-Slow & Changing Annual Change Population, Dom & Intl Migration, Employment , 7, 5, 3, 1, -1, -3, -5, -7, ' '5 1 Population Domestic Migration International Migration Employment


20 213 Outlook Summary Slow Growth, Below Trend Problem is speed not direction San Diego Job Growth 1%; U-rate 7.5% Home Price +5%; Trade with Mexico +6% Military cutbacks threaten SD
21 213 San Diego Economic Outlook 29 th Annual Economic Roundtable Marney Cox Chief Economist San Diego Association of Governments January 25, 213

22 A Housing Overview Presented by Russ Valone MarketPointe Realty Advisors
23 8 New Home Sales Trends in San Diego and Throughout the Southland Resemble a Scary Black Diamond Ski Run Socal San Diego
24 Strong Population Growth Coupled With Low Housing Production Levels Potentially Signals Development of Future Housing Shortage in San Diego 5, Population Increase Per Housing Unit 12 45, 4, 41,18 Population Growth Building Permits , 3, 25, 2, 15, 35,45 15,592 15,45 36,96 13,684 26,487 18,31 15,59 13,8 14,36 21,985 34, , , ,497 27, , 5, ,79 9, ,464 5,242 5,37 2,946 3,
25 Tougher Economic Times Have Increased the Percentage of Echo Boomers Living at Home With Their Parents; Statewide They Total 2.8 Million, of Which 258,143 Live in San Diego County 3, 12.8% 12.8% 12.8% 12.9% 14.% 25, 2, 1.6% 1.6% 11.% 1.3% 11.% 1.9% 11.7% 5, % 51,163 55,685 59,379 6,753 62, % 1.% 15, 45,642 45,523 48,51 45,61 48,142 45,478 8.% 6.% 1, 17, ,49 186, ,28 196,15 195,784 4.% 138,17 132, ,73 13,271 13, ,526 5, 2.% SD Pop Living at Home SD Pop Living at Home % SD Living at Home.%

26 Much of the Multi Family Construction is Apartments San Diego 2, 18,31 18, 16, 14, 12, 1, 8, 6, 4, 2, 15,592 15,45 13,684 6,35 6,28 4,84 9,287 9,377 8,88 8,273 9,758 15,59 6,582 9,8 14,36 6,73 7,576 9,191 4,448 4,743 7,464 4,2 3,444 5,242 5,37 5,349 3,63 2,946 1,168 3,523 1,253 TOTAL Multi-Family Single-Family 3,125 3,379 2,179 1,778 2,27 2,245 1, Permits are Through November

27 Easier Financing and Strong Demand Result Surge of New Rentals in County 14, 12, 3,317 1,967 2,928 2,793 4,22 1,469 2, ,451 1,18 1,499 1, ,98 1, 8, 6, 19, ,42 115, , ,78 114,416 19, , ,83 115, , , ,36 123,47 123,172 4, 2, Existing New Rentals Total Rentals
28 18 Competition Levels in San Diego are Down 78% From Peak in 26, While SoCal Levels Are Down 72% Socal San Diego /1 26/2 26/3 26/4 27/1 27/2 27/3 27/4 28/1 28/2 28/3 28/4 29/1 29/2 29/3 29/4 21/1 21/2 21/3 21/4 211/1 211/2 211/3 211/4 212/1 212/2 212/3 212/4


29 Months of Available Inventory in Actively Selling Projects Becoming Dangerously Low SoCal SAN DIEGO Months of Supply Socal 14 4 San Diego /3 26/4 27/1 27/2 27/3 27/4 28/1 28/2 28/3 28/4 29/1 29/2 29/3 29/4 21/1 21/2 21/3 21/4 211/1 211/2 211/3 211/4 212/1 212/2 212/3 212/4


30 Much of the Attached Shadow Inventory Has Been Converted to Rentals Los Angeles San Diego 3,5 3, 2,5 3,152 3,5 3, 2,5 3,471 2, 1,5 1, , , 1,5 1, ,812 1,15 DETACHED CONVERSION MEDIUM DENSITY ATTACHED HIGH DENSITY CONDOMINIUMS DETACHED CONVERSION MEDIUM DENSITY ATTACHED HIGH DENSITY CONDOMINIUMS Ventura Orange DETACHED CONVERSION MEDIUM DENSITY ATTACHED HIGH DENSITY CONDOMINIUMS DETACHED CONVERSION MEDIUM DENSITY ATTACHED HIGH DENSITY CONDOMINIUMS San Bernardino Riverside 6, 5, 5,13 12, 1, 11,656 4, 8, 3, 6, 2, 1, , 2, 267 2,721 DETACHED CONVERSION MEDIUM DENSITY ATTACHED HIGH DENSITY CONDOMINIUMS DETACHED CONVERSION MEDIUM DENSITY ATTACHED HIGH DENSITY CONDOMINIUMS

31 Resurgence of Detached Dominance of the San Diego New Home Market Should be Short Lived 1% % DETACHED ATTACHED 1% 9% 8% 7% 6% 73% 74% 57% 38% 35% 31% 38% 55% 49% 67% 71% 69% 5% 4% 3% 2% 1% 27% 26% 43% 62% 65% 69% 62% 45% 51% 33% 29% 31% %

32 Less Than 25% of the County s 132,553 Proposed Units are Detached Detached, 31,511, 24% Affordable, 2,353, 2% Apartments, 11,22, 8% Conversions, 22,752, 17% Attached, 64,717, 49% Proposed Activity

33 Highway 78 Corridor is Home to the Most Proposed Detached Activity Proposed Detached Activity SOUTH COUNTY, 7,759, 25% EAST COUNTY, 5,459, 17% SAN DIEGO CENTRAL, 317, 1% NORTH COUNTY COASTAL, 3,416, 11% INTERSTATE 15 CORRIDOR, 1,874, 6% HIGHWAY 78 CORRIDOR, 12,686, 4%

34 San Diego Central is Home to the Most Proposed Attached Activity Proposed Detached Activity SOUTH COUNTY, 23,937, 24% EAST COUNTY, 4,443, 4% HIGHWAY 78 CORRIDOR, 12,959, 13% INTERSTATE 15 CORRIDOR, 1,997, 11% SAN DIEGO CENTRAL, 38,368, 38% NORTH COUNTY COASTAL, 1,338, 1%


35 From an Historical Low of Just 9,81 New Home Last Year, The Southern California Marketplace Saw a 43% Increase in New Home Sales in 212 Annual New Home Sales ,898 58,813 54,312 68, ,914 43,572 46, , ,491 16,29 11,26 9,81 14,


36 Orange & San Bernardino Realized Biggest Gains in , 1, 8, 6, 4, 2, 1,635 Los Angeles 2,777 2, % 3,5 3, 2,5 2, 1,5 1, 5 VENTURA COUNTY 2,375 39% , 7, 6, 5, 4, 3, 2, 1, ORANGE COUNTY 74% 5,399 2,926 1, , 25, 2, 15, 1, 5, 27,67 RIVERSIDE COUNTY 39% 2,74 3, , 14, 12, 1, 8, 6, 4, 2, 15,492 SAN DIEGO COUNTY 35% 2,67 2, , 8, 6, 4, 2, 8,51 SAN BERNARDINO COUNTY 53% 916 1, Sales Through Q3


37 Southern California County s Market Share in 212 Virtually The Same as in 211 RIVERSIDE,,, % LOS ANGELES, 211 2,74, 28% 2,15, 22% VENTURA, 261, 3% SAN DIEGO, 2,59, 21% ORANGE, 1,678, 17% SAN BERNARDINO, 916, 9% RIVERSIDE,, 212, % 3,8, 27% LOS ANGELES, 2,777, 2% VENTURA, 364, 2% SAN DIEGO, 2,794, 2% SAN BERNARDINO, 1,43, 1% ORANGE, 2,926, 21%
38 A Strong Showing in Resale Market Activity at the End of 212 Pushed Resale Volumes up 8.8% Above Last Year 7, 6, 5, 52,759 57,852 48,456 5,794 56,43 4, 3, 2, 28,469 1,


39 A Strong Showing in Resale Market Activity at the End of 212 Pushed Resale Volumes up 8.8% Above Last Year 26,18 214,273 27, ,456 29,331 22,624 22, , , , , ,18 178,


40 While All Counties Posted Significant Gains in New Home Sales, in the Resale Sector Inland Counties Were Flat Los Angeles San Diego 8, 7, 6, 5, 4, 57,848 74,95 7,555 68,645 76, % 4, 35, 3, 25, 2, 3,477 36,115 33,671 33,47 37, % 3, 15, 2, 1, 1, 5, Ventura Orange 1, 9, 8, 7, 6, 7,874 8,77 8,12 9,38 9, % 35, 3, 25, 2, 24,488 29,592 28,587 27,369 32, % 5, 4, 15, 3, 1, 2, 5, 1, San Bernardino Riverside 35, 3, 25, 2, 22,353 33,836 29,54 27,129 27,99 -.1% 5, 45, 4, 35, 3, 35,365 45,48 39,344 37,54 36, % 15, 25, 2, 1, 15, 5, 1, 5,

41 San Diego Appears to be Working Through its Distressed Housing Stock at a Slightly Quicker Rate Than Other SoCal Counties 12, 1, 8, 6, Notices of Default Foreclosures 5,797 Foreclosures 2, 17,712 13,978 15, 13,32 1,169 1, 7,367 5,994 5, 1, , 2, 1,
42 Resale Prices Trending up in All Southern California Counties ATTACHED DETACHED $6, $56, Los Angeles $6, $538,813 San Diego $5, $4, $428,625 $46,25 $313,75 $335,25 $32,333 $334,583 $5, $4, $366,625 $43,167 $343,5 $369,167 $353,333 $368,833 $3, $2, $359,167 $33,83 $297,75 $272,667 $282, $3, $2, $255,813 $25,917 $218,75 $27,667 $227, $7, $682,5 Orange $4, $386,25 Riverside $6, $5, $4, $3, $2, $519,25 $471,167 $55,75 $48,583 $497,5 $441,813 $332,729 $281,917 $294,75 $272,917 $285, $3, $2, $1, $258,875 $299,75 $18,75 $236,833 $156,167 $195,417 $142,167 $189,917 $145,167 $23,917 $155, $7, $6, $5, $69,5 $398,625 $452,583 $393,83 $414,333 Ventura $394,286 $45,5 $4, $3, $343,875 $35,563 $22,496 San Bernardino $4, $3, $294,917 $248,83 $257,5 $235,643 $239,667 $2, $212,167 $142,5 $149,583 $148,667 $16,583 $2, $1, $129,417 $133,83 $125,25 $135,
43 San Diego Detached Resale Average up 18% From a Year Ago and Approaching $4, For the First Time Since August 28 $6, $5, $4, $399, $365, $36, $399, $3, $3, $333, $337, $2, $195, $22, $213, $25, $245, $1, $ ATTACHED DETACHED 28/1 28/3 28/5 28/7 28/9 28/11 29/1 29/3 29/5 29/7 29/9 29/11 21/1 21/3 21/5 21/7 21/9 21/11 211/1 211/3 211/5 211/7 211/9 211/11 212/1 212/3 212/5 212/7 212/9 212/11
44 New Detached Home Pricing Trends $6 $55 $5 $45 $4 $ ,741 $ $ ,639 $ $ $ ,649 2,63 $ ,577 2,52 2,623 2,557 $ $ ,5 Los Angeles $ , ,8 2,7 2,6 2,5 2,4 2,3 $9 $8 $7 $6 $5 2,8 $ $ $ ,31 3,6 $ $ ,799 3,25 San Diego 3,74 $ ,996 2,845 $ $ ,725 $ ,855 $ ,1 3, 2,9 2,8 2,7 2,6 $1,5 $1,3 $1,1 $9 $7 $5 2,755 $ $1, ,989 $1, ,83 $1, ,295 Orange $1, ,27 2,967 $1,.723 2,782 $ ,569 $87.54 $ $ ,483 2, ,5 3,3 3,1 2,9 2,7 2,5 2,3 $55 $5 $45 $4 $35 $3 $25 2,419 $3.891 $ $ ,557 2,413 2,644 2,664 $ $ San Bernardino 2,67 2,482 2,392 $ $ $ ,559 $ ,524 $ ,7 2,6 2,5 2,4 2,3 $1, $9 $8 $7 $6 $5 $4 2,99 2,99 2,955 $ ,919 2,928 2,842 2,869 $ ,969 $859.1 $ $7.19 2,661 $ Ventura $ $ $ ,454 $ ,1 2,9 2,7 2,5 2,3 $55 $ ,797 $5 $ ,743 $ $45 $ ,713 2,583 $4 2,683 $ ,488 $35 2,452 $ ,468 2,57 $3 Riverside 2,434 $ $ $ $ $ ,9 2,8 2,7 2,6 2,5 2,4 2,3
45 San Diego County New Home Pricing Trends $8 3,18 2,985 3,5 3, $ ,922 2,95 $7 $ ,9 $6 $ ,815 2,858 2,847 2,833 2,822 $ $ Detached $ $ $629.4 $ $6.17 2,745 2,721 2,729 $ $ ,72 $ ,76 2,85 2,8 2,75 2,7 2,65 $5 29/4 21/1 21/2 21/3 21/4 211/1 211/2 211/3 211/4 212/1 212/2 212/3 212/4 2,6
46 San Diego County New Attached Home Pricing Trends $6 $ $ ,545 1,52 1,6 $5 $ ,39 $ ,452 1,451 1,43 $ $ ,375 1,459 1,455 1,478 1,496 1,5 1,4 $ ,338 $ ,3 $4 1,199 $ $ ,2 Attached $ $ $ ,1 $3 29/4 21/1 21/2 21/3 21/4 211/1 211/2 211/3 211/4 212/1 212/2 212/3 212/4 1,
47 Countywide Rental Rate Averages Have Soared to New Highs $1, $1, $1,358 $1, $1, $1, $1,323 $1, $1,31 $1,314 $1, $1,3 28/Mar 28/Sep 29/Mar 29/Sep 21/Mar 21/Sep 211/Mar 211/Sep 212/Mar 212/Sep 8
48 Vacancy Rates 5.3% 4.4% 4.7% 4.2% 5.1% 4.5% 4.4% 4.5% 6.% 5.% 3.6% 4.% 3.% 2.2% 2.% 1.%.%
49 Vacancy Rates 1.8%.6% 1.5% 1.4% 2.6% 1.4% 4.% 2.1% 2.7% 2.5% 3.2% 2.2% 3.% 1.8% 4.5% 2.6% 3.6% 2.2% 5.3% 4.4% 4.7% 4.2% 5.1% 4.5% 4.4% 4.5% 2/Mar 2/Sep 21/Mar 21/Sep 22/Mar 22/Sep 23/Mar 23/Sep 24/Mar 24/Sep 25/Mar 25/Sep 26/Mar 26/Sep 27/Mar 27/Sep 28/Mar 28/Sep 29/Mar 29/Sep 21/Mar 21/Sep 211/Mar 211/Sep 212/Mar 212/Sep.% 1.% 2.% 3.% 4.% 5.% 6.%
50 Summary The housing recovery is here, but it depends on continued consumer confidence to be fully realized. Prices are rising making it possible to more people to get their heads above water. Foreclosures are down and having less impact on prices. New and resale supplies are constrained. 4,1 Resales and 2,2 New Home Inventory. New home prices are anticipated to see at least a modest spike as new publically homebuilder product hits the market. As the credit market eases for condominium construction fewer large scale apartment projects will be built as apartment buyers will not be able to compete with condo buyers for the scarce land resources.

51 San Diego s Job Base is Showing Significant Signs of Improving; After Losing 84,325 Jobs Between 28 and 21, San Diego s Generated Nearly 19, New Jobs in 212, However, Future Job Growth Will Hard Pressed to Match the Past 6, 55,6 5,5 51,183 4, 2, 21,75 18,883 7, , -4, -6, -8,
Real gross domestic product California vs. United States
 Real gross domestic product California vs. United States Percent change, year ago 6 4 U.S. California 2 0-2 -4-6 2001 2002 2003 2004 2005 2006 2007 2008 2009 2010 2011 Source: Bureau of Economic Analysis.
CALIFORNIA ECONOMIC & MARKET OUTLOOK. October 29,2014 Contra Costa Association of REALTORS Leslie Appleton Young, Chief Economist
 2014 2015 CALIFORNIA ECONOMIC & MARKET OUTLOOK October 29,2014 Contra Costa Association of REALTORS Leslie Appleton Young, Chief Economist OVERVIEW Economic Outlook California Housing Market Outlook Housing
Economic and Housing Market Outlook ( ) October 31, Contra Costa AOR
 October 31, Contra Costa AOR") Economic and Housing Market Outlook (2012 2013) Contra Costa AOR October 31, 2012 Oscar Wei Senior Research Analyst California Association of REALTORS Overview US and California Economies California Housing
Economic and Housing Market Outlook (2012 2013) Contra Costa AOR October 31, 2012 Oscar Wei Senior Research Analyst California Association of REALTORS Overview US and California Economies California Housing
INLAND EMPIRE REGIONAL INTELLIGENCE REPORT
 INLAND EMPIRE REGIONAL INTELLIGENCE REPORT June 2016 EMPLOYMENT After a slow start to 2016, the Inland Empire s labor market returned to form, in recent job figures. Seasonally adjusted nonfarm employment
2008 Midyear Housing Forecast
 2008 Midyear Housing Forecast June 25, 2008 By Alan N. Nevin Chief Economist California Building Industry Association Executive Summary: Housing Production Falling Short of Earlier Forecasts Due to the
2019 Housing Market Forecast. Palos Verdes Peninsula AOR January 8, 2019 Jordan G. Levine Senior Economist
 2019 Housing Market Forecast Palos Verdes Peninsula AOR January 8, 2019 Jordan G. Levine Senior Economist Overview Good News: Economic fundamentals solid Homeownership still the dream Rates might not go
2018 Housing Market Outlook. Central Coast Realty Group Business Symposium February 22, 2018 Oscar Wei Senior Economist
 2018 Housing Market Outlook Central Coast Realty Group Business Symposium February 22, 2018 Oscar Wei Senior Economist Overview Economic Update California Housing Market Outlook Regional Housing Market
INLAND EMPIRE REGIONAL INTELLIGENCE REPORT. School of Business. April 2018
 INLAND EMPIRE REGIONAL INTELLIGENCE REPORT April 2018 Key economic indicators suggest that the Inland Empire s economy will continue to expand throughout the rest of 2018, building upon its recent growth.
2013 Housing Market Forecast. SILVAR: Los Gatos/Saratoga District October 10, 2012 Leslie Appleton-Young, Vice President & Chief Economist
 2013 Housing Market Forecast SILVAR: Los Gatos/Saratoga District October 10, 2012 Leslie Appleton-Young, Vice President & Chief Economist What we saw from the roof.. C.A.R. NAR THE ECONOMY Recent Housing
REAL ESTATE AND THE ECONOMIC OUTLOOK THROUGH 2013:
 1 1 REAL ESTATE AND THE ECONOMIC OUTLOOK THROUGH 2013: Coping With A Different Kind Of Housing Recovery A Presentation To The Commercial Real Estate Education Summit Monrovia, California July 13, 2012
San Diego County Vol. XX, Issue I Rental Trends Executive Summary March 2007
 Real Estate Research and Consulting for over 25 years Vol. XX, Issue I Rental Trends Executive Summary Editor: Robert D. Martinez- Director of Research s institutional grade rental complexes experienced
Housing Price Forecasts. Illinois and Chicago PMSA, June 2012
 Housing Price Forecasts Illinois and Chicago PMSA, June 2012 Presented To Illinois Association of REALTORS From R E A L Regional Economics Applications Laboratory, Institute of Government and Public Affairs
California Housing Market Update. Monthly Sales and Price Statistics November 2018
 California Housing Market Update Monthly Sales and Price Statistics November 2018 Home Sales: Largest Decline Since 2014 California, November 2018 Sales: 381,400 Units, -4.6% YTD, -13.4% YTY 700,000 600,000
California Housing Market Update. Monthly Sales and Price Statistics December 2018
 California Housing Market Update Monthly Sales and Price Statistics December 2018 Sales Reached the Lowest Level since Jan 2015 California, December 2018 Sales: 372,260 Units, -5.2% YTD, -11.6% YTY 700,000
California Housing Market Update. Monthly Sales and Price Statistics October 2018
 California Housing Market Update Monthly Sales and Price Statistics October 2018 Sales Had the 2 nd Largest Drop in the Last 6 Months California, October 2018 Sales: 397,060 Units, -3.7% YTD, -7.9% YTY
California Housing Market Update. Monthly Sales and Price Statistics September 2018
 California Housing Market Update Monthly Sales and Price Statistics September 2018 Sales Had the Largest Decline since March 2014 California, September 2018 Sales: 382,550 Units, -3.3% YTD, -12.4% YTY
AAug ugust 2017
 August 17 17 Housing recovery a balancing act Growth in new listings outpaced sales preventing inventory declines City of Calgary, September 1, 17 Sales posted a modest gain in August, but a rise in new
CALIFORNIA ECONOMIC & MARKET OUTLOOK. October 29,2014 SILVAR Leslie Appleton-Young, Chief Economist
 2014-2015 CALIFORNIA ECONOMIC & MARKET OUTLOOK October 29,2014 SILVAR Leslie Appleton-Young, Chief Economist OVERVIEW Economic Outlook California Housing Market Outlook Housing Affordability Regional Market
QUARTERLY ECONOMIC REPORT. July 2018 QUARTERLY ECONOMIC REPORT 1 INLAND EMPIRE. In July 2018, there is a great deal of change in the forces impacting
 INLAND EMPIRE QUARTERLY ECONOMIC REPORT RIVERSIDE & SAN BERNARDINO COUNTIES, CALIFORNIA VOL. 30 NO. 3 JULY 2018 $5.00 INLAND EMPIRE QUARTERLY ECONOMIC REPORT MID-YEAR LOOK AT INLAND EMPIRE ECONOMIC DRIVERS
MULTIFAMILY 2012 MULTI-FAMILY HAMPTON ROADS MARKET REVIEW. Author. Data Analysis. Financial Support. Disclosure. Charles Dalton.
 HAMPTON ROADS MARKET REVIEW MULTIFAMILY Author Data Analysis Financial Support Disclosure Charles Dalton Real Data The E. V. Williams Center for Real Estate and Economic Development (CREED) functions and
Patience required in Calgary's housing market recovery Jul. 2018
 July 18 MONTHLY STATISTICS PACKAGE City of Calgary Patience required in Calgary's housing market recovery 18 City of Calgary, August 1, 18 Recent struggles in the job market, accompanied by yet another
Ventura County. Economic Profile. November 2008
 Ventura County Economic Profile November 2008 The copyright laws of the United States (Title 17 U.S. Code) forbid the unauthorized reproduction of this report by any means, including facsimile or computerized
THE OUTLOOK FOR HOUSING IN ILLINOIS
 THE OUTLOOK FOR HOUSING IN ILLINOIS Jonathan Smoke Chief Economist January 25, 2017 NATIONAL TRENDS 2 2000.01 2000.05 2000.09 2001.01 2001.05 2001.09 2002.01 2002.05 2002.09 2003.01 2003.05 2003.09 2004.01
Provided by Keller Williams Realty Professional Partners Statistics from September 2010 MLS
 Monthly Market Watch for Maricopa County An overview of what is happening in the Maricopa County real estate market (using September 2010 statistics) Report overview: This report includes MLS data for
UDIA WA PROPERTY MARKET STATISTICS
 UDIA WA PROPERTY MARKET STATISTICS OCTOBER 217 1 IN THIS ISSUE KEY TRENDS INDUSTRY UPDATE 3 4 ECONOMY RESIDENTIAL LAND DEVELOPMENT RESIDENTIAL PROPERTY SETTLEMENTS RESIDENTIAL PROPERTY MARKET RESIDENTIAL
MARKET OUTLOOK FOR SAN MATEO
 MARKET OUTLOOK FOR SAN MATEO Jonathan Smoke Chief Economist August 2, 2016 NATIONAL TRENDS 2 JOB CREATION REBOUNDED IN JUNE 229,000 jobs created by month in 2015; 172,000 average this year Employment and
Housing Bulletin Monthly Report
 February 21 1 Housing Bulletin Monthly Report Housing Starts 25, 2, 15, 1, 5, Alberta Housing Starts up 5 per cent from 29 From February 29 to 21, preliminary housing starts increased 82.7 per cent across
2016 ECONOMIC AND HOUSING MARKET FORECAST
 2016 ECONOMIC AND HOUSING MARKET FORECAST April 06, 2016 San Francisco Association of REALTORS Oscar Wei, Senior Economist of C.A.R. OVERVIEW Economic Outlook California Housing Market Outlook Regional
2013 CALIFORNIA HOUSING MARKET OUTLOOK. Santa Barbara AOR February 6, Leslie Appleton-Young, C.A.R. Chief Economist
 2013 CALIFORNIA HOUSING MARKET OUTLOOK Santa Barbara AOR February 6, 2013. Leslie Appleton-Young, C.A.R. Chief Economist 2013 New Member Benefit: 12 FREE Hours Online CE Courses C.A.R. s newest member
O O ct ct ober 2017
 October Status Quo for Calgary's Housing Market Prices remain similar to last year, but ease in October., November 1, 17 October s housing market conditions closely echoed previous month s trends with
Housing Bulletin Monthly Report
 August 21 Housing Bulletin Monthly Report 1 C a n a da s P r e li m i n a ry H o u s i n g S ta r t s s l i p i n J u ly Preliminary Housing St arts in Albert a* and Canada* July 28 to July 21 25, Canada
Housing Price Forecasts. Illinois and Chicago PMSA, July 2016
 Housing Price Forecasts Illinois and Chicago PMSA, July 2016 Presented To Illinois Association of Realtors From R E A L Regional Economics Applications Laboratory, Institute of Government and Public Affairs
Economic Highlights. Payroll Employment Growth by State 1. Durable Goods 2. The Conference Board Consumer Confidence Index 3
 August 26, 2009 Economic Highlights Southeastern Employment Payroll Employment Growth by State 1 Manufacturing Durable Goods 2 Consumer Spending The Conference Board Consumer Confidence Index 3 Real Estate
Oversupply persists despite improved sales activity for affordable product Mar. 2019
 March 19 MONTHLY STATISTICS PACKAGE Oversupply persists despite improved sales activity for affordable product 19, April 1, 19 March saw a modest decline in city wide sales activity compared to last year.
REAL ESTATE MARKET REVIEW
 MULTIFAMILY 2014 HAMPTON ROADS REAL ESTATE MARKET REVIEW Author Charles Dalton Data Analysis Real Data Financial Support The E.V. Williams Center for Real Estate and Economic Development (CREED) functions
ECONOMIC CURRENTS. Vol. 3, Issue 1. THE SOUTH FLORIDA ECONOMIC QUARTERLY Introduction
 ECONOMIC CURRENTS THE SOUTH FLORIDA ECONOMIC QUARTERLY Introduction Economic Currents provides an overview of the South Florida regional economy. The report contains current employment, economic and real
California Housing Market Update. Monthly Sales and Price Statistics August 2018
 California Housing Market Update Monthly Sales and Price Statistics August 2018 Sales Declined for the 4 th Consecutive Month California, August 2018 Sales: 399,600 Units, -2.1% YTD, -6.6% YTY 700,000
Monthly Market Watch for the Prescott Quad City Area. Provided by Keller Williams Check Realty Statistics from August 2012 Prescott MLS
 August 2012 Monthly Market Watch for the Prescott Quad City Area Provided by Keller Williams Check Realty Statistics from August 2012 Prescott MLS Report Overview: This report includes MLS data for the
OVERVIEW OF RECENT/EXPECTED ECONOMIC/ HOUSING MARKET CONDITIONS
 OVERVIEW OF RECENT/EXPECTED ECONOMIC/ HOUSING MARKET CONDITIONS STRONG ECONOMIC FUNDAMENTALS *BUT* EXTRAORDINARY SHORT-TERM FACTORS RESULTING IN MAJOR SHIFTS IN TYPES OF HOUSING PRODUCTS AND GEOGRAPHICAL
Sep September 2018
 18 September 18 MONTHLY STATISTICS PACKAGE City of Calgary Persistent buyers market continues 18 City of Calgary, October 1, 18 With no change in the economic climate, Calgary s sales activity totaled
UDIA WA PROPERTY MARKET STATISTICS
 UDIA WA PROPERTY MARKET STATISTICS AUGUST 217 1 What s new in strata? Learn how community title schemes and leasehold strata are changing the strata game. Visit landgate.wa.gov.au/strata-reform Subscribe
California Housing Market Update. Monthly Sales and Price Statistics May 2018
 California Housing Market Update Monthly Sales and Price Statistics May 2018 Sales Lost Momentum as Mortgage Rates Continued to Climb California, May 2018 Sales: 409,270 Units, +0.3% YTD, -4.6% YTY 700,000
Outlook for Median Home Selling Prices. United States data are useless for us.
 Outlook for Median Home Selling Prices Outline United States Data Unobserved Prices The Future of California s Median Home Price Bill Watkins August 28, 28 2.% Existing Single-family Housing Sales percent
Annual Report on the Charleston Area Housing Market FOR RESIDENTIAL REAL ESTATE ACTIVITY FROM THE CHARLESTON TRIDENT ASSOCIATION OF REALTORS MLS
 Annual Report on the Charleston Area Housing Market FOR RESIDENTIAL REAL ESTATE ACTIVITY FROM THE CHARLESTON TRIDENT ASSOCIATION OF REALTORS MLS FOR RESIDENTIAL REAL ESTATE ACTIVITY FROM THE CHARLESTON
Metropolitan Area Statistics
 Metropolitan Area Statistics Apartment Completions 1Q 2011 1Q 2012 % Chg Atlanta - - n/a Boston 133 39-71% Chicago - 20 n/a Cleveland - - n/a Columbus - 272 n/a Dallas-Ft. Worth 604 1,059 75% Denver 328
1200 Premier Drive, Suite 140 Chattanooga, TN Each office is independently owned and operated.
 THIS MONTH IN REAL ESTATE K im aulston R REALTOR 1200 Premier Drive, Suite 140 Chattanooga, TN 37421 Each office is independently owned and operated. Cell: 423-316-4022 Office: 423-664-1600 Email: kcraulston@gmail.com
San Francisco Housing Market Update
 San Francisco Housing Market Update California Economic and Housing Market Outlook The national economy maintained a healthy growth rate in the first quarter of 2005 and appeared to be settling in for
SFR Condo Residential Lot Sales Inventory Sales Inventory Sales Inventory. Month YTD Month Month YTD Month Month YTD Month
 Grand Strand Market Report 2017 capped off a great year for the Grand Strand as full year SFR sales volume and median sales price were up 9.8% and 4.3%, respectively. Condo sales activity increased 3.0%
Southern California Appraisal Institute Market Trends Seminar
 Southern California Appraisal Institute Market Trends Seminar February 1, 2018 1 #1 residential data provider Largest US geographic footprint including 890 CBSAs 2,483 Counties Metrostudy survey markets
2017 RESIDENTIAL REAL ESTATE MARKET REPORT
 2017 RESIDENTIAL REAL ESTATE MARKET REPORT Published January 26, 2018 Our market reports have been focused on the effects of low inventory on our housing market and for good reason. December 2017 marked
Housing Price Forecasts. Illinois and Chicago PMSA, May 2018
 Housing Price Forecasts Illinois and Chicago PMSA, May 2018 Presented To Illinois Realtors From R E A L Regional Economics Applications Laboratory, Institute of Government and Public Affairs University
New year kicks off with slow sales Jan. 2019
 January 19 19 MONTHLY STATISTICS PACKAGE New year kicks off with slow sales 19, February 1, 19 As economic challenges linger into 19, housing markets remain on a sluggish pace. January sales totalled 8
Housing Price Forecasts. Illinois and Chicago PMSA, December 2015
 Housing Price Forecasts Illinois and Chicago PMSA, December 2015 Presented To Illinois Association of Realtors From R E A L Regional Economics Applications Laboratory, Institute of Government and Public
Aug. Aug 2018 ust 2018
 August 18 MONTHLY STATISTICS PACKAGE City of Calgary Unemployment rate slows housing market recovery 18 City of Calgary, September, 18 Easing sales, gains in new listings and elevated inventory levels
Pikes Peak area housing Market Statistics (As of: 2/28/2018)
") Jan-1-1 -1-1 Jan-2-2 -2-2 Jan-3-3 -3-3 -4-4 -4-5 -5-5 -6-6 -6-7 -7-7 -8-8 -8-9 -9-9 -1-1 -1-11 -11-11 -12-12 -12-13 -13-13 -14-14 -14-15 -15-15 -16-16 -16-17 -17-17 Jan-1-1 -1-1 Jan-2-2 -2-2 Jan-3-3 -3-3
Jan-1-1 -1-1 Jan-2-2 -2-2 Jan-3-3 -3-3 -4-4 -4-5 -5-5 -6-6 -6-7 -7-7 -8-8 -8-9 -9-9 -1-1 -1-11 -11-11 -12-12 -12-13 -13-13 -14-14 -14-15 -15-15 -16-16 -16-17 -17-17 Jan-1-1 -1-1 Jan-2-2 -2-2 Jan-3-3 -3-3
August 2017 Loudoun County Market Trends Report Sales Price Reaches Record High; Sales Decline; Inventory Remains Low
 FOR IMMEDIATE RELEASE Contact: Christine Windle 703 777 2468 Dulles Area Association of REALTORS cwindle@dullesarea.com August 2017 Loudoun County Market Trends Report Sales Price Reaches Record High;
MARKET STRATEGY VIEWPOINT U.S. Housing Decelerating
 Jan-01 Oct-01 Jul-02 Apr-03 Jan-0 Oct-0 Jul-05 Apr-0 Jan-07 Oct-07 Jul-08 Apr-09 Jan-10 Oct-10 Jul-11 Apr-12 Jan-13 Oct-13 Jul-1 Apr-15 Jan-1 Oct-1 Jul-17 Apr-18 U.S. Housing Decelerating August 27, 2018
Housing Price Forecasts. Illinois and Chicago PMSA, October 2014
 Housing Price Forecasts Illinois and Chicago PMSA, October 2014 Presented To Illinois Association of Realtors From R E A L Regional Economics Applications Laboratory, Institute of Government and Public
Minneapolis St. Paul Residential Real Estate Index
 University of St. Thomas Minneapolis St. Paul Residential Real Estate Index September 2017 Welcome to the latest edition of the UST Minneapolis St. Paul Residential Real Estate Index. The University of
CONTENTS. Executive Summary 1. Southern Nevada Economic Situation 2 Household Sector 5 Tourism & Hospitality Industry
 CONTENTS Executive Summary 1 Southern Nevada Economic Situation 2 Household Sector 5 Tourism & Hospitality Industry Residential Trends 7 Existing Home Sales 11 Property Management Market 12 Foreclosure
MONTHLY STATISTICS PACKAGE. City of Calgary. May creb.com
 MONTHLY STATISTICS PACKAGE City of Calgary May 1 creb.com Housing supply swells in cool spring market MONTHLY STATISTICS PACKAGE City of Calgary May 1 City of Calgary, June 1, 1 Calgary s housing inventory
Leslie Appleton-Young Chief Economist & Vice President
 Leslie Appleton-Young Chief Economist & Vice President 2017 Forecast Report Card 2016 Actual 2017 Forecast 2017 Projected SFH Resales (000s) 416.7 413.0 421.9 % Change 1.8% 1.4% 1.3% Median Price ($000s)
Pikes Peak area housing Market Statistics (As of: 9/30/2018)
") $156,25 $184, $174,697 $177,2 $21,53 $185,83 $173, $178,29 $172,25 $212,75 $21,95 $226,692 $197,5 $199, $196, $28, $25, $223,95 $216,75 $29,527 $234,9 $218,82 $229,74 $235,518 $231,457 $255, $259,11 $269,98
$156,25 $184, $174,697 $177,2 $21,53 $185,83 $173, $178,29 $172,25 $212,75 $21,95 $226,692 $197,5 $199, $196, $28, $25, $223,95 $216,75 $29,527 $234,9 $218,82 $229,74 $235,518 $231,457 $255, $259,11 $269,98
UDIA WA PROPERTY MARKET STATISTICS
 UDIA WA PROPERTY MARKET STATISTICS FEBRUARY 218 1 IN THIS ISSUE KEY TRENDS INDUSTRY UPDATE 3 4 ECONOMY RESIDENTIAL LAND DEVELOPMENT RESIDENTIAL PROPERTY SETTLEMENTS RESIDENTIAL PROPERTY MARKET RESIDENTIAL
Orange County Office Market Continues A Positive Stride Into 2016
 OFFICE ORANGE COUNTY MARKET REPORT Continues A Positive Stride Into 2016 MARKET OVERVIEW MARKET INDICATORS - VACANCY 12.8% NET ABSORPTION 143,900 CONSTRUCTION 594,300 RENTAL RATE $2.31 P FSG UNEMPLOYMENT
Monthly Market Watch for Maricopa County An overview of what is happening in the Maricopa County real estate market
 Monthly Market Watch for Maricopa County An overview of what is happening in the Maricopa County real estate market Provided by Susan Kraemer of Prudential Arizona Properties Report overview: This report
Weak sales persist in Calgary and beyond Jun. 2018
 June 218 MONTHLY STATISTICS PACKAGE City of Calgary Weak sales persist in Calgary and beyond 218 City of Calgary, July 3, 218 Many Canadian energyrelated municipalities within Alberta and Saskatchewan
MLS of Greater Cincinnati - Charts for the Month: November 2017
 MLS of Greater Cincinnati - Charts for the Month: November 2017 The following charts provide an overview of what has occurred in the MLS over the past month. Each chart provides a historical trend. The
September bounce in house price sentiment
 Knight Frank/Markit House Price Sentiment Index (HPSI) SEPTEMBER 2012 September bounce in house price sentiment Key headlines for September UK households perceive that the value of their home declined
MONTHS OF SUPPLY AND PRICE CHANGES. Home improvement November marks a rise in sales. MONTHLY STATISTICS PACKAGE City of Calgary. Nov.
 November 17 17 Home improvement November marks a rise in sales. City of Calgary, December 1, 17 The November housing market was spurred by a rise in sales, particularly in the lower price ranges. Sales
Released: June 7, 2010
 Released: June 7, 2010 Commentary 2 The Numbers That Drive Real Estate 3 Recent Government Action 9 Topics for Home Buyers, Sellers, and Owners 11 Brought to you by: KW Research Commentary The housing
Market Trends and Outlook
 Residential Remodeling Market Trends and Outlook Kermit Baker Remodeling Futures Conference April 3, 2012 Remodeling Market Overview 1. Home improvement spending totaled an estimated $290 billion last
FY General Revenue Forecast Presentation
 FY 2015-2019 General Revenue Forecast Presentation Steven A. Solomon Director of Finance February 18, 2014 Overview Current Economic Outlook National State Local FY 2014 2nd Quarter Revenue Update Five
Orange County AOR October 21, 2016 Leslie Appleton-Young Chief Economist & Vice President
 Orange County AOR October 21, 2016 Leslie Appleton-Young Chief Economist & Vice President lesliea@car.org Cadence of Accountability How did I do with last year s forecast? 2016 Story US economic and job
Contra Costa AOR October 26, 2016 Leslie Appleton-Young Chief Economist & Vice President
 Contra Costa AOR October 26, 2016 Leslie Appleton-Young Chief Economist & Vice President lesliea@car.org Cadence of Accountability How did I do with last year s forecast? 2016 Story US economic and job
CONTENTS. Executive Summary. Southern Nevada Economic Situation 1 Household Sector 4 Tourism & Hospitality Industry
 CONTENTS Executive Summary Southern Nevada Economic Situation 1 Household Sector 4 Tourism & Hospitality Industry Residential Trends 6 Existing Home Sales 10 Property Management Market 11 Foreclosure Situation
Housing Bulletin Monthly Report
 January 21 1 Housing Bulletin Monthly Report Most new homes built in second half of 29 25, 2, 15, 1, 5, Dec 7 Jan 8 Feb 8 mar 8 apr 8 Alberta s 29 housing starts increased 72.8 per cent over 28, suggesting
May 2013 April 2013 May 2012 Manhattan Condo Index 2,106 2, % 1, %
 Market Report NOTICE: StreetEasy is pleased to present our 2013 Q2 Quarterly Report on the residential market. This preview version of the report is based on over 1,000 broker sources and will provide
UDIA WA PROPERTY MARKET STATISTICS
 UDIA WA PROPERTY MARKET STATISTICS JUNE 218 1 IN THIS ISSUE KEY TRENDS INDUSTRY UPDATE ECONOMY RESIDENTIAL LAND DEVELOPMENT RESIDENTIAL PROPERTY SETTLEMENTS RESIDENTIAL PROPERTY MARKET RESIDENTIAL CONSTRUCTION
Housing Bulletin Monthly Report
 February 211 1 Housing Bulletin Monthly Report Alberta s preliminary housing starts declined in January 211 Canada Housing Starts 25, 2, 15, 1, 5, DEC 8 JAN 9 Preliminary Housing Starts in Alberta* and
Monthly Indicators + 4.8% - 3.5% %
 Monthly Indicators 2015 New Listings were up 45.0 percent for single family/duplex homes but decreased 44.1 percent for townhouse-condo properties. Pending Sales increased 14.3 percent for single family/duplex
San Francisco Bay Area to Marin, San Francisco, and San Mateo Counties Housing and Economic Outlook
 San Francisco Bay Area to 019 Marin, San Francisco, and San Mateo Counties Housing and Economic Outlook Bay Area Economic Forecast Summary Presented by Pacific Union International, Inc. and John Burns
The State of Residential Real Estate A Macro to Micro Perspective
 The State of Residential Real Estate A Macro to Micro Perspective Ralph B McLaughlin, PhD Chief Economist @TruliaRalph Zillow 1 Group, Inc. All rights reserved 2 3 Rental Demand Is High, and Inventory
Ontario Rental Market Study Results: Measuring the Supply Gap / Renovation Investment and the Role of Vacancy Decontrol
 Ontario Rental Market Study Results: Measuring the Supply Gap / Renovation Investment and the Role of Vacancy Decontrol AGENDA Measuring the Supply Gap Estimating Current Rental Demand in Ontario Drivers
A A p p r ril 2017
 April 17 17 Housing market retains momentum in April Citywide prices hold steady as labour market improves City of Calgary, May 1, 17 Calgary s housing market continued to show signs of stability in April.
Rapid recovery from the Great Recession, buoyed
 Game of Homes The Supply-Demand Struggle Laila Assanie, Sarah Greer, and Luis B. Torres October 4, 2016 Publication 2143 Rapid recovery from the Great Recession, buoyed by the shale oil boom, has fueled
Residential Real Estate Market Report
 Residential Real Estate Market Report Second Quarter 211 CONTRIBUTORS Content: Norm Miller, PhD Charles Tu, PhD Louis Galuppo, Esq. Editorial: Jeryldine Saville, MA Design: Diane Gustafson MARKET SUMMARY
Housing Price Forecasts. Illinois and Chicago PMSA, April 2013
 Housing Price Forecasts Illinois and Chicago PMSA, April 2013 Presented To Illinois Association of Realtors From R E A L Regional Economics Applications Laboratory, Institute of Government and Public Affairs
Released: June Commentary 2. The Numbers That Drive Real Estate 3. Recent Government Action 9. Topics for Home Buyers, Sellers, and Owners 11
 Released: June 2011 Commentary 2 The Numbers That Drive Real Estate 3 Recent Government Action 9 Topics for Home Buyers, Sellers, and Owners 11 Brought to you by: KW Research Commentary The U.S. housing
Dec December 2018
 December MONTHLY STATISTICS PACKAGE Job market weakness and lending restrictions a common thread in s housing market, January, 19 As oversupply continues in Calgary s housing market, December prices eased
RESIDENTIAL REVIEW. Better Technology Better Marketing BETTER RESEARCH Better Education Better Support
 RESIDENTIAL REVIEW Better Technology Better Marketing BETTER RESEARCH Better Education Better Support TABLE OF CONTENTS 3 Residential Resale Overview 4 Residential Investment Research 5 Better Technology
Housing market feels the chill as oversupply continues Feb. 2019
 February 19 19 MONTHLY STATISTICS PACKAGE Housing market feels the chill as oversupply continues 19, March 1, 19 The effects of Calgary s economic climate continue to create weak sales activity and elevated
S Sep eptember 2016
 September Detached prices stabilize in soft market, October, The segment of Calgary s housing market with the greatest influence on the overall market is showing signs of pricing stability. The detached
Monthly Indicators + 7.3% + 6.6% + 8.3% Single-Family Market Overview Condo Market Overview New Listings Pending Sales.
 Monthly Indicators 2018 The three most prominent national market trends for residential real estate are the ongoing lack of abundant inventory, the steadily upward movement of home prices and year-over-year
Phoenix, Central and Northern Arizona
 Phoenix, Central and Northern Arizona End of Year Housing Report 1-8-354-5664 LongRealty.com 217 End of Year Housing Report SALES & INVENTORY Housing market trends For the overall real estate market in
Housing Price Forecasts. Illinois and Chicago PMSA, March 2019
 Housing Price Forecasts Illinois and Chicago PMSA, March 2019 Presented To Illinois Realtors From R E A L Regional Economics Applications Laboratory, Institute of Government and Public Affairs University
UDIA WA PROPERTY MARKET STATISTICS
 UDIA WA PROPERTY MARKET STATISTICS APRIL 218 1 IN THIS ISSUE KEY TRENDS INDUSTRY UPDATE ECONOMY RESIDENTIAL LAND DEVELOPMENT RESIDENTIAL PROPERTY SETTLEMENTS RESIDENTIAL PROPERTY MARKET RESIDENTIAL CONSTRUCTION
Update of U.S. Residential Real Estate Trends: Including economic data, current sales, new construction,
 THE WRIGHT REPORT Update of U.S. Residential Real Estate Trends: Including economic data, current sales, new construction, interest rates, new construction, and foreclosures. January to June, 2017 www.thewrightinsight.net
MARCH 2019 Harrisonburg & Rockingham County Real Estate Market Report
 MARCH 219 Real Estate Market Report An analysis of real estate activity through February 28, 219 provided courtesy of Scott P. Rogers, Funkhouser Real Estate Group Spacious Four Bedroom Brick Colonial
Welcome to the Fall 2018 Breakfast Seminar
 Welcome to the Fall 2018 Breakfast Seminar Richmond Hill Country Club June 7, 2017 Presented by: MCAP Development Finance Group AGENDA GTA Condo Market Outlook Presented by: Shaun Hildebrand, President,