AUSTIN MULTIFAMILY REPORT THIRD QUARTER 2017
|
|
|
- Lily Stevens
- 6 years ago
- Views:
Transcription
1 MULTIFAMILY REPORT THIRD QUARTER 2017 MARKET AT A GLANCE OCCUPANCY RATE 91.7% Down 40 bps since 3Q16 EFFECTIVE RENT Up 0.7% since 3Q16 $ 1,195 OCCUPANCY AND RENT TRENDS ROBUST RENTAL DEMAND DRIVES OCCUPANCY UP TO 91.7% Demand for apartments drove occupancy up in the Austin metropolitan area. Renters newly occupied 2,243 net units during the third quarter. Rental demand exceeded the 1,272 deliveries during the third quarter to push occupancy up 50 basis points since mid At 91.7% in the third quarter of 2017, the occupancy rate was on par with the fiveyear average. While occupancy rose from the second quarter to the third quarter, effective rent held $1,195 per month. The quarterly supply-demand trend mirrored the rental environment all year as Austin in one of the fastest-growing cities in America. The latest leasing activity was part of 6,174 units absorbed year to date. The 5,828 units that came online since the start of 2017 trailed leasing activity to cause average apartment occupancy to elevate 40 basis points since December. At the same time, effective rent advanced 2.3%. Developers worked to meet the demand with 38 communities under construction by the end of the third quarter, which will bring 9,269 units online in the upcoming years. 94% OCCUPANCY AND RENT TRENDS $1,400 92% $1,200 90% $1,000 88% 4Q12 2Q13 4Q13 2Q14 4Q14 2Q15 4Q15 2Q16 4Q16 2Q17 $800 Occupancy Rate Effective Rent a Berkshire Hathaway and Leucadia National company
2 MULTIFAMILY REPORT DELIVERIES AND DEMAND DELIVERIES 5,828 Units YTD 12,000 9,000 6,000 DELIVERIES AND DEMAND NET ABSORPTION 6,174 Units YTD 3, * *Year to date Deliveries Demand ECONOMIC TRENDS 2016 UNEMPLOYMENT* BPS 3.3% 1.00m 33.3k $ 287.2k 1.63% 3.1% 2016 EMPLOYMENT* % 2016 EXISTING SFH SALES** % 2016 MEDIAN SFH PRICE** % 1.02m 38.9k YEAR TREASURY** BPS $ 295.9k 2.20% The leisure and hospitality industry was a significant economic driver in the Austin metropolitan area with the creation of a metro-leading 5,300 positions for a 4.3% increase annually through August Part of the additions were 800 workers at the Fairmont Austin, ahead of the fall opening of the 1,048-room hotel. Hiring in the education and health services sector nearly matched the leisure and hospitality industry. Education and health services organizations recruited 4,900 personnel, to expand 4.2% year over year. The government sector created an additional 2,600 new jobs since August Austin total nonfarm employment expanded 1.8%, or by 17,800 net jobs. While metrowide job growth was down from 3.7% during the preceding year, the latest local increase exceeded the national average expansion of 1.4% since August Contraction in the professional and business services sector contributed to the metrowide slowdown. In one of the largest employment sectors, a metro-leading 2,500 jobs were eliminated for a 1.5% reduction year over year. *August; **September U.S. SHARE OF WALLET METRO SHARE OF WALLET U.S. ANNUAL RENT 28.2% share of wallet METRO ANNUAL RENT 20.5% share of wallet THIRD QUARTER 2017 BERKADIA
3 MULTIFAMILY REPORT SUBMARKET BREAKDOWN SUBMARKET NAME # OF COMMUNITIES # OF UNITS SIZE (SF) PRICE ($ / MO.) RENTAL RATE ($ / SF / MO.) OCCUPANCY Downtown/SoCo/Barton Springs 58 11, , % UT/Mueller 67 9, , % St Edwards/South Lamar 49 8, , % Northeast 60 11, % Research Blvd/North Lamar 84 16, % Pflugerville/Tech Ridge/Wells Branch 68 21, , % Round Rock/Georgetown 69 16, , % Northwest/Arboretum/Domain , , % Cedar Park/Leander/Four Points 72 21, , % Southeast/Riverside Dr 68 15, , % Outlying Metro 9 1, % I-35 South 70 17, , % San Marcos/Kyle/Buda 75 13, , % West/Sunset Valley/Barton Creek 64 17, , % TOTALS , , % BERKADIA THIRD QUARTER 2017
4 CORPORATE HEADQUARTERS 521 Fifth Avenue 20th Floor New York, NY (646) Fax: (646) ALBUQUERQUE, NM AMBLER, PA ATLANTA, GA AUSTIN, TX BAKERSFIELD, CA BATON ROUGE, LA BETHESDA, MD BIRMINGHAM, AL BOCA RATON, FL BOSTON, MA CAMAS, WA CHARLESTON, SC CHATTANOOGA, TN CHICAGO, IL CLEARWATER, FL CLEVELAND, OH COLORADO SPRINGS, CO DALLAS, TX DENVER, CO DETROIT, MI EL SEGUNDO, CA FRESNO, CA HOUSTON, TX IRVINE, CA JACKSONVILLE, FL KANSAS CITY, MO LAS VEGAS, NV LENOX, MA LOS ANGELES, CA MARBLEHEAD, MA MIAMI, FL MIDVALE, UT MURRIETA, CA NASHVILLE, TN NEW YORK, NY NEWPORT NEWS, VA ORLANDO, FL PASADENA, CA PHILADELPHIA, PA PHOENIX, AZ PORTLAND, OR RALEIGH, NC RICHMOND, VA SACRAMENTO, CA SALT LAKE CITY, UT SAN ANTONIO, TX SAN DIEGO, CA SAN FRANCISCO, CA SCOTTSDALE, AZ SEATTLE, WA SHREWSBURY, NJ ST. LOUIS, MO TACOMA, WA TAMPA, FL TEMECULA, CA TEMPE, AZ TUCSON, AZ WOODLAND HILLS, CA HYDERABAD - INDIA* *Back Office Support a Berkshire Hathaway and Leucadia National company 2017 Berkadia Proprietary Holding LLC Berkadia is a trademark of Berkadia Proprietary Holding LLC. Axiometrics is a trademark of Axiometrics Inc. Commercial mortgage loan origination and servicing businesses are conducted exclusively by Berkadia Commercial Mortgage LLC and Berkadia Commercial Mortgage Inc. This website is not intended to solicit commercial mortgage loan brokerage business in Nevada. Investment sales and real estate brokerage businesses are conducted exclusively by Berkadia Real Estate Advisors LLC and Berkadia Real Estate Advisors Inc. For state licensing details for the above entities, visit:
5 MULTIFAMILY REPORT SECOND QUARTER 2017 MARKET AT A GLANCE OCCUPANCY RATE 91.7% Up 50 bps since 2Q16 EFFECTIVE RENT Up 1.0% since 2Q16 $ 1,193 OCCUPANCY AND RENT TRENDS RENTAL DEMAND OUTPACES APARTMENT DELIVERIES TO START 2017 Apartment developers worked to keep pace with rental demand in the Austin metropolitan area to start Construction completed on 3,372 units in the first half of the year. The 445-unit Mansions at Travesia was the largest property to have units begin lease-up in that time, while the remaining units are scheduled to come online by year-end. Deliveries fell short of demand as residents newly occupied 3,906 units so far this year. As a result, apartment occupancy advanced 40 basis points from December 2016 to 91.7% in June With limited apartment inventory, occupancy was a metro-high 97.5% in the outlying metropolitan area. The occupancy rate was also elevated in the San Marcos/Kyle/Buda submarket. Home to Texas State University, the submarket had limited new inventory coming online as occupancy shifted up to 94.9% in June With healthy occupancy, effective rent in the submarket reached $1,185 per month by the end of the second quarter, up 4.4% from one year prior. Metrowide, effective rent advanced 2.1% from December 2016 to $1,193 per month in June % 93% OCCUPANCY AND RENT TRENDS $1,300 $1,200 92% $1,100 91% $1,000 90% $900 89% 3Q12 1Q13 3Q13 1Q14 3Q14 1Q15 3Q15 1Q16 3Q16 1Q17 $800 Occupancy Rate Effective Rent a Berkshire Hathaway and Leucadia National company
6 MULTIFAMILY REPORT DELIVERIES AND DEMAND DELIVERIES 3,372 Units YTD 12,000 9,000 6,000 DELIVERIES AND DEMAND NET ABSORPTION 3,906 Units YTD 3, * *Year to date Deliveries Demand ECONOMIC TRENDS 2016 UNEMPLOYMENT* BPS 3.3% 1.00m 34.4k $ 278.1k 1.64% 3.7% 2016 EMPLOYMENT* % 2016 EXISTING SFH SALES** % 2016 MEDIAN SFH PRICE** % 1.02m 40.6k YEAR TREASURY** BPS $ 296.1k 2.19% Healthy job creation supported steady rental demand in the Austin metropolitan area. Total nonfarm employment expanded 2.8% annually through May The local growth outpaced the 1.6% national increase at the same time. The education and health services sector was a significant economic driver in Greater Austin with 6,400 personnel recruited since May 2016 for a metro-leading 5.6% annual growth. Boosting the sector was the opening of the $310 million Dell Seton Medical Center in May Hiring was also robust in the leisure and hospitality industry, with 4,400 jobs created for 3.6% year-over-year growth. The development of hotels supported the sector during the last year, including the 122-room Woodspring Suites Signature, the 108-unit Residence Inn Austin Southwest, and the 79-unit Staybridge Suites. Nearly matching job creation in the leisure and hospitality industry, companies in the professional and business services sector added 4,000 jobs since May 2016 to expand 2.4% annually. *May; **June U.S. SHARE OF WALLET METRO SHARE OF WALLET U.S. ANNUAL RENT 27.3% share of wallet METRO ANNUAL RENT 20.8% share of wallet SECOND QUARTER 2017 BERKADIA
7 MULTIFAMILY REPORT SUBMARKET BREAKDOWN SUBMARKET NAME # OF COMMUNITIES # OF UNITS SIZE (SF) PRICE ($ / MO.) RENTAL RATE ($ / SF / MO.) OCCUPANCY Downtown/SoCo/Barton Springs 58 11, , % UT/Mueller 66 9, , % St Edwards/South Lamar 48 8, , % Northeast 60 11, % Research Blvd/North Lamar 84 16, % Pflugerville/Tech Ridge/Wells Branch 67 20, , % Round Rock/Georgetown 68 16, , % Northwest/Arboretum/Domain , , % Cedar Park/Leander/Four Points 72 21, , % Southeast/Riverside Dr 68 15, , % Outlying Metro 9 1, % I-35 South 68 17, , % San Marcos/Kyle/Buda 74 13, , % West/Sunset Valley/Barton Creek 65 17, , % TOTALS , , % 2017 Berkadia Real Estate Advisors LLC Berkadia is a registered trademark of Berkadia Proprietary Holding LLC Document sources: Axiometrics; Moody s; Berkadia Research; Apartment Data Services BERKADIA SECOND QUARTER 2017
8 CORPORATE HEADQUARTERS 521 Fifth Avenue 20th Floor New York, NY (646) Fax : (646) ALBUQUERQUE, NM AMBLER, PA ATLANTA, GA AUSTIN, TX BAKERSFIELD, CA BATON ROUGE, LA BIRMINGHAM, AL BOCA RATON, FL BOSTON, MA CAMAS, WA CAPISTRANO BEACH, CA CHARLESTON, SC CHATTANOOGA, TN CHICAGO, IL CLEARWATER, FL COLORADO SPRINGS, CO DALLAS, TX DC METRO DENVER, CO DETROIT, MI EL SEGUNDO, CA FRESNO, CA HOUSTON, TX IRVINE, CA JACKSONVILLE, FL KANSAS CITY, MO LAS VEGAS, NV LEAWOOD, KS LOS ANGELES, CA MANCHESTER, MA MARBLEHEAD, MA MEMPHIS, TN MIAMI, FL MIDVALE, UT NASHVILLE, TN NEW YORK, NY NEWPORT BEACH, CA NEWPORT NEWS, VA OKLAHOMA CITY, OK ONTARIO, CA ORLANDO, FL PASADENA, CA PHILADELPHIA, PA PHOENIX, AZ PORTLAND, OR RALEIGH, NC RICHMOND, VA SACRAMENTO, CA SALT LAKE CITY, UT SAN ANTONIO, TX SAN DIEGO, CA SAN FRANCISCO, CA SCOTTSDALE, AZ SEATTLE, WA SHREWSBURY, NJ ST. LOUIS, MO TACOMA, WA TAMPA, FL TEMECULA, CA TEMPE, AZ THE PLAINS, CA TROY, MI TUCSON, AZ TULSA, OK WAUKESHA, WA WOODLAND HILLS, CA HYDERABAD - INDIA* *Back Office Support a Berkshire Hathaway and Leucadia National company

9 MULTIFAMILY REPORT FIRST QUARTER 2017 MARKET AT A GLANCE OCCUPANCY RATE 91.1% Down 10 bps since 1Q16 EFFECTIVE RENT Up 1.0% since 1Q16 $ 1,174 OCCUPANCY AND RENT TRENDS RENT RISES AMID HEALTHY APARTMENT DEMAND Robust job creation supported healthy apartment leasing activity in the Austin metropolitan area. Residents newly occupied 1,272 units metrowide year to date. Demand was elevated in the San Marcos/Kyle/Buda submarket, where occupancy was a near metro-high of 95.5% at the end of the first quarter of Greater Austin occupancy was 91.1% in March 2017, down 30 basis points from three months earlier as builders brought 2,195 units online during the same time. Seven communities began lease-up in the first quarter, three of which were in the Pflugerville/Tech Ridge/ Wells Branch submarket. The three properties added 892 new units to the area. Metrowide apartment inventory will continue to expand at an elevated clip, as construction was underway on 39 communities in the first quarter of 2017 that will add 9,863 units by the end of next year. Developers showed belief in the multifamily market as permitting issuance nearly doubled annually with, 12,864 annualized units requested in March With healthy leasing activity alongside an influx of new supply, operators advanced effective rent 0.6% quarter over quarter to $1,174 per month in March % OCCUPANCY AND RENT TRENDS $1,300 92% $1,200 90% $1,100 88% Aug. 15 Oct. 15 Dec. 15 Feb. 16 Apr. 16 Jun. 16 Aug. 16 Oct. 16 Dec. 16 Feb. 17 $1,000 Occupancy Rate Effective Rent a Berkshire Hathaway and Leucadia National company
10 MULTIFAMILY REPORT DELIVERIES AND DEMAND DELIVERIES 2,195 Units YTD 12,000 9,000 6,000 DELIVERIES AND DEMAND NET ABSORPTION 1,272 Units YTD 3, * *Year to date Deliveries Demand ECONOMIC TRENDS 2016 UNEMPLOYMENT* % 10 BPS 3.4% 2016 EMPLOYMENT* m 3.5% 1.02m 2016 EXISTING SFH SALES** k 3.6% 37.9k 2016 MEDIAN SFH PRICE** 2017 $ 276.0k 7.0% YEAR TREASURY** 2017 $ 295.3k 1.89% 60 BPS 2.48% Austin employment expanded 3.5%, or by 34,000 new jobs, annually through January The rise in local headcounts outpaced the 1.6% national increase at the same time. The leisure and hospitality industry was a significant driver of the local economy as businesses recruited 5,600 personnel. Supporting the rising headcounts was tourism and travel, which brought in approximately $9.1 billion in gross product for the metro in The Fairmont Austin also supported the industry, hiring ahead for the 900 positions needed for its mid-2017 opening. Nearly matching the leisure and hospitality industry, companies in the professional and business services sector added a net 5,500 new jobs. Also in the whitecollar segment, the education and health services organizations expanded 4.3% with a net 5,000 new positions. With steady job growth, the unemployment rate was 3.4% in January While 90 basis points lower than the five-year average, Austin jobless claims raised 10 basis points in the most recent year as more long-term unemployed restarted job searches. *January; **March U.S. ANNUAL RENT 27.0% share of wallet METRO ANNUAL RENT 20.7% share of wallet FIRST QUARTER 2017 BERKADIA
11 MULTIFAMILY REPORT SUBMARKET BREAKDOWN SUBMARKET NAME # OF COMMUNITIES # OF UNITS SIZE (SF) PRICE ($ / MO.) RENTAL RATE ($ / SF / MO.) OCCUPANCY Downtown/ SoCo/ Barton Springs 57 11, , % UT/ Mueller 66 9, , % St Edwards/ South Lamar 48 8, , % Northeast 59 11, % Research Blvd/ North Lamar 84 16, % Pflugerville/ Tech Ridge/ Wells Branch 67 20, , % Round Rock/ Georgetown 68 16, , % Northwest/ Arboretum/ Domain , , % Cedar Park/ Leander/ Four Points 70 21, , % Southeast/ Riverside Dr 67 14, , % Outlying Metro 9 1, % I-35 South 67 16, , % San Marcos/ Kyle/ Buda 74 13, , % West/ Sunset Valley/ Barton Creek 65 17, , % TOTALS , , % 2017 Berkadia Real Estate Advisors LLC Berkadia is a registered trademark of Berkadia Proprietary Holding LLC Document sources: Axiometrics; Moody s; Berkadia Research BERKADIA FIRST QUARTER 2017
12 CORPORATE HEADQUARTERS 521 Fifth Avenue 20th Floor New York, NY (646) Fax : (646) ALBUQUERQUE, NM AMBLER, PA ATLANTA, GA AUSTIN, TX BAKERSFIELD, CA BATON ROUGE, LA BIRMINGHAM, AL BOCA RATON, FL BOSTON, MA CAMAS, WA CHARLESTON, SC CHATTANOOGA, TN CHEVY CHASE, MD CHICAGO, IL CLEARWATER, FL CLEVELAND, OH COLORADO SPRINGS, CO DALLAS, TX DENVER, CO DETROIT, MI EL SEGUNDO, CA FRESNO, CA HOUSTON, TX IRVINE, CA JACKSONVILLE, FL KANSAS CITY, MO LAS VEGAS, NV LENOX, MA LOS ANGELES, CA MARBLEHEAD, MA MIAMI, FL MIDVALE, UT MURRIETA, CA NASHVILLE, TN NEW YORK, NY NEWPORT NEWS, VA ORLANDO, FL PASADENA, CA PHILADELPHIA, PA PHOENIX, AZ PORTLAND, OR RALEIGH, NC RICHMOND, VA SACRAMENTO, CA SALT LAKE CITY, UT SAN ANTONIO, TX SAN DIEGO, CA SAN FRANCISCO, CA SCOTTSDALE, AZ SEATTLE, WA SHREWSBURY, NJ ST. LOUIS, MO TACOMA, WA TAMPA, FL TEMECULA, CA TEMPE, AZ TUCSON, AZ WOODLAND HILLS, CA HYDERABAD - INDIA* *Back Office Support a Berkshire Hathaway and Leucadia National company

13 DALLAS-FORT WORTH MULTIFAMILY REPORT THIRD QUARTER 2016 MARKET AT A GLANCE OCCUPANCY RATE 93.4% Unchanged since 3Q15 EFFECTIVE RENT $1,031 Up 6.7% since 3Q15 OCCUPANCY AND RENT TRENDS EFFECTIVE RENT APPRECIATES 6.7% ANNUALLY AS JOB GROWTH CONTINUES Vibrant job growth kept apartment demand elevated in the Dallas-Fort Worth metro area in the first three quarters of Renters occupied 13,409 additional apartments, on pace to absorb a total of approximately 17,880 apartments by year-end. In 2015, 19,783 apartments were absorbed. More than 20% of year-to-date leasing activity occurred in Plano, Richardson, and Frisco. Significant apartment demand was also present in the Uptown/Oaklawn/Highland Park area. Multifamily builders were also active since the beginning of this year, completing 11,488 apartment units metrowide. Lease up of apartments at approximately 80 apartment communities under construction is expected through the end of the third quarter of When these apartment communities are completed, more than 22,800 units will be added to local multifamily inventory. Operators recorded 93.4% occupancy at the end of the third quarter of this year, the same as one year prior. During the same period, effective rent appreciated 6.7% to 1,031 per month. 94% OCCUPANCY AND RENT TRENDS $1,100 93% $1,050 92% $1,000 91% $950 90% Feb. 15 Apr. 15 Jun. 15 Aug. 15 Oct. 15 Dec. 15 Feb. 16 Apr. 16 Jun. 16 Aug. 16 $900 Occupancy Rate Effective Rent a Berkshire Hathaway and Leucadia National company
14 DALLAS-FORT WORTH MULTIFAMILY REPORT DELIVERIES AND DEMAND DELIVERIES 11,488 Units YTD 25,000 20,000 15,000 10,000 DELIVERIES AND DEMAND NET ABSORPTION 13,409 Units YTD 5, * *Year to date Deliveries Demand ECONOMIC TRENDS 2015 UNEMPLOYMENT* BPS 4.0% 3.41m 116.8k $ 205.9k 2015 EMPLOYMENT* % 2015 EXISTING SFH SALES** % 2015 MEDIAN SFH PRICE** % 2.17% 3.8% 3.54m YEAR TREASURY** BPS 130.5k $ 224.3k 1.63% Employment in the Dallas-Fort Worth area expanded at a 3.5% annual rate since August of Companies in the Metroplex added 120,800 workers to payrolls during that time. In the trade, transportation, and utilities sector, businesses hired 32,500 workers, a 4.5% annual gain. Distribution-center employment surged with 2,000 newly created jobs among Amazon s fulfillment centers in Dallas, Haslet, and Coppell and the first of 500 jobs filled at the new Ulta Beauty logistics center in Dallas. In the financial activities industry, 17,800 workers were recruited, a 6.4% increase. The industry was supported by the hiring of 1,000 workers at State Farm and 250 newly created jobs at Thomson Reuters in Carrollton. Sustained expansion in the financial activities industry is expected as Liberty Mutual hires the first of 2,400 new recruits in Also in 2017, Toyota Motor Corporation s North American headquarters in Plano is expected to be completed, with approximately 3,000 employees transferring from other states and another 1,000 workers hired locally. *August; **September U.S. ANNUAL RENT 28.0% share of wallet METRO ANNUAL RENT 20.2% share of wallet THIRD QUARTER 2016 BERKADIA
15 DALLAS-FORT WORTH MULTIFAMILY REPORT SUBMARKET BREAKDOWN SUBMARKET NAME # OF COMMUNITIES # OF UNITS SIZE (SF) PRICE ($ / MO.) RENTAL RATE ($ / SF / MO.) OCCUPANCY Downtown Dallas / West End / Deep Ellum 49 10, , % Uptown / Oaklawn / Highland Park , , % East Central Dallas / Lower Greenville Ave 50 5, , % White Rock Lake / Tenison Park 69 14, % North Central Dallas / Upper Greenville Ave 99 26, , % Skillman St / I , % Far East Dallas 19 3, , % Garland 92 15, % North Dallas / Addison , , % Far North Dallas / Collin County 78 24, % East Plano / Richardson 84 22, , % West Plano / Frisco , , % Allen / McKinney 68 17, , % East Irving 57 7, % West Irving 81 18, % Las Colinas / Valley Ranch / Coppell 76 27, , % Northwest Dallas / Bachman Lake 61 11, % Carrollton / Farmers Branch , , % Lewisville / Flower Mound 72 21, , % Denton 62 12, , % Southeast Dallas / Mesquite , % Oak Cliff South 63 13, % Duncanville / DeSoto / Cedar Hill / Lancaster 90 19, % Far South Dallas / Waxahachie 24 3, % Trinity Groves / Oak Cliff North 38 6, , % Grand Prairie 52 11, % Downtown Ft Worth / TCU 55 10, , % East Ft Worth / Woodhaven / I-30E 68 12, % North Arlington 95 21, % South Arlington , % Haltom City / Richland Hills / Fossil Creek 70 16, % Hurst / Euless / Bedford , % Grapevine / Roanoke / Keller 62 15, , % Northwest Ft Worth / Saginaw / Eagle Mtn 28 4, % South Ft Worth 62 11, % Southwest Ft Worth / Benbrook 45 12, % Far Southwest Ft Worth 23 2, % Western Hills / Ridgmar / Ridglea 76 13, % TOTALS 2, , , % 2016 Berkadia Real Estate Advisors LLC Berkadia is a registered trademark of Berkadia Proprietary Holding LLC Document sources: Axiometrics; Moody s; Berkadia Research BERKADIA THIRD QUARTER 2016

16 SECOND QUARTER 2016 VACANCY & RENT PERMITS & DELIVERIES EMPLOYMENT GROWTH VACANCY & RENT COMPARISON For a full list of Austin submarkets, visit apartmentupdate.com/report/2229 During the last 12 months employment in the Austin metro increased 3.7%, adding 35,600 employees to the workforce, and growing well above the national rate of 1.7% during the same time. The professional and business services sector combined with trade, transportation and utilities segment created a combined 16,400 positions in the last 12 months. The median price for existing single family homes was $282,300 in June, surging 9% from one year prior. Single family buyers across the metro contributed to a sales velocity increase of 5.6% year over year, equating to 46,270 annualized transactions and registering an eight-year high. Since the beginning of the year, renters across the metro occupied 2,830 apartments, primarily in the Far South and the Southeast submarkets where one in every three units absorbed was located. Absorption levels were slightly higher than one year ago, increasing 3.6% year over year. Year to date builders completed construction on 3,250 apartment units. The bulk of the additions occurred in the Southeast and Far South submarkets with 590 units and 570 units, respectively. The largest individual community to come online this year consists of 442 units in the Near South Central submarket. Developers requested permits for approximately 3,410 multifamily units year to date. By mid-2016, 39 projects were in the planning stages of development with the vast majority adjacent to or situated near the city center region, such as the Near North Central submarket where a permit was issued for a 350-unit apartment community. During the last 12 months, average vacancy across the metro decreased 20 basis points to 4.9%. Fluctuations in average vacancy remained minimal across the region, reflecting stability in the metro market as housing demand keeps pace with recently delivered inventory. Average asking rent in the metro apartment market was $1,604 per month in the second quarter of 2016, an increase of 4.7% from one year prior. The Hwy 183/Cedar Park/Leander submarket saw the largest annual gain with 7.9%, while the Central submarket was home to the highest monthly rents in the metro, checking in at $1,976. Berkadia.com ApartmentUpdate.com a Berkshire Hathaway and Leucadia National company AUSTIN OFFICE Berkadia Real Estate Advisors LLC For sources & disclaimer: apartmentupdate.com/sources


17 FIRST QUARTER 2016 VACANCY & RENT PERMITS & DELIVERIES EMPLOYMENT GROWTH VACANCY & RENT COMPARISON For a full list of Austin submarkets, visit apartmentupdate.com/report/2165 Austin employers created 39,600 jobs to increase headcounts 4.2% since the end of the first quarter of Hiring was robust in the metro's largest employment sector, leisure and hospitality, with 9,400 personnel added for 7.9% growth. The trade, transportation and utilities industry was also an economic driver, expanding 5.2% with 9,000 hires in the last 12 months. The unemployment rate lowered to 3.1% in March, down 20 basis points from one year prior. Local jobless claims were significantly lower than the 5% national rate by the end of the first quarter. The median single-family home price advanced 7.6% year over year to $275,400, while sales velocity soared to 50,640 annualized transactions through March from 42,000 annualized purchases during one year prior. In correlation with strong net in-migration, rental demand heightened with 1,800 newly occupied apartments in the first quarter, surpassing the 1,250 apartments absorbed during the same time last year. Apartment inventory expanded with 1,800 new units coming online in the last three months, with approximately one out of every five additions in the Southeast submarket. Overall, construction completed on 8,400 apartments since the first quarter of Developers pulled back multifamily permitting activity to start the year. Issuance totaled 2,230 units in the first three months of 2016, down from 2,970 multifamily units requested during the same time last year. One of the larger projects in the pipeline is the 650-unit Riverbend community in the Travis County East submarket, Pent-up demand caused a surge of leasing activity of new inventory to start the year, as vacancy held steady at 4.8% in the first quarter. Despite the rate remaining unchanged quarter to quarter, metro vacancy was down 60 basis points from one year prior. The sharpest annual drop in vacancy occurred in the San Marcos submarket, which plummeted 190 basis points to 2.9% as healthy demand persisted amid no new inventory deliveries. The average asking rent advanced a modest 0.3% since December 2015 to $1,169 per month. Overall, average asking rent increased 4.9% year over year while effective rents rose 5.1%, trimming concessions to 0.3% of asking rents. Central submarket average rent remained highest in the metro, advancing 1.5% to $2,025 per month. Berkadia.com ApartmentUpdate.com a Berkshire Hathaway and Leucadia National company AUSTIN OFFICE Berkadia Real Estate Advisors LLC For sources & disclaimer: apartmentupdate.com/sources


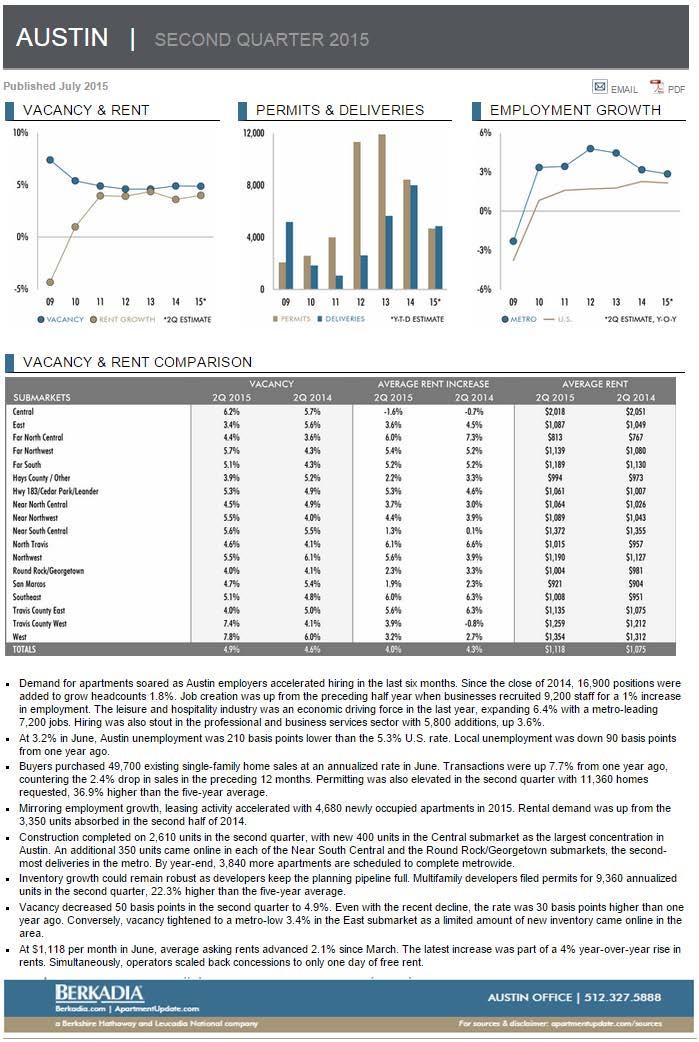
18 THIRD QUARTER 2015 VACANCY & RENT PERMITS & DELIVERIES EMPLOYMENT GROWTH VACANCY & RENT COMPARISON For a full list of Austin submarkets, visit apartmentupdate.com/report/1976 Austin employment increased 3.4% with 31,300 new jobs in the last four quarters, significantly outpacing the U.S. gain. Every employment sector expanded since September of Companies in the professional and business services sector led hiring, creating 8,600 positions to grow 5.4%. The job-listing service company Indeed contributed 300 jobs to the sector in that time. Unemployment was a tight 3% by the end of the third quarter, down 90 basis points from one year prior. The decline matched the 90-basis-point drop in the preceding 12 months. The median existing single-family home price reached $260,000 in September, up 6.7% year over year. Simultaneously, home sales accelerated 13.7% with 48,400 annualized transactions. The rise moved sales on par with the previous peak in March of Rental demand was healthy with 2,080 newly occupied apartments in the third quarter. Leasing activity was elevated from the 1,230-quarterly average during the prior five years. Renters sought apartments in the North Travis submarket, where nearly one out of every five apartments absorbed during the third quarter in the area. Construction completed on 1,990 apartments in the third quarter, bringing year-to-date additions to 6,600 units. While deliveries were spread throughout the metro, 930 apartments came online in each of the Near South Central and the Far Northwest submarkets since December. Developers accelerated multifamily permitting activity with 8,750 annualized units requested in September, 20.7% more submissions than one year prior. The rise put issuance 4.4% higher than the five-year average. Vacancy tightened 10 basis points to 4.7% in the third quarter. Even with the most recent dip, the rate was up 20 basis points from one year ago following a sharp rise in vacancy to close to 2014 and at the start of this year. Vacancy was lowest in the Travis County East submarket at 3.4% in the third quarter, down 50 basis points from the previous 12 months. The average asking rent reached $1,146 per month in September, up 1.4% since June. The latest increase was part of a 4% annual rise in asking rents, with concessions ticking up to an average of two days of free rent. Asking rents remained highest in the Central submarket, elevating 1.1% year over year to $2,063 per month by the end of the third quarter. Berkadia.com ApartmentUpdate.com a Berkshire Hathaway and Leucadia National company AUSTIN OFFICE Berkadia Real Estate Advisors LLC For sources & disclaimer: apartmentupdate.com/sources
19

20 FIRST QUARTER VACANCY & RENT PERMITS & DELIVERIES EMPLOYMENT GROWTH VACANCY & RENT COMPARISON Austin businesses created 27,500 jobs to expand employment 3% during the prior 12 months, fueling rental demand in the metro. Austin outpaced the 2.3% national increase during the same time as every local employment sector posted gains. With 6,100 new positions for 5.5% growth since March of 2014, the leisure and hospitality industry was an economic driver for Austin. Hiring was also robust in the trade, transportation and utilities segment as headcounts grew by 5,500 positions, or 3.3%. The unemployment rate was 3.5% by the end of the first quarter, 110 basis points lower than one year ago. Austin unemployment was 200 basis points less than the 5.5% U.S. average in March. The median existing single-family home price advanced 6.9% year over year to $248,300 in March. Values increased annually since Buyers were not deterred by rising prices, as sales accelerated 7.5% from one year ago with 48,800 annualized transactions in March of Rental demand heightened with 2,780 newly occupied apartments in the first quarter, up from 1,190 units absorbed in the preceding three months. A combined 8,760 units were absorbed in the last year. Construction completed on 2,390 multifamily units in the last three months, 15.5% more deliveries than the preceding quarter. While additions were spread throughout the metro, significant inventory was added in the Near South Central and the Highway 183/Cedar Park/Leander submarkets, with 880 combined new units. Amid healthy rental demand, developers accelerated multifamily permitting activity in the first quarter. In the last three months, permits for 2,940 multifamily units were filed, more than four times the 720 submissions during the same time in Vacancy lowered 20 basis points to 4.8% in the first quarter. The decrease was part of a 30-basis-point decline in the last year. Vacancy was tightest in the Near North Central submarket at 3.9% following an 80-basis-point annual drop. At $1,101 per month in March, average asking rent was up 1.3% since December. Rents increased 4.8% year over year. The Central submarket asking rents topped the metro at $2,025 per month following a 1.2% rise from one year ago. While asking rents advanced across all submarkets year over year, operators held concessions at two days off per month.
21 QUICK FACTS POPULATION 1,954, % EMPLOYMENT 916, % MEDIAN HOME PRICE $239, % MEDIAN HOUSEHOLD INCOME $61, % SALES VELOCITY 2014 REVIEW Austin businesses hired 35,200 workers to lift payrolls a sizable 4% as every employment sector expanded in Local employment growth nearly doubled the 2.1% national rise at the same time. The professional and business services industry was a top economic driver in Austin with 10,600 new positions created in the last 12 months. As one of the largest employment sectors, the trade, transportation and utilities segment contributed an additional 9,500 jobs. Overall hiring was slightly down from the 36,100 positions created for a 4.3% increase in the preceding year. The increase in deliveries combined with healthy job gains supported accelerated leasing activity as renters occupied 9,150 additional apartments since January of 2014, up from 5,060 units absorbed in the preceding year. Construction completed on 9,340 apartments in 2014, up 76.4% from deliveries in the preceding year. With elevated deliveries and numerous projects under construction this year, developers pulled back multifamily permitting activity. In December, 10,650 annualized units were filed, down 10.6% from submissions one year ago. At 4.5%, vacancy decreased 20 basis points in 2014, the lowest year-end level since With limited new supply and continued rental demand, vacancy decreased the most in Travis County, lowering 250 basis points to 3.4% in the Travis County East submarket and 190 basis points to 3.9% in the Travis County West submarket. Operators advanced rent 3.9% in the prior four quarters to $1,085 per month in December. The rise was down from the 4.5% increase in the preceding year. With a significant drop in vacancy, Travis County East rents reached $1,113 per month, up a metro-leading 9.8%. AVERAGE PRICE PER UNIT 150 $2.0 $100, $1.5 $75,000 $ $0.5 $50, * $0.0 $25, * TRANSACTIONS SALES VOLUME (BILLIONS) * Estimate * Estimate VACANCY & RENT COMPARISON VACANCY AVERAGE RENT INCREASE AVERAGE RENT SUBMARKETS Central 5.8% 4.8% 3.4% 3.4% $2,070 $2,002 Far North Central 3.8% 4.1% 6.4% 6.0% $788 $741 Far Northwest 4.1% 4.5% 6.4% 5.3% $1,116 $1,049 Far South 4.1% 4.5% 7.2% 3.0% $1,153 $1,076 Hwy 183/Cedar Park/Leander 4.5% 4.5% 6.7% 4.1% $1,030 $965 North Travis 4.0% 4.8% 7.2% 5.0% $993 $926 Northwest 5.7% 5.3% 4.6% 6.5% $1,164 $1,113 Round Rock/Georgetown 4.1% 4.7% 3.8% 3.2% $1,005 $968 San Marcos 6.8% 3.8% 2.9% 2.3% $956 $929 Southeast 4.5% 5.1% 6.8% 4.7% $953 $893 TOTALS 4.5% 4.7% 3.9% 4.5% $1,085 $1,044 For a full list of Austin submarkets, visit apartmentupdate.com/report/


22 FORECAST 2015 VACANCY & RENT Hiring will accelerate this year with 39,400 positions created for a 4.3% increase in Austin total employment, driving robust apartment absorption. Over the two-year forecast period, more than 20,000 additional units are expected to be leased. The professional and business services segment, one of the largest local employment sectors, will be boosted with the 1,000 new workers added by Interactions Corp. this year. The scheduled completion of the first phase of Apple s Americas Operations Center by the fourth quarter will also lift payrolls. Healthy job creation is expected to continue next year as Austin headcounts grow 4.2% with 40,100 hires. Out-of-state institutional investors are targeting new, Class A apartment product in well-located areas of the metro that are selling at cap rates as low as the mid-4% range, maintaining velocity in this segment. Meanwhile, initial yields for suburban Class A assets are hovering in in the mid- to high-5% range. At the top end of the spectrum, larger investors are targeting properties in lease-up phases where buyers may be able to acquire the newest, best-in-class assets. Alternately, more aggressive speculators are seeking older properties with repositioning potentials. In this category, investors are spending up to $15,000 per unit on renovations, allowing the operators to raise rents more than $100 per month. 10% 5% 0% -5% VACANCY RENT GROWTH * 15** 16** Steady job gains combined with an abundance of new supply should support record-high leasing activity this year with 10,400 newly occupied apartments. The new product will continue to attract renters as the Highway 183/Cedar Park/Leander and Central submarkets will likely lead leasing activity this year. As deliveries dip next year, so should leasing activity with 9,780 units. The robust construction pipeline will result in another historic year of supply growth for the metro. Inventory will expand by 10,670 units in the next 12 months, 14.2% more than additions in Nearly four out of every 10 new units will be in the Highway 183/Cedar Park/Leander or Central submarkets. Deliveries will remain elevated next year with 9,780 new apartments. Multifamily permitting will increase this year as developers request 12,340 units. Next year, submissions will recede an estimated 2.7% with 12,010 multifamily units requested. Even with an influx of new apartment product, healthy rental demand will allow local apartment owners to fill units quickly. Marketwide vacancy will decrease 10 basis points over the next four quarters to 4.4% in December. The rate will improve an additional 20 basis points by the end of 2016, falling to 4.2%. Conventional Average Market Rents $1,085 $1,134 $1,185 * Estimate; ** Forecast PERMITS & DELIVERIES PERMITS DELIVERIES 15,000 10,000 5,000 Operators will advance average asking rent to $1,134 per month by December. Rents will increase again by 4.5% next year to $1,185 per month * 15** 16** * Estimate; ** Forecast JOB EMPLOYMENT GROWTH ABSORPTION GAINED I LOST 5.0% METRO U.S. 12, , , , (18,200) , , , , * 35, ** 39, ** 40, % 0.0% -2.5% -5.0% * 15** 16** 9,000 6,000 3, * 15** 16** * Estimate; ** Forecast * Estimate; ** Forecast * Estimate; ** Forecast Data and images pertaining to employment, income, permits, population, rents, single-family housing and vacancy are year-end figures. Absorption, construction and apartment sales figures are full-year totals. Numbers for 2014 are estimated values, while 2015 and 2016 figures are forecast projections. The sales information represents transactions of apartment properties with a sales price of $1 million or more. Apartment market data criteria and methodologies vary by market. 13


23 2014 SALES SUMMARY SALES VELOCITY 2013 ANNUAL SALES VOLUME $1.5 B SALES VOLUME % 42.2% 2014 ANNUAL SALES VOLUME $2.2 B TRANSACTION COUNT AVERAGE PRICE PER UNIT AVERAGE CAP RATE SALES COMPARABLES MARKET HIGHLIGHTS Multifamily investment activity accelerated in the Austin metropolitan area during Buyers purchased 108 properties last year, 3.9% more than Investors moved to acquire 1970-vintage product within the city of Austin as 31 properties sold, up from 23 transactions in the preceding year. The sale of large, recent builds doubled year over year, contributing to a 42.2% increase in dollar volume metrowide, with $2.2 billion in multifamily investments during The average price per unit advanced 18.3% to $96,434 in Values increased annually since hitting a trough in 2010 at $50,695. Among Class A sales, prices were highest in Pflugerville at $114,032 per unit. Cap rates decreased 60 basis points to 5.6% last year. First-year yields were tightest within the city at 5.5%, while reaching 5.9% in the suburbs. Berkadia.com ApartmentUpdate.com a Berkshire Hathaway and Leucadia National company AUSTIN OFFICE For sources & disclaimer: apartmentupdate.com/sources
EL PASO MULTIFAMILY REPORT THIRD QUARTER 2017
 MULTIFAMILY REPORT THIRD QUARTER 2017 MARKET AT A GLANCE OCCUPANCY RATE 92.2% Up 60 bps since 3Q16 ASKING RENT $ 774 Unchanged since 3Q16 CONCESSIONS 1.6% Unchanged since 3Q16 OCCUPANCY AND RENT TRENDS
NATIONAL ASSOCIATION OF REALTORS RESEARCH DIVISION
 NATIONAL ASSOCIATION OF REALTORS RESEARCH DIVISION COMMERCIAL REAL ESTATE Positive Demand Overcomes Weak Economic Performance in 2014.Q1 George Ratiu Director, Quantitative & Commercial Research First
NATIONAL MULTIFAMILY RESEARCH REPORT FORECAST a Berkshire Hathaway and Leucadia National company
 NATIONAL MULTIFAMILY RESEARCH REPORT FORECAST 218 a Berkshire Hathaway and Leucadia National company The Value of Certainty Berkadia is an industry-leading real estate company. We provide comprehensive
U.S. GDP (2012 Q Q2)
") U.S. GDP (2012 Q3 2014 Q2) U. S. Employment Employment Recovery Following the Last Two Downturns Rail Traffic: Containers Rail Traffic: Commodities Select Rail Traffic Residential Mortgages Pipeline of
U.S. GDP (2012 Q3 2014 Q2) U. S. Employment Employment Recovery Following the Last Two Downturns Rail Traffic: Containers Rail Traffic: Commodities Select Rail Traffic Residential Mortgages Pipeline of
MAR KET GLANCE SAN DIEGO OFFICE MARKET REPORT PROPERTY SERVICES DEVELOPMENT INVESTMENT FOURTH QUARTER 2015 PROPERTY SERVICES DEVELOPMENT INVESTMENT
 AT A SAN DIEGO OFFICE MARKET REPORT FOURTH QUARTER 215 AT A NEW SUPPLY PUSHES VACANCY RATES HIGHER San Diego s regional economy has been buzzing and added a net total of 37,8 jobs in the 12 months ending
Vacancy Inches Higher, Despite Continued Absorption
 Research & Forecast Report GREATER PHOENIX OFFICE 1Q 2017 Vacancy Inches Higher, Despite Continued Absorption Key Takeaways > > Improving conditions in the Greater Phoenix office market took a pause in
LUXURY MARKET REPORT. - May
 LUXURY MARKET REPORT - May 2018 - www.luxuryhomeing.com THIS IS YOUR LUXURY MARKET REPORT MAP OF LUXURY RESIDENTIAL MARKETS Welcome to the Luxury Report, your guide to luxury real estate market data and
Foreclosures Continue to Bring Home Prices Down * FNC releases Q Update of Market Distress and Foreclosure Discount
 Foreclosures Continue to Bring Home Prices Down * FNC releases Q4 2011 Update of Market Distress and Foreclosure Discount The latest FNC Residential Price Index (RPI), released Monday, indicates that U.S.
Monthly Market Snapshot
 SEPTEMBER 2018 Vacancy continues to fall. Nearing the end of the third quarter, the vacancy rate dropped 10 basis points to 6.4%, compared to this time last month at 6.5%. Occupancy of the 1.1 million
LUXURY MARKET REPORT. - March
 LUXURY MARKET REPORT - March 2018 - www.luxuryhomeing.com THIS IS YOUR LUXURY MARKET REPORT MAP OF LUXURY RESIDENTIAL MARKETS Welcome to the Luxury Report, your guide to luxury real estate market data
WESTCHESTER COUNTY MARKET OVERVIEW AND DEVELOPMENT TRENDS
 WESTCHESTER COUNTY MARKET OVERVIEW AND DEVELOPMENT TRENDS PACE LAND USE LAW CENTER ANNUAL CONFERENCE PRESENTED BY: WILLIAM V. CUDDY, JR. December, 2017 PAGE 0 MULTIFAMILY RESIDENTIAL AND ECONOMIC DEVELOPMENT
LUXURY MARKET REPORT. - March
 LUXURY MARKET REPORT - March 2018 - www.luxuryhomemarketing.com THIS IS YOUR LUXURY MARKET REPORT MAP OF LUXURY RESIDENTIAL MARKETS Welcome to the Luxury Market Report, your guide to luxury real estate
April 2015, Volume 24 Issue 4. Q Round Up
 April 2015, Volume 24 Issue 4 Q1 2015 Round Up Wayne Williams President, ALN Apartment Data, Inc. Wayne@alndata.com Evan Takacs Account Executive 1.800.643.6416 x 220 Evan@alndata.com Laura Reese-Williams,
RETAIL REPORT VIEWPOINT 2018 / COMMERCIAL REAL ESTATE TRENDS. By: Hugh F. Kelly, PhD, CRE IRR.COM AN INTEGRA REALTY RESOURCES PUBLICATION
 RETAIL REPORT VIEWPOINT 2018 / COMMERCIAL REAL ESTATE TRENDS By: Hugh F. Kelly, PhD, CRE Nowhere do we hear more discussion of disruption as in the retail property sector. Ecommerce has a powerful effect,
LUXURY MARKET REPORT. - January
 LUXURY MARKET REPORT - January 2018 - www.luxuryhomemarketing.com THIS IS YOUR LUXURY MARKET REPORT MAP OF LUXURY RESIDENTIAL MARKETS Welcome to the Luxury Market Report, your guide to luxury real estate
Industrial Market Closes 2017 on an Upswing
 Research & Forecast Report GREATER PHOENIX INDUSTRIAL Industrial Market Closes on an Upswing Key Takeaways > > The Greater Phoenix industrial market finished off a year of robust tenant demand with a strong
STATE OF THE MULTIFAMILY MARKET MACRO VIEW
 STATE OF THE MULTIFAMILY MARKET MACRO VIEW JEANETTE I. RICE, CRE AMERICAS HEAD OF MULTIFAMILY RESEARCH APRIL 19, 2018 Westchester/ Fairfield 2 JEANETTE I. RICE STATE OF U.S. MULTIFAMILY MARKET KEY INVESTMENT
U.S. Multifamily MarketView
 U.S. Multifamily MarketView CBRE Global Research and Consulting VACANCY RATE.% NET ABSORPTION 7, Units RENTABLE COMPLETIONS 8,55 Units Y-o-Y RENT CHANGE.% Arrows indicate change from previous year. Total
NATIONAL APARTMENT RESEARCH REPORT FORECAST. a Berkshire Hathaway and Jefferies Financial Group company
 NATIONAL APARTMENT RESEARCH REPORT FORECAST 219 a Berkshire Hathaway and Jefferies Financial Group company The Value of Certainty Berkadia is an industry-leading real estate company. We provide comprehensive
MAMA Risk Summary Data through 2011 Q3
 MAMA Risk Summary Data through 2011 Q3 Table of Contents Report Contents... 2 Summary... 3 MAMA Risk Summary Indicators for Largest 50 Metro Areas... 4 Home Prices Risk Indicator Summary Map... 6 Employment
Deliveries and starts see midyear gains; occupancy up 40 bps
 MARKETVIEW Dallas/Fort Worth Multifamily, Q3 2017 Deliveries and starts see midyear gains; occupancy up 40 bps Occupancy Rate 95.63% Avg. Rental Rate $1.20 PSF Construction Starts 7,175 Delivered 5,937
LUXURY MARKET REPORT. - February
 LUXURY MARKET REPORT - February 2018 - www.luxuryhomeing.com THIS IS YOUR LUXURY MARKET REPORT MAP OF LUXURY RESIDENTIAL MARKETS Welcome to the Luxury Report, your guide to luxury real estate market data
By several measures, homebuilding made a comeback in 2012 (Figure 6). After falling another 8.6 percent in 2011, single-family
. After falling another 8.6 percent in 2011, single-family") 2 Housing Markets With sales picking up, low inventories of both new and existing homes helped to firm prices and spur new single-family construction in 212. Multifamily markets posted another strong year,
2 Housing Markets With sales picking up, low inventories of both new and existing homes helped to firm prices and spur new single-family construction in 212. Multifamily markets posted another strong year,
Americas Office Trends Report
 Americas Office Trends Report Summary The overall U.S. office market picked up the pace in the second quarter of 2016 despite continued global economic and financial market uncertainty. While the Brexit
U.S. Economic and Institutional Apartment Market Overview and Outlook. January 7, 2015
 U.S. Economic and Institutional Apartment Market Overview and Outlook January 7, 2015 Emerging Economic Trends Inflation Adjusted Crude Oil Prices In Alignment with Long-Term Average Price per Barrel (Nov.
Greater Phoenix Multifamily
 MARKET REPORT / Greater Phoenix Multifamily Apartment Rents Remain on an Upswing Highlights > > Conditions in the Phoenix multifamily market strengthened during the third quarter. Vacancy tightened and
Recovery? Growth? Jobs? Capital Investment?
 Recovery? Growth? Jobs? Capital Investment? Turning the Corner? Presented by Dr. Ivan Miestchovich, Jr., Director Institute for Economic Development & Real Estate Research The University of New Orleans
VSIP POSITION LISTING American Federation of Government Employees
 HQ Washington, DC Office of Public Housing Investments Public Housing Revitalization Specialist GS 15 11 Public Housing Revitalization Specialist GS 14 14 Public Housing Revitalization Specialist GS 13
Americas Office Trends Report
 AMERICAS OFFICE TRENDS REPORT Americas Office Trends Report Summary The overall national office market recovery slowed slightly in the first quarter of 2016 amid financial market volatility. However, as
INLAND EMPIRE REGIONAL INTELLIGENCE REPORT. School of Business. April 2018
 INLAND EMPIRE REGIONAL INTELLIGENCE REPORT April 2018 Key economic indicators suggest that the Inland Empire s economy will continue to expand throughout the rest of 2018, building upon its recent growth.
4 RENTAL MARKETS. While the fundamentals remain strong for. investors, there are signs that rental markets
 4 RENTAL MARKETS While the fundamentals remain strong for investors, there are signs that rental markets are at a turning point. Real rents are still climbing, but at a slower pace now that vacancy rates
INLAND EMPIRE REGIONAL INTELLIGENCE REPORT
 INLAND EMPIRE REGIONAL INTELLIGENCE REPORT June 2016 EMPLOYMENT After a slow start to 2016, the Inland Empire s labor market returned to form, in recent job figures. Seasonally adjusted nonfarm employment
Commercial and Multifamily Construction Starts in 2016 Rise in Most of the Top U.S. Metropolitan Areas
 Commercial and Multifamily Construction Starts in 2016 Rise in Most of the Top U.S. Metropolitan Areas However, New York NY Settles Back After Robust 2015 Most of the leading U.S. metropolitan areas for
COMMERCIAL PROPERTY PRICES REMAIN IN SLOWDOWN PATTERN AS MARKET REACTS TO INVESTOR PULLBACK
 CCRSI RELEASE MARCH 2016 (With data through February 2016) COMMERCIAL PROPERTY PRICES REMAIN IN SLOWDOWN PATTERN AS MARKET REACTS TO INVESTOR PULLBACK DESPITE DECLINE IN PROPERTY PRICING, LEASING ACTIVITY
U.S. MULTIFAMILY MARKETVIEW FIGURES Q4 2016
 U.S. MULTIFAMILY MARKETVIEW FIGURES Q4 2016 U.S. MULTIFAMILY MARKETVIEW Q4 2016 2016 DELIVERS IMPRESSIVE DEMAND AND NEW SUPPLY TOTALS Vacancy Rate 4.9% Net Absorption* 201,000 Units Rentable Completions*
With Vacancy Low, Rents Pushing Higher
 Research & Forecast Report GREATER PHOENIX MULTIFAMILY 3Q 2 With Low, Pushing Higher Key Takeaways > > The Greater Phoenix multifamily market strengthened somewhat during the third quarter, with vacancy
OUR DETAIL IS RETAIL.
 OUR DETAIL IS RETAIL. GILBERT GROUP ADVANTAGE Rooted with local knowledge and experience strengthened by national reach. PROPERTY MANAGEMENT PROJECT LEASING TENANT REPRESENTATION GILBERT GROUP ABOUT US
Fannie Mae Affordable Lender Meeting
 Fannie Mae Affordable Lender Meeting MAH Madness November 13, 2017 2017 Fannie Mae. Trademarks of Fannie Mae. Millions Our Stat Sheet Team Name: Multifamily Affordable Housing (MAH) $5,000 $4,500 $4,000
MATRIX MONTHLY. Rent Survey July Multifamily Rent Growth Stabilizes in July; Market Solid Overall
 MATRIX MONTHLY Rent Survey July 2017 Multifamily Rent Growth Stabilizes in July; Market Solid Overall Sequential rent growth was virtually flat in July, but the U.S. multifamily market remained in an overall
Naturally Occurring Affordable Housing
 Naturally Occurring Affordable Housing NAAHL Annual Conference December 1, 2016 page 1 Slicing And Dicing Rental Housing U.S. Rental Housing Inventory By Units Rent Subsidized 3.3 Million 8% Market Rate
SPECIAL REPORT. Single-Family Rent Index: H Review
 SPECIAL REPORT Rent Index: H1 2018 Review FEBRUARY 2018 1 National Overview Single-family rentals make up one-half of all residential rentals but are an overlooked segment of the housing market. Much like
Metropolitan Area Statistics
 Metropolitan Area Statistics Apartment Completions 1Q 2011 1Q 2012 % Chg Atlanta - - n/a Boston 133 39-71% Chicago - 20 n/a Cleveland - - n/a Columbus - 272 n/a Dallas-Ft. Worth 604 1,059 75% Denver 328
Rents and Sales Prices on the Rise to Start 2018
 Research & Forecast Report GREATER PHOENIX MULTIFAMILY 2 and Sales Prices on the Rise to Start 2 Key Takeaways > > The Greater Phoenix multifamily market got off to a hot start to 2. continues to retreat
MATRIX MONTHLY. Rent Survey September Multifamily Rent Deceleration Persists
 MATRIX MONTHLY Rent Survey September 2016 Multifamily Rent Deceleration Persists The deceleration of multifamily rents continued in September. Although basically flat, average U.S. monthly rents dropped
Pennsbury Professional Center 201 Woolston Drive Morrisville, PA
 Pennsbury Professional Center 201 Woolston Drive Morrisville, PA A VALUE-ADD MEDICAL OFFICE OPPORTUNITY WITH CONVENIENT ACCESS TO ROUTE 1 AND DENSE SURROUNDING POPULATION INVESTMENT SUMMARY Page 1 EXECUTIVE
Orange County Multifamily
 MARKET REPORT / Orange County Multifamily Employment Gains Driving Rental Demand, Low Vacancy Rates More than 2,600 units have come online to this point in, and nearly 5,000 apartments are currently under
August 14, Tucson s Investment Grade
 August 14, 2014 Tucson s Investment Grade Let s take a look at what Tucson features for national investors. Tucson has the large investment properties to offer. The largest transactions in the past decade
ECONOMIC CURRENTS. Vol. 3, Issue 1. THE SOUTH FLORIDA ECONOMIC QUARTERLY Introduction
 ECONOMIC CURRENTS THE SOUTH FLORIDA ECONOMIC QUARTERLY Introduction Economic Currents provides an overview of the South Florida regional economy. The report contains current employment, economic and real
Strong Absorption Drives Down Vacancy to Start 2017
 Research & Forecast Report GREATER PHOENIX INDUSTRIAL 2017 Strong Absorption Drives Down to Start 2017 Key Takeaways >> Industrial vacancy in Greater Phoenix dipped below 10 percent in the first quarter,
MULTIFAMILY REPORT VIEWPOINT 2018 / COMMERCIAL REAL ESTATE TRENDS. By: Hugh F. Kelly, PhD, CRE IRR.COM AN INTEGRA REALTY RESOURCES PUBLICATION
 MULTIFAMILY REPORT VIEWPOINT 2018 / COMMERCIAL REAL ESTATE TRENDS By: Hugh F. Kelly, PhD, CRE Just when the upcycle for rental apartments seemed to be approaching its peak, along came the Tax Act of 2017,
OFFICE REPORT VIEWPOINT 2018 / COMMERCIAL REAL ESTATE TRENDS. By: Hugh F. Kelly, PhD, CRE IRR.COM AN INTEGRA REALTY RESOURCES PUBLICATION
 OFFICE REPORT VIEWPOINT 2018 / COMMERCIAL REAL ESTATE TRENDS By: Hugh F. Kelly, PhD, CRE The Office workplace is at the nexus of powerful cross-currents. Pricing has made CBD acquisitions, especially in
ECONOMIC CURRENTS. Vol. 3, Issue 3 SOUTH FLORIDA ECONOMIC QUARTERLY. Introduction
 ECONOMIC CURRENTS THE Introduction SOUTH FLORIDA ECONOMIC QUARTERLY Economic Currents provides an overview of the South Florida regional economy. The report presents current employment, economic and real
LUXURY MARKET REPORT. - November
 LUXURY MARKET REPORT - November 2018 - www.luxuryhomeing.com THIS IS YOUR LUXURY MARKET REPORT MAP OF LUXURY RESIDENTIAL MARKETS Welcome to the Luxury Report, your guide to luxury real estate market data
Western Economic Developments
 IN THIS ISSUE F E D E R A L R E S E R V E B A N K O F S A N F R A N C I S C O Western Economic Developments Office market slumps, housing demand remains strong in District Figure, panel B: Commercial office
North Texas Real Estate Information System (NTREIS) reports median single-family home price down -1.5% in Aug-15 over Jul-15, sales fall to 8,504.
 reports median single-family home price down -1.5% in Aug-15 over Jul-15, sales fall to 8,504.") Dallas/Ft. Worth Metroplex Market Report Aug-15 Source: North Texas Real Estate Information System (NTREIS) North Texas Real Estate Information System (NTREIS) reports median single-family home price down
Dallas/Ft. Worth Metroplex Market Report Aug-15 Source: North Texas Real Estate Information System (NTREIS) North Texas Real Estate Information System (NTREIS) reports median single-family home price down
Multifamily Market Commentary June 2017
 Multifamily Market Commentary June 2017 Multifamily Supply and Demand Varies by Metro Across the country, there are more than 630,000 new multifamily units currently underway with more than 400,000 of
MATRIX MONTHLY. Rent Survey February Multifamily Rents Flat in February
 MATRIX MONTHLY Rent Survey February 2017 Multifamily Rents Flat in February Average U.S. monthly rents were unchanged in February, as the rate of increase trends back to the long-term average. Rents remained
Housing Affordability: Local and National Perspectives
 University of Pennsylvania ScholarlyCommons 2018 ADRF Network Research Conference Presentations ADRF Network Research Conference Presentations 11-2018 Housing Affordability: Local and National Perspectives
Rents Spike, Brightening the Second-Half Outlook
 Research & Forecast Report GREATER PHOENIX MULTIFAMILY Q2 217 Rents Spike, Brightening the Second-Half Outlook Key Takeaways > > The Greater Phoenix multifamily market recorded an active first half of
NATIONAL ASSOCIATION of REALTORS RESEARCH DIVISION. Prepared for Florida REALTORS
 NATIONAL ASSOCIATION of REALTORS RESEARCH DIVISION Prepared for Florida REALTORS NATIONAL ASSOCIATION OF REALTORS RESEARCH DIVISION Page 1 Page 3 Page 4 Page 6 Page 7 Page 8 Page 9 Page 10 Page 11 Page
IRVINE, Calif. May 8, 2014
 ALL-CASH SHARE OF U.S. RESIDENTIAL SALES REACHES NEW HIGH IN FIRST QUARTER EVEN AS INSTITUTIONAL INVESTOR SHARE OF SALES DROPS TO LOWEST LEVEL SINCE Q1 2012 May 5, 2014 By RealtyTrac Staff All-Cash Purchases
Multifamily National Report. February 2019
 Multifamily National Report February 2019 Multifamily Growth: No Signs of Slowing U.S. multifamily rents rose $2 in February to $1,426 and year-over-year growth remained at 3., as January was revised upward
Metropolitan Area Statistics (1Q 2013)
") Metropolitan Area Statistics (1Q 2013) Apartment Completions 1Q 2012 1Q 2013 % Chg Atlanta 487 1,460 200% Boston 360 373 4% Chicago 611 92-85% Cleveland 7 54 671 Columbus - 459 n/a Dallas-Ft. Worth 1,327
Metropolitan Area Statistics (1Q 2013) Apartment Completions 1Q 2012 1Q 2013 % Chg Atlanta 487 1,460 200% Boston 360 373 4% Chicago 611 92-85% Cleveland 7 54 671 Columbus - 459 n/a Dallas-Ft. Worth 1,327
Cycle Monitor Real Estate Market Cycles
 Cycle Monitor Real Estate Market Cycles Second Quarter 0 Analysis August 0 Physical Market Cycle Analysis of All Five Major Property Types in More Than 0 MSAs. Economic and job growth continue at a moderate
2017 RESIDENTIAL REAL ESTATE MARKET REPORT
 2017 RESIDENTIAL REAL ESTATE MARKET REPORT Published January 26, 2018 Our market reports have been focused on the effects of low inventory on our housing market and for good reason. December 2017 marked
STURDY PERFORMANCE CONTINUES
 STURDY PERFORMANCE CONTINUES The U.S. office market experienced healthy conditions during the second quarter of the year. Absorption was stout, but vacancy edged higher as deliveries continue to exceed
PACE LAW SCHOOL LAND USE & SUSTAINABLE DEVELOPMENT CONFERENCE
 PACE LAW SCHOOL LAND USE & SUSTAINABLE DEVELOPMENT CONFERENCE PRESENTED BY: WILLIAM V. CUDDY, JR. December 8, 2016 Multifamily Residential Development as a driver and consequence of economic development
STOCKTON, DETROIT, RIVERSIDE-SAN BERNARDINO POST TOP METRO FORECLOSURE RATES ACCORDING TO REALTYTRAC Q METROPOLITAN FORECLOSURE MARKET REPORT
 STOCKTON, DETROIT, RIVERSIDE-SAN BERNARDINO POST TOP METRO FORECLOSURE RATES ACCORDING TO REALTYTRAC Q3 2007 METROPOLITAN FORECLOSURE MARKET REPORT California, Florida and Ohio Cities Account for 17 of
Summary. Houston. Dallas. The Take Away
 Page Summary The Take Away The first quarter of 2017 was marked by continued optimism through multiple Texas metros as job growth remained positive and any negatives associated with declining oil prices
Investment Activity Heating Up with Rents on the Rise
 Research & Forecast Report GREATER PHOENIX MULTIFAMILY 2 Investment Activity Heating Up with Rents on the Rise Key Takeaways > > The third quarter proved to be another period of healthy operating conditions
Multifamily Research. Market Report Third Quarter South Florida. Rent Growth Holds Upward Momentum As New Supply Peaks in South Florida
 Multifamily Research Market Report Third Quarter 2017 South Florida Rent Growth Holds Upward Momentum As New Supply Peaks in South Florida High homeownership cost keeps rental demand elevated. Rising employment
List of 2009 Round Allocations
 List of 2009 Round Allocations CDFI 601 Thirteenth Street, NW, Suite 200, South, Washington, DC 20005 (202) 622-8662 9 10 CDFI 601 Thirteenth Street, NW, Suite 200, South, Washington, DC 20005 (202) 622-8662
TEXAS HOUSING INSIGHT
 TEXAS HOUSING INSIGHT JAMES P. GAINES CHIEF ECONOMIST WESLEY MILLER RESEARCH ASSOCIATE PAIGE WOODSON RESEARCH INTERN LUIS B. TORRES RESEARCH ECONOMIST 2 1 2 0 REPORTING AUGUST 2018 DATA TECHNICAL REPORT
Research AUSTIN 1Q16 OFFICE MARKET. Current Conditions
 is a Top Pick Going into 2016 The office market recognized its 14th consecutive quarter of positive net absorption in the first quarter of 2016, as its vacancy rate fell to 10., significantly lower than
CBRE Houston ViewPoint
 CBRE Houston ViewPoint DOWNTOWN HOUSTON: THE NEW GATEWAY MARKET? by Sara R. Rutledge Director, Research and Analysis INTRODUCTION Investor interest from both domestic and foreign sources has revived in
Pittsburgh Industrial Market Timeline
 INDUSTRIAL INDUSTRIAL Page 30 Pittsburgh Industrial Market Timeline 2015, 2016, 2017 2014 EXPANSION 2012, 2013 RECOVERY HYPERSUPPLY RECESSION Industrial Class A Local Markets by Vacancy TOP THREE BOTTOM
Cycle Forecast Real Estate Market Cycles Second Quarter 2018 Estimates
 Cycle Forecast Real Estate Market Cycles Second Quarter 20 Estimates The Congressional Budget Office (CBO) is forecasting Gross Domestic Product (GDP) at rates below 2.0% for the next 0 years and employment
MULTIFAMILY MARKET ANALYSIS
 MULTIFAMILY MARKET ANALYSIS CLANCY TERRY RMLS Student Fellow Master of Real Estate Development Candidate At the national level, annual effective rent growth in the multifamily sector has extended the strong
MARKETBEAT U.S. Shopping Center Q3 2016
 MARKETBEAT U.S. Shopping Center Q3 2016 U.S. SHOPPING CENTER Economic Indicators Market Indicators Rent Rate vs. Overall Vacancy $22 Q3 15 Q3 16 Vacancy Rates 7.8% 7.4% Net Absorption 14.4 M 11.9 M Under
Quarterly Market Report
 HOUSTON OFFICE JANUARY 2018 EXECUTIVE SUMMARY Office Market Shows Signs of Improvement Houston s overall vacancy rate remained relatively unchanged at 20.7% in, a decrease of 10 basis points quarter-over-quarter,
Real Estate Update. elearning series. Upcoming elearning series. Year-End Planning. September 16
 Real Estate Update Upcoming elearning series Year-End Planning September 16 Kevin Russell Senior Vice President, Sales & Account Management, Cartus Home Loans Renee Carnes-Rook Vice President, Real Estate
Investor Presentation September 2014
 Investor Presentation September 2014 1 Forward-Looking Statements In addition to historical information, this presentation contains forward-looking statements under the federal securities law. These statements
Research. New product, high rents CLEVELAND 1Q16 INDUSTRIAL MARKET. Current Conditions
 New product, high rents The Greater Cleveland industrial market absorbed 556,046 square feet in the first quarter of 2016, the 14th consecutive quarter of positive tenancy gains for the market. The positive
National Property Type Cycle Locations. Retail 1st Tier Regional Mall. Industrial R&D Flex Retail Factory Outlet+1 Retail Neighborhood/Community
 Cycle Monitor Real Estate Market Cycles Third Quarter 0 Analysis November 0 Physical Market Cycle Analysis of All Five Major Property Types in More Than 0 MSAs. International turmoil, slow European Union
OFFICE QUICK STATS SUMMARY & OUTLOOK MARKET TRENDS VACANCY & NET ABSORPTION ECONOMIC STATS
 LOS ANGELES CENTAL/SOUTHEAST OFFICE THIRD QUARTER 218 QUICK STATS Direct Vacancy 14.7% Overall Vacancy 15.2% Lease Rate FSG $3.16 Gross Absorption Under Construction MARKET TRENDS Change from Last Quarter
Quarterly Market Report
 OCTOBER EXECUTIVE SUMMARY San Antonio office market hits record high for rents Full-service asking rents rose by $.11 per sq. ft. quarter-over-quarter to close at $22. an all-time high with an increase
KEY TOWER SALE highlights start of 2017
 KEY TOWER SALE highlights start of 2017 Demand for office space in the Greater Cleveland office market remained strong as 2016 wound down and transitioned into the first quarter of 2017. After netting
Multifamily maintains strength; faces increased deliveries in H2 2016
 MARKETVIEW U.S. Multifamily, Q2 216 Multifamily maintains strength; faces increased deliveries in H2 216 Vacancy Rate 4.4% Net Absorption* 22, Units Rentable Completions* 229, Units Total Acquisitions
Research DALLAS/FT. WORTH 2Q16 OFFICE MARKET. Current Conditions
 /FT. WORTH Strong Relationship Between Employment Growth and Net Absorption Point to a Strong Outlook If history serves as a guide, then the /Fort Worth office market should perform quite well through
ECONOMIC CURRENTS. Vol. 4, Issue 3. THE Introduction SOUTH FLORIDA ECONOMIC QUARTERLY
 ECONOMIC CURRENTS THE Introduction SOUTH FLORIDA ECONOMIC QUARTERLY Vol. 4, Issue 3 Economic Currents provides an overview of the South Florida regional economy. The report presents current employment,
Market Research. OFFICE First Quarter 2010
 colliers international LAS VEGAS, NV Market Research OFFICE First Quarter 2010 Market Indicators Net Absorption Construction Rental Rate Q1-10 Q2-2010 Projected Clark County Economic Data Jan-10 Jan-09
Economic Highlights. Payroll Employment Growth by State 1. Durable Goods 2. The Conference Board Consumer Confidence Index 3
 August 26, 2009 Economic Highlights Southeastern Employment Payroll Employment Growth by State 1 Manufacturing Durable Goods 2 Consumer Spending The Conference Board Consumer Confidence Index 3 Real Estate
>> 2017 Begins With Continued Strong Demand
 Research & Forecast Report Central Los Angeles OFFICE Q1 217 Accelerating success. >> 217 Begins With Continued Strong Demand Key Takeaways > Hudson Pacific's Icon at Sunset property delivered 323,3 square
Growing Demand for Smaller Industrial Properties
 Growing Demand for Smaller Industrial Properties Moderator: Lew Friedland, Colony Capital Panelists: Rene Circ, CoStar Portfolio Strategy Brian Fiumara, CBRE Andrew Mele, Trammell Crow Company #crec15
QUARTERLY NEWSLETTER Q2 15
 Q2 15 IN THIS ISSUE: Letter from CEO Acquisitions Pipeline TRP Housing Market Overview Oklahoma Market Overview Multifamily Market Overview Annual Charity Event Appendix A: Second Tier MF Markets 180 Newport
Rapid recovery from the Great Recession, buoyed
 Game of Homes The Supply-Demand Struggle Laila Assanie, Sarah Greer, and Luis B. Torres October 4, 2016 Publication 2143 Rapid recovery from the Great Recession, buoyed by the shale oil boom, has fueled
The Housing Market Report Card October 20, 2011 Tim Sullivan, Principal
 The Housing Market Report Card October 20, 2011 Tim Sullivan, Principal 1 The Housing Market Report Card For the School of Rock Hard Knocks October 26, 2011 Tim Sullivan, Principal 2 Agenda 1. Housing
Multifamily Market Commentary February 2017
 Multifamily Market Commentary February 2017 Affordable Multifamily Outlook Incremental Improvement Expected in 2017 We expect momentum in the overall multifamily sector to slow in 2017 due to elevated
2013 Arizona Housing Market Mid-Year Report
 2013 Arizona Housing Market Mid-Year Report This mid-year market report outlines the latest trends in Arizona real estate. The housing market hit bottom in mid to late 2011, and has been in recovery mode
Investor Presentation February 2015
 Investor Presentation February 2015 1 Forward-Looking Statements In addition to historical information, this presentation contains forward-looking statements under the federal securities law. These statements