See Full Corridor Study Volumes I and II as separate attachments.
|
|
|
- Elwin Goodwin
- 5 years ago
- Views:
Transcription
1
2 See Full Corridor Study Volumes I and II as separate attachments.
3
4 See Housing Values and as separate attachments.
5

 in the same quarter last year.")
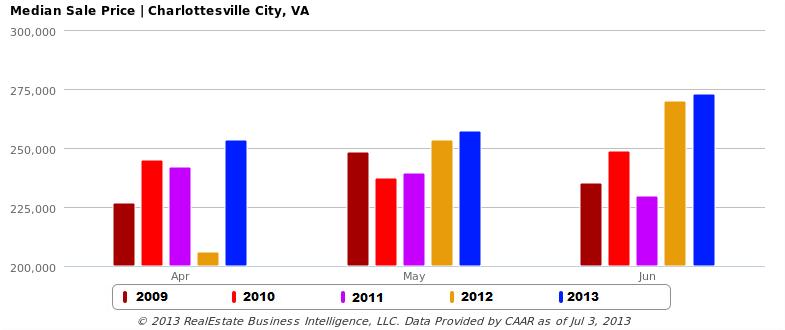
6 nd Quarter and Mid-Year Market Report The voice of real estate in Central Virginia CAAR Member Copy Expanded Edition Charlottesville Area 2 nd Quarter 2013 Highlights: Overall sales in Greater Charlottesville were up 11.2% over the same quarter last year, the seventh consecutive quarter with year-over-year gains. The median sales price of $273,200 in the 2 nd Quarter was up 20.1% from last quarter and 6.3% from one year ago. Half of the homes sold in Q were on the market 40 days or less, representing a 20-day improvement over the median days on market (DOM) in the same quarter last year. Copyright (c) 2013 RealEstate Business Intelligence, LLC. All Rights Reserved Data Source: CAAR MLS. Statistics calculated July 3, nd Quarter 2013 Sales Activity There were 815 homes sold in the Charlottesville area in the second quarter, which was up 11.2% (+82 sales) from the second quarter last year and the highest Q2 sales rate since This increase in sales volume, coupled with a 7% increase in the average sales price compared to Q2-2012, resulted in an 18.9% jump in sold dollar volume (+$42.9M) to

.")
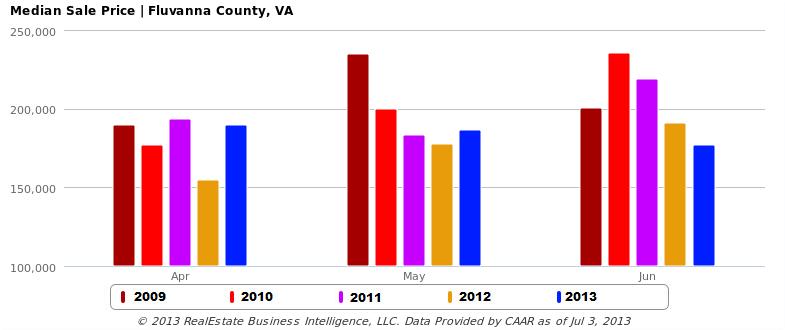
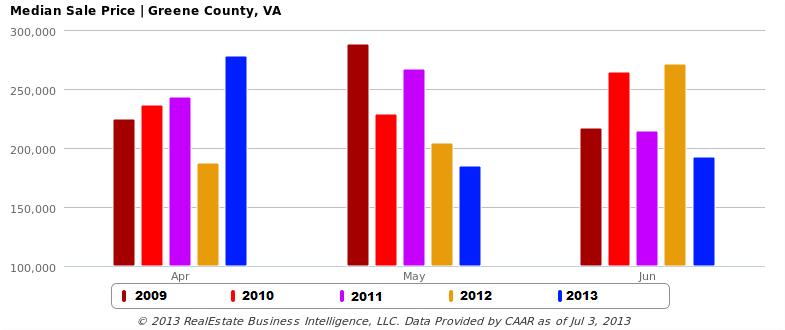
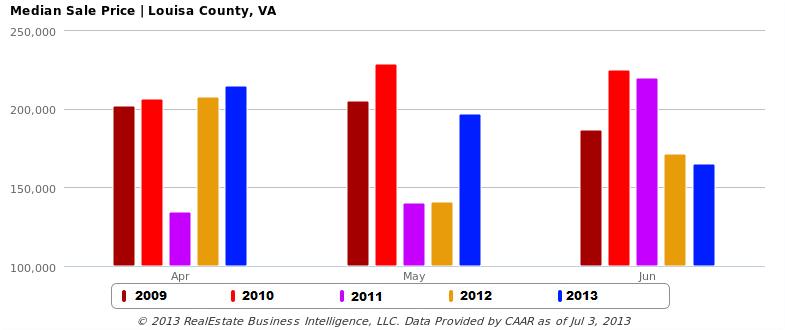
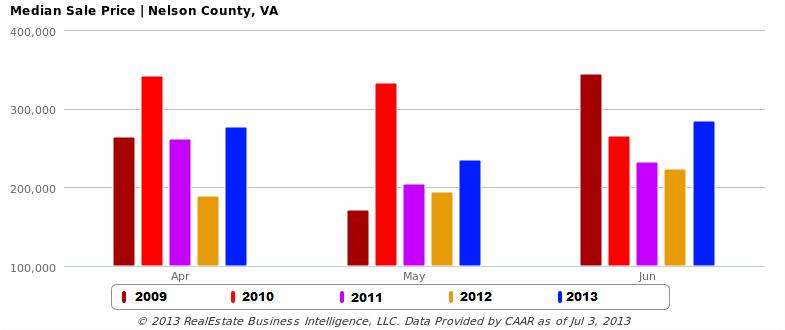
7 $269,423,585. Compared to the 635 sales in Q2-2009, the lowest second quarter sales on record, there were 28.3% more sales (+180) and an increase of 37.7% in sold dollar volume (+73.7M). Four of the six jurisdictions in the Charlottesville area experienced double-digit percent increases in the number of sales compared to Q Louisa County (+59% or 23 more sales), Nelson (+20% or seven more sales), Albemarle (+14% or 54 more sales) and Greene (+14% or six more sales) each showed the strongest year-over-year gains. After experiencing a 22% year-over-year decrease in sales in the first quarter, Charlottesville rebounded in the second quarter with 164 sales, representing a 7% increase over Q (+11 sales). Fluvanna was the only county to post a decline in sales, with 19 fewer closed sales than Q representing a 22% dip. Prices Climbing The $273,200 median sales price in the 2 nd Quarter is the highest level since 2008 and is 6.3% above the Q median of $257,000. Not surprisingly, the average amount of original list price received at time of sale also has increased to 94.2% from 92.5% in Q This is the highest average sale-to-original-listprice ratio since the 4 th Quarter of Copyright (c) 2013 RealEstate Business Intelligence, LLC. All Rights Reserved Data Source: CAAR MLS. Statistics calculated July 3, Louisa ($200,250) and Nelson ($243,500) both saw double-digit year-over-year gains in median sales price, up 30% and 21.8% respectively. Both Charlottesville ($262,750) and Albemarle ($325,000) reached their highest median sales price levels since The Charlottesville median sales price was 6.2% above the Q level while Albemarle was up 8.4%. Seeing the steady rise in pricing in most of the localities across Greater Charlottesville is exactly what drives the confidence of both buyers and sellers in achieving their individual property ownership goals, reports CAAR 2013 President Denise Ramey, GRI. Fluvanna pricing ($185,000) was essentially unchanged with a 0.7% year-overyear decrease. At $198,000, Greene was the only county with significant declines in median sales price, down 16.4% from last year s level.
8

9


10 New Contracts and Inventory Movement The 1,031 new pending sales in the Greater Charlottesville area this quarter represented a 16.7% increase over the 883 in Q This is only the fifth time on record that new pending sales reached the 4- digit level, so obviously buyer demand heated up over the first half of This was the ninth consecutive quarter with year-over-year gains in new contract activity. In analyzing the results of this quarter, all indicators point to a healthy housing market in our region. The local market has consistently gained momentum over the past few quarters, adds Denise Ramey. There were 1,420 new listings added in the quarter, 3.7% more than Q2-2012, the third consecutive quarter with increased listing activity. This signifies that potential sellers are coming off the sidelines of late, but the fact that the growth in new contracts is outpacing the growth in new listings could bode well for the health of the market as inventory levels continue to decline. With 11 months of active inventory at the end of June, Greater Charlottesville remains a buyer s market, but this is down substantially from the 14.5 months of supply level in June There were 15.6% fewer distressed properties listed throughout the quarter compared to Q2-2012, while the 1,323 non-distressed new listings represented a 5.5% increase. The heightened activity surrounding high-end purchases is more evidence of a strengthening market. We ve seen the sales over $1 million nearly double, to 19 sales in Q from 10 this same timeframe last year, says CAAR 2013 President-Elect John Ince. Where do these shifts in new listing and contract activity leave the active inventory level heading into the second half of the year? The 2,179 active listings at the end of the quarter are down 4.8% from the same period last year. This is 14.1% lower than the five-year June 30 th average. Nine of every 10 active listings (95.3%) are non-distressed properties. Of active listings, 103 are foreclosures or short sales, 29 fewer than this time last year and 71 fewer than at the end of Q (-40.8%). The 51 active foreclosure listings at the end of Q2 represent a 27.1% decrease from this time last year, and the 52 active short sales are 16.1% lower than Q Copyright (c) 2013 RealEstate Business Intelligence, LLC. All Rights Reserved Data Source: CAAR MLS. Statistics calculated July 3, 2013.
.")
11 Days on Market (DOM) As detailed in the 1 st Quarter report, homes typically sell faster in the 2 nd Quarter than the 1 st Quarter, and this year was no exception. In fact, the median DOM of 40 days represents a 57% decrease from the 94-day median DOM of the previous quarter (that s nearly two months faster). This is the lowest quarterly level for the region in six years and is 20 days lower than the same period last year. The average DOM is down to 117 days, a 33-day improvement over Q and 53-day improvement over last quarter. Homes sold fastest in Charlottesville, where the 16-day median DOM for the quarter matched the previous record low back in This was a 33-day improvement over the 49-day level in Q Remarkably, the median DOM for Charlottesville homes sold in June was only eight days, which is actually a day lower than the median DOM in Washington, DC (one of the hottest markets in the county). Albemarle (31 days) experienced a 20-day drop in median DOM compared to Q Fluvanna s median DOM improved slightly (-4 days) to 67 days. Louisa (74 days), Greene (83 days) and Nelson (186 days) each had higher median DOM levels versus Q Distressed Sales and Pricing Only 58 of the 815 sales in the 2 nd Quarter, or 7.7%, were foreclosures. This represents 11 fewer foreclosure sales versus Q2-2012, when foreclosures accounted for 9.4% of sales. The 31 short sales were two fewer than the same quarter last year and represent an identical share of the sold market at 4.5%. Non-distressed properties accounted for 87.9% of all homes sold, up from 86.1% in Q The median sale price for non-distressed sales was up 4.8% from Q to $285,000 while the foreclosure median level was up 1.7% to $137,500. The median price for the short sale segment was up 5.6%, to $190,000. Market Share by Bank-Mediated Status Three-Year June Snapshot
12 Detached vs. Attached Homes in Greater Charlottesville Sales of attached homes (condos and townhomes) in the region during Q were up 25.5% (+41) to 202 from Q The 613 detached homes sold represented a 7.2% increase from the 572 sold in Q At $220,500, the median sales price for attached homes had the largest year-over-year increase, +16.7%, since Q Detached homes showed a 4.4% increase in median sales price, up $12,710 to $300,000. RBI Key Housing Trend Metrics [Charlottesville Area Association of REALTORS (CAAR)] All Residential Q2-13 % Q-O-Q Q1-13 % Y-O-Y Q2-12 % Y-O-2Y Q2-11 % Y-O-3Y Q2-10 Average Sales Price (Closed) $330, % $276, % $309, % $305, % $314,888 Median Sales Price (Closed) $273, % $227, % $257, % $256, % $262,838 Units Sold (Closed) % % % % 856 Average DOM (Closed) % % % % 132 Listing Discount (Average) 5.8% 9.1% 7.5% 8.3% 6.1% Ratio Avg SP/Avg OLP 94.2% 91.0% 92.5% 91.7% 93.9% Avg SP/Sq Ft % % % % 145 Detached Q2-13 % Q-O-Q Q1-13 % Y-O-Y Q2-12 % Y-O-2Y Q2-11 % Y-O-3Y Q2-10 Average Sales Price (Closed) $358, % $298, % $336, % $334, % $345,252 Median Sales Price (Closed) $300, % $244, % $287, % $277, % $293,000 Units Sold (Closed) % % % % 635 Average DOM (Closed) % % % % 140 Listing Discount (Average) 6.4% 9.4% 8.0% 9.1% 7.3% Ratio Avg SP/Avg OLP 93.6% 90.6% 92.0% 91.0% 92.7% Avg SP/Sq Ft % % % % 146 Attached Q2-13 % Q-O-Q Q1-13 % Y-O-Y Q2-12 % Y-O-2Y Q2-11 % Y-O-3Y Q2-10 Average Sales Price (Closed) $245, % $196, % $211, % $202, % $227,642 Median Sales Price (Closed) $220, % $183, % $189, % $194, % $220,000 Units Sold (Closed) % % % % 221 Average DOM (Closed) % % % % 110 Listing Discount (Average) 4.0% 7.8% 5.6% 5.5% 2.6% Ratio Avg SP/Avg OLP 96.0% 92.2% 94.5% 94.5% 97.4% Avg SP/Sq Ft % % % % 142 Copyright (c) 2013 RealEstate Business Intelligence, LLC. All Rights Reserved Data Source: CAAR MLS. Statistics calculated July 3, If you plan to sell a home in 2013, be sure to have a REALTOR prepare a comparative market analysis (CMA) so that you can price it to sell. And, if you are looking to buy, a REALTOR can help you understand the current market and evaluate your options. This nd Quarter Market Report is produced by the Charlottesville Area Association of REALTORS using data from the CAAR MLS. For more information on this report or the real estate market, pick up a copy of the CAAR Real Estate Weekly, visit or contact your REALTOR.
13
14 9 Year Average ( ) Per Capita Spending for Operations As a Percent of State Average - All Cities Source: Exhibit C, Auditor of Public Accounts Comparative Reports 300 Percent of State Average
15 COMPARATIVE REPORT SUMMARY OF MAINTENANCE AND OPERATIONS EXPENDITURES - CITIES Health and Welfare Parks, Recreation, and Cultural Public Safety Percent Rank - Percent Rank - Percent Rank - Per of Per Capita Per of Per Capita Per of Per Capita Amount Capita Average Spending Amount Capita Average Spending Amount Capita Average Spending FY12 46,384,770 1, ,904, ,350, FY11 46,015,518 1, ,507, ,410, FY10 47,246,855 1, ,610, ,245, FY09 46,779,712 1, ,792, ,256, FY08 40,382,740 1, ,861, ,551, FY07 36,155, ,341, ,389, FY06 36,380, ,837, ,315, FY05 35,558, ,716, ,225, FY04 33,369, ,142, ,461, CHARLOTTESVILLE AVG of of of 39 STATE AVERAGE FY Administration Community Development Judicial Administration Percent Rank - Percent Rank - Percent Rank - Per of Per Capita Per of Per Capita Per of Per Capita Amount Capita Average Spending Amount Capita Average Spending Amount Capita Average Spending FY12 11,008, ,397, ,322, FY11 9,788, ,779, ,266, FY10 10,200, ,108, ,924, FY09 11,629, ,539, ,135, FY08 10,243, ,826, ,091, FY07 9,298, ,905, ,894, FY06 9,081, ,382, ,891, FY05 7,844, ,168, ,712, FY04 7,553, ,188, ,498, CHARLOTTESVILLE AVG of of of 39 STATE AVERAGE FY Education Public Works Percent Rank - Percent Rank - Per of Per Capita Per of Per Capita Amount Capita Average Spending Amount Capita Average Spending FY12 73,696,985 1, ,311, FY11 72,353,655 1, ,272, FY10 66,464,497 1, ,583, FY09 67,799,282 1, ,087, FY08 67,762,374 1, ,252, FY07 62,445,823 1, ,756, FY06 60,352,625 1, ,994, FY05 56,961,139 1, ,838, FY04 52,922,141 1, ,398, CHARLOTTESVILLE AVG 1, of of 39 STATE AVERAGE FY12 1,
16 City of Charlottesville City Manager s Office MEMO TO: Gary O Connell, City Manager FROM: Leslie Beauregard, Budget Manager DATE: July 28, 2006 SUBJECT: Auditor of Public Accounts State Comparative Report of Local Government Revenues and Expenditures Analysis and Issues America s #1 City! Some questions came up during the budget process and more recently regarding the Auditor of Public Accounts (APA) State Comparative Report of Local Government Revenues and Expenditures specifically, the General Government Administrative costs for the City shown in the report and what that means. Per your request, I have done some analysis on this aspect of the report but also in general how the report should be read and interpreted if it s to be used. What is the APA State Comparative Report and What Does It Mean? The APA State Comparative Report of Local Government Revenues and Expenditures is supposed to provide the user with useful comparative data for the revenues and expenditures of every city, county and town in the Commonwealth. The report requires localities to classify expenses by line item, which are then shown in various functional activity areas, such as Public Safety, Health and Welfare, Education, etc. that on the surface, seem to be comparable among the other localities. However, once you start to delve into what is behind the numbers and try to compare with other localities in terms of what is actually included in each of those functional areas, the complications begin. The Executive Memo of the report even comes with a warning: we caution users not to base conclusions solely on the report s data. The report does not include other factors such as the efficiency of various government functions or differences in the quantity of quality of services, which vary among localities. In addition, when you get behind the numbers, you find that 1
17 localities do not include items in a uniform way within the functional areas, which adds to the confusion of what the report means. In other words, localities have discretion as to how they categorize items within functional areas, which I will illustrate in the example with Roanoke. Analysis of General Government Administration Since the main question seems to focus on General Government Administration expenditures, the first thing we did was to find out how much of a percentage these expenditures are to the total expenditures. The attached spreadsheet shows that we are about, but a bit better, than the middle of the pack. This data should resolve any alarm that somehow our administrative costs are high in comparison to others. Second, we took a look at one other city for comparison and dug into the figures for General Government Administration. I chose Roanoke for a few reasons: It is a member of the First Cities Coalition; It is about twice our size in population, employee county count and budget; I know the Assistant Finance Director and she did not mind being the guinea pig, and The percentage of General Government Administration to their total expenditures is actually lower than ours (4.94% compared to 3.94%). While there are many similarities in the departments that are included, there are several differences as well regarding what each city includes in this functional area. They are summarized below (I have also attached the spreadsheet showing the details): Roanoke includes a print shop, citizens service center, billing and collections, municipal auditing (this is an internal audit function), occupational health, general services and some special purpose grants. Charlottesville includes organizational memberships, Public Works administration, General Gov t projects and engineering, several items from the CIP such as cable TV equipment, Downtown Mall repair expenditures, Council Chamber Improvements, technology improvements, etc. 2
18 The fact that we include these items under administration, and they are large dollar amounts, explains in part why the percentage as compared to the total expenditures is higher than Roanoke. Roanoke, for example, includes Public Works Administration under Public Works functional area rather than considering it administrative in nature. I hope that this information is helpful in trying to explain this report. Getting one city s information and getting this far has taken at least 4 hours within the past week or so. I would appreciate any feedback you have in terms of going forward with this research. Thank you! 3
rd Quarter Market Report
 2012 3 rd Quarter Market Report The voice of real estate in Central Virginia CAAR Member Copy Expanded Edition Charlottesville Area 3 rd Quarter 2012 Highlights: Overall sales in Greater Charlottesville
2015 First Quarter Market Report
 2015 First Quarter Market Report CAAR Member Copy Expanded Edition Charlottesville Area First Quarter 2015 Highlights: Median sales price for the region was up 5.1% over Q1-2014, rising from $244,250 to
2013 Year-End Market Report
 2013 Year-End Market Report The voice of real estate in Central Virginia CAAR Member Copy Expanded Edition Charlottesville Area Year-End 2013 Highlights: Yearly home sales in Greater Charlottesville were
nd Quarter Market Report
 2015 2 nd Quarter Market Report The voice of real estate in Central Virginia CAAR Member Copy Expanded Edition Charlottesville Area 2 nd Quarter 2015 Highlights: Closed sales in the Greater Charlottesville
February 2016 Loudoun County Market Trends Report Contracts and sales activity jump double-digits; Inventories down 15.5 percent
 FOR IMMEDIATE RELEASE Contact: Christine Windle 703-777-2468, cwindle@dullesarea.com Sponsored by: Access National Bank Tom Ciolkosz, (703) 871-1045, tciolkosz@accessnationalbank.com Patty Foster, 703-871-1014,
May 2016 Loudoun County Market Trends Report Homes selling twice as fast as 2015 with re-emergence of seller s market
 FOR IMMEDIATE RELEASE Contact: Christine Windle 703-777-2468 Dulles Area Association of REALTORS cwindle@dullesarea.com Sponsored by: Access National Bank Tom Ciolkosz, (703) 871-1045, tciolkosz@accessnationalbank.com
August 2017 Loudoun County Market Trends Report Sales Price Reaches Record High; Sales Decline; Inventory Remains Low
 FOR IMMEDIATE RELEASE Contact: Christine Windle 703 777 2468 Dulles Area Association of REALTORS cwindle@dullesarea.com August 2017 Loudoun County Market Trends Report Sales Price Reaches Record High;
CAAR Market Report 2010 Mid-Year Published by the Charlottesville Area Association of REALTORS
 CAAR Market Report 2010 Mid-Year Published by the Charlottesville Area Association of REALTORS Where Are We Now? The pace of home purchases in the Charlottesville market area showed a significant increase
November 2017 Loudoun County Market Trends Report Inventory decline persists as total and new listings are down; Sales growth continues to drop
 FOR IMMEDIATE RELEASE Contact: Brenda Morton 703 777 2468 Dulles Area Association of REALTORS bmorton@dullesarea.com November 2017 Loudoun County Market Trends Report Inventory decline persists as total
January 2018 Loudoun County Market Trends Report Inventory has another record low month; home sales continue to decline compared to last year.
 FOR IMMEDIATE RELEASE Contact: Brenda Morton 703 777 2468 Dulles Area Association of REALTORS bmorton@dullesarea.com January 2018 Loudoun County Market Trends Report Inventory has another record low month;
FOR IMMEDIATE RELEASE Contact: Brenda Morton Dulles Area Association of REALTORS
 FOR IMMEDIATE RELEASE Contact: Brenda Morton 703 777 2468 Dulles Area Association of REALTORS bmorton@dullesarea.com August 2018 Loudoun County Market Trends Report Despite persistent low inventory, sales
CAAR Market Report 2010 First Quarter Published by the Charlottesville Area Association of REALTORS
 CAAR Market Report 2010 First Quarter Published by the Charlottesville Area Association of REALTORS Where Are We Now? In the first quarter of 2010, the Charlottesville real estate market continued the
Year to Date (thru June)
") CAAR Market Report 2009 Mid-Year Published by the Charlottesville Area Association of REALTORS Where Are We Now? The pace of home purchases in the Charlottesville area continues to improve from the dismal
CAAR Market Report 2009 Mid-Year Published by the Charlottesville Area Association of REALTORS Where Are We Now? The pace of home purchases in the Charlottesville area continues to improve from the dismal
MARKET AREA UPDATE Report as of: 1Q 2Q 3Q 4Q
 MARKET AREA UPDATE Report as of: 1Q 2Q 3Q 4Q Year: 2013 Market Area (City, State): Washington DC Metropolitan Area Provided by (Company / Companies): LONG & FOSTER REAL ESTATE, INC. What are the most significant
FOR IMMEDIATE RELEASE Contact: Brenda Morton Dulles Area Association of REALTORS
 FOR IMMEDIATE RELEASE Contact: Brenda Morton 703 777 2468 Dulles Area Association of REALTORS bmorton@dullesarea.com February 2018 Loudoun County Market Trends Report Inventory reaches yet another record
May 2018 Loudoun County Market Trends Report Tight inventory continues while price growth stagnates; Condo sales hit a record high.
 FOR IMMEDIATE RELEASE Contact: Brenda Morton 703 777 2468 Dulles Area Association of REALTORS bmorton@dullesarea.com May 2018 Loudoun County Market Trends Report Tight inventory continues while price growth
FOR IMMEDIATE RELEASE Contact: Bobette Banks Director of Communications Greater Capital Area Association of REALTORS
 FOR IMMEDIATE RELEASE Contact: Bobette Banks 301-590-8764 Director of Communications Greater Capital Area Association of REALTORS bbanks@gcaar.com November 2015 Washington, DC Market Trends Report Median
August 2015 Washington, DC Market Trends Report Limited supply, high demand continue pushing prices to record highs
 FOR IMMEDIATE RELEASE Contact: Bobette Banks 301-590-8764 Director of Communications Greater Capital Area Association of REALTORS bbanks@gcaar.com August 2015 Washington, DC Market Trends Report Limited
FOR IMMEDIATE RELEASE Contact: Bobette Banks Director of Communications Greater Capital Area Association of REALTORS
 FOR IMMEDIATE RELEASE Contact: Bobette Banks 301-590-8764 Director of Communications Greater Capital Area Association of REALTORS bbanks@gcaar.com April 2016 Washington, DC Market Trends Report Sales and
May 2016 Washington, DC Market Trends Report Listings continue to move quickly as sales climb nearly 14 percent
 FOR IMMEDIATE RELEASE Contact: Bobette Banks 301-590-8764 Director of Communications Greater Capital Area Association of REALTORS bbanks@gcaar.com May 2016 Washington, DC Market Trends Report Listings
2008 Mid-Year CAAR Market Report Real Estate Market is as Hot as ANWR
 2008 Mid-Year CAAR Market Report Real Estate Market is as Hot as ANWR By Dave Phillips, CEO Charlottesville Area Association of REALTORS Just about everything in life is relative to your perspective. Based
March 2016 Washington, DC Market Trends Report March sales represent a 12 percent increase; top the five-year March average
 FOR IMMEDIATE RELEASE Contact: Bobette Banks 301-590-8764 Director of Communications Greater Capital Area Association of REALTORS bbanks@gcaar.com March 2016 Washington, DC Market Trends Report March sales
CAAR Market Report. Greater Charlottesville Area. Q Quick Facts + 3.5% + 8.0% %
 CAAR Market Report Includes the city of Charlottesville and the counties of Albemarle, Fluvanna, Greene, Louisa and Nelson. Quick Facts + 3.5% + 8.0% We can comfortably consider the first quarter to have
September 2018 Loudoun County Market Trends Report Inventory continues to tighten as prices increase and closed sales decline
 FOR IMMEDIATE RELEASE Contact: Brenda Morton 703 777 2468 Dulles Area Association of REALTORS bmorton@dullesarea.com September 2018 Loudoun County Market Trends Report Inventory continues to tighten as
MARKET AREA UPDATE Report as of: 1Q 2Q 3Q 4Q
 Year: 2013 Market Area (City, State): Baltimore Metropolitan Area MARKET AREA UPDATE Report as of: 1Q 2Q 3Q 4Q Provided by (Company / Companies): LONG & FOSTER REAL ESTATE, INC. What are the most significant
MARKET AREA UPDATE Report as of: 1Q 2Q 3Q 4Q
 MARKET AREA UPDATE Report as of: 1Q 2Q 3Q 4Q Year: 2014 Market Area (City, State): Washington DC Metropolitan Area Provided by (Company / Companies): LONG & FOSTER REAL ESTATE, INC. What are the most significant
May 2016 Montgomery County Market Trends Report Double-digit gains in closed sales, exceeding the five-year May average
 FOR IMMEDIATE RELEASE Contact: Bobette Banks 301-590-8764 Director of Communications Greater Capital Area Association of REALTORS bbanks@gcaar.com May 2016 Montgomery County Market Trends Report Double-digit
Charlottesville Housing Market Report Year-End (Published by the Charlottesville Area Association of REALTORS )
") Charlottesville Housing Market Report - 2009 Year-End (Published by the Charlottesville Area Association of REALTORS ) This Quarterly Market Report is produced by the Charlottesville Area Association of
Charlottesville Housing Market Report - 2009 Year-End (Published by the Charlottesville Area Association of REALTORS ) This Quarterly Market Report is produced by the Charlottesville Area Association of
2007 Sales (thru September)
") Third Quarter Market Report Challenges, Opportunities, and Surprises, Oh My! By Dave Phillips, CEO Charlottesville Area Association of REALTORS Someone named Anonymous once said, "Many an opportunity is
Third Quarter Market Report Challenges, Opportunities, and Surprises, Oh My! By Dave Phillips, CEO Charlottesville Area Association of REALTORS Someone named Anonymous once said, "Many an opportunity is
st Quarter Market Report A Recipe That s Hard to Swallow
 2008 1 st Quarter Market Report A Recipe That s Hard to Swallow By Dave Phillips, CEO Charlottesville Area Association of REALTORS Have you ever stood in your kitchen, felt a creative surge and decided
DATA FOR MAY Published June 23, Sales are up +11.3% month-over-month. The year-over-year comparison shows an increase of +11.1%.
 Permission is granted only to ARMLS Subscribers for reproduction with attribution on to ARMLS COPYRIGHT 2017. For questions regarding this publication contact Brand@ARMLS.com. DATA FOR MAY 2017 - Published
Q Quick Facts + 7.5% + 1.6% - 8.6%
 CAAR Market Report Includes the city of Charlottesville and the counties of Albemarle, Fluvanna, Greene, Louisa and Nelson. Quick Facts + 7.5% + 1.6% Housing markets across the nation are most assuredly
Single Family Sales Maine: Units
 Maine Home Connection 19 Commercial St Portland, Maine 04101 MaineHomeConnection.com Office: (207) 517-3100 Email: Info@MaineHomeConnection.com For the fourth consecutive year, Maine home sales set a new
Q Quick Facts - 3.2% 0.0% %
 CAAR Market Report Includes the city of Charlottesville and the counties of Albemarle, Fluvanna, Greene, Louisa and Nelson. Home prices were consistently up again in most markets in 2018 but at reduced
The Market Watch Monthly Housing Report. Coachella Valley Median Detached Home Price Dec Dec 2016
 The Market Watch Monthly Housing Report Median Price $450,000 Coachella Valley Median Detached Home Price Dec 2002 - Dec 2016 $400,000 $350,000 $300,000 $339,930 $340,000 $250,000 $200,000 $150,000 CV
Washington, D.C. Metro Area December 2017 Housing Market Update
 Washington, D.C. Metro Area December 2017 Housing Market Update Washington D.C. Metro housing market closes out 2017 with record high December house price of $420,050; December inventories decline for
Coachella Valley Median Detached Home Price April April 2017
 The Desert Housing Report Median Price $450,000 $400,000 Coachella Valley Median Detached Home Price April 2002 - $349,000 $389,000 $350,000 $300,000 $250,000 $200,000 $150,000 CV Detached Median Price
Baltimore, MD Metro Area September 2017 Housing Market Update
 Baltimore, MD Metro Area September 2017 Housing Market Update Baltimore Metro median sales price of $253,000 is near September record; Active inventories decline by 11.4% to lowest September level of the
Monthly Indicators + 9.9% - 1.7% % Activity Overview New Listings Pending Sales. Closed Sales. Days on Market Until Sale. Median Sales Price
 Monthly Indicators 2015 All expectations in 2015 are for a healthy and energetic selling season. National stories have been highlighting an increase in new construction sales and pending sales, but national
ANALYSIS OF THE CENTRAL VIRGINIA AREA HOUSING MARKET 1st quarter 2013 By Lisa A. Sturtevant, PhD George Mason University Center for Regional Analysis
 ANALYSIS OF THE CENTRAL VIRGINIA AREA HOUSING MARKET 1st quarter By Lisa A. Sturtevant, PhD George Mason University Center for Regional Analysis Economic Overview Key economic factors in the first quarter
RESIDENTIAL MARKET ANALYSIS
 RESIDENTIAL MARKET ANALYSIS CLANCY TERRY RMLS Student Fellow Master of Real Estate Development Candidate Oregon and national housing markets both demonstrated shifting trends in the first quarter of 2015
Austin-area home prices set August record, outpace household income growth in August 2015
 Austin-area home prices set August record, outpace household income growth in August 2015 Market Reports Austin Board of REALTORS releases real estate statistics for August 2015 AUSTIN, Texas September
February 2018 Montgomery County Market Trends Report Closed sales dip while median sales price reaches highest February mark since 2007
 FOR IMMEDIATE RELEASE Contact: Bobette Banks 301-590-8764 Director of Communications Greater Capital Area Association of REALTORS bbanks@gcaar.com February 2018 Montgomery County Market Trends Report Closed
September 2017 Washington, DC Market Trends Report September median sales price drops 6.4 percent but still near record high
 FOR IMMEDIATE RELEASE Contact: Bobette Banks 301-590-8764 Director of Communications Greater Capital Area Association of REALTORS bbanks@gcaar.com September 2017 Washington, DC Market Trends Report September
January 2018 Washington, DC Market Trends Report Closed sales reach highest January level since 2005
 FOR IMMEDIATE RELEASE Contact: Bobette Banks 301-590-8764 Director of Communications Greater Capital Area Association of REALTORS bbanks@gcaar.com January 2018 Washington, DC Market Trends Report Closed
June 2018 Montgomery County Market Trends Report Median sales price reaches highest June level on record
 FOR IMMEDIATE RELEASE Contact: Bobette Banks 301-590-8764 Director of Communications Greater Capital Area Association of REALTORS bbanks@gcaar.com June 2018 Montgomery County Market Trends Report Median
September 2017 Montgomery County Market Trends Report Median sales price highest since September 2007
 FOR IMMEDIATE RELEASE Contact: Bobette Banks 301-590-8764 Director of Communications Greater Capital Area Association of REALTORS bbanks@gcaar.com September 2017 Montgomery County Market Trends Report
Coachella Valley Median Detached Home Price Jan Jan 2017
 The Desert Housing Report Median Price $450,000 Coachella Valley Median Detached Home Price Jan 2002 - Jan 2017 $400,000 $350,000 $300,000 $250,000 $335,000 $340,000 $200,000 $150,000 CV Detached Median
July 2016 Washington, DC Market Trends Report July home prices remain at record highs in the District
 FOR IMMEDIATE RELEASE Contact: Bobette Banks 301-590-8764 Director of Communications Greater Capital Area Association of REALTORS bbanks@gcaar.com July 2016 Washington, DC Market Trends Report July home
Coachella Valley Median Detached Home Price May May 2018
 Median Price $450,000 $400,000 Coachella Valley Median Detached Home Price May 2002 - $389,000 $412,000 $350,000 $300,000 $250,000 $200,000 $150,000 CV Detached Median Price 4 % Growth Curve Summary The
Peter Comitini Senior VP Associate Broker The Corcoran Group
 Sutton Area TriBeCa Upper East Side Upper West Side Washington Heights West Village Battery Park City Beekman Carnegie Hill Central Park South Chelsea Flatiron Clinton East Harlem East Village Financial
The Desert Housing Report. Coachella Valley Median Detached Home Price March March 2019 $392,000 $415,000
 Median Price $450,000 $400,000 $350,000 $300,000 $250,000 $200,000 $150,000 Coachella Valley Median Detached Home Price March 2002 - $392,000 $415,000 CV Detached Median Price Summary 4% Growth Curve The
PRINCE GEORGE S COUNTY FEBRUARY 2018
 STATPAK PRINCE GEORGE S COUNTY FEBRUARY 2018 McEnearney.com MARKET IN A MINUTE A SUMMARY OF MARKET CONDITIONS FOR JANUARY 2018 Contract activity in January 2018 was up 20.9% from January 2017, and there
November 2018 Montgomery County Market Trends Report Median sales price reaches highest November level in 10 years
 FOR IMMEDIATE RELEASE Contact: Bobette Banks 301-590-8764 Director of Communications Greater Capital Area Association of REALTORS bbanks@gcaar.com November 2018 Montgomery County Market Trends Report Median
MARKET IN A MINUTE A SUMMARY OF MARKET CONDITIONS FOR SEPTEMBER & 3rd QUARTER 2017
 STATPAK LOUDOUN COUNTY OCTOBER 2017 McEnearney.com MARKET IN A MINUTE A SUMMARY OF MARKET CONDITIONS FOR SEPTEMBER & 3rd QUARTER 2017 Contract activity in September 2017 was up just 0.6% from September
June 2017 Montgomery County Market Trends Report Median sales price up 1.1 percent highest for June since 2008
 FOR IMMEDIATE RELEASE Contact: Bobette Banks 301-590-8764 Director of Communications Greater Capital Area Association of REALTORS bbanks@gcaar.com June 2017 Montgomery County Market Trends Report Median
November 2017 Washington, DC Market Trends Report Median sales price ties last year for highest November level on record
 FOR IMMEDIATE RELEASE Contact: Bobette Banks 301-590-8764 Director of Communications Greater Capital Area Association of REALTORS bbanks@gcaar.com November 2017 Washington, DC Market Trends Report Median
MARKET AREA UPDATE Year: 2017 Report as of: 1Q 2Q 3Q 4Q
 MARKET AREA UPDATE Year: 2 Report as of: 1Q 2Q 3Q 4Q Market Area (City, State): Fort Myers/Cape Coral, Florida Provided by (Company / Companies): Real Estate Provided by RDC Member(s): What are the most
The Corcoran Report 4Q16 MANHATTAN
 The Corcoran Report 4Q16 MANHATTAN Contents Fourth Quarter 2016 4/7 12/23 3 Overview 8 9 10 Market Wide 11 Luxury 24 2 Sales / Days on Market 3 Inventory / Months of Supply 4 5 Market Share Resale Co-ops
STATPAK MARKET IN A MINUTE A SUMMARY OF MARKET CONDITIONS FOR JANUARY McEnearney.com CONTRACTS URGENCY INDEX INVENTORY INTEREST RATES
 STATPAK LOUDOUN COUNTY FEBRUARY 2018 McEnearney.com MARKET IN A MINUTE A SUMMARY OF MARKET CONDITIONS FOR JANUARY 2018 Contract activity in January 2018 was down just 2.0% from January 2017, but that is
May 2017 Montgomery County Market Trends Report Median sales price increases 5.8 percent; active listings drop 11.8 percent
 FOR IMMEDIATE RELEASE Contact: Bobette Banks 301-590-8764 Director of Communications Greater Capital Area Association of REALTORS bbanks@gcaar.com May 2017 Montgomery County Market Trends Report Median
November 2017 Montgomery County Market Trends Report Median sales price up slightly as median days on market quickens
 FOR IMMEDIATE RELEASE Contact: Bobette Banks 301-590-8764 Director of Communications Greater Capital Area Association of REALTORS bbanks@gcaar.com November 2017 Montgomery County Market Trends Report Median
DATA FOR JANUARY Published Feburary 16, Sales are down -14.0% month-over-month. The year-over-year comparison is up +2.5%.
 Permission is granted only to ARMLS Subscribers for reproduction with attribution on to ARMLS COPYRIGHT 2018. For questions regarding this publication contact Brand@ARMLS.com. DATA FOR JANUARY 2018 - Published
January 2017 Washington, DC Market Trends Report Median Sales Price Up 4.6 percent Reaches Highest January Level on Record
 FOR IMMEDIATE RELEASE Contact: Bobette Banks 301-590-8764 Director of Communications Greater Capital Area Association of REALTORS bbanks@gcaar.com January 2017 Washington, DC Market Trends Report Median
March 2018 Washington, DC Market Trends Report Median sales price reaches highest March level on record
 FOR IMMEDIATE RELEASE Contact: Bryan Frantz 301-590-8765 Communications Specialist District of Columbia Association of REALTORS bfrantz@dcrealtors.org March 2018 Washington, DC Market Trends Report Median
December 2018 Montgomery County Market Trends Report Median sales rise slightly from 2017; Active listings increase 5.1 percent
 FOR IMMEDIATE RELEASE Contact: Bobette Banks 301-590-8764 Director of Communications Greater Capital Area Association of REALTORS bbanks@gcaar.com December 2018 Montgomery County Market Trends Report Median
MARKET AREA UPDATE Report as of: 1Q 2Q 3Q 4Q
 MARKET AREA UPDATE Report as of: 1Q 2Q 3Q 4Q Year: 2013 Market Area (City, State): Arlington, Virginia Provided by (Company / Companies): McEnearney Associates, Inc. Realtors What are the most significant
The Desert Housing Report. Coachella Valley Median Detached Home Price December December 2018
 Median Price $450,000 $400,000 Coachella Valley Median Detached Home Price December 2002 - $369,450 $389,944 $350,000 $300,000 $250,000 $200,000 $150,000 CV Detached Median Price 4% Growth Curve Summary
CONTENTS. Executive Summary. Southern Nevada Economic Situation 1 Household Sector 4 Tourism & Hospitality Industry
 CONTENTS Executive Summary Southern Nevada Economic Situation 1 Household Sector 4 Tourism & Hospitality Industry Residential Trends 6 Existing Home Sales 10 Property Management Market 11 Foreclosure Situation
DATA FOR DECEMBER Published January 23, Sales are up.01% month-over-month. The year-over-year comparison is at +0.5%.
 Permission is granted only to ARMLS Subscribers for reproduction with attribution on to ARMLS COPYRIGHT 2017. For questions regarding this publication contact Brand@ARMLS.com. DATA FOR DECEMBER 2017 -
DATA FOR FEBRUARY Published March 22, Sales are up +13.6% month-over-month. The year-over-year comparison is up +7.4%.
 Permission is granted only to ARMLS Subscribers for reproduction with attribution on to ARMLS COPYRIGHT 2018. For questions regarding this publication contact Brand@ARMLS.com. DATA FOR FEBRUARY 2018 -
1 st Quarter 2015 Asheville and Buncombe County Real Estate Market Analysis
 1 st Quarter 2015 Asheville and Buncombe County Real Estate Market Analysis This report examines the Asheville and Buncombe County residential real estate market through the end of the 1 st quarter of
Adam Brett - Eric Urban market update
 Adam Brett - Eric Urban market update BREA Current prices for homes on the market Trends in pricing Current levels of supply and demand Value metrics Neighborhood details Report for the week of Sunday
January 2019 Montgomery County Market Trends Report Average sales and new listings increase; closed sales decline
 FOR IMMEDIATE RELEASE Contact: Bobette Banks 301-590-8764 Director of Communications Greater Capital Area Association of REALTORS bbanks@gcaar.com January 2019 Montgomery County Market Trends Report Average
Monthly Indicators + 8.8% + 4.3% - 3.6% Market Overview New Listings Pending Sales. Closed Sales. Days on Market Until Sale. Median Sales Price
 Monthly Indicators 2015 The third quarter of 2015 has ticked its last tock with the hands pointing firmly upon a reliable clock of a market. Although noon and 6:30 fluctuations are present even within
Monthly Indicators - 3.0% 0.0% % Activity Overview New Listings Pending Sales. Closed Sales. Days on Market Until Sale. Median Sales Price
 Monthly Indicators 2017 We can comfortably consider the first quarter to have been a good start for residential real estate in 2017. There was certainly plenty to worry over when the year began. Aside
March 2018 Montgomery County Market Trends Report Median sales price reaches highest March level on record; days-on-market down from 2017
 FOR IMMEDIATE RELEASE Contact: Bobette Banks 301-590-8764 Director of Communications Greater Capital Area Association of REALTORS bbanks@gcaar.com March 2018 Montgomery County Market Trends Report Median
INTRODUCTION SUMMER SLIDE
 3 Q 2 0 1 8 M A NH AT TA N M A R K E T R E P O R T INTRODUCTION M A N H A T T A N S A L E S R E P O R T Q 3 2 0 1 8 : SUMMER SLIDE It s common knowledge that Manhattan property sales typically take a dip
June 2018 Washington, DC Market Trends Report Median sales price reaches highest June level on record
 FOR IMMEDIATE RELEASE Contact: Bobette Banks 301-590-8764 Director of Communications Greater Capital Area Association of REALTORS bbanks@gcaar.com June 2018 Washington, DC Market Trends Report Median sales
REAL ESTATE MARKET OVERVIEW 1 st Half of 2015
 REAL ESTATE MARKET OVERVIEW 1 st Half of 2015 With Comparisons to the 2 nd Half of 2014 September 4, 2015 Prepared for: First Bank of Wyoming Prepared by: Ken Markert, AICP MMI Planning 2319 Davidson Ave.
May 2018 Washington, DC Market Trends Report Sales at record high for May while supply remains scarce
 FOR IMMEDIATE RELEASE Contact: Bryan Frantz 202-626-0097 Communications Specialist District of Columbia Association of REALTORS bfrantz@dcrealtors.org May 2018 Washington, DC Market Trends Report Sales
DATA FOR JULY Published August 16, Sales are down -7.7% month-over-month. The year-over-year comparison is up +6.7%. ARMLS STAT JULY 2018
 Permission is granted only to ARMLS Subscribers for reproduction with attribution on to ARMLS COPYRIGHT 2018. For questions regarding this publication contact Brand@ARMLS.com. DATA FOR JULY 2018 - Published
Monthly Indicators + 1.2% - 2.1% % Activity Overview New Listings Pending Sales. Closed Sales. Days on Market Until Sale. Median Sales Price
 Monthly Indicators 2017 We can comfortably consider the first quarter to have been a good start for residential real estate in 2017. There was certainly plenty to worry over when the year began. Aside
FOR IMMEDIATE RELEASE Contact: Bobette Banks Director of Communications Greater Capital Area Association of REALTORS
 FOR IMMEDIATE RELEASE Contact: Bobette Banks 301-590-8764 Director of Communications Greater Capital Area Association of REALTORS bbanks@gcaar.com December 2018 Washington, DC Market Trends Report DC closes
MARCH 2019 Harrisonburg & Rockingham County Real Estate Market Report
 MARCH 219 Real Estate Market Report An analysis of real estate activity through February 28, 219 provided courtesy of Scott P. Rogers, Funkhouser Real Estate Group Spacious Four Bedroom Brick Colonial
Housing Supply Overview
 Housing Supply Overview A RESEARCH TOOL PROVIDED BY SOUTH CAROLINA REALTORS May 2015 The last 12 months have seen a lot of buyer activity. Prices are up in most markets and buyers are hungry to purchase,
MARKET AREA UPDATE Year: 2017 Report as of: 1Q 2Q 3Q 4Q
 MARKET AREA UPDATE Year: 2017 Report as of: 1Q 2Q 3Q 4Q Market Area (City, State): Essex, Hunterdon, Middlesex, Morris, Somerset & Union Provided by (Company / Companies): BHHS New Jersey Properties Provided
April 2018 Washington, DC Market Trends Report Home sales up 9.4 percent; median sales price reaches highest April on record
 N FOR IMMEDIATE RELEASE Contact: Bobette Banks 301-590-8764 Director of Communications Greater Capital Area Association of REALTORS bbanks@gcaar.com April 2018 Washington, DC Market Trends Report Home
FEBRUARY 2019 Harrisonburg & Rockingham County Real Estate Market Report
 FEBRUARY 219 Real Estate Market Report An analysis of real estate activity through January 31, 219 provided courtesy of Scott P. Rogers, Funkhouser Real Estate Group Immaculate Brick Highland Park Colonial
DATA FOR SEPTEMBER Published October 13, Sales are down -9.7% month-over-month. The year-over-year comparison is at 0%.
 Permission is granted only to ARMLS Subscribers for reproduction with attribution on to ARMLS COPYRIGHT 2017. For questions regarding this publication contact Brand@ARMLS.com. DATA FOR SEPTEMBER 2017 -
CONTENTS. Executive Summary 1. Southern Nevada Economic Situation 2 Household Sector 5 Tourism & Hospitality Industry
 CONTENTS Executive Summary 1 Southern Nevada Economic Situation 2 Household Sector 5 Tourism & Hospitality Industry Residential Trends 7 Existing Home Sales 11 Property Management Market 12 Foreclosure
San Francisco Housing Market Update
 San Francisco Housing Market Update California Economic and Housing Market Outlook The national economy maintained a healthy growth rate in the first quarter of 2005 and appeared to be settling in for
Housing Supply Overview
 Housing Supply Overview A Research Tool Provided by the Greater San Diego Association of REALTORS December 2017 Quick Facts + 18.1% + 2.1% - 2.3% Inventory was again a driving metric in residential real
Q SOUTHWEST REGION
 Quarterly Indicators SOUTHWEST REGION Monthly Snapshot Includes the Durango Area Association of REALTORS, Four Corners Board of REALTORS, Pagosa Springs Area Association of REALTORS and the San Luis Valley
The Knox County HOUSING MARKET
 T E C H REPORT SERIES The Knox HOUSING MARKET Date: August 2007 For more information: MPC Contact Person: Bryan Berry 215-2500 MPC Website and e-mail www.knoxmpc.org contact@knoxmpc.org INTRODUCTION In
Vacancy Inches Higher, Despite Continued Absorption
 Research & Forecast Report GREATER PHOENIX OFFICE 1Q 2017 Vacancy Inches Higher, Despite Continued Absorption Key Takeaways > > Improving conditions in the Greater Phoenix office market took a pause in
Quick Facts. For Week Ending July 14, 2018 Publish Date: July 23, 2018 All comparisons are to % - 2.7% - 14.
 Weekly Market Report A RESEARCH TOOL FROM THE SAINT PAUL AREA ASSOCIATION OF REALTORS. BROUGHT TO YOU BY THE UNIQUE DATA-SHARING TRADITIONS OF THE REALTOR COMMUNITY For Week Ending July 14, 2018 Publish
Housing Supply Overview
 Housing Supply Overview A RESEARCH TOOL PROVIDED BY SOUTH CAROLINA REALTORS March 2017 Low supply and steadily rising rates and prices have been the story so far after the first quarter of the year zipped
SAN RAMON. Current prices for homes on the market Trends in pricing Current levels of supply and demand Value metrics
 East Bay LOCAL market update SAN RAMON Current prices for homes on the market Trends in pricing Current levels of supply and demand Value metrics Report for the week of 2008-02-08 Presented by The Harper-Mees
The My Listings to Expire report allows you to forecast which of your listings will expire in a time period specified.
 Statistics Statistics is the segment of the program where you can run numerous types of reports regarding your personal sales data, data for your office or company, or for MLS as a whole. The Statistics