2013 Year-End Market Report
|
|
|
- Patricia Dennis
- 6 years ago
- Views:
Transcription


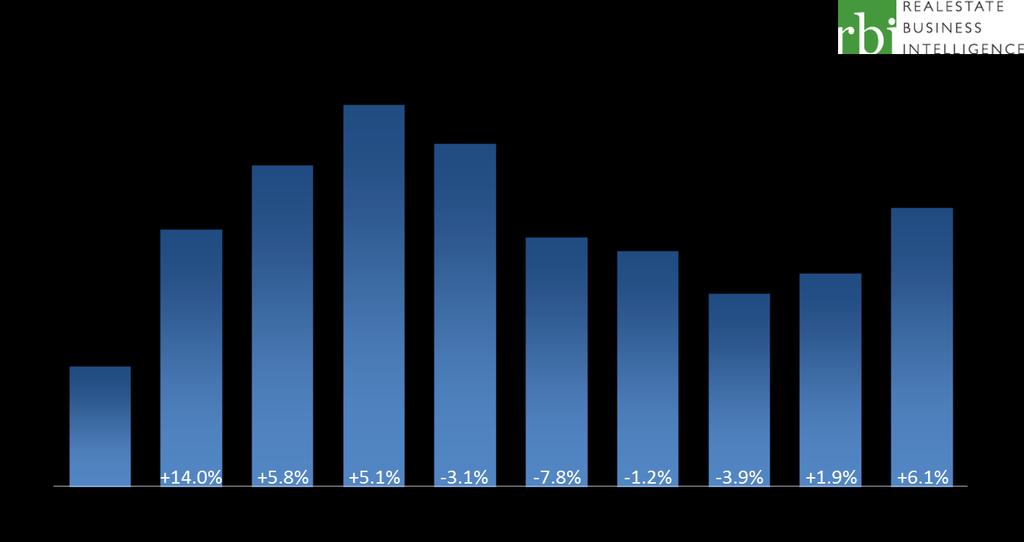
1 2013 Year-End Market Report The voice of real estate in Central Virginia CAAR Member Copy Expanded Edition Charlottesville Area Year-End 2013 Highlights: Yearly home sales in Greater Charlottesville were up 10% over 2012, marking the second straight year of double-digit gains. The median sales price in 2013 was the highest level since 2008 and was 6.1% higher than in The median sales price in Q was up 4.6% over Q4-2012, the third consecutive quarter with year-overyear gains. Half of homes sold in 2013 were on the market 54 days or less, the lowest median Days on Market since The median DOM in Q was 15 days lower than Q New listings were up 6.4% in Q compared to the same period in 2012, marking the fifth consecutive quarter with an annual gain. Active inventory at year end is 5.6% higher than year-end Home Sales There were 2,909 homes sold in the Greater Charlottesville area in 2013, which was up 10.1% (+266 sales) from This marked the second year in a row with significant gains in sales activity as the 2012 total was 14.9% higher than While the 601 sales in the 4 th Quarter represented a 1% decline from Q4-2012, the prior two quarters had double-digit annual gains, +11.2% in Q2 and +25.9% in Q3.
 showed a modest annual decrease while Charlottesville s total was virtually identical to 2012 (-0.2%).")

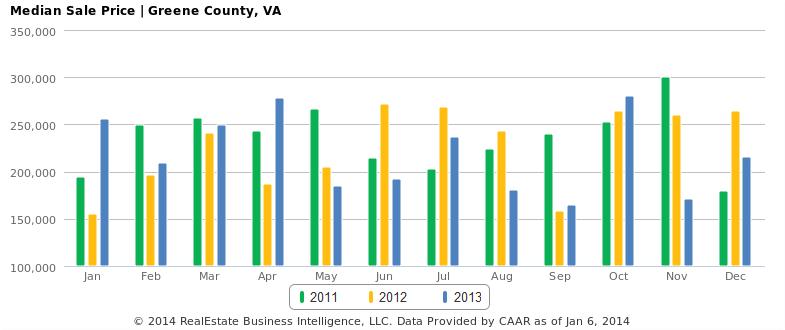
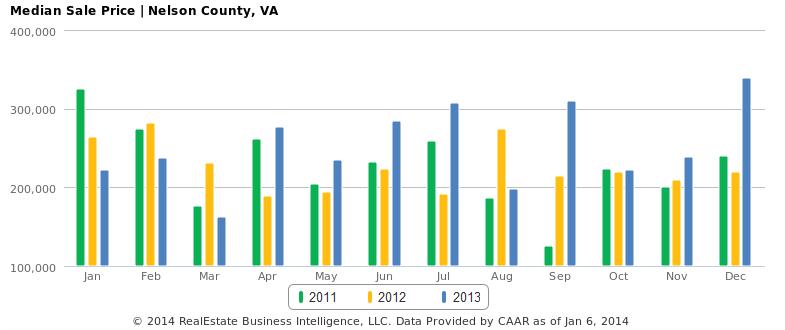
2 For the year, Louisa (+35.6%), Nelson (+28.5%), Albemarle (+11.2%) and Fluvanna (+6.1%) had sales increases compared to Greene (-1.9%) showed a modest annual decrease while Charlottesville s total was virtually identical to 2012 (-0.2%). Days on Market (DOM) As housing demand grew and interest rates remained low, the average length of time properties were on market has improved compared to recent years. Half of homes sold in 2013 were on the market 54 days or less, 18 days fewer than median DOM in Average DOM was 121 days, 23 days lower than last year s level. Five of the six counties had lower median DOM than 2012, with Louisa (+5 days) being the exception. Charlottesville homes sold the fastest, with half the homes sold in one month (31 days) or less. Albemarle had the second lowest level at 38 days. Louisa had a median DOM of 69 days while Greene and Fluvanna both had an 81-day level. Homes were on the market longest in Nelson County with median DOM of 153 days, however this was 47 days shorter compared to Copyright 2014 RealEstate Business Intelligence, LLC. Data provided by CAAR as of January 6, 2014
. By contrast, only four of 12 months in 2012 had more new listings than the previous year.")
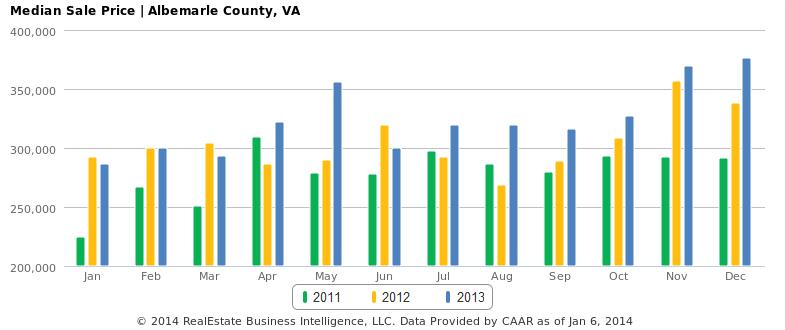
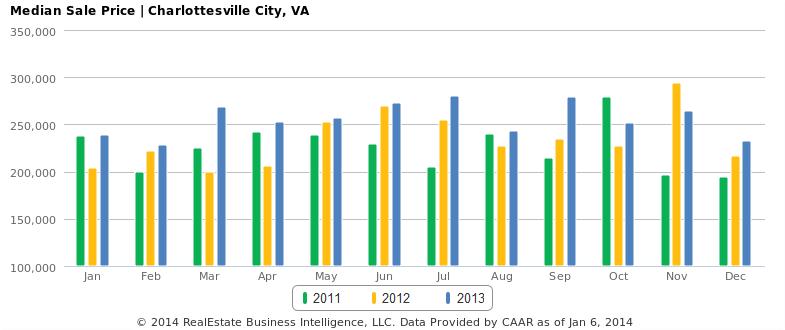
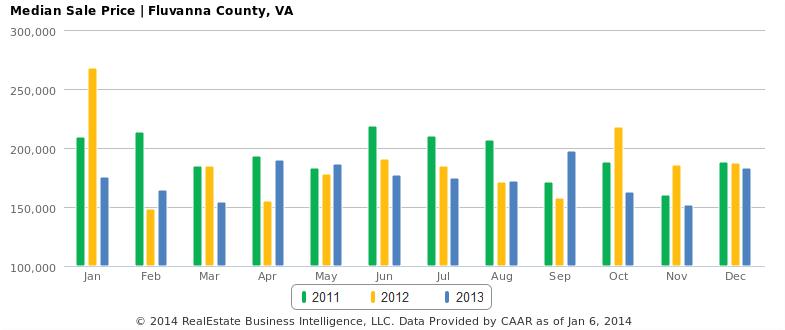
3 Inventory While 2013 marked the second consecutive year with double-digit gains in home sales, a new pattern began to emerge in supply: gains in inventory. Eleven of 12 months in 2013 saw more new listings added than in 2012 (November was the only exception). By contrast, only four of 12 months in 2012 had more new listings than the previous year. While 2012 posted a year-over-year decline of 5.9% in new listings, 2013 listings were up 8.7%. Though the monthly absorption rate grew in 2013, this uptick in listing activity ultimately led to year-over-year gains in the inventory level, beginning in August There are 1,850 active listings at year end, 5.6% higher than this time last year when there were 1,752 active listings. Home Prices First Quarter median sales price in Greater Charlottesville appeared bottomed out at the lowest quarterly level since 2004 ($227,500), improving market conditions through the rest of the year, ultimately resulted in a 6.1% annual gain for the year. The $265,000 median sales price in 2013 represented the highest level since With consistent gains over the last three quarters, homeowners in the region are experiencing a positive trend. Recording double-digit gains in sales activity and several consecutive quarters of growth shows a solid Central Virginia real estate industry, says CAAR 2014 President John Ince. Albemarle (+9.6%) had the largest annual gain in median sales price in Charlottesville (+6.8%) and Nelson (+5.1%) also saw increases in pricing. Louisa (-1.6%), Greene (-2.6%) and Fluvanna (-5.6%) saw slight decreases in median sales price.

4
5
6
 and Charlottesville (94.5%) led the region in this indicator.")

7 Pricing Not surprisingly, the average percent of original list price sellers received at sale was higher in 2013 than 2012, with the average sales-to-original-list-price ratio up to 93.5% from 91.7%. This was the highest yearly level in Greater Charlottesville since Albemarle (94.9%) and Charlottesville (94.5%) led the region in this indicator. Nelson (88%) had the lowest level, though the county s 88% mark was 4.1 points higher than its 83.9% level in Five of the six jurisdictions saw increases in the average sales-to-original-list price ratio, the only exception being Louisa, which was unchanged at 93.1%. Attached vs. Detached Homes The median sales price for detached homes in Greater Charlottesville in 2013 was up 2.3% from 2012 to $285,000 while the median price for attached homes rose 12.5% to $213,750. The 690 attached homes sold in 2013 represented a 7.6% increase compared to 2012, while the 2,219 detached home sales represented an annual gain of 10.8%. Attached homes sold more quickly, with an average DOM of 112 days and a median DOM of 46. Detached homes sold in 124 days on average, with a median DOM of 58. Year-End Housing Metrics [Greater Charlottesville Area]
![Year-End Housing Metrics [Greater Charlottesville Area] Statistical comparisons are performed using "snapshots" to allow for data to be compared to each other in a consistent fashion.](/docs-images/71/65572652/images/8-0.jpg "Similar timelines for the data are used to create the snapshots, allowing an accurate comparison to be made.")
8 Year-End Housing Metrics [Greater Charlottesville Area] Statistical comparisons are performed using "snapshots" to allow for data to be compared to each other in a consistent fashion. Similar timelines for the data are used to create the snapshots, allowing an accurate comparison to be made. If you plan to sell a home in 2014, be sure to have a REALTOR prepare a comparative market analysis (CMA) so that you can price it to sell. And, if you are looking to buy, a REALTOR can help you understand the current market and evaluate your options. This 2013 Year-End Market Report is produced by the Charlottesville Area Association of REALTORS using data from the CAAR MLS. For more information on this report or the real estate market, pick up a copy of the CAAR Real Estate Weekly, visit or contact your REALTOR.
rd Quarter Market Report
 2012 3 rd Quarter Market Report The voice of real estate in Central Virginia CAAR Member Copy Expanded Edition Charlottesville Area 3 rd Quarter 2012 Highlights: Overall sales in Greater Charlottesville
nd Quarter Market Report
 2015 2 nd Quarter Market Report The voice of real estate in Central Virginia CAAR Member Copy Expanded Edition Charlottesville Area 2 nd Quarter 2015 Highlights: Closed sales in the Greater Charlottesville
See Full Corridor Study Volumes I and II as separate attachments.
 See Full Corridor Study Volumes I and II as separate attachments. See Housing Values 2000-2010 and 2000-2013 as separate attachments. 2013 2 nd Quarter and Mid-Year Market Report The voice of real estate
2015 First Quarter Market Report
 2015 First Quarter Market Report CAAR Member Copy Expanded Edition Charlottesville Area First Quarter 2015 Highlights: Median sales price for the region was up 5.1% over Q1-2014, rising from $244,250 to
CAAR Market Report 2010 Mid-Year Published by the Charlottesville Area Association of REALTORS
 CAAR Market Report 2010 Mid-Year Published by the Charlottesville Area Association of REALTORS Where Are We Now? The pace of home purchases in the Charlottesville market area showed a significant increase
Year to Date (thru June)
") CAAR Market Report 2009 Mid-Year Published by the Charlottesville Area Association of REALTORS Where Are We Now? The pace of home purchases in the Charlottesville area continues to improve from the dismal
CAAR Market Report 2009 Mid-Year Published by the Charlottesville Area Association of REALTORS Where Are We Now? The pace of home purchases in the Charlottesville area continues to improve from the dismal
February 2016 Loudoun County Market Trends Report Contracts and sales activity jump double-digits; Inventories down 15.5 percent
 FOR IMMEDIATE RELEASE Contact: Christine Windle 703-777-2468, cwindle@dullesarea.com Sponsored by: Access National Bank Tom Ciolkosz, (703) 871-1045, tciolkosz@accessnationalbank.com Patty Foster, 703-871-1014,
CAAR Market Report 2010 First Quarter Published by the Charlottesville Area Association of REALTORS
 CAAR Market Report 2010 First Quarter Published by the Charlottesville Area Association of REALTORS Where Are We Now? In the first quarter of 2010, the Charlottesville real estate market continued the
FOR IMMEDIATE RELEASE Contact: Bobette Banks Director of Communications Greater Capital Area Association of REALTORS
 FOR IMMEDIATE RELEASE Contact: Bobette Banks 301-590-8764 Director of Communications Greater Capital Area Association of REALTORS bbanks@gcaar.com November 2015 Washington, DC Market Trends Report Median
January 2018 Loudoun County Market Trends Report Inventory has another record low month; home sales continue to decline compared to last year.
 FOR IMMEDIATE RELEASE Contact: Brenda Morton 703 777 2468 Dulles Area Association of REALTORS bmorton@dullesarea.com January 2018 Loudoun County Market Trends Report Inventory has another record low month;
FOR IMMEDIATE RELEASE Contact: Brenda Morton Dulles Area Association of REALTORS
 FOR IMMEDIATE RELEASE Contact: Brenda Morton 703 777 2468 Dulles Area Association of REALTORS bmorton@dullesarea.com August 2018 Loudoun County Market Trends Report Despite persistent low inventory, sales
2007 Sales (thru September)
") Third Quarter Market Report Challenges, Opportunities, and Surprises, Oh My! By Dave Phillips, CEO Charlottesville Area Association of REALTORS Someone named Anonymous once said, "Many an opportunity is
Third Quarter Market Report Challenges, Opportunities, and Surprises, Oh My! By Dave Phillips, CEO Charlottesville Area Association of REALTORS Someone named Anonymous once said, "Many an opportunity is
May 2018 Loudoun County Market Trends Report Tight inventory continues while price growth stagnates; Condo sales hit a record high.
 FOR IMMEDIATE RELEASE Contact: Brenda Morton 703 777 2468 Dulles Area Association of REALTORS bmorton@dullesarea.com May 2018 Loudoun County Market Trends Report Tight inventory continues while price growth
FOR IMMEDIATE RELEASE Contact: Brenda Morton Dulles Area Association of REALTORS
 FOR IMMEDIATE RELEASE Contact: Brenda Morton 703 777 2468 Dulles Area Association of REALTORS bmorton@dullesarea.com February 2018 Loudoun County Market Trends Report Inventory reaches yet another record
May 2016 Loudoun County Market Trends Report Homes selling twice as fast as 2015 with re-emergence of seller s market
 FOR IMMEDIATE RELEASE Contact: Christine Windle 703-777-2468 Dulles Area Association of REALTORS cwindle@dullesarea.com Sponsored by: Access National Bank Tom Ciolkosz, (703) 871-1045, tciolkosz@accessnationalbank.com
Single Family Sales Maine: Units
 Maine Home Connection 19 Commercial St Portland, Maine 04101 MaineHomeConnection.com Office: (207) 517-3100 Email: Info@MaineHomeConnection.com For the fourth consecutive year, Maine home sales set a new
2008 Mid-Year CAAR Market Report Real Estate Market is as Hot as ANWR
 2008 Mid-Year CAAR Market Report Real Estate Market is as Hot as ANWR By Dave Phillips, CEO Charlottesville Area Association of REALTORS Just about everything in life is relative to your perspective. Based
August 2015 Washington, DC Market Trends Report Limited supply, high demand continue pushing prices to record highs
 FOR IMMEDIATE RELEASE Contact: Bobette Banks 301-590-8764 Director of Communications Greater Capital Area Association of REALTORS bbanks@gcaar.com August 2015 Washington, DC Market Trends Report Limited
September 2018 Loudoun County Market Trends Report Inventory continues to tighten as prices increase and closed sales decline
 FOR IMMEDIATE RELEASE Contact: Brenda Morton 703 777 2468 Dulles Area Association of REALTORS bmorton@dullesarea.com September 2018 Loudoun County Market Trends Report Inventory continues to tighten as
CAAR Market Report. Greater Charlottesville Area. Q Quick Facts + 3.5% + 8.0% %
 CAAR Market Report Includes the city of Charlottesville and the counties of Albemarle, Fluvanna, Greene, Louisa and Nelson. Quick Facts + 3.5% + 8.0% We can comfortably consider the first quarter to have
November 2017 Loudoun County Market Trends Report Inventory decline persists as total and new listings are down; Sales growth continues to drop
 FOR IMMEDIATE RELEASE Contact: Brenda Morton 703 777 2468 Dulles Area Association of REALTORS bmorton@dullesarea.com November 2017 Loudoun County Market Trends Report Inventory decline persists as total
Charlottesville Housing Market Report Year-End (Published by the Charlottesville Area Association of REALTORS )
") Charlottesville Housing Market Report - 2009 Year-End (Published by the Charlottesville Area Association of REALTORS ) This Quarterly Market Report is produced by the Charlottesville Area Association of
Charlottesville Housing Market Report - 2009 Year-End (Published by the Charlottesville Area Association of REALTORS ) This Quarterly Market Report is produced by the Charlottesville Area Association of
Q Quick Facts + 7.5% + 1.6% - 8.6%
 CAAR Market Report Includes the city of Charlottesville and the counties of Albemarle, Fluvanna, Greene, Louisa and Nelson. Quick Facts + 7.5% + 1.6% Housing markets across the nation are most assuredly
March 2016 Washington, DC Market Trends Report March sales represent a 12 percent increase; top the five-year March average
 FOR IMMEDIATE RELEASE Contact: Bobette Banks 301-590-8764 Director of Communications Greater Capital Area Association of REALTORS bbanks@gcaar.com March 2016 Washington, DC Market Trends Report March sales
Q Quick Facts - 3.2% 0.0% %
 CAAR Market Report Includes the city of Charlottesville and the counties of Albemarle, Fluvanna, Greene, Louisa and Nelson. Home prices were consistently up again in most markets in 2018 but at reduced
st Quarter Market Report A Recipe That s Hard to Swallow
 2008 1 st Quarter Market Report A Recipe That s Hard to Swallow By Dave Phillips, CEO Charlottesville Area Association of REALTORS Have you ever stood in your kitchen, felt a creative surge and decided
MARKET AREA UPDATE Report as of: 1Q 2Q 3Q 4Q
 MARKET AREA UPDATE Report as of: 1Q 2Q 3Q 4Q Year: 2013 Market Area (City, State): Washington DC Metropolitan Area Provided by (Company / Companies): LONG & FOSTER REAL ESTATE, INC. What are the most significant
May 2016 Montgomery County Market Trends Report Double-digit gains in closed sales, exceeding the five-year May average
 FOR IMMEDIATE RELEASE Contact: Bobette Banks 301-590-8764 Director of Communications Greater Capital Area Association of REALTORS bbanks@gcaar.com May 2016 Montgomery County Market Trends Report Double-digit
August 2017 Loudoun County Market Trends Report Sales Price Reaches Record High; Sales Decline; Inventory Remains Low
 FOR IMMEDIATE RELEASE Contact: Christine Windle 703 777 2468 Dulles Area Association of REALTORS cwindle@dullesarea.com August 2017 Loudoun County Market Trends Report Sales Price Reaches Record High;
FOR IMMEDIATE RELEASE Contact: Bobette Banks Director of Communications Greater Capital Area Association of REALTORS
 FOR IMMEDIATE RELEASE Contact: Bobette Banks 301-590-8764 Director of Communications Greater Capital Area Association of REALTORS bbanks@gcaar.com April 2016 Washington, DC Market Trends Report Sales and
May 2008 MLS Month in Review
 May 28 MLS Month in Review The Albuquerque Market continues to improve, and it s evident that finally, the negative media is turning into positive media. This month s TOP Selling Price Range is $2K to
DATA FOR MAY Published June 23, Sales are up +11.3% month-over-month. The year-over-year comparison shows an increase of +11.1%.
 Permission is granted only to ARMLS Subscribers for reproduction with attribution on to ARMLS COPYRIGHT 2017. For questions regarding this publication contact Brand@ARMLS.com. DATA FOR MAY 2017 - Published
The Desert Housing Report. Coachella Valley Median Detached Home Price March March 2019 $392,000 $415,000
 Median Price $450,000 $400,000 $350,000 $300,000 $250,000 $200,000 $150,000 Coachella Valley Median Detached Home Price March 2002 - $392,000 $415,000 CV Detached Median Price Summary 4% Growth Curve The
The Corcoran Report 4Q16 MANHATTAN
 The Corcoran Report 4Q16 MANHATTAN Contents Fourth Quarter 2016 4/7 12/23 3 Overview 8 9 10 Market Wide 11 Luxury 24 2 Sales / Days on Market 3 Inventory / Months of Supply 4 5 Market Share Resale Co-ops
Washington, D.C. Metro Area December 2017 Housing Market Update
 Washington, D.C. Metro Area December 2017 Housing Market Update Washington D.C. Metro housing market closes out 2017 with record high December house price of $420,050; December inventories decline for
MARKET AREA UPDATE Report as of: 1Q 2Q 3Q 4Q
 Year: 2013 Market Area (City, State): Baltimore Metropolitan Area MARKET AREA UPDATE Report as of: 1Q 2Q 3Q 4Q Provided by (Company / Companies): LONG & FOSTER REAL ESTATE, INC. What are the most significant
The Market Watch Monthly Housing Report. Coachella Valley Median Detached Home Price Dec Dec 2016
 The Market Watch Monthly Housing Report Median Price $450,000 Coachella Valley Median Detached Home Price Dec 2002 - Dec 2016 $400,000 $350,000 $300,000 $339,930 $340,000 $250,000 $200,000 $150,000 CV
MARKET IN A MINUTE A SUMMARY OF MARKET CONDITIONS FOR SEPTEMBER & 3rd QUARTER 2017
 STATPAK LOUDOUN COUNTY OCTOBER 2017 McEnearney.com MARKET IN A MINUTE A SUMMARY OF MARKET CONDITIONS FOR SEPTEMBER & 3rd QUARTER 2017 Contract activity in September 2017 was up just 0.6% from September
Market Trends Generated on 04/24/2018 Page 1 of Alpaca St, South El Monte, CA , Los Angeles County.
 9743 Alpaca St, South El Monte, CA 91733-3028, Los Angeles County Pricing Trends Median Sale Price to Current Value - Tax The percentage of properties that have increased or decreased in value based on
ECONOMIC CURRENTS. Vol. 3, Issue 1. THE SOUTH FLORIDA ECONOMIC QUARTERLY Introduction
 ECONOMIC CURRENTS THE SOUTH FLORIDA ECONOMIC QUARTERLY Introduction Economic Currents provides an overview of the South Florida regional economy. The report contains current employment, economic and real
Baltimore, MD Metro Area September 2017 Housing Market Update
 Baltimore, MD Metro Area September 2017 Housing Market Update Baltimore Metro median sales price of $253,000 is near September record; Active inventories decline by 11.4% to lowest September level of the
DATA FOR OCTOBER Published November 14, Sales are down -0.8% month-over-month. The year-over-year comparison is at 4.1%.
 Permission is granted only to ARMLS Subscribers for reproduction with attribution on to ARMLS COPYRIGHT 2017. For questions regarding this publication contact Brand@ARMLS.com. DATA FOR OCTOBER 2017 - Published
May 2016 Washington, DC Market Trends Report Listings continue to move quickly as sales climb nearly 14 percent
 FOR IMMEDIATE RELEASE Contact: Bobette Banks 301-590-8764 Director of Communications Greater Capital Area Association of REALTORS bbanks@gcaar.com May 2016 Washington, DC Market Trends Report Listings
STATPAK MARKET IN A MINUTE A SUMMARY OF MARKET CONDITIONS FOR JULY McEnearney.com CONTRACTS URGENCY INDEX INVENTORY INTEREST RATES AFFORDABILITY
 STATPAK LOUDOUN COUNTY AUGUST 2017 McEnearney.com MARKET IN A MINUTE A SUMMARY OF MARKET CONDITIONS FOR JULY 2017 Contract activity in July 2017 was down 8.7% from July 2016, and there were decreases in
MARKET AREA UPDATE Report as of: 1Q 2Q 3Q 4Q
 MARKET AREA UPDATE Report as of: 1Q 2Q 3Q 4Q Year: 2014 Market Area (City, State): Washington DC Metropolitan Area Provided by (Company / Companies): LONG & FOSTER REAL ESTATE, INC. What are the most significant
PRINCE GEORGE S COUNTY JULY 2018
 STATPAK PRINCE GEORGE S COUNTY JULY 2018 McEnearney.com MARKET IN A MINUTE A SUMMARY OF MARKET CONDITIONS FOR JUNE & FIRST HALF 2018 Contract activity in June 2018 was up 16.4% from June 2017, and through
The Canadian Real Estate Association News Release
 According to statistics 1 released today by The Canadian Real Estate Association (CREA), national home sales posted their third monthly increase and broke all previous monthly records. Highlights: The
Austin-area home prices set August record, outpace household income growth in August 2015
 Austin-area home prices set August record, outpace household income growth in August 2015 Market Reports Austin Board of REALTORS releases real estate statistics for August 2015 AUSTIN, Texas September
Pikes Peak area housing Market Statistics (As of: 2/28/2018)
") Jan-1-1 -1-1 Jan-2-2 -2-2 Jan-3-3 -3-3 -4-4 -4-5 -5-5 -6-6 -6-7 -7-7 -8-8 -8-9 -9-9 -1-1 -1-11 -11-11 -12-12 -12-13 -13-13 -14-14 -14-15 -15-15 -16-16 -16-17 -17-17 Jan-1-1 -1-1 Jan-2-2 -2-2 Jan-3-3 -3-3
Jan-1-1 -1-1 Jan-2-2 -2-2 Jan-3-3 -3-3 -4-4 -4-5 -5-5 -6-6 -6-7 -7-7 -8-8 -8-9 -9-9 -1-1 -1-11 -11-11 -12-12 -12-13 -13-13 -14-14 -14-15 -15-15 -16-16 -16-17 -17-17 Jan-1-1 -1-1 Jan-2-2 -2-2 Jan-3-3 -3-3
Coachella Valley Median Detached Home Price Jan Jan 2017
 The Desert Housing Report Median Price $450,000 Coachella Valley Median Detached Home Price Jan 2002 - Jan 2017 $400,000 $350,000 $300,000 $250,000 $335,000 $340,000 $200,000 $150,000 CV Detached Median
Economic Spotlight September 1, 2009
 Economic Spotlight September 1, 29 Update on Alberta s Housing Market Summary Alberta s housing market is beginning to show signs of recovery. Housing starts have rebounded from March lows and activity
HOUSING NOW Canada. Highlights SUBSCRIBE NOW! Table of Contents. Housing market intelligence you can count on
 Housing Market Information HOUSING NOW Canada Date Released: April 2015 Highlights Housing starts were trending 1 at 179,016 units in March compared to 180,236 in February. The stand-alone monthly SAAR
Ottawa Residential Unit Sales
 Ottawa Residential Unit Sales The chart above compares the monthly residential MLS unit sales for the current year to those of the previous year. The light grey line shows the residential sales trend by
Pikes Peak area housing Market Statistics (As of: 9/30/2018)
") $156,25 $184, $174,697 $177,2 $21,53 $185,83 $173, $178,29 $172,25 $212,75 $21,95 $226,692 $197,5 $199, $196, $28, $25, $223,95 $216,75 $29,527 $234,9 $218,82 $229,74 $235,518 $231,457 $255, $259,11 $269,98
$156,25 $184, $174,697 $177,2 $21,53 $185,83 $173, $178,29 $172,25 $212,75 $21,95 $226,692 $197,5 $199, $196, $28, $25, $223,95 $216,75 $29,527 $234,9 $218,82 $229,74 $235,518 $231,457 $255, $259,11 $269,98
STATPAK MARKET IN A MINUTE A SUMMARY OF MARKET CONDITIONS FOR APRIL McEnearney.com CONTRACTS URGENCY INDEX INVENTORY INTEREST RATES
 STATPAK WASHINGTON, DC MAY 2018 McEnearney.com MARKET IN A MINUTE A SUMMARY OF MARKET CONDITIONS FOR APRIL 2018 Contract activity in April 2018 was up 9.4% from April 2017, and four of the six price categories
Housing Indicators in Tennessee
 Housing Indicators in l l l By Joe Speer, Megan Morgeson, Bettie Teasley and Ceagus Clark Introduction Looking at general housing-related indicators across the state of, substantial variation emerges but
APARTMENT MARKET TRENDS
 VOLUME 21 1ST QUARTER 2018 Featuring data from the Center for Business and Economic Research The Las Vegas apartment market saw a slight increase in the average asking rent and an increase the vacancy
MONTGOMERY COUNTY JULY 2018
 STATPAK MONTGOMERY COUNTY JULY 2018 McEnearney.com MARKET IN A MINUTE A SUMMARY OF MARKET CONDITIONS FOR JUNE & FIRST HALF 2018 Contract activity in June 2018 was up 1.2% from June 2017, solely because
November 2017 Montgomery County Market Trends Report Median sales price up slightly as median days on market quickens
 FOR IMMEDIATE RELEASE Contact: Bobette Banks 301-590-8764 Director of Communications Greater Capital Area Association of REALTORS bbanks@gcaar.com November 2017 Montgomery County Market Trends Report Median
RESIDENTIAL MARKET ANALYSIS
 RESIDENTIAL MARKET ANALYSIS CLANCY TERRY RMLS Student Fellow Master of Real Estate Development Candidate Oregon and national housing markets both demonstrated shifting trends in the first quarter of 2015
Las Vegas Valley Executive Summary
 ARROYO MARKET SQUARE Las Vegas Valley Executive Summary Retail Market 4th Quarter 2013 THE DISTRICT AT GREEN VALLEY RANCH January 23, 2014 Re: Commercial Real Estate Survey: 4th Quarter, 2013 Dear Reader,
MONTGOMERY COUNTY APRIL 2018
 STATPAK MONTGOMERY COUNTY APRIL 2018 McEnearney.com MARKET IN A MINUTE A SUMMARY OF MARKET CONDITIONS FOR MARCH 2018 Contract activity in March 2018 was down 6.0% from March 2017, and there were decreases
MLS of Greater Cincinnati - Charts for the Month: November 2017
 MLS of Greater Cincinnati - Charts for the Month: November 2017 The following charts provide an overview of what has occurred in the MLS over the past month. Each chart provides a historical trend. The
SECOND QUARTER 2007 QUARTERLY MARKET REPORT
 SECOND QUARTER 2007 QUARTERLY MARKET REPORT QUARTERLY MARKET REPORT Manhattan The average sale price for Manhattan apartments set a new record in the second quarter, reaching $1,300,212. This figure was
Manhattan New Dev. Market Report st Quarter mns.com
 Manhattan New Dev. Market Report 2013 1st Quarter TABLE OF CONTENTS Manhattan New Development Report 1Q13 TABLE OF CONTENTS 03 Introduction 04 Market Snapshot 09 Neighborhood Trends 09 Battery Park City
THE SWEARINGEN REPORT VICTORIA MLS
 THE SWEARINGEN REPORT VICTORIA MLS Current Observations: Victoria at a Crossroads -This month's comments are from The Texas A&M Real Estate Center article dated Sept 5, 218. More than a year after Hurricane
DATA FOR APRIL Published May 15, Sales are down -4.4% month-over-month. The year-over-year comparison is up +3.7%. ARMLS STAT APRIL 2018
 Permission is granted only to ARMLS Subscribers for reproduction with attribution on to ARMLS COPYRIGHT 2018. For questions regarding this publication contact Brand@ARMLS.com. DATA FOR APRIL 2018 - Published
ALBERTA ECONOMIC & MARKET UPDATE
 JANUARY 2018 ALBERTA ECONOMIC & MARKET UPDATE ECONOMIC INDICATORS As Alberta s economy continued to improve in 2017, population growth also started to recover as fewer residents were moving to other provinces.
Monthly Indicators + 8.8% + 9.0% % Market Overview New Listings Pending Sales. Closed Sales. Days on Market Until Sale. Median Sales Price
 Monthly Indicators 2017 The facts of residential real estate have remained consistent in 2017. In year-overyear comparisons, the number of homes for sale has been fewer in most locales, and homes have
Manhattan New Dev. Market Report th Quarter mns.com
 Manhattan New Dev. Market Report 2012 4th Quarter TABLE OF CONTENTS TABLE OF CONTENTS 03 Introduction 04 Market Snapshot 09 Neighborhood Trends 09 Battery Park City 10 Chelsea 11 East Village 12 Financial
Market Report. Manhattan Q Significant findings in Q3 2008
 Market Report StreetEasy is pleased to present our Quarterly Report on the residential market, starting with a special section called Market Snapshot. While the bulk of the report is based on over 4,500
ALBERTA ECONOMIC & MARKET UPDATE
 ALBERTA ECONOMIC & MARKET UPDATE OCTOBER 2017 ECONOMIC INDICATORS Continued net losses of interprovincial migrants slowed population growth in Alberta during the second quarter. The province failed to
Monthly Indicators - 8.0% + 4.2% - 3.4% Activity Overview New Listings Pending Sales. Closed Sales. Days on Market Until Sale. Median Sales Price
 Monthly Indicators 2018 If the last few months are an indication of the temperature of housing markets across the country, a period of relative calm can be expected during the last three months of the
MARKET AREA UPDATE Year: 2017 Report as of: 1Q 2Q 3Q 4Q
 MARKET AREA UPDATE Year: 2 Report as of: 1Q 2Q 3Q 4Q Market Area (City, State): Fort Myers/Cape Coral, Florida Provided by (Company / Companies): Real Estate Provided by RDC Member(s): What are the most
The Canadian Real Estate Association News Release
 The Canadian Real Estate Association News Release Canadian home sales push higher in February Ottawa, ON, March 15, 2016 According to statistics 1 released today by The Canadian Real Estate Association
STATPAK MARKET IN A MINUTE A SUMMARY OF MARKET CONDITIONS FOR JANUARY McEnearney.com CONTRACTS URGENCY INDEX INVENTORY INTEREST RATES
 STATPAK LOUDOUN COUNTY FEBRUARY 2018 McEnearney.com MARKET IN A MINUTE A SUMMARY OF MARKET CONDITIONS FOR JANUARY 2018 Contract activity in January 2018 was down just 2.0% from January 2017, but that is
Monthly Indicators - 6.8% + 5.8% % Activity Overview New Listings Pending Sales. Closed Sales. Days on Market Until Sale. Median Sales Price
 Monthly Indicators 218 Some economy observers are pointing to 218 as the final period in a long string of sentences touting several happy years of buyer demand and sales excitement for the housing industry.
STATPAK MARKET IN A MINUTE A SUMMARY OF MARKET CONDITIONS FOR FEBRUARY McEnearney.com CONTRACTS URGENCY INDEX INVENTORY INTEREST RATES
 STATPAK LOUDOUN COUNTY MARCH 2018 McEnearney.com MARKET IN A MINUTE A SUMMARY OF MARKET CONDITIONS FOR FEBRUARY 2018 Contract activity in February 2018 was almost unchanged, up just 0.2% from February
MARKET IN A MINUTE A SUMMARY OF MARKET CONDITIONS FOR MARCH & 1st QUARTER 2016
 STATPAK ` WASHINGTON, DC APRIL 2016 MARKET IN A MINUTE A SUMMARY OF MARKET CONDITIONS FOR MARCH & 1st QUARTER 2016 Contract activity in March 2016 was up 12.6% from March of 2015, and there were increases
Q B O S T O N M A R K E T R E P O R T
 Q 3 2 1 7 B O S T O N M A R K E T R E P O R T Introducing the Compass Q3 217 Greater Boston Market Report Page 2 Page 3 Page 5 Page 7 Page 8 Map of Coverage Area Single Family Overview Condo Overview Time
The Desert Housing Report. Coachella Valley Median Detached Home Price December December 2018
 Median Price $450,000 $400,000 Coachella Valley Median Detached Home Price December 2002 - $369,450 $389,944 $350,000 $300,000 $250,000 $200,000 $150,000 CV Detached Median Price 4% Growth Curve Summary
ASSOCIATION OF REGINA REALTORS INC.
 ASSOCIATION OF REGINA REALTORS INC. 1854 McIntyre Street Regina, Sask. S4P P9 Ph: 791-7 Fax: 781-794 www.reginarealtors.com For immediate release April 3, 18 RESIDENTIAL SALES SLIDE MARKS END OF 1 ST QUARTER
MARKET AREA UPDATE Report as of: 1Q 2Q 3Q 4Q
 MARKET AREA UPDATE Report as of: 1Q 2Q 3Q 4Q Year: 2013 Market Area (City, State): Arlington, Virginia Provided by (Company / Companies): McEnearney Associates, Inc. Realtors What are the most significant
Manhattan New Dev. Market Report th Quarter mns.com
 Manhattan New Dev. Market Report 2015 4th Quarter TABLE OF CONTENTS Manhattan New Development Report 4Q15 TABLE OF CONTENTS 03 Introduction 04 Market Snapshot 09 Neighborhood Trends 09 Battery Park City
STATPAK MARKET IN A MINUTE A SUMMARY OF MARKET CONDITIONS FOR JULY McEnearney.com CONTRACTS URGENCY INDEX INVENTORY INTEREST RATES AFFORDABILITY
 STATPAK WASHINGTON, DC AUGUST 2018 McEnearney.com MARKET IN A MINUTE A SUMMARY OF MARKET CONDITIONS FOR JULY 2018 Contract activity in July 2018 was up just 0.5% from July 2017. Through the first seven
STATPAK MARKET IN A MINUTE A SUMMARY OF MARKET CONDITIONS FOR MAY McEnearney.com CONTRACTS URGENCY INDEX INVENTORY INTEREST RATES AFFORDABILITY
 STATPAK WASHINGTON, DC JUNE 2017 McEnearney.com MARKET IN A MINUTE A SUMMARY OF MARKET CONDITIONS FOR MAY 2017 Contract activity in May 2017 was up 2.9% from May 2016, and there were increases for the
ASSOCIATION OF REGINA REALTORS INC.
 ASSOCIATION OF REGINA REALTORS INC. 1854 McIntyre Street Regina, Sask. S4P P9 Ph: 791-7 Fax: 781-794 www.reginarealtors.com For immediate release November 5, OCTOBER RESIDENTIAL SALES YIELD MIXED RESULTS
The Corcoran Report 4Q17 TOWN OF PALM BEACH & BARRIER ISLANDS
 The Corcoran Report 4Q17 TOWN OF PALM BEACH & BARRIER ISLANDS Town of Palm Beach 19 $8.379M $5.717M 19% 102% 92% 52 $607K $364K -7% WEB# 5301358 on corcoran.com 14% 2017 4Q Corcoran Report Palm Beach In
The Knox County HOUSING MARKET
 T E C H REPORT SERIES The Knox HOUSING MARKET Date: August 2007 For more information: MPC Contact Person: Bryan Berry 215-2500 MPC Website and e-mail www.knoxmpc.org contact@knoxmpc.org INTRODUCTION In
HOUSING MARKET OUTLOOK Calgary CMA
 H o u s i n g M a r k e t I n f o r m a t i o n HOUSING MARKET OUTLOOK Calgary CMA C a n a d a M o r t g a g e a n d H o u s i n g C o r p o r a t i o n Date Released: Fall 2011 NEW HOME MARKET Total housing
REINZ statistics: Auckland price growth slowing, regional strong growth continues
 13 July 2017 For immediate release REINZ statistics: price growth slowing, regional strong growth continues New Zealand s property market is showing all the signs of being a two-tier market with median
Jackson County Residental Market Trends. October Pending Sales New Listings
 Jackson County Residental Market Trends October 2015 Pending Sales..2 New Listings..3 Overall activity trends are not a measure of pricing or value for individual properties. Small Sampling sizes can lead
Connecticut Full Year Housing Report
 Connecticut 2014 Full Year Housing Report As 2014 Closes, Increasing Market Confidence Predicts a Solid Start to 2015 With an influx of Millennial, Gen X and Baby Boomer buyers, a strong spring market
Coachella Valley Median Detached Home Price Mar Mar 2018
 Median Price $450,000 Coachella Valley Median Detached Home Price Mar 2002 - Mar 2018 $392,000 $400,000 $366,285 $350,000 $300,000 $250,000 $200,000 $150,000 Media Detached Price 4% Growth Curve Summary
Monthly Indicators - 4.9% - 0.7% % Market Overview New Listings Pending Sales. Closed Sales. Days on Market Until Sale. Median Sales Price
 Monthly Indicators 2018 If the last few months are an indication of the temperature of housing markets across the country, a period of relative calm can be expected during the last three months of the
September 2017 Washington, DC Market Trends Report September median sales price drops 6.4 percent but still near record high
 FOR IMMEDIATE RELEASE Contact: Bobette Banks 301-590-8764 Director of Communications Greater Capital Area Association of REALTORS bbanks@gcaar.com September 2017 Washington, DC Market Trends Report September
THE AGGREGATE 2ND QUARTER 2017 TOWNRESIDENTIAL.COM A COMPREHENSIVE QUARTERLY ANALYSIS OF THE MANHATTAN MARKET BY TOWN RESIDENTIAL
 THE AGGREGATE TM 2ND QUARTER 2017 A COMPREHENSIVE QUARTERLY ANALYSIS OF THE MANHATTAN MARKET BY TOWN RESIDENTIAL Q2 2017 INTRODUCTION Welcome to The Aggregate, the quarterly residential market report published
Coachella Valley Median Detached Home Price May May 2018
 Median Price $450,000 $400,000 Coachella Valley Median Detached Home Price May 2002 - $389,000 $412,000 $350,000 $300,000 $250,000 $200,000 $150,000 CV Detached Median Price 4 % Growth Curve Summary The
CITI HABITATS. Manhattan Residential Sales Market Report
 Manhattan Residential Sales Market Report Contents 4/7 12/17 3 8 9 10 Market Wide 4 Sales / Days on Market 5 / Months of Supply 6 7 Market Share Resale Co-ops Resale Condos New Developments 11 Luxury Neighborhoods
MONTGOMERY COUNTY MAY 2018
 STATPAK MONTGOMERY COUNTY MAY 2018 McEnearney.com MARKET IN A MINUTE A SUMMARY OF MARKET CONDITIONS FOR APRIL 2018 Contract activity in April 2018 was up just 0.9% from, but there were increases in four