nd Quarter Market Report
|
|
|
- Karen Johnston
- 5 years ago
- Views:
Transcription


1 nd Quarter Market Report The voice of real estate in Central Virginia CAAR Member Copy Expanded Edition Charlottesville Area 2 nd Quarter 2015 Highlights: Closed sales in the Greater Charlottesville area up significantly 12.0% versus last year, with the 959 closed sales, marking the highest quarterly tally since Median sales price for the region increased 2.1% from Q2-2014, rising from $276,500 to $282,220. Half of the homes sold in the 2 nd Quarter were on the market 33 days or less, the lowest median days-onmarket since On average, sellers received 95.8% of original list price, up from 95.1% last year and the highest level since Active inventory is now 11.5% lower than last year, while purchase activity is high and new listings coming online are stable to 2014 levels. Data Source: CAAR MLS. Statistics calculated July 3, 2015

2 Sales Activity After an uneven start to 2015 where sales were virtually flat in the 1 st Quarter, the Greater Charlottesville market picked up considerable steam during the spring season as closed sales rose 9.7% in May and spiked 27.1% in June versus last year. All told, the 959 closed sales in the 2 nd Quarter exceeded last year s tally by more than 100 units (+12.0%), representing the most sales for any quarter since Sales activity picked up 94.5% compared to the 493 sales in Q1, exceeding the ten-year average Q1 to Q2 sales gain of 77.1%. The pace of sales continued to accelerate in the second quarter, posting double-digit percent increases in both units sold and total dollar volume. These indicators confirm the strength of our local market and the continued rise in second quarter pending sales bodes well for the second half of the year, said CAAR President, Anita Dunbar. The acceleration resulted in an 8.9% spike in total dollar volume to $495.4M. The $325.6M in sales volume in the 2 nd Quarter topped the 2014 mark by $40.8M, an increase of 14.3%. Further, at mid-year, despite the flat sales growth of Q1, the year-to-date sales total is now 10.3% higher than the same period last year, due to the strong performance of the second quarter. Five of the six jurisdictions saw year-over-year sales gains in Q2, with Greene (+32.1%) and Nelson (+24.4%) leading the pack in percent increases. The 514 Albemarle sales topped the Q mark by 71 sales, an increase of 16.0%. Louisa had eight more sales than last year, climbing 15.1% to 61 sales. The city of Charlottesville experienced a more modest sales uptick, increasing 5.6% to 171 sales. For the third time in the last four quarters, Fluvanna sales were down by more than a tenth, falling 11.5% versus Q Year-to-date, Fluvanna sales are down 11.9% versus 2014, the only county with a decrease.


3 Inventory The 1,114 new pending sales over the course of the 2 nd Quarter represented a 4.9% increase over Q Notably, within the quarter, 406 new pending sales in April 2015 marked the highest monthly tally since May 2006 and a 4.9% year-over-year increase. Though May s tally lagged last year s total by 4.5%, contract activity picked up again in June, climbing 7.5% and boding well for settlement activity heading into the 3 rd Quarter. At quarter s end, there were 889 total listings pending sale, 16.7 percent higher than at the same point last year. Interestingly, Fluvanna, the county where closed sales continue missing last year s marks, has 41.0% more listings in pending status than at the end of Q Unfortunately, Fluvanna also ended Q1 with 30.1% more listings pending sale than last year, but ultimately this didn t result in a year-over-year increase in closings in April (-34.4%) or May (-5.7%). Though contracts and sales saw significant gains, the 1,578 new listings added in the 2 nd Quarter were essentially flat, marking only 10 more listings than the 1,568 added in Q Louisa had the largest increase in new listings, with 27 more sellers entering the market representing a 21.3% gain to 154. Albemarle had 26 more listings added, but its jump to 750 new listings was only a 3.6% uptick. Fluvanna was the other county with more sellers entering the market in the 2 nd Quarter, increasing a modest 2.9% (+6 listings). Charlottesville (-12.9%), Greene (-10.4%) and Nelson (-4.4%) all had fewer listings added than Q The flat growth in new listing activity coupled with sales activity gains leaves active inventory headed into the 3 rd Quarter down by 11.5% compared to last year. Using the average monthly sales pace over the last twelve months, the 2,058 active listings represent 9.4 months of supply. While the region remains a buyer s market in the 9 month range, the absorbption of inventory from 10.8 months of supply one year ago is a welcome trend for sellers, said CAAR President- Elect, Donna Patton. This is the first time in eight years where supply at mid-year has dipped below 10 months. Data Source: CAAR MLS. Statistics calculated July 3, 2015

4 Days on Market (DOM) and Pricing Homes sold in the 2 nd Quarter received contracts faster than any quarter since Half of the closed sales were on market for 33 days or fewer, a week better than the 40-day median DOM in Q Two of every five homes sold during the quarter (42.1%) were on market less than three weeks. The 51 homes in the $500k-$600k price range sold fastest, with a median DOM of only 11 days. With a median DOM of 16 days, townhomes sold faster than detached homes (35 days) and condos (60 days). Data Source: CAAR MLS. Statistics calculated July 3, 2015 Median DOM levels improved in four of six jurisdictions, led by a decrease of more than 90 days in Greene, where half the homes sold in 44 days or fewer. Leading the blistering speed of sales going under contract is the city of Charlottesville, which had a median DOM of 15 days and Albemarle at 26 days. Louisa was the fourth area to post an improvement, with median DOM falling by a full month to 42 days. Half of Fluvanna s Q2 sales were on market 68 days or longer, marking a 16-day increase from the 52-day median DOM last year. Like last year, Nelson homes took longest to sell, with a median DOM of 261 days, meaning the majority of Nelson s Q2 sales were on market for over eight months prior to contract. Data Source: CAAR MLS. Statistics calculated July 3, 2015 The average percent of original list price received at sale ticked up to 95.8% in Greater Charlottesville, marking the highest quarterly level since As demand picked up relative to supply, five of the six juridictions saw gains in their average Sales Price (SP) to Original List Price (OLP) ratio, led by a 2.9 point bump in Greene. At 96.8%, the average SP to OLP ratio in Albemarle was the highest in the region. The city of Charlottesville also had a higher mark than the regional aggregate with an average SP to OLP ratio of 96.4%. Louisa sellers saw a 1.6 point improvement compared to Q and Fluvanna s 94.4% was slightly higher than last year. Nelson sellers took an average 12.8 percent less than their original list price at sale, another indicator of the extreme buyer s market in that area.


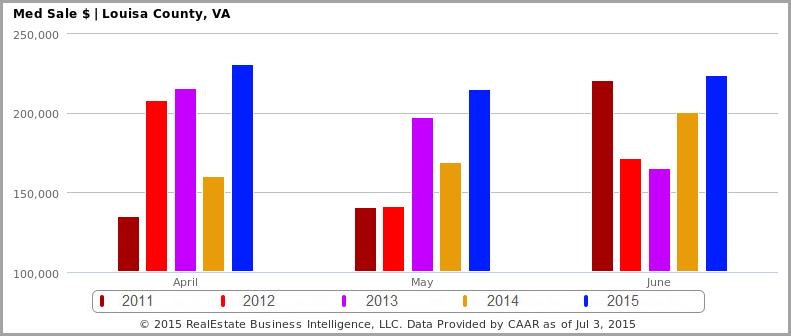
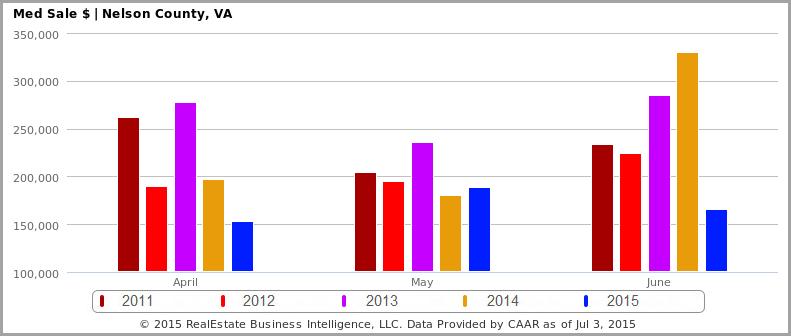
5 Home Prices Data Source: CAAR MLS. Statistics calculated July 3, 2015 At $282,220,the 2 nd Quarter median sales price in Greater Charlottesville reached the highest Q2-level since It was 2.1% higher than Q2-2014, the second straight quarter with year-over-year gains, and shows a 9.8% appreciation since 2012 when the 2 nd Quarter median was $257,000. Townhomes saw the highest year-over-year price gains, increasing 5.3% to $258,000. The $309,450 median price for detached homes represented a 3.8% increase. The $145,999 median price for condos sold in the 2 nd Quarter was 4.6% down from Q Data Source: CAAR MLS. Statistics calculated July 3, Pricing in the region was up despite the fact that the two highest volume, highest priced jurisdictions actually saw slight declines versus last year. Albemarle ($322,028) had a 2.1% decrease in median sales price versus Q while Charlottesville ($270,500) prices were down 1.8%. There were huge fluctuations in the median price levels for the two counties with the lowest sales volume. Louisa ($225,000) saw its median sales price jump 32.4% versus Q while the median sales price in Nelson ($179,000) fell by 21.8 percent. These severe fluctuations could be misleading considering there were only 61 sales in Louisa in the 2 nd Quarter and 51 in sales in Nelson small datasets are apt to see larger movement in their median levels.


6 However, the changes for these counties in the 2 nd Quarter are also reflected in their mid-year aggregate levels the 114 aggregate sales from January through June in Louisa had a median sales price of $216,025, which is 26.7% higher than the same six-month period last year. Nelson s 102 sales through June had a median sales price of $162,250, which is 26.3% lower than over the same period last year. Fluvanna s 2 nd Quarter median sales price of $224,500 was 17.4% higher than Q while Greene s $218,500 mark was down 10.8% year-over-year. It is important to keep the number of sales in mind when interpreting the report, as anomalies from one month to the next can affect the statistics in one report, and then seem corrected in the next, as evidenced in the quarterly versus year-to-date data from Fluvanna, said CAAR President, Anita Dunbar.
7
8 Attached vs. Detached Homes Prices in the detached housing segment outperformed the attached (single family townhomes + condos) segment in Greater Charlottesville in the 2 nd Quarter, mainly because condo prices brought down the attached category. The median sales price for detached homes was $309,450, a 3.8% gain. Within the attached segment, townhome prices actually increased 5.3% to $258,000 while condos fell 4.6% to $145,999. The median price for all attached homes was $221,250, a 3.3% decline versus Q There was a 16.3% increase in attached sales, with 33 more townhomes and condos sold than Q Within the attached category, the 83 condo sales marked a 36.1% increase, the second straight quarter where condo sales increased by more than a third versus last year. The 153 townhomes sold were 7.8% higher than last year s tally. There were 722 detached homes sold, a 10.6% increase. Though 75% of residential sales were detached units, this segment remains a buyer s market with 10.1 months of supply of detached homes at mid-year. The condo segment is a slight buyer s market with 8.7 months supply. The townhouse segment is the most balanced market, with only 5.5 months of supply. The balance between townhome supply and demand resulted in faster sales; half the townhomes sold in the 2 nd Quarter were on the market 16 days or fewer, far lower than the 60-day median DOM for condos and 35-day median DOM for detached homes. RBI Key Housing Trend Metrics Charlottesville Area Association of REALTORS All Residential Q2-15 % Q-O-Q Q1-15 % Y-O-Y Q2-14 % Y-O-2Y Q2-13 % Y-O-3Y Q2-12 Average Sales Price (Closed) $339, % $306, % $332, % $330, % $309,070 Median Sales Price (Closed) $282, % $256, % $276, % $273, % $257,000 Units Sold (Closed) % % % % 733 Average DOM (Closed) % % % % 150 Listing Discount (Average) 4.2% 6.0% 4.9% 5.8% 7.5% Avg SP to OLP Ratio 95.8% 94.0% 95.1% 94.2% 92.5% Avg SP/Sq Ft % % % % 140 Detached Q2-15 % Q-O-Q Q1-15 % Y-O-Y Q2-14 % Y-O-2Y Q2-13 % Y-O-3Y Q2-12 Average Sales Price (Closed) $372, % $328, % $359, % $358, % $336,600 Median Sales Price (Closed) $309, % $277, % $298, % $300, % $287,290 Units Sold (Closed) % % % % 572 Average DOM (Closed) % % % % 154 Listing Discount (Average) 4.2% 5.6% 5.5% 6.4% 8.0% Avg SP to OLP Ratio 95.8% 94.4% 94.5% 93.6% 92.0% Avg SP/Sq Ft % % % % 140 Attached Q2-15 % Q-O-Q Q1-15 % Y-O-Y Q2-14 % Y-O-2Y Q2-13 % Y-O-3Y Q2-12 Average Sales Price (Closed) $238, % $225, % $247, % $245, % $211,263 Median Sales Price (Closed) $221, % $204, % $228, % $220, % $189,000 Units Sold (Closed) % % % % 161 Average DOM (Closed) % % % % 136 Listing Discount (Average) 4.1% 7.3% 2.9% 4.0% 5.6% Avg SP to OLP Ratio 95.9% 92.7% 97.1% 96.0% 94.5% Avg SP/Sq Ft % % % % 142 Data Source: CAAR MLS. Statistics calculated July 3, 2015.
9 Distressed Inventory Only 43 of the 959 sales in the 2 nd Quarter, or 4.5%, were foreclosure/reo properties. This is the lowest quarterly proportion for any quarter since CAAR began recording distressed listing data back in late The 43 foreclosure sales were seven fewer than the Q total, when foreclosures accounted for 5.8% of sales. This was the sixth consecutive quarter with fewer foreclosure sales than the previous year. The nine short sales accounted for less than one percent of all sales, down from 2.2% in Q when there were 19 short sales out of 856 total sales. All told, non-distressed listings accounted for 94.6%, up from a 91.9% share last year. This proportion marks a significant improvement from the low point in the 1 st Quarter of 2012 when only three in four sales were of non-distressed listings (75.2%). Data Source: CAAR MLS. Statistics calculated July 3, The median sales price for non-distressed listings was $290,000 in the 2 nd Quarter, a 1.1% increase from last year, while foreclosure pricing was flat (-0.2%) at $124,900. The median sales price for the nine short sales was $179,000, marking a 10.5% increase versus the $162,000 level for the 19 short sales in Q With such low volume, this uptick should be taken with a grain of salt. Should the distressed share of the market continue to diminish, this will bode well for pricing levels moving forward. 75 of the 1,578 listings added during the 2 nd Quarter, or 4.8%, were distressed listings, down slightly from the 5.1% share of new listings added in Q Surprisingly, the 61 new REO listings marked a 19.6% increase compared to the 51 last year, accounting for 3.9% of new listings, a slight increase from the 3.3% share last year. The 14 new short sale listings added were less than half the 29 added in the same quarter last year, accounting for less than one percent of new listings. Data Source: CAAR MLS. Statistics calculated July 3, 2015.


10 Land/Acreage Sales There were 79 land/acreage sales in Greater Charlottesville in the 2 nd Quarter, 20.2% fewer than Q but on par with the five-year quarterly average of 78. There was actually no change in the number of 5+ acre sales compared to last year, with 35 total sales. The decrease was entirely from the <5 acre segment that had 46 total sales, 20 fewer than in Q Louisa, with 11 fewer sales, and Nelson, with six fewer sales, accounted for the highest proportion of the net drop in regional land sales. While Albemarle s 29 land sales led all counties, it had two fewer sales than Q Charlottesville only had two land sales, down from six last year. Fluvanna and Greene were the only jurisdictions to see more land sales settled compared to last year, though the gains were modest. Fluvanna increased from seven to nine land sales while Greene netted one additional land sale with a total of seven.
2015 First Quarter Market Report
 2015 First Quarter Market Report CAAR Member Copy Expanded Edition Charlottesville Area First Quarter 2015 Highlights: Median sales price for the region was up 5.1% over Q1-2014, rising from $244,250 to
2013 Year-End Market Report
 2013 Year-End Market Report The voice of real estate in Central Virginia CAAR Member Copy Expanded Edition Charlottesville Area Year-End 2013 Highlights: Yearly home sales in Greater Charlottesville were
See Full Corridor Study Volumes I and II as separate attachments.
 See Full Corridor Study Volumes I and II as separate attachments. See Housing Values 2000-2010 and 2000-2013 as separate attachments. 2013 2 nd Quarter and Mid-Year Market Report The voice of real estate
rd Quarter Market Report
 2012 3 rd Quarter Market Report The voice of real estate in Central Virginia CAAR Member Copy Expanded Edition Charlottesville Area 3 rd Quarter 2012 Highlights: Overall sales in Greater Charlottesville
February 2016 Loudoun County Market Trends Report Contracts and sales activity jump double-digits; Inventories down 15.5 percent
 FOR IMMEDIATE RELEASE Contact: Christine Windle 703-777-2468, cwindle@dullesarea.com Sponsored by: Access National Bank Tom Ciolkosz, (703) 871-1045, tciolkosz@accessnationalbank.com Patty Foster, 703-871-1014,
May 2016 Loudoun County Market Trends Report Homes selling twice as fast as 2015 with re-emergence of seller s market
 FOR IMMEDIATE RELEASE Contact: Christine Windle 703-777-2468 Dulles Area Association of REALTORS cwindle@dullesarea.com Sponsored by: Access National Bank Tom Ciolkosz, (703) 871-1045, tciolkosz@accessnationalbank.com
FOR IMMEDIATE RELEASE Contact: Bobette Banks Director of Communications Greater Capital Area Association of REALTORS
 FOR IMMEDIATE RELEASE Contact: Bobette Banks 301-590-8764 Director of Communications Greater Capital Area Association of REALTORS bbanks@gcaar.com November 2015 Washington, DC Market Trends Report Median
FOR IMMEDIATE RELEASE Contact: Brenda Morton Dulles Area Association of REALTORS
 FOR IMMEDIATE RELEASE Contact: Brenda Morton 703 777 2468 Dulles Area Association of REALTORS bmorton@dullesarea.com August 2018 Loudoun County Market Trends Report Despite persistent low inventory, sales
November 2017 Loudoun County Market Trends Report Inventory decline persists as total and new listings are down; Sales growth continues to drop
 FOR IMMEDIATE RELEASE Contact: Brenda Morton 703 777 2468 Dulles Area Association of REALTORS bmorton@dullesarea.com November 2017 Loudoun County Market Trends Report Inventory decline persists as total
August 2017 Loudoun County Market Trends Report Sales Price Reaches Record High; Sales Decline; Inventory Remains Low
 FOR IMMEDIATE RELEASE Contact: Christine Windle 703 777 2468 Dulles Area Association of REALTORS cwindle@dullesarea.com August 2017 Loudoun County Market Trends Report Sales Price Reaches Record High;
FOR IMMEDIATE RELEASE Contact: Brenda Morton Dulles Area Association of REALTORS
 FOR IMMEDIATE RELEASE Contact: Brenda Morton 703 777 2468 Dulles Area Association of REALTORS bmorton@dullesarea.com February 2018 Loudoun County Market Trends Report Inventory reaches yet another record
August 2015 Washington, DC Market Trends Report Limited supply, high demand continue pushing prices to record highs
 FOR IMMEDIATE RELEASE Contact: Bobette Banks 301-590-8764 Director of Communications Greater Capital Area Association of REALTORS bbanks@gcaar.com August 2015 Washington, DC Market Trends Report Limited
January 2018 Loudoun County Market Trends Report Inventory has another record low month; home sales continue to decline compared to last year.
 FOR IMMEDIATE RELEASE Contact: Brenda Morton 703 777 2468 Dulles Area Association of REALTORS bmorton@dullesarea.com January 2018 Loudoun County Market Trends Report Inventory has another record low month;
May 2018 Loudoun County Market Trends Report Tight inventory continues while price growth stagnates; Condo sales hit a record high.
 FOR IMMEDIATE RELEASE Contact: Brenda Morton 703 777 2468 Dulles Area Association of REALTORS bmorton@dullesarea.com May 2018 Loudoun County Market Trends Report Tight inventory continues while price growth
May 2016 Washington, DC Market Trends Report Listings continue to move quickly as sales climb nearly 14 percent
 FOR IMMEDIATE RELEASE Contact: Bobette Banks 301-590-8764 Director of Communications Greater Capital Area Association of REALTORS bbanks@gcaar.com May 2016 Washington, DC Market Trends Report Listings
FOR IMMEDIATE RELEASE Contact: Bobette Banks Director of Communications Greater Capital Area Association of REALTORS
 FOR IMMEDIATE RELEASE Contact: Bobette Banks 301-590-8764 Director of Communications Greater Capital Area Association of REALTORS bbanks@gcaar.com April 2016 Washington, DC Market Trends Report Sales and
September 2018 Loudoun County Market Trends Report Inventory continues to tighten as prices increase and closed sales decline
 FOR IMMEDIATE RELEASE Contact: Brenda Morton 703 777 2468 Dulles Area Association of REALTORS bmorton@dullesarea.com September 2018 Loudoun County Market Trends Report Inventory continues to tighten as
March 2016 Washington, DC Market Trends Report March sales represent a 12 percent increase; top the five-year March average
 FOR IMMEDIATE RELEASE Contact: Bobette Banks 301-590-8764 Director of Communications Greater Capital Area Association of REALTORS bbanks@gcaar.com March 2016 Washington, DC Market Trends Report March sales
May 2016 Montgomery County Market Trends Report Double-digit gains in closed sales, exceeding the five-year May average
 FOR IMMEDIATE RELEASE Contact: Bobette Banks 301-590-8764 Director of Communications Greater Capital Area Association of REALTORS bbanks@gcaar.com May 2016 Montgomery County Market Trends Report Double-digit
September 2017 Montgomery County Market Trends Report Median sales price highest since September 2007
 FOR IMMEDIATE RELEASE Contact: Bobette Banks 301-590-8764 Director of Communications Greater Capital Area Association of REALTORS bbanks@gcaar.com September 2017 Montgomery County Market Trends Report
June 2017 Montgomery County Market Trends Report Median sales price up 1.1 percent highest for June since 2008
 FOR IMMEDIATE RELEASE Contact: Bobette Banks 301-590-8764 Director of Communications Greater Capital Area Association of REALTORS bbanks@gcaar.com June 2017 Montgomery County Market Trends Report Median
November 2017 Montgomery County Market Trends Report Median sales price up slightly as median days on market quickens
 FOR IMMEDIATE RELEASE Contact: Bobette Banks 301-590-8764 Director of Communications Greater Capital Area Association of REALTORS bbanks@gcaar.com November 2017 Montgomery County Market Trends Report Median
May 2017 Montgomery County Market Trends Report Median sales price increases 5.8 percent; active listings drop 11.8 percent
 FOR IMMEDIATE RELEASE Contact: Bobette Banks 301-590-8764 Director of Communications Greater Capital Area Association of REALTORS bbanks@gcaar.com May 2017 Montgomery County Market Trends Report Median
Year to Date (thru June)
") CAAR Market Report 2009 Mid-Year Published by the Charlottesville Area Association of REALTORS Where Are We Now? The pace of home purchases in the Charlottesville area continues to improve from the dismal
CAAR Market Report 2009 Mid-Year Published by the Charlottesville Area Association of REALTORS Where Are We Now? The pace of home purchases in the Charlottesville area continues to improve from the dismal
Single Family Sales Maine: Units
 Maine Home Connection 19 Commercial St Portland, Maine 04101 MaineHomeConnection.com Office: (207) 517-3100 Email: Info@MaineHomeConnection.com For the fourth consecutive year, Maine home sales set a new
February 2018 Montgomery County Market Trends Report Closed sales dip while median sales price reaches highest February mark since 2007
 FOR IMMEDIATE RELEASE Contact: Bobette Banks 301-590-8764 Director of Communications Greater Capital Area Association of REALTORS bbanks@gcaar.com February 2018 Montgomery County Market Trends Report Closed
June 2018 Montgomery County Market Trends Report Median sales price reaches highest June level on record
 FOR IMMEDIATE RELEASE Contact: Bobette Banks 301-590-8764 Director of Communications Greater Capital Area Association of REALTORS bbanks@gcaar.com June 2018 Montgomery County Market Trends Report Median
November 2018 Montgomery County Market Trends Report Median sales price reaches highest November level in 10 years
 FOR IMMEDIATE RELEASE Contact: Bobette Banks 301-590-8764 Director of Communications Greater Capital Area Association of REALTORS bbanks@gcaar.com November 2018 Montgomery County Market Trends Report Median
September 2017 Washington, DC Market Trends Report September median sales price drops 6.4 percent but still near record high
 FOR IMMEDIATE RELEASE Contact: Bobette Banks 301-590-8764 Director of Communications Greater Capital Area Association of REALTORS bbanks@gcaar.com September 2017 Washington, DC Market Trends Report September
CAAR Market Report 2010 Mid-Year Published by the Charlottesville Area Association of REALTORS
 CAAR Market Report 2010 Mid-Year Published by the Charlottesville Area Association of REALTORS Where Are We Now? The pace of home purchases in the Charlottesville market area showed a significant increase
March 2018 Montgomery County Market Trends Report Median sales price reaches highest March level on record; days-on-market down from 2017
 FOR IMMEDIATE RELEASE Contact: Bobette Banks 301-590-8764 Director of Communications Greater Capital Area Association of REALTORS bbanks@gcaar.com March 2018 Montgomery County Market Trends Report Median
MARKET AREA UPDATE Report as of: 1Q 2Q 3Q 4Q
 MARKET AREA UPDATE Report as of: 1Q 2Q 3Q 4Q Year: 2013 Market Area (City, State): Washington DC Metropolitan Area Provided by (Company / Companies): LONG & FOSTER REAL ESTATE, INC. What are the most significant
March 2018 Washington, DC Market Trends Report Median sales price reaches highest March level on record
 FOR IMMEDIATE RELEASE Contact: Bryan Frantz 301-590-8765 Communications Specialist District of Columbia Association of REALTORS bfrantz@dcrealtors.org March 2018 Washington, DC Market Trends Report Median
July 2016 Washington, DC Market Trends Report July home prices remain at record highs in the District
 FOR IMMEDIATE RELEASE Contact: Bobette Banks 301-590-8764 Director of Communications Greater Capital Area Association of REALTORS bbanks@gcaar.com July 2016 Washington, DC Market Trends Report July home
December 2018 Montgomery County Market Trends Report Median sales rise slightly from 2017; Active listings increase 5.1 percent
 FOR IMMEDIATE RELEASE Contact: Bobette Banks 301-590-8764 Director of Communications Greater Capital Area Association of REALTORS bbanks@gcaar.com December 2018 Montgomery County Market Trends Report Median
January 2017 Washington, DC Market Trends Report Median Sales Price Up 4.6 percent Reaches Highest January Level on Record
 FOR IMMEDIATE RELEASE Contact: Bobette Banks 301-590-8764 Director of Communications Greater Capital Area Association of REALTORS bbanks@gcaar.com January 2017 Washington, DC Market Trends Report Median
January 2019 Montgomery County Market Trends Report Average sales and new listings increase; closed sales decline
 FOR IMMEDIATE RELEASE Contact: Bobette Banks 301-590-8764 Director of Communications Greater Capital Area Association of REALTORS bbanks@gcaar.com January 2019 Montgomery County Market Trends Report Average
CAAR Market Report 2010 First Quarter Published by the Charlottesville Area Association of REALTORS
 CAAR Market Report 2010 First Quarter Published by the Charlottesville Area Association of REALTORS Where Are We Now? In the first quarter of 2010, the Charlottesville real estate market continued the
November 2017 Washington, DC Market Trends Report Median sales price ties last year for highest November level on record
 FOR IMMEDIATE RELEASE Contact: Bobette Banks 301-590-8764 Director of Communications Greater Capital Area Association of REALTORS bbanks@gcaar.com November 2017 Washington, DC Market Trends Report Median
May 2018 Washington, DC Market Trends Report Sales at record high for May while supply remains scarce
 FOR IMMEDIATE RELEASE Contact: Bryan Frantz 202-626-0097 Communications Specialist District of Columbia Association of REALTORS bfrantz@dcrealtors.org May 2018 Washington, DC Market Trends Report Sales
June 2018 Washington, DC Market Trends Report Median sales price reaches highest June level on record
 FOR IMMEDIATE RELEASE Contact: Bobette Banks 301-590-8764 Director of Communications Greater Capital Area Association of REALTORS bbanks@gcaar.com June 2018 Washington, DC Market Trends Report Median sales
2007 Sales (thru September)
") Third Quarter Market Report Challenges, Opportunities, and Surprises, Oh My! By Dave Phillips, CEO Charlottesville Area Association of REALTORS Someone named Anonymous once said, "Many an opportunity is
Third Quarter Market Report Challenges, Opportunities, and Surprises, Oh My! By Dave Phillips, CEO Charlottesville Area Association of REALTORS Someone named Anonymous once said, "Many an opportunity is
April 2018 Washington, DC Market Trends Report Home sales up 9.4 percent; median sales price reaches highest April on record
 N FOR IMMEDIATE RELEASE Contact: Bobette Banks 301-590-8764 Director of Communications Greater Capital Area Association of REALTORS bbanks@gcaar.com April 2018 Washington, DC Market Trends Report Home
2008 Mid-Year CAAR Market Report Real Estate Market is as Hot as ANWR
 2008 Mid-Year CAAR Market Report Real Estate Market is as Hot as ANWR By Dave Phillips, CEO Charlottesville Area Association of REALTORS Just about everything in life is relative to your perspective. Based
January 2018 Washington, DC Market Trends Report Closed sales reach highest January level since 2005
 FOR IMMEDIATE RELEASE Contact: Bobette Banks 301-590-8764 Director of Communications Greater Capital Area Association of REALTORS bbanks@gcaar.com January 2018 Washington, DC Market Trends Report Closed
Charlottesville Housing Market Report Year-End (Published by the Charlottesville Area Association of REALTORS )
") Charlottesville Housing Market Report - 2009 Year-End (Published by the Charlottesville Area Association of REALTORS ) This Quarterly Market Report is produced by the Charlottesville Area Association of
Charlottesville Housing Market Report - 2009 Year-End (Published by the Charlottesville Area Association of REALTORS ) This Quarterly Market Report is produced by the Charlottesville Area Association of
California Housing Market Update. Monthly Sales and Price Statistics January 2018
 California Housing Market Update Monthly Sales and Price Statistics January 2018 Sales Started with a Slight Decrease California, Jan. 2018 Sales: 388,800 Units, -2.9% YTD, -2.9% YTY 700,000 600,000 500,000
MARKET AREA UPDATE Report as of: 1Q 2Q 3Q 4Q
 MARKET AREA UPDATE Report as of: 1Q 2Q 3Q 4Q Year: 2014 Market Area (City, State): Washington DC Metropolitan Area Provided by (Company / Companies): LONG & FOSTER REAL ESTATE, INC. What are the most significant
1Q18 TOWN OF PALM BEACH & BARRIER ISLANDS The Corcoran Report
 1Q18 TOWN OF PALM BEACH & BARRIER ISLANDS The Corcoran Report 353 El Brillo Way web# 5339190 on corcoran.com Town of Palm Beach $6.425M $4.075M 46 +31% -1% +8% $1.018M 125-15% +18% $540K +46% 1Q18 Corcoran
MARKET AREA UPDATE Report as of: 1Q 2Q 3Q 4Q
 Year: 2013 Market Area (City, State): Baltimore Metropolitan Area MARKET AREA UPDATE Report as of: 1Q 2Q 3Q 4Q Provided by (Company / Companies): LONG & FOSTER REAL ESTATE, INC. What are the most significant
November 2018 Washington, DC Market Trends Report Median sales price highest November level in past 10 years
 FOR IMMEDIATE RELEASE Contact: Bryan Frantz 202.626.0097 Communications Specialist District of Columbia Association of REALTORS bfrantz@dcrealtors.org November 2018 Washington, DC Market Trends Report
Q Quick Facts - 3.2% 0.0% %
 CAAR Market Report Includes the city of Charlottesville and the counties of Albemarle, Fluvanna, Greene, Louisa and Nelson. Home prices were consistently up again in most markets in 2018 but at reduced
The Corcoran Report 4Q16 MANHATTAN
 The Corcoran Report 4Q16 MANHATTAN Contents Fourth Quarter 2016 4/7 12/23 3 Overview 8 9 10 Market Wide 11 Luxury 24 2 Sales / Days on Market 3 Inventory / Months of Supply 4 5 Market Share Resale Co-ops
Washington, D.C. Metro Area December 2017 Housing Market Update
 Washington, D.C. Metro Area December 2017 Housing Market Update Washington D.C. Metro housing market closes out 2017 with record high December house price of $420,050; December inventories decline for
San Francisco Housing Market Update
 San Francisco Housing Market Update California Economic and Housing Market Outlook The national economy maintained a healthy growth rate in the first quarter of 2005 and appeared to be settling in for
CITI HABITATS. Manhattan Residential Sales Market Report
 Manhattan Residential Sales Market Report Contents 4/7 12/17 3 8 9 10 Market Wide 4 Sales / Days on Market 5 / Months of Supply 6 7 Market Share Resale Co-ops Resale Condos New Developments 11 Luxury Neighborhoods
FOR IMMEDIATE RELEASE Contact: Bobette Banks Director of Communications Greater Capital Area Association of REALTORS
 FOR IMMEDIATE RELEASE Contact: Bobette Banks 301-590-8764 Director of Communications Greater Capital Area Association of REALTORS bbanks@gcaar.com December 2018 Washington, DC Market Trends Report DC closes
The Market Watch Monthly Housing Report. Coachella Valley Median Detached Home Price Dec Dec 2016
 The Market Watch Monthly Housing Report Median Price $450,000 Coachella Valley Median Detached Home Price Dec 2002 - Dec 2016 $400,000 $350,000 $300,000 $339,930 $340,000 $250,000 $200,000 $150,000 CV
MARCH 2019 Harrisonburg & Rockingham County Real Estate Market Report
 MARCH 219 Real Estate Market Report An analysis of real estate activity through February 28, 219 provided courtesy of Scott P. Rogers, Funkhouser Real Estate Group Spacious Four Bedroom Brick Colonial
Sarasota/Manatee Housing Market Still Tipped Toward Sellers
 FOR IMMEDIATE RELEASE Realtor Association of Sarasota and Manatee Contact: Kathy Roberts (941) 952-343 kathy@myrasm.com Sarasota/Manatee Housing Market Still Tipped Toward Sellers SARASOTA, Fla. (May 24,
FEBRUARY 2019 Harrisonburg & Rockingham County Real Estate Market Report
 FEBRUARY 219 Real Estate Market Report An analysis of real estate activity through January 31, 219 provided courtesy of Scott P. Rogers, Funkhouser Real Estate Group Immaculate Brick Highland Park Colonial
The Corcoran Report 3Q17 MANHATTAN
 The Corcoran Report 3Q17 MANHATTAN Contents Third Quarter 2017 4/7 12/23 3 Overview 8 9 10 Market Wide 11 Luxury 24 4 Sales / Days on Market 5 Inventory / Months of Supply 6 7 Market Share Resale Co-ops
Coachella Valley Median Detached Home Price April April 2017
 The Desert Housing Report Median Price $450,000 $400,000 Coachella Valley Median Detached Home Price April 2002 - $349,000 $389,000 $350,000 $300,000 $250,000 $200,000 $150,000 CV Detached Median Price
The Desert Housing Report. Coachella Valley Median Detached Home Price December December 2018
 Median Price $450,000 $400,000 Coachella Valley Median Detached Home Price December 2002 - $369,450 $389,944 $350,000 $300,000 $250,000 $200,000 $150,000 CV Detached Median Price 4% Growth Curve Summary
Coachella Valley Median Detached Home Price Jan Jan 2017
 The Desert Housing Report Median Price $450,000 Coachella Valley Median Detached Home Price Jan 2002 - Jan 2017 $400,000 $350,000 $300,000 $250,000 $335,000 $340,000 $200,000 $150,000 CV Detached Median
More Inventory Means More Choices for Buyers
 FOR IMMEDIATE RELEASE Realtor Association of Sarasota and Manatee Contact: Kathy Roberts (941) 952-343 kathy@myrasm.com More Inventory Means More Choices for Buyers SARASOTA, Fla. (March 22, 217) The combined
MARKET AREA UPDATE Report as of: 1Q 2Q 3Q 4Q
 MARKET AREA UPDATE Report as of: 1Q 2Q 3Q 4Q Year: 2013 Market Area (City, State): Arlington, Virginia Provided by (Company / Companies): McEnearney Associates, Inc. Realtors What are the most significant
RESIDENTIAL MARKET ANALYSIS
 RESIDENTIAL MARKET ANALYSIS CLANCY TERRY RMLS Student Fellow Master of Real Estate Development Candidate Oregon and national housing markets both demonstrated shifting trends in the first quarter of 2015
HOUSING REPORT WASHTENAW SEPTEMBER 2018
 WASHTENAW SEPTEMBER 2018 Washtenaw County Recovery Run How Much Longer? This month marks the 10-year anniversary of the market peak prior to the burst of the housing bubble. The nationwide median home
ECONOMIC CURRENTS. Vol. 4, Issue 3. THE Introduction SOUTH FLORIDA ECONOMIC QUARTERLY
 ECONOMIC CURRENTS THE Introduction SOUTH FLORIDA ECONOMIC QUARTERLY Vol. 4, Issue 3 Economic Currents provides an overview of the South Florida regional economy. The report presents current employment,
California Housing Market Update. Monthly Sales and Price Statistics October 2018
 California Housing Market Update Monthly Sales and Price Statistics October 2018 Sales Had the 2 nd Largest Drop in the Last 6 Months California, October 2018 Sales: 397,060 Units, -3.7% YTD, -7.9% YTY
ARLA Members Survey of the Private Rented Sector
 Prepared for The Association of Residential Letting Agents ARLA Members Survey of the Private Rented Sector Second Quarter 2014 Prepared by: O M Carey Jones 5 Henshaw Lane Yeadon Leeds LS19 7RW June, 2014
ANALYSIS OF THE CENTRAL VIRGINIA AREA HOUSING MARKET 1st quarter 2013 By Lisa A. Sturtevant, PhD George Mason University Center for Regional Analysis
 ANALYSIS OF THE CENTRAL VIRGINIA AREA HOUSING MARKET 1st quarter By Lisa A. Sturtevant, PhD George Mason University Center for Regional Analysis Economic Overview Key economic factors in the first quarter
The Corcoran Report 4Q17 TOWN OF PALM BEACH & BARRIER ISLANDS
 The Corcoran Report 4Q17 TOWN OF PALM BEACH & BARRIER ISLANDS Town of Palm Beach 19 $8.379M $5.717M 19% 102% 92% 52 $607K $364K -7% WEB# 5301358 on corcoran.com 14% 2017 4Q Corcoran Report Palm Beach In
Q Quick Facts + 7.5% + 1.6% - 8.6%
 CAAR Market Report Includes the city of Charlottesville and the counties of Albemarle, Fluvanna, Greene, Louisa and Nelson. Quick Facts + 7.5% + 1.6% Housing markets across the nation are most assuredly
Peter Comitini Senior VP Associate Broker The Corcoran Group
 Sutton Area TriBeCa Upper East Side Upper West Side Washington Heights West Village Battery Park City Beekman Carnegie Hill Central Park South Chelsea Flatiron Clinton East Harlem East Village Financial
Manhattan Rental Market Report August 2013 mns.com
 Manhattan Rental Market Report August 2013 TABLE OF CONTENTS 03 Introduction 04 A Quick Look 07 Mean Manhattan Rental Prices 11 Manhattan Price Trends 12 Neighborhood Price Trends 12 Battery Park City
Sales Increase as Season Winds Down
 FOR IMMEDIATE RELEASE Realtor Association of Sarasota and Manatee Contact: Kathy Roberts (941) 952-343 kathy@myrasm.com Sales Increase as Season Winds Down SARASOTA, Fla. (April 21, 217) According to the
CAAR Market Report. Greater Charlottesville Area. Q Quick Facts + 3.5% + 8.0% %
 CAAR Market Report Includes the city of Charlottesville and the counties of Albemarle, Fluvanna, Greene, Louisa and Nelson. Quick Facts + 3.5% + 8.0% We can comfortably consider the first quarter to have
THE AGGREGATETM 4TH QUARTER 2015
 THE AGGREGATETM 4TH QUARTER INTRODUCTION 4TH QUARTER Welcome to The Aggregate, the quarterly residential market report published by TOWN Residential. As New York s leading fully-integrated residential
The Desert Housing Report. Coachella Valley Median Detached Home Price March March 2019 $392,000 $415,000
 Median Price $450,000 $400,000 $350,000 $300,000 $250,000 $200,000 $150,000 Coachella Valley Median Detached Home Price March 2002 - $392,000 $415,000 CV Detached Median Price Summary 4% Growth Curve The
Coachella Valley Median Detached Home Price May May 2018
 Median Price $450,000 $400,000 Coachella Valley Median Detached Home Price May 2002 - $389,000 $412,000 $350,000 $300,000 $250,000 $200,000 $150,000 CV Detached Median Price 4 % Growth Curve Summary The
NOVEMBER 2018 Harrisonburg & Rockingham County Real Estate Market Report
 NOVEMBER 218 Real Estate Market Report An analysis of real estate activity through October 31, 218 provided courtesy of Scott P. Rogers, Funkhouser Real Estate Group Custom-Built Highland Park Home with
MONTGOMERY COUNTY JULY 2018
 STATPAK MONTGOMERY COUNTY JULY 2018 McEnearney.com MARKET IN A MINUTE A SUMMARY OF MARKET CONDITIONS FOR JUNE & FIRST HALF 2018 Contract activity in June 2018 was up 1.2% from June 2017, solely because
OCTOBER 2018 Harrisonburg & Rockingham County Real Estate Market Report
 OCTOBER 218 Real Estate Market Report An analysis of real estate activity through September 3, 218 provided courtesy of Scott P. Rogers, Funkhouser Real Estate Group Five Bedroom City Home with Finished
Baltimore, MD Metro Area September 2017 Housing Market Update
 Baltimore, MD Metro Area September 2017 Housing Market Update Baltimore Metro median sales price of $253,000 is near September record; Active inventories decline by 11.4% to lowest September level of the
California Housing Market Update. Monthly Sales and Price Statistics December 2018
 California Housing Market Update Monthly Sales and Price Statistics December 2018 Sales Reached the Lowest Level since Jan 2015 California, December 2018 Sales: 372,260 Units, -5.2% YTD, -11.6% YTY 700,000
MARKET IN A MINUTE A SUMMARY OF MARKET CONDITIONS FOR SEPTEMBER & 3rd QUARTER 2017
 STATPAK LOUDOUN COUNTY OCTOBER 2017 McEnearney.com MARKET IN A MINUTE A SUMMARY OF MARKET CONDITIONS FOR SEPTEMBER & 3rd QUARTER 2017 Contract activity in September 2017 was up just 0.6% from September
STATPAK MARKET IN A MINUTE A SUMMARY OF MARKET CONDITIONS FOR JANUARY McEnearney.com CONTRACTS URGENCY INDEX INVENTORY INTEREST RATES
 STATPAK LOUDOUN COUNTY FEBRUARY 2018 McEnearney.com MARKET IN A MINUTE A SUMMARY OF MARKET CONDITIONS FOR JANUARY 2018 Contract activity in January 2018 was down just 2.0% from January 2017, but that is
NANTUCKET REAL ESTATE
 NANTUCKET REAL ESTATE YEAR IN REVIEW 2016 Nantucket Real Estate A Comprehensive Analysis by Jen Shalley (508) 228 4407 21 Main Street, Nantucket, MA 2 2016 NANTUCKET REAL ESTATE IN PHOTOS $19 HIGHEST SALE
Hamilton Heights Manhattan. Morningside Heights Harlem
 Sutton Area TriBeCa Upper East Side Upper West Side Washington Heights West Village The Corcoran Report Battery Park City Beekman Carnegie Hill Central Park South Chelsea Flatiron Clinton East Harlem East
1 st Quarter 2015 Asheville and Buncombe County Real Estate Market Analysis
 1 st Quarter 2015 Asheville and Buncombe County Real Estate Market Analysis This report examines the Asheville and Buncombe County residential real estate market through the end of the 1 st quarter of
Home Sales up with More Expected to Close This Season
 FOR IMMEDIATE RELEASE REALTOR Association of Sarasota and Manatee Contact: Jeff Arakelian (941) 952-343 Jeff@MyRASM.com Home Sales up with More Expected to Close This Season SARASOTA, Fla. (February 21,
STATPAK MARKET IN A MINUTE A SUMMARY OF MARKET CONDITIONS FOR APRIL McEnearney.com CONTRACTS URGENCY INDEX INVENTORY INTEREST RATES
 STATPAK WASHINGTON, DC MAY 2018 McEnearney.com MARKET IN A MINUTE A SUMMARY OF MARKET CONDITIONS FOR APRIL 2018 Contract activity in April 2018 was up 9.4% from April 2017, and four of the six price categories
Sarasota and Manatee Homes Sell Quickly in August 2018
 FOR IMMEDIATE RELEASE REALTOR Association of Sarasota and Manatee Contact: Gina White (941) 952-345 Gina@MyRASM.com Sarasota and Manatee Homes Sell Quickly in August 218 SARASOTA, Fla. (September 2, 218)
2Q2017 L O N G ISLAND CITY
 2Q2017 L O N G ISLAND CITY M A R K E T R E P O R T INTRODUCTION L O N G I S L A N D C I T Y S A L E S R E P O R T Q 2 2 0 1 7 : LONG ISLAND CITY IS THE FASTEST GROWING NEIGHBORHOOD IN THE COUNTRY. The
1Q18 MANHATTAN The Corcoran Report
 1Q18 MANHATTAN The Corcoran Report Contents First Quarter 2018 3 Overview 4/7 Market Wide 8 9 10 12/23 24 4 Sales / Days on Market 5 Inventory / Months of Supply 6 Prices 7 Market Share Resale Co-ops Resale
Annual Market Report for 2010 for Naples, Bonita, Estero market area
 Annual Market Review Closed Sales The number of closed sales in once again increased over prior year, making it the third consecutive year to show an increase. Properties priced under $25, continued to
The Coldwell Banker Carlson Real Estate Market Report
 The Coldwell Banker Carlson Real Estate Market Report 2017 Year-End Stowe Area Report Our 2017 Year-End Market Report uses market-wide data, based on transactions that closed in 2017 in the Multiple Listing
st Quarter Market Report A Recipe That s Hard to Swallow
 2008 1 st Quarter Market Report A Recipe That s Hard to Swallow By Dave Phillips, CEO Charlottesville Area Association of REALTORS Have you ever stood in your kitchen, felt a creative surge and decided