Single Family Sales Maine: Units
|
|
|
- Aubrie Patrick
- 5 years ago
- Views:
Transcription

1 Maine Home Connection 19 Commercial St Portland, Maine MaineHomeConnection.com Office: (207)


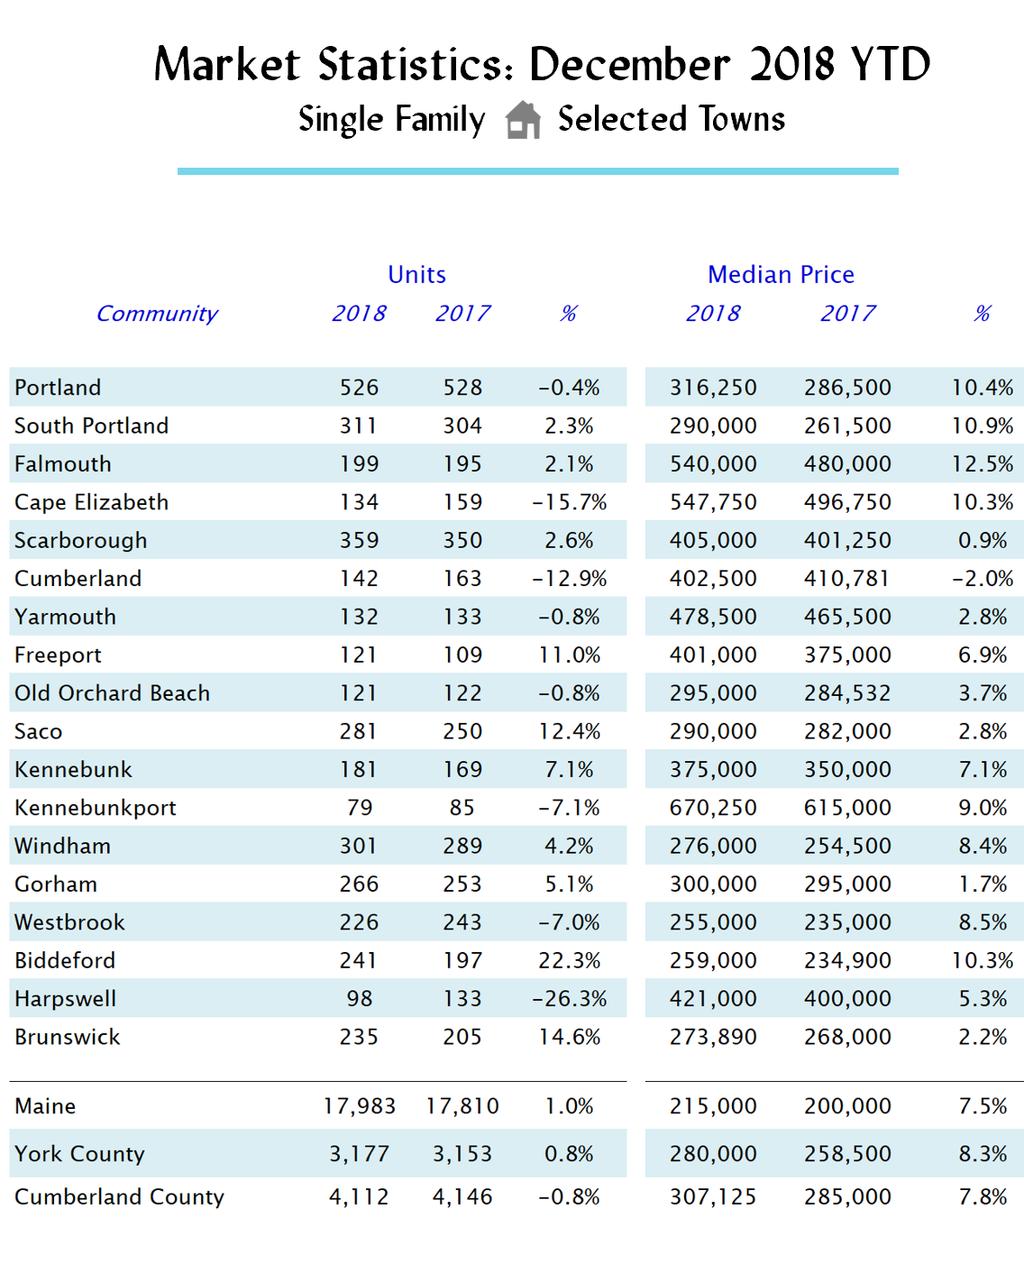
2 For the fourth consecutive year, Maine home sales set a new record in 2018 as 17,983 single family homes were sold, representing an increase of 1.0% over 2017 when total volume was 17,810. As a point of comparison, sales in 2015 were 15,868. Homes sales have increased for seven consecutive years and have been up annually each year except two since the historic low of 9,782 in 2008 at which time they had declined an unprecedented 19% from the year before. While single family sales continued to grow statewide in 2018, sales in the southern part of the state, specifically in Cumberland and York Counties, experienced surprisingly different results. Sales in York County were up from 2017 to 2018 as 3,177 units were sold, compared to 3,153 the previous year. Sales in Cumberland County declined.8%. As the chart at the end of this report illustrates, many communities in the greater Portland area experienced sales declines in 2018 some in double digits. For example; Portland, which eclipsed 600 annual single-family homes sales for the first time in history in 2016, recorded a decline of 15% in 2017, and another decline of just 0.4% in This was the result of a combination of factors, including lower overall inventory, less demand in the second half of the year and a gradual uptick in interest rates. Single Family Sales Maine: Units + 1% YTD Condominium Sales Maine: Units - 5.7% YTD Monthly sales in Cumberland County for 2018 were volatile compared to Monthly sales consistently bounced between higher and lower compared to their 2017 counterparts. In fact, sales were lower in the last five months of 2018 vs 2017 and were lower in eight of 12 months. Effect of Inventory Focusing on single family homes in Cumberland County, the chart below provides a two-year illustration of sales, active listings, new listings and inventory. It demonstrates that while the rate of sales growth declined in the second half of 2018, there has been an overall consistency in sales and new listings over the last 24 months. At the end of December 2018, the Months of Inventory calculation (also known as Absorption Rate) was 2.44 versus 2.25 in January This is the measure, in months, of how long the current inventory of properties would last at the current rate of sales. Active listings provide a snapshot of how many properties are for sale each month, as of the 15 th. Rather than showing the number of all listings that were active at any time during the month, this

3 chart displays a representation of the number of listings that were active on one day. A trend upward or downward from month to month can be established by using the same day of every month. Active listings reached their peak in the fourth quarter and have been increasing throughout most of The impact of lower inventory can be reflected in the time it took to sell a home in The graph below, again for Cumberland County, details the time it took to sell a home. The Days on Market chart displays the average number of days that sold listings were on the market. The number for each month is the average days on market for all of the listings whose sale contracts were closed that month. During the summer months in Cumberland County, the average DOM (Days On Market) declined into the low 30s, often resulting in multiple buyers writing offers on the same property. Since early 2017 the DOM for single family homes has trended downward, except for the first three months of By year-end, the DOM statistic was more nearly half (at 44 days) from early 2017 and drastically lower than its highest level of 120, recorded in But not all inventory is created equal! The inventory of homes priced above $1,000,000 was significantly more plentiful, with numbers higher than 2017 levels in all months but four. Meanwhile the shortage of homes priced below $200,000 (the median price of a home in 2017) was much more acute, running below the prior year almost every month of Homes priced below $200,000 represented 59% of the total market and were on the market for less than 20 days.


4 Median Pricing The YTD (Year-to-Date) median single-family price of $215,000 represented a 7.5% increase over Overall, pricing was up in 15 of Maine s 16 counties and remained consistent in one. The highest single month was May at $244,839, followed by April and then March. Each month of 2018 was higher than Between 2007 and 2011 median prices declined each year, reaching their lowest level in 2011 at $165,000. From 2012 onward, pricing has increased ever year, with one exception The largest jump came in June, when the median selling price in 2018 was $227,750 versus 205,000 in 2017, reflecting an increase of 11%. Single Family Prices Maine Condominium Prices Maine
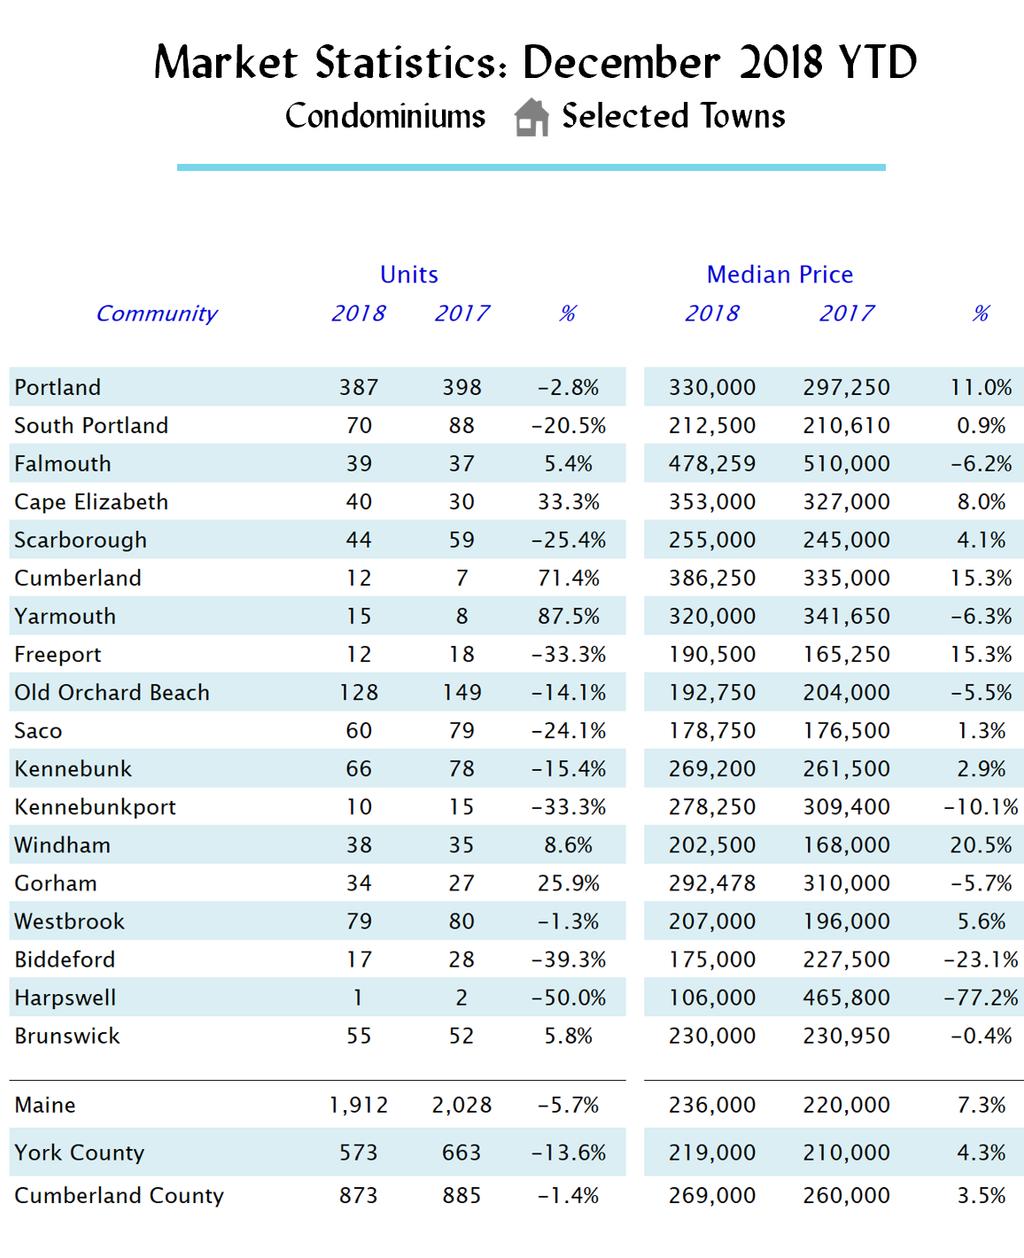
5 Both York and Cumberland counties experienced healthy price gains in The median price of $307,125 for Cumberland County is far and away the highest in the state, increasing 7.8% for the year. The median price in York County of $280,000 represented an 8.3% year-over-year increase. Cumberland County: Median Prices Cumberland County monthly prices ranged from a low of $284,500 in February to a high of $325,000 in May. Similar to statewide results, median prices were higher most months of 2018 versus Condos The chart at the end of this report includes median price comparisons for many towns in the greater Portland area. Virtually every community experienced significant price gains in 2018 vs Condos and townhomes sold represented 9.8% of the residential market, compared to 11.4% in The median price of a condo increased from $220,000 in 2017 to $236,000 in 2018, representing an increase of 7.2%. Overall, the number of units sold decreased 5.7%, reflecting a total of 1912 in The three largest markets for condos were Portland (387), Old Orchard Beach (128) and Wells (154). Unlike 2017, all three markets experienced a decline in units sold in Unlike the prior year, however, pricing increased in Portland and fell in the other two communities. In most local towns the percentage of condos sold is a small part of the overall sales mix, resulting in wide fluctuations in median prices on relatively small volumes. Condo sales represent only 4% of all residential properties sold in Maine and 19% in Cumberland and York counties combined. Regarding Portland, sales decreased 2.7% and prices increased by 11%, after increasing 10.1% the previous year. Despite the continued trend of higher-price, luxury units coming on the market in 2018, there were only 5 sales valued at over $1,000,000 compared to 10 in There were 121 total sales valued over $500,000, representing 21% of the total mix. Waterfront Properties Waterfront properties of all kinds are an important part of Maine real estate whether as a permanent residence or a vacation home. Sales of waterfront properties increased from 3,157 in 2017 to 3,253 in The median price also increased from $249,000 in 2017 to $265,000 in 2018, reversing a trend from previous years of declines in this market segment. This group of properties were on the market for 58 days, decreasing 21% from 2017 s median of 74 days. Inventory was considerably lower than prior years, contributing to higher overall selling prices. The sales of lakefront properties also increased in 2018 as 1,111 properties were sold statewide, reflecting a 1.3% increase. The median price, however, increased more significantly from $235,000 in 2017 to $250,000 reflecting a 6.3% hike. In Maine, lakefront homes range from small camps to large estates, and pricing can vary considerably. Additionally, these results include only those properties with actual owned waterfront, and like oceanfront homes, many with only views of the water can also be found in a similar wide range of prices.

6 Whether on the ocean or near a lake, second homes and vacation homes continue to increase as a larger percentage of the sales mix. The chart below includes all waterfront homes sold in Maine during the last two years. Owned Waterfront Only Lake & Ocean Again, focusing on Cumberland County, in 2018 there were 601 properties sold with waterfront compared to 629 in 2017, representing a decline of 4.4%. the median price increased 3.8% to $379,000. Luxury waterfront homes, defined as those priced over $1 million, decreased from 57 in 2017 to 54 in The median price, however, increased substantially from $1,500,000 to $1, a significant 18.3% Outside of Maine Across the country, December's declining home sales and increasing inventory solidified 2018 as the year the red-hot seller's market gravitated toward a more balanced market. Price growth also moderated, though December was the 33rd consecutive month of year-over-year increases in home prices, as reported by the National Association of Realtors (NAR). Total existing-home decreased 6.4 percent from November to a seasonally adjusted rate of 4.99 million in December. Sales as of yea-end were down 10.3% from a year ago versus up 1% in Maine for single family homes and down 5.7% for condos.

7 Most telling was December's 4.6% growth in inventory, which was also a report record. December's year-over-year inventory increase marked the third consecutive month of growth a trend reversing a decade-long streak of year-over-year inventory declines. Total housing inventory at the end of December decreased to 1.55 million units, down from 1.74 million existing homes available for sale in November - but represented an increase from 1.46 million a year ago. Unsold inventory was at a 3.7-month supply at the current sales pace, down from 3.9 last month and up from 3.2 months a year ago. Home buyers paid record amounts throughout 2018 as prices grew year-over-year in every month last year, led by June's Median Sold Price of $258,500 an all-time high. Even so, December's year-over-year increase of 2.1% was 2018's smallest, and far lower than the 8.1% price growth from December 2016 to December December existing-home sales in the Northeast decreased 6.8% to an annual rate of 690,000, 6.8% below a year ago. The median price in the Northeast was $283,400, which is was 8.2% ahead of December Online Results Updated Monthly On our website ( you will find profiles of most southern Maine communities, which include reviews and commentaries of 2018 real estate sales, along with monthly 2019 updates. As always, real estate continues to be extremely local and very specific. Understanding the differences and local nuances is critical in any buying or selling decision. The charts below include 2018 real estate sales for the state of Maine, Cumberland and York Counties and selected communities. Additional information is also available on our website at If you do not find what you are looking for, we can prepare custom reports.
8
9
2015 First Quarter Market Report
 2015 First Quarter Market Report CAAR Member Copy Expanded Edition Charlottesville Area First Quarter 2015 Highlights: Median sales price for the region was up 5.1% over Q1-2014, rising from $244,250 to
nd Quarter Market Report
 2015 2 nd Quarter Market Report The voice of real estate in Central Virginia CAAR Member Copy Expanded Edition Charlottesville Area 2 nd Quarter 2015 Highlights: Closed sales in the Greater Charlottesville
San Francisco Housing Market Update
 San Francisco Housing Market Update California Economic and Housing Market Outlook The national economy maintained a healthy growth rate in the first quarter of 2005 and appeared to be settling in for
2013 Year-End Market Report
 2013 Year-End Market Report The voice of real estate in Central Virginia CAAR Member Copy Expanded Edition Charlottesville Area Year-End 2013 Highlights: Yearly home sales in Greater Charlottesville were
FOR IMMEDIATE RELEASE Contact: Brenda Morton Dulles Area Association of REALTORS
 FOR IMMEDIATE RELEASE Contact: Brenda Morton 703 777 2468 Dulles Area Association of REALTORS bmorton@dullesarea.com February 2018 Loudoun County Market Trends Report Inventory reaches yet another record
August 2017 Loudoun County Market Trends Report Sales Price Reaches Record High; Sales Decline; Inventory Remains Low
 FOR IMMEDIATE RELEASE Contact: Christine Windle 703 777 2468 Dulles Area Association of REALTORS cwindle@dullesarea.com August 2017 Loudoun County Market Trends Report Sales Price Reaches Record High;
MARKET AREA UPDATE Year: 2017 Report as of: 1Q 2Q 3Q 4Q
 MARKET AREA UPDATE Year: 2 Report as of: 1Q 2Q 3Q 4Q Market Area (City, State): Fort Myers/Cape Coral, Florida Provided by (Company / Companies): Real Estate Provided by RDC Member(s): What are the most
ECONOMIC CURRENTS. Vol. 4, Issue 3. THE Introduction SOUTH FLORIDA ECONOMIC QUARTERLY
 ECONOMIC CURRENTS THE Introduction SOUTH FLORIDA ECONOMIC QUARTERLY Vol. 4, Issue 3 Economic Currents provides an overview of the South Florida regional economy. The report presents current employment,
August 2015 Washington, DC Market Trends Report Limited supply, high demand continue pushing prices to record highs
 FOR IMMEDIATE RELEASE Contact: Bobette Banks 301-590-8764 Director of Communications Greater Capital Area Association of REALTORS bbanks@gcaar.com August 2015 Washington, DC Market Trends Report Limited
FOR IMMEDIATE RELEASE Contact: Bobette Banks Director of Communications Greater Capital Area Association of REALTORS
 FOR IMMEDIATE RELEASE Contact: Bobette Banks 301-590-8764 Director of Communications Greater Capital Area Association of REALTORS bbanks@gcaar.com November 2015 Washington, DC Market Trends Report Median
January 2018 Loudoun County Market Trends Report Inventory has another record low month; home sales continue to decline compared to last year.
 FOR IMMEDIATE RELEASE Contact: Brenda Morton 703 777 2468 Dulles Area Association of REALTORS bmorton@dullesarea.com January 2018 Loudoun County Market Trends Report Inventory has another record low month;
FOR IMMEDIATE RELEASE Contact: Brenda Morton Dulles Area Association of REALTORS
 FOR IMMEDIATE RELEASE Contact: Brenda Morton 703 777 2468 Dulles Area Association of REALTORS bmorton@dullesarea.com August 2018 Loudoun County Market Trends Report Despite persistent low inventory, sales
MARKET IN A MINUTE A SUMMARY OF MARKET CONDITIONS FOR SEPTEMBER & 3rd QUARTER 2017
 STATPAK LOUDOUN COUNTY OCTOBER 2017 McEnearney.com MARKET IN A MINUTE A SUMMARY OF MARKET CONDITIONS FOR SEPTEMBER & 3rd QUARTER 2017 Contract activity in September 2017 was up just 0.6% from September
November 2017 Loudoun County Market Trends Report Inventory decline persists as total and new listings are down; Sales growth continues to drop
 FOR IMMEDIATE RELEASE Contact: Brenda Morton 703 777 2468 Dulles Area Association of REALTORS bmorton@dullesarea.com November 2017 Loudoun County Market Trends Report Inventory decline persists as total
February 2016 Loudoun County Market Trends Report Contracts and sales activity jump double-digits; Inventories down 15.5 percent
 FOR IMMEDIATE RELEASE Contact: Christine Windle 703-777-2468, cwindle@dullesarea.com Sponsored by: Access National Bank Tom Ciolkosz, (703) 871-1045, tciolkosz@accessnationalbank.com Patty Foster, 703-871-1014,
FEBRUARY 2019 Harrisonburg & Rockingham County Real Estate Market Report
 FEBRUARY 219 Real Estate Market Report An analysis of real estate activity through January 31, 219 provided courtesy of Scott P. Rogers, Funkhouser Real Estate Group Immaculate Brick Highland Park Colonial
The Corcoran Report 4Q16 MANHATTAN
 The Corcoran Report 4Q16 MANHATTAN Contents Fourth Quarter 2016 4/7 12/23 3 Overview 8 9 10 Market Wide 11 Luxury 24 2 Sales / Days on Market 3 Inventory / Months of Supply 4 5 Market Share Resale Co-ops
Pikes Peak area housing Market Statistics (As of: 2/28/2018)
") Jan-1-1 -1-1 Jan-2-2 -2-2 Jan-3-3 -3-3 -4-4 -4-5 -5-5 -6-6 -6-7 -7-7 -8-8 -8-9 -9-9 -1-1 -1-11 -11-11 -12-12 -12-13 -13-13 -14-14 -14-15 -15-15 -16-16 -16-17 -17-17 Jan-1-1 -1-1 Jan-2-2 -2-2 Jan-3-3 -3-3
Jan-1-1 -1-1 Jan-2-2 -2-2 Jan-3-3 -3-3 -4-4 -4-5 -5-5 -6-6 -6-7 -7-7 -8-8 -8-9 -9-9 -1-1 -1-11 -11-11 -12-12 -12-13 -13-13 -14-14 -14-15 -15-15 -16-16 -16-17 -17-17 Jan-1-1 -1-1 Jan-2-2 -2-2 Jan-3-3 -3-3
May 2018 Loudoun County Market Trends Report Tight inventory continues while price growth stagnates; Condo sales hit a record high.
 FOR IMMEDIATE RELEASE Contact: Brenda Morton 703 777 2468 Dulles Area Association of REALTORS bmorton@dullesarea.com May 2018 Loudoun County Market Trends Report Tight inventory continues while price growth
Pikes Peak area housing Market Statistics (As of: 9/30/2018)
") $156,25 $184, $174,697 $177,2 $21,53 $185,83 $173, $178,29 $172,25 $212,75 $21,95 $226,692 $197,5 $199, $196, $28, $25, $223,95 $216,75 $29,527 $234,9 $218,82 $229,74 $235,518 $231,457 $255, $259,11 $269,98
$156,25 $184, $174,697 $177,2 $21,53 $185,83 $173, $178,29 $172,25 $212,75 $21,95 $226,692 $197,5 $199, $196, $28, $25, $223,95 $216,75 $29,527 $234,9 $218,82 $229,74 $235,518 $231,457 $255, $259,11 $269,98
MARKET AREA UPDATE Report as of: 1Q 2Q 3Q 4Q
 MARKET AREA UPDATE Report as of: 1Q 2Q 3Q 4Q Year: 2013 Market Area (City, State): Arlington, Virginia Provided by (Company / Companies): McEnearney Associates, Inc. Realtors What are the most significant
ECONOMIC CURRENTS. Vol. 3, Issue 3 SOUTH FLORIDA ECONOMIC QUARTERLY. Introduction
 ECONOMIC CURRENTS THE Introduction SOUTH FLORIDA ECONOMIC QUARTERLY Economic Currents provides an overview of the South Florida regional economy. The report presents current employment, economic and real
MARCH 2019 Harrisonburg & Rockingham County Real Estate Market Report
 MARCH 219 Real Estate Market Report An analysis of real estate activity through February 28, 219 provided courtesy of Scott P. Rogers, Funkhouser Real Estate Group Spacious Four Bedroom Brick Colonial
RESIDENTIAL MARKET ANALYSIS
 RESIDENTIAL MARKET ANALYSIS CLANCY TERRY RMLS Student Fellow Master of Real Estate Development Candidate Oregon and national housing markets both demonstrated shifting trends in the first quarter of 2015
ECONOMIC CURRENTS. Vol. 5 Issue 2 SOUTH FLORIDA ECONOMIC QUARTERLY. Key Findings, 2 nd Quarter, 2015
 ECONOMIC CURRENTS THE Introduction SOUTH FLORIDA ECONOMIC QUARTERLY Economic Currents provides an overview of the South Florida regional economy. The report presents current employment, economic and real
STATPAK MARKET IN A MINUTE A SUMMARY OF MARKET CONDITIONS FOR AUGUST McEnearney.com CONTRACTS URGENCY INDEX INVENTORY INTEREST RATES
 STATPAK WASHINGTON, DC SEPTEMBER 2017 McEnearney.com MARKET IN A MINUTE A SUMMARY OF MARKET CONDITIONS FOR AUGUST 2017 Contract activity in August 2017 was up 4.9% from August 2016, and there were increases
September 2018 Loudoun County Market Trends Report Inventory continues to tighten as prices increase and closed sales decline
 FOR IMMEDIATE RELEASE Contact: Brenda Morton 703 777 2468 Dulles Area Association of REALTORS bmorton@dullesarea.com September 2018 Loudoun County Market Trends Report Inventory continues to tighten as
California Housing Market Update. Monthly Sales and Price Statistics September 2018
 California Housing Market Update Monthly Sales and Price Statistics September 2018 Sales Had the Largest Decline since March 2014 California, September 2018 Sales: 382,550 Units, -3.3% YTD, -12.4% YTY
The Corcoran Report 3Q17 MANHATTAN
 The Corcoran Report 3Q17 MANHATTAN Contents Third Quarter 2017 4/7 12/23 3 Overview 8 9 10 Market Wide 11 Luxury 24 4 Sales / Days on Market 5 Inventory / Months of Supply 6 7 Market Share Resale Co-ops
California Housing Market Update. Monthly Sales and Price Statistics October 2018
 California Housing Market Update Monthly Sales and Price Statistics October 2018 Sales Had the 2 nd Largest Drop in the Last 6 Months California, October 2018 Sales: 397,060 Units, -3.7% YTD, -7.9% YTY
PRINCE GEORGE S COUNTY AUGUST 2018
 STATPAK PRINCE GEORGE S COUNTY AUGUST 2018 McEnearney.com MARKET IN A MINUTE A SUMMARY OF MARKET CONDITIONS FOR JULY 2018 Contract activity in July 2018 was up 19.7% from July 2017, and through the first
rd Quarter Market Report
 2012 3 rd Quarter Market Report The voice of real estate in Central Virginia CAAR Member Copy Expanded Edition Charlottesville Area 3 rd Quarter 2012 Highlights: Overall sales in Greater Charlottesville
September 2017 Washington, DC Market Trends Report September median sales price drops 6.4 percent but still near record high
 FOR IMMEDIATE RELEASE Contact: Bobette Banks 301-590-8764 Director of Communications Greater Capital Area Association of REALTORS bbanks@gcaar.com September 2017 Washington, DC Market Trends Report September
California Housing Market Update. Monthly Sales and Price Statistics January 2018
 California Housing Market Update Monthly Sales and Price Statistics January 2018 Sales Started with a Slight Decrease California, Jan. 2018 Sales: 388,800 Units, -2.9% YTD, -2.9% YTY 700,000 600,000 500,000
MARKET AREA UPDATE Year: 2017 Report as of: 1Q 2Q 3Q 4Q
 MARKET AREA UPDATE Year: 2017 Report as of: 1Q 2Q 3Q 4Q Market Area (City, State): Los Angeles County, CA Provided by (Company / Companies): Coldwell Banker Residential Brokerage - SoCal Provided by RDC
May 2016 Loudoun County Market Trends Report Homes selling twice as fast as 2015 with re-emergence of seller s market
 FOR IMMEDIATE RELEASE Contact: Christine Windle 703-777-2468 Dulles Area Association of REALTORS cwindle@dullesarea.com Sponsored by: Access National Bank Tom Ciolkosz, (703) 871-1045, tciolkosz@accessnationalbank.com
Monthly Indicators - 8.1% + 3.6% - 0.6% Activity Overview New Listings Pending Sales. Closed Sales. Days on Market Until Sale. Median Sales Price
 Monthly Indicators 2019 In addition to ongoing housing price increases and affordability concerns in the state of New York, the first quarter of 2019 saw a fair share of adverse weather as well. Sales
May 2016 Washington, DC Market Trends Report Listings continue to move quickly as sales climb nearly 14 percent
 FOR IMMEDIATE RELEASE Contact: Bobette Banks 301-590-8764 Director of Communications Greater Capital Area Association of REALTORS bbanks@gcaar.com May 2016 Washington, DC Market Trends Report Listings
March 2016 Washington, DC Market Trends Report March sales represent a 12 percent increase; top the five-year March average
 FOR IMMEDIATE RELEASE Contact: Bobette Banks 301-590-8764 Director of Communications Greater Capital Area Association of REALTORS bbanks@gcaar.com March 2016 Washington, DC Market Trends Report March sales
California Housing Market Update. Monthly Sales and Price Statistics December 2018
 California Housing Market Update Monthly Sales and Price Statistics December 2018 Sales Reached the Lowest Level since Jan 2015 California, December 2018 Sales: 372,260 Units, -5.2% YTD, -11.6% YTY 700,000
ECONOMIC CURRENTS. Vol. 3, Issue 1. THE SOUTH FLORIDA ECONOMIC QUARTERLY Introduction
 ECONOMIC CURRENTS THE SOUTH FLORIDA ECONOMIC QUARTERLY Introduction Economic Currents provides an overview of the South Florida regional economy. The report contains current employment, economic and real
Connecticut First Nine Months Housing Report 2014
 Connecticut First Nine Months Housing Report 2014 First Nine Months of 2014 Highlight Positive Outlook for Multi-family Home Construction Millennial buyers are finally increasing their rate of household
Monthly Indicators + 9.9% - 1.7% % Activity Overview New Listings Pending Sales. Closed Sales. Days on Market Until Sale. Median Sales Price
 Monthly Indicators 2015 All expectations in 2015 are for a healthy and energetic selling season. National stories have been highlighting an increase in new construction sales and pending sales, but national
Peter Comitini Senior VP Associate Broker The Corcoran Group
 Sutton Area TriBeCa Upper East Side Upper West Side Washington Heights West Village Battery Park City Beekman Carnegie Hill Central Park South Chelsea Flatiron Clinton East Harlem East Village Financial
MARKET AREA UPDATE Year: 2018 Report as of: 1Q 2Q 3Q 4Q
 Market Area (City, State): Los Angeles County, CA Provided by (Company / Companies): Coldwell Banker Residential Brokerage - SoCal Provided by RDC Member(s): Thomas Hilmar MARKET AREA UPDATE Year: 2018
See Full Corridor Study Volumes I and II as separate attachments.
 See Full Corridor Study Volumes I and II as separate attachments. See Housing Values 2000-2010 and 2000-2013 as separate attachments. 2013 2 nd Quarter and Mid-Year Market Report The voice of real estate
MARKET AREA UPDATE Year: 2017 Report as of: 1Q 2Q 3Q 4Q
 MARKET AREA UPDATE Year: 2017 Report as of: 1Q 2Q 3Q 4Q Market Area (City, State): San Diego County Provided by (Company / Companies): Coldwell Banker Residential Brokerage - SoCal Provided by RDC Member(s):
May 2016 Montgomery County Market Trends Report Double-digit gains in closed sales, exceeding the five-year May average
 FOR IMMEDIATE RELEASE Contact: Bobette Banks 301-590-8764 Director of Communications Greater Capital Area Association of REALTORS bbanks@gcaar.com May 2016 Montgomery County Market Trends Report Double-digit
MARKET IN A MINUTE A SUMMARY OF MARKET CONDITIONS FOR MARCH & 1st QUARTER 2016
 STATPAK ` WASHINGTON, DC APRIL 2016 MARKET IN A MINUTE A SUMMARY OF MARKET CONDITIONS FOR MARCH & 1st QUARTER 2016 Contract activity in March 2016 was up 12.6% from March of 2015, and there were increases
MONTGOMERY COUNTY JULY 2018
 STATPAK MONTGOMERY COUNTY JULY 2018 McEnearney.com MARKET IN A MINUTE A SUMMARY OF MARKET CONDITIONS FOR JUNE & FIRST HALF 2018 Contract activity in June 2018 was up 1.2% from June 2017, solely because
ARLA Members Survey of the Private Rented Sector
 Prepared for The Association of Residential Letting Agents ARLA Members Survey of the Private Rented Sector Second Quarter 2014 Prepared by: O M Carey Jones 5 Henshaw Lane Yeadon Leeds LS19 7RW June, 2014
Lake Martin Waterfront Residential Report September 2018
 Lake Martin Waterfront Residential Report September 18 Monthly Indicators Recent Figures Trends Total Residential Sales Current Month September 18 29 Lake Martin Waterfront residential* sales during the
California Housing Market Update. Monthly Sales and Price Statistics November 2018
 California Housing Market Update Monthly Sales and Price Statistics November 2018 Home Sales: Largest Decline Since 2014 California, November 2018 Sales: 381,400 Units, -4.6% YTD, -13.4% YTY 700,000 600,000
NORTHERN VIRGINIA NOVEMBER 2017
 STATPAK NORTHERN VIRGINIA NOVEMBER 2017 McEnearney.com MARKET IN A MINUTE A SUMMARY OF MARKET CONDITIONS FOR OCTOBER 2017 Contract activity in October 2017 was up 3.8% from October 2016, and there were
OCTOBER 2018 Harrisonburg & Rockingham County Real Estate Market Report
 OCTOBER 218 Real Estate Market Report An analysis of real estate activity through September 3, 218 provided courtesy of Scott P. Rogers, Funkhouser Real Estate Group Five Bedroom City Home with Finished
STATPAK MARKET IN A MINUTE A SUMMARY OF MARKET CONDITIONS FOR FEBRUARY McEnearney.com CONTRACTS URGENCY INDEX INVENTORY INTEREST RATES
 STATPAK LOUDOUN COUNTY MARCH 2018 McEnearney.com MARKET IN A MINUTE A SUMMARY OF MARKET CONDITIONS FOR FEBRUARY 2018 Contract activity in February 2018 was almost unchanged, up just 0.2% from February
MARKET AREA UPDATE Report as of: 1Q 2Q 3Q 4Q
 Year: 2013 Market Area (City, State): Baltimore Metropolitan Area MARKET AREA UPDATE Report as of: 1Q 2Q 3Q 4Q Provided by (Company / Companies): LONG & FOSTER REAL ESTATE, INC. What are the most significant
Monthly Indicators - 6.1% + 8.6% + 1.8% Activity Overview New Listings. Closed Sales Median Sales Price
 Monthly Indicators 2018 Just like last year at this time, prospective home buyers should expect a competitive housing market for the next several months. With payrolls trending upward and unemployment
Housing Indicators in Tennessee
 Housing Indicators in l l l By Joe Speer, Megan Morgeson, Bettie Teasley and Ceagus Clark Introduction Looking at general housing-related indicators across the state of, substantial variation emerges but
NOVEMBER 2018 Harrisonburg & Rockingham County Real Estate Market Report
 NOVEMBER 218 Real Estate Market Report An analysis of real estate activity through October 31, 218 provided courtesy of Scott P. Rogers, Funkhouser Real Estate Group Custom-Built Highland Park Home with
FOR IMMEDIATE RELEASE Contact: Bobette Banks Director of Communications Greater Capital Area Association of REALTORS
 FOR IMMEDIATE RELEASE Contact: Bobette Banks 301-590-8764 Director of Communications Greater Capital Area Association of REALTORS bbanks@gcaar.com April 2016 Washington, DC Market Trends Report Sales and
HOUSING REPORT WASHTENAW SEPTEMBER 2018
 WASHTENAW SEPTEMBER 2018 Washtenaw County Recovery Run How Much Longer? This month marks the 10-year anniversary of the market peak prior to the burst of the housing bubble. The nationwide median home
Monthly Indicators - 8.0% + 4.2% - 3.4% Activity Overview New Listings Pending Sales. Closed Sales. Days on Market Until Sale. Median Sales Price
 Monthly Indicators 2018 If the last few months are an indication of the temperature of housing markets across the country, a period of relative calm can be expected during the last three months of the
CITI HABITATS. Manhattan Residential Sales Market Report
 Manhattan Residential Sales Market Report Contents 4/7 12/17 3 8 9 10 Market Wide 4 Sales / Days on Market 5 / Months of Supply 6 7 Market Share Resale Co-ops Resale Condos New Developments 11 Luxury Neighborhoods
STATPAK MARKET IN A MINUTE A SUMMARY OF MARKET CONDITIONS FOR JULY McEnearney.com CONTRACTS URGENCY INDEX INVENTORY INTEREST RATES AFFORDABILITY
 STATPAK LOUDOUN COUNTY AUGUST 2017 McEnearney.com MARKET IN A MINUTE A SUMMARY OF MARKET CONDITIONS FOR JULY 2017 Contract activity in July 2017 was down 8.7% from July 2016, and there were decreases in
PRINCE GEORGE S COUNTY JULY 2018
 STATPAK PRINCE GEORGE S COUNTY JULY 2018 McEnearney.com MARKET IN A MINUTE A SUMMARY OF MARKET CONDITIONS FOR JUNE & FIRST HALF 2018 Contract activity in June 2018 was up 16.4% from June 2017, and through
MARKET AREA UPDATE Year: 2018 Report as of: 1Q 2Q 3Q 4Q
 MARKET AREA UPDATE Year: 2 Report as of: 1Q 2Q 3Q 4Q Market Area (City, State): Dallas-Fort Worth & N. Texas Metropolitan Area Provided by (Company / Companies): Coldwell Banker Residential Brokerage,
The Impact of Market Rate Vacancy Increases Eight-Year Report
 The Impact of Market Rate Vacancy Increases Eight-Year Report January 1, 1999 - December 31, 2006 Santa Monica Rent Control Board March 2007 TABLE OF CONTENTS Summary 1 Units Rented at Market Rates Rates
STATPAK MARKET IN A MINUTE A SUMMARY OF MARKET CONDITIONS FOR MAY McEnearney.com CONTRACTS URGENCY INDEX INVENTORY INTEREST RATES AFFORDABILITY
 STATPAK WASHINGTON, DC JUNE 2017 McEnearney.com MARKET IN A MINUTE A SUMMARY OF MARKET CONDITIONS FOR MAY 2017 Contract activity in May 2017 was up 2.9% from May 2016, and there were increases for the
The Corcoran Report 2Q 2018 MANHATTAN
 The Corcoran Report 2Q 218 MANHATTAN 2Q218 MANHATTAN 2 Overview Closed Sales 3,193-14 YEAR OVER YEAR +26 QUARTER OVER QUARTER Closed sales declined 14 annually versus Second Quarter 217. All product types
The Impact of Market Rate Vacancy Increases Eleven-Year Report
 The Impact of Market Rate Vacancy Increases Eleven-Year Report January 1, 1999 - December 31, 2009 Santa Monica Rent Control Board April 2010 TABLE OF CONTENTS Summary 1 Vacancy Decontrol s Effects on
November 2017 Washington, DC Market Trends Report Median sales price ties last year for highest November level on record
 FOR IMMEDIATE RELEASE Contact: Bobette Banks 301-590-8764 Director of Communications Greater Capital Area Association of REALTORS bbanks@gcaar.com November 2017 Washington, DC Market Trends Report Median
STATPAK MARKET IN A MINUTE A SUMMARY OF MARKET CONDITIONS FOR JANUARY McEnearney.com CONTRACTS URGENCY INDEX INVENTORY INTEREST RATES
 STATPAK LOUDOUN COUNTY FEBRUARY 2018 McEnearney.com MARKET IN A MINUTE A SUMMARY OF MARKET CONDITIONS FOR JANUARY 2018 Contract activity in January 2018 was down just 2.0% from January 2017, but that is
Economic Highlights. Payroll Employment Growth by State 1. Durable Goods 2. The Conference Board Consumer Confidence Index 3
 August 26, 2009 Economic Highlights Southeastern Employment Payroll Employment Growth by State 1 Manufacturing Durable Goods 2 Consumer Spending The Conference Board Consumer Confidence Index 3 Real Estate
California Housing Market Update. Monthly Sales and Price Statistics May 2018
 California Housing Market Update Monthly Sales and Price Statistics May 2018 Sales Lost Momentum as Mortgage Rates Continued to Climb California, May 2018 Sales: 409,270 Units, +0.3% YTD, -4.6% YTY 700,000
1 Q M A NH AT TA N M A R K E T R E P O R T
 1Q2018 MANHATTAN M A R K E T R E P O R T INTRODUCTION M A N H A T T A N S A L E S R E P O R T Q 1 2 0 1 8 : THE NECESSITY OF BALANCE The first quarter of 2018 was a balancing act supported by declines
NORTHERN VIRGINIA MARCH 2017
 STATPAK NORTHERN VIRGINIA MARCH 2017 McEnearney.com MARKET IN A MINUTE A SUMMARY OF MARKET CONDITIONS FOR FEBRUARY 2017 Contract activity in February 2017 was up 4.0% from February 2016, and there were
New York City Market Update First Quarter sothebyshomes.com/nyc
 New York City Market Update First Quarter 217 MANHATTAN BROKERAGES Downtown 149 Fifth Avenue, 4 th Floor t: 212.431.244 East Side 38 East 61 st Street t: 212.66.766 West Side 2244 Broadway t: 212.579.93
MONTGOMERY COUNTY MAY 2018
 STATPAK MONTGOMERY COUNTY MAY 2018 McEnearney.com MARKET IN A MINUTE A SUMMARY OF MARKET CONDITIONS FOR APRIL 2018 Contract activity in April 2018 was up just 0.9% from, but there were increases in four
WISCONSIN HOUSING MARKETPLACE
 WISCONSIN REALTORS ASSOCIATION WISCONSIN HOUSING MARKETPLACE Date: 2/16/06 For Release: Immediately For More Information Contact: David E. Clark, Economist C3 Statistical Solutions Inc. Office phone: 414-803-6537
STATPAK MARKET IN A MINUTE A SUMMARY OF MARKET CONDITIONS FOR JULY McEnearney.com CONTRACTS URGENCY INDEX INVENTORY INTEREST RATES AFFORDABILITY
 STATPAK WASHINGTON, DC AUGUST 2018 McEnearney.com MARKET IN A MINUTE A SUMMARY OF MARKET CONDITIONS FOR JULY 2018 Contract activity in July 2018 was up just 0.5% from July 2017. Through the first seven
STATPAK MARKET IN A MINUTE A SUMMARY OF MARKET CONDITIONS FOR APRIL McEnearney.com CONTRACTS URGENCY INDEX INVENTORY INTEREST RATES
 STATPAK WASHINGTON, DC MAY 2018 McEnearney.com MARKET IN A MINUTE A SUMMARY OF MARKET CONDITIONS FOR APRIL 2018 Contract activity in April 2018 was up 9.4% from April 2017, and four of the six price categories
MANHATTAN MARKET REPORT. 2nd Quarter 2017 RESALE
 MANHATTAN MARKET REPORT 2nd Quarter 2017 RESALE LETTER FROM THE PRESIDENT We are pleased to introduce the very first Berkshire Hathaway HomeServices New York Properties Manhattan Market Report, featuring
Hamilton Heights Manhattan. Morningside Heights Harlem
 Sutton Area TriBeCa Upper East Side Upper West Side Washington Heights West Village The Corcoran Report Battery Park City Beekman Carnegie Hill Central Park South Chelsea Flatiron Clinton East Harlem East
Year to Date (thru June)
") CAAR Market Report 2009 Mid-Year Published by the Charlottesville Area Association of REALTORS Where Are We Now? The pace of home purchases in the Charlottesville area continues to improve from the dismal
CAAR Market Report 2009 Mid-Year Published by the Charlottesville Area Association of REALTORS Where Are We Now? The pace of home purchases in the Charlottesville area continues to improve from the dismal
2017 RESIDENTIAL REAL ESTATE MARKET REPORT
 2017 RESIDENTIAL REAL ESTATE MARKET REPORT Published January 26, 2018 Our market reports have been focused on the effects of low inventory on our housing market and for good reason. December 2017 marked
June 2018 Washington, DC Market Trends Report Median sales price reaches highest June level on record
 FOR IMMEDIATE RELEASE Contact: Bobette Banks 301-590-8764 Director of Communications Greater Capital Area Association of REALTORS bbanks@gcaar.com June 2018 Washington, DC Market Trends Report Median sales
Monthly Indicators % % % Activity Overview New Listings Pending Sales. Closed Sales. Days on Market Until Sale. Median Sales Price
 Monthly Indicators 2018 Last year, U.S. consumers seemed to be operating with a renewed but cautious optimism. The stock market was strong, wages were edging upwards and home buying activity was extremely
Manhattan Rental Market Report August 2013 mns.com
 Manhattan Rental Market Report August 2013 TABLE OF CONTENTS 03 Introduction 04 A Quick Look 07 Mean Manhattan Rental Prices 11 Manhattan Price Trends 12 Neighborhood Price Trends 12 Battery Park City
Characteristics of Recent Home Buyers
 Characteristics of Recent Home Buyers Special Studies, February 1, 2019 By Carmel Ford Economics and Housing Policy National Association of Home Builders Introduction To analyze home buyers NAHB uses the
RESIDENTIAL MARKET ANALYSIS
 RESIDENTIAL MARKET ANALYSIS The following market analysis is a two-part analysis that is designed to concentrate on the two types of residential development applicable to the subject. The first analysis
DATA FOR FEBRUARY Published March 20, Sales are up +19.6% month-over-month. The year-over-year comparison is down -7.3%.
 Permission is granted only to ARMLS Subscribers for reproduction with attribution on to ARMLS COPYRIGHT 2019. For questions regarding this publication contact Brand@ARMLS.com. DATA FOR FEBRUARY 2019 -
High-priced homes have a unique place in the
 Livin' Large Texas' Robust Luxury Home Market Joshua G. Roberson December 3, 218 Publication 2217 High-priced homes have a unique place in the overall housing market. Their buyer pool, home characteristics,
Montgomery Residential Report February 2018
 Montgomery Residential Report February 2018 Monthly Indicators Recent Figures Trends Total Home Sales Current Month February 2018 274 vs. Prior Month January 2018 239 14.6% vs. Last Year February 2017
The Greater Reno-Tahoe Real Estate Report
 February, 2018February, 2018 February, 2018 Issue The Greater Reno-Tahoe Real Estate Report Housing Market Trends for: Reno, Sparks, Carson City, Carson Valley, Lake Tahoe, Dayton, and Fernley A FREE monthly
Connecticut Full Year Housing Report
 Connecticut 2014 Full Year Housing Report As 2014 Closes, Increasing Market Confidence Predicts a Solid Start to 2015 With an influx of Millennial, Gen X and Baby Boomer buyers, a strong spring market
April 2018 Washington, DC Market Trends Report Home sales up 9.4 percent; median sales price reaches highest April on record
 N FOR IMMEDIATE RELEASE Contact: Bobette Banks 301-590-8764 Director of Communications Greater Capital Area Association of REALTORS bbanks@gcaar.com April 2018 Washington, DC Market Trends Report Home
The Corcoran Report 4Q17 TOWN OF PALM BEACH & BARRIER ISLANDS
 The Corcoran Report 4Q17 TOWN OF PALM BEACH & BARRIER ISLANDS Town of Palm Beach 19 $8.379M $5.717M 19% 102% 92% 52 $607K $364K -7% WEB# 5301358 on corcoran.com 14% 2017 4Q Corcoran Report Palm Beach In
RESIDENTIAL MARKET ANALYSIS
 RESIDENTIAL MARKET ANALYSIS EVAN ABRAMOWITZ RMLS Student Fellow Master of Real Estate Development Graduate Student September existing-home sales declined modestly, but inventory continued to tighten and
Monthly Indicators - 6.8% + 5.8% % Activity Overview New Listings Pending Sales. Closed Sales. Days on Market Until Sale. Median Sales Price
 Monthly Indicators 218 Some economy observers are pointing to 218 as the final period in a long string of sentences touting several happy years of buyer demand and sales excitement for the housing industry.