August 2017 Loudoun County Market Trends Report Sales Price Reaches Record High; Sales Decline; Inventory Remains Low
|
|
|
- Beryl Hubbard
- 5 years ago
- Views:
Transcription
 The following analysis of the Loudoun")

1 FOR IMMEDIATE RELEASE Contact: Christine Windle Dulles Area Association of REALTORS August 2017 Loudoun County Market Trends Report Sales Price Reaches Record High; Sales Decline; Inventory Remains Low Ashburn, VA (September 14, 2017) The following analysis of the Loudoun County, Virginia housing market has been prepared by George Mason University s Center for Regional Analysis. It was prepared for the Dulles Area Association of REALTORS by analyzing Bright MLS housing data from MarketStats by ShowingTime. Overview Loudoun County s median home sale price reached $478,500 in August an increase of 8.1 percent on an annualized basis. This is the highest overall median sales value in over a decade. Sales growth continues to stall as the 663 closed sales in August was a decrease of 4.6 percent over August Fewer buyers signed contracts to buy homes in August compared to last year new pending sales decreased 3.1 percent to 597. This is a sign that low inventory is likely suppressing sales, as both limited choices and climbing home prices sideline prospective buyers. For the 26 th consecutive month, active inventory declined. At the end of August, inventory was 14.8 percent lower than the same point last year. This left 1,437 homes for sale at month s end, with 2.6 months of supply heading into September. New listing activity increased in August versus last year (+6.7 percent). Loudoun County added 781 new homes to the market in August the highest number of August new listings since This signals some respite from the market s consistently low supply of homes, however, the number of year to date new listings is down 1.3 percent from this time last year. Loudoun County homes continue to sell faster than last year, with half of the August sales listing for 18 days or less, down from August 2016 s median of 25. Loudoun County home sellers received on average 97.9 percent of original list price in August. Detached single family homes saw their highest median sale price on record of $631,000 and were the only segment to increase in sales up 2.1 percent from last August. 1


2 Loudoun County Home Prices and Sales Median Sales Price Closed Sales Aug 17 Aug 16 YoY Aug 17 Aug 16 YoY 22066, Great Falls $990,000 $892, % % 20105, Aldie $633,500 $539, % % 20148, Ashburn $530,783 $479, % % 20176, Leesburg $519,995 $449, % % 20132, Purcellville $517,597 $521, % % 20152, Chantilly $510,000 $441, % % Loudoun County $478,500 $442, % % 20147, Ashburn $440,000 $408, % % 20165, Sterling $422,500 $425, % % 20175, Leesburg $375,000 $405, % % 20164, Sterling $365,000 $333, % % *ZIP codes with <20 August sales excluded Home Prices 2

, Leesburg s 20176 (+15.6 percent), and Chantilly s 20152 (+15.5 percent) led these price levels.")
3 August s median home sale price of $478,500 represents an increase of 8.1 percent over last year and 8 percent above the 5 year August average. This is the highest median sales value in more than a decade. The detached segment surged to a median sales price of $631,000 up 6.2 percent vs. August 2016 making it the highest on record. Townhouses ($420,200; +6.3 percent) and condos ($285,500; +5.7 percent) also saw year over year increases. Median price levels were up in seven of the ten Loudoun ZIP codes that had 20 or more sales. Large year over year price gains in Aldie s (+17.3 percent), Leesburg s (+15.6 percent), and Chantilly s (+15.5 percent) led these price levels. Great Falls remains the most expensive zip code with a median sales price of $990,000. Leesburg s was the only zip code with a substantial decrease in median sales price dropping 7.5 percent from August Purcellville s and Sterling s remained relatively stable in median sales price over the same period. Sterling s remains Loudoun County s most affordable ZIP code, with a median sales price of $365,000. 3
4 Closed Sales Loudoun County had 663 closed sales in August 13 less than last month and 32 (4.6 percent) less than August Sales are up 3 percent so far this year compared to the same period last year. Detached homes were the only segment to increase in sales up 2.1 percent from last August at 340. Townhouse sales declined significantly at 13.7 percent to 227, while condo sales decreased 3 percent from August 2016 to 96 sales. August closed sales increased in four of the ten Loudoun ZIP codes analyzed, led by a 26.9 percent jump in Aldie s 20105, where sales increased from 52 to 66 over last year. So far this year, Aldie s has the largest growth in number of sales up 26.2 percent over the first eight months of Making up for a slump in sales last month, Chantilly s increased 17.9 percent from last year. Leesburg s saw the largest decrease in sales volume from August 2016 decreasing 36.1 percent to 53 sales. Purcellville s ( 22.7 percent) and Sterling s ( 19.1 percent) both had moderate year over year decreases in the number of home sales 4

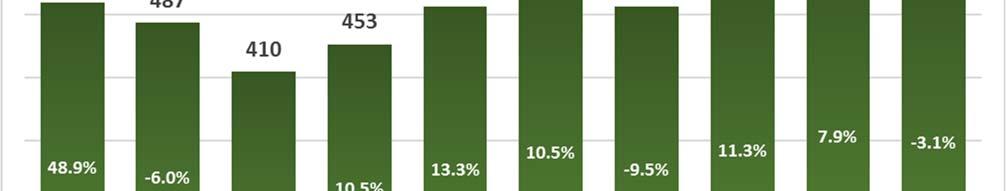
5 New Pending Sales 5
6 Contract activity decreased 3.1 percent from August 2016 to 597 new pending sales, but is 4.2 percent greater than the 5 year August average of 573. Condo contracts continue to decline dropping 19.8 percent from August 2016 to 77 new pending sales. This is likely a factor of high demand and low supply for Condos. Detached homes (301 new pending sales, 0.7 percent) also saw decreases in contract activity. Breaking a recent downward trend, new pending sales of townhomes (219; +0.9 percent) increased slightly from August New pending sales were up in three of the ten ZIP codes analyzed, led by 41.2 percent (14 pending sales) and 22.6 percent (12 pending sales) increases in Aldie s and Sterling s 20164, respectively. Chantilly s new pending sales were down 40 percent to fewer than August The 17 new pending sales recorded in Great Falls were 32 percent lower than last August s total. 6
 and townhomes (267, +7.")
7 New Listing Activity New listing activity in August increased 6.7 percent versus last year to 799, and is 2.3 percent higher than the 5 year August average of 781. The number of year to date new listings is down 1.3 percent, or 97 listings from this time last year. Detached homes (416, +8.3 percent) and townhomes (267, +7.7 percent) increased in listing activity compared to last year. Condos saw 116 new listings in August 0.8 percent less than August 2016, but 22 percent more than last month. Listing activity increased or remained stable in eight of the ten ZIP codes analyzed, led by an 18.3 percent spike in Sterling s to 71 new listings. Leesburg s (81; percent) and Chantilly s (58; percent) also saw notable increases in number of new listings from last year. Sterling s declined 21 percent in new listings from August

8 Month s End Inventories Inventory continues to fall and at the end of August it was 14.8 percent lower than the same point last year, with 249 fewer listings for sale. The August active listing inventory of 1,437 is 20.2 percent lower than the 5 year average of 1,801. Inventories were down from last year in all ten of the Loudoun ZIP codes studied, led by Sterling s ( 30.3 percent) and ( 24.8 percent), and Leesburg s ( 26.8 percent). Active listings in Aldie s were down the least at a decrease of 5.1 percent from August Based on the average monthly sales pace over the past 12 months, the 1,437 active listings heading into September represent 2.6 months of supply. This is 1 month lower than the 5 year August average supply of 3.6 months. Inventories were down in all sectors, with townhouses and condos having the tightest inventory 1.5 and 1.6 months of supply and decreases of 18.4 and 40.5 percent respectively from last year at this time. The supply of detached homes was 3.6 months at the end of August a decrease of 15.6 percent from last year. 8


9 Average Sales Price to Original List Price Ratio (SP to OLP) Loudoun County home sellers received an average 97.9 percent of original list price in August; 0.5 percentage points less than last month but nearly 0.2 percentage points more than August The county s average sales price to original list price ratio (SP to OLP) was 0.3 percentage points higher than the five year August average of 97.6 percent. Detached home and condo sellers received on average 96.9 percent and 98.8 percent of their original list price, while townhome home sellers receive on average 99.1 percent. Average SP to OLP ratios increased in eight of the ten of the ZIP codes analyzed. Leesburg s increased 1.8 points in August to 97.3 percent. Sterling s (99.1 percent) and Ashburn s (99 percent) had the highest ratio numbers in the county. August sellers in Great Falls received the lowest percentage of asking price (95.3 percent), but also saw the largest increase from last year (4 percentage points). 9

 lower than the August 2016 median DOM of 21.")
10 Days On Market (DOM) For the 20 th consecutive month, homes in August sold faster than last year, with half of the August sales listing 18 days or less. This is 7 days less than August 2016 s median DOM of 25. The median DOM was 7 days lower than the five year August average of 25 days. The median DOM so far for 2017 is 11 days, 45 percent lower than the same time last year at 20 days. Half the detached homes sold in August were on the market for 28 days or less down 22.2 percent from the 36 day median DOM last August. The median DOM for condos was 16 days, 5 days (23.8 percent) lower than the August 2016 median DOM of 21. Townhouses had a median DOM of 10, down 9 days (47.4 percent) from last year s 19 days. Days on market levels decreased in nine of the ten of the ZIP codes analyzed, led by a 16 day improvement in Great Falls Sterling s and Leesburg s also saw large decreases in DOM each with 13 improvements from last year. Purcellville s median DOM increased 6 days to 42 from August
11 RBI Key Housing Trend Metrics Dulles Area Association of REALTORS All Residential Aug 17 % M O M Jul 17 Y Aug 16 2Y Aug 15 5YAvg 5 Yr Avg Units Sold (Closed) % % % % 601 Median Sales Price (Closed) $478, % $457, % $442, % $430, % $443,194 Pending Sales (New) % % % % 573 Active Listings 1, % 1, % 1, % 2, % 1,801 New Listings % % % % 781 Average DOM (Closed) % % % % 47 Listing Discount (Average) 2.1% 1.6% 2.3% 3.1% 2.4% Avg SP to OLP Ratio 97.9% 98.4% 97.7% 96.9% 97.6% Detached Aug 17 % M O M Jul 17 Y Aug 16 2Y Aug 15 5YAvg 5 Yr Avg Units Sold (Closed) % % % % 308 Median Sales Price (Closed) $631, % $595, % $594, % $558, % $585,580 Pending Sales (New) % % % % 289 Active Listings 1, % % 1, % 1, % 1,216 New Listings % % % % 415 Average DOM (Closed) % % % % 59 Listing Discount (Average) 3.1% 1.9% 3.0% 3.6% 3.0% Avg SP to OLP Ratio 96.9% 98.1% 97.0% 96.4% 97.0% Attached Aug 17 % M O M Jul 17 Y Aug 16 2Y Aug 15 5YAvg 5 Yr Avg Units Sold (Closed) % % % % 293 Median Sales Price (Closed) $387, % $390, % $370, % $353, % $363,636 Pending Sales (New) % % % % 284 Active Listings % % % % 585 New Listings % % % % 366 Average DOM (Closed) % % % % 35 Listing Discount (Average) 1.0% 1.2% 1.6% 2.5% 1.7% Avg SP to OLP Ratio 99.0% 98.8% 98.4% 97.5% 98.3% Data Source: MarketStats by ShowingTime, Bright MLS. Statistics calculated 9/6/2017 About the Dulles Area Association of REALTORS The Dulles Area Association of REALTORS (DAAR) is The Association of Choice for Real Estate Professionals in the Northern Virginia area. Founded in 1962, DAAR works to safe guard and advance the mutual interests of the public, property owners, and real estate professionals for real estate related matters. About the Center for Regional Analysis The Center for Regional Analysis provides research and technical assistance that focuses on the economic, workforce, fiscal, demographic, housing, and social issues that shape the future growth of the Virginia, Maryland, and DC areas. The Center is housed within George Mason University s Schar School of Policy and Government. 11
November 2017 Loudoun County Market Trends Report Inventory decline persists as total and new listings are down; Sales growth continues to drop
 FOR IMMEDIATE RELEASE Contact: Brenda Morton 703 777 2468 Dulles Area Association of REALTORS bmorton@dullesarea.com November 2017 Loudoun County Market Trends Report Inventory decline persists as total
January 2018 Loudoun County Market Trends Report Inventory has another record low month; home sales continue to decline compared to last year.
 FOR IMMEDIATE RELEASE Contact: Brenda Morton 703 777 2468 Dulles Area Association of REALTORS bmorton@dullesarea.com January 2018 Loudoun County Market Trends Report Inventory has another record low month;
FOR IMMEDIATE RELEASE Contact: Brenda Morton Dulles Area Association of REALTORS
 FOR IMMEDIATE RELEASE Contact: Brenda Morton 703 777 2468 Dulles Area Association of REALTORS bmorton@dullesarea.com August 2018 Loudoun County Market Trends Report Despite persistent low inventory, sales
FOR IMMEDIATE RELEASE Contact: Brenda Morton Dulles Area Association of REALTORS
 FOR IMMEDIATE RELEASE Contact: Brenda Morton 703 777 2468 Dulles Area Association of REALTORS bmorton@dullesarea.com February 2018 Loudoun County Market Trends Report Inventory reaches yet another record
May 2018 Loudoun County Market Trends Report Tight inventory continues while price growth stagnates; Condo sales hit a record high.
 FOR IMMEDIATE RELEASE Contact: Brenda Morton 703 777 2468 Dulles Area Association of REALTORS bmorton@dullesarea.com May 2018 Loudoun County Market Trends Report Tight inventory continues while price growth
September 2018 Loudoun County Market Trends Report Inventory continues to tighten as prices increase and closed sales decline
 FOR IMMEDIATE RELEASE Contact: Brenda Morton 703 777 2468 Dulles Area Association of REALTORS bmorton@dullesarea.com September 2018 Loudoun County Market Trends Report Inventory continues to tighten as
February 2016 Loudoun County Market Trends Report Contracts and sales activity jump double-digits; Inventories down 15.5 percent
 FOR IMMEDIATE RELEASE Contact: Christine Windle 703-777-2468, cwindle@dullesarea.com Sponsored by: Access National Bank Tom Ciolkosz, (703) 871-1045, tciolkosz@accessnationalbank.com Patty Foster, 703-871-1014,
May 2016 Loudoun County Market Trends Report Homes selling twice as fast as 2015 with re-emergence of seller s market
 FOR IMMEDIATE RELEASE Contact: Christine Windle 703-777-2468 Dulles Area Association of REALTORS cwindle@dullesarea.com Sponsored by: Access National Bank Tom Ciolkosz, (703) 871-1045, tciolkosz@accessnationalbank.com
November 2018 Montgomery County Market Trends Report Median sales price reaches highest November level in 10 years
 FOR IMMEDIATE RELEASE Contact: Bobette Banks 301-590-8764 Director of Communications Greater Capital Area Association of REALTORS bbanks@gcaar.com November 2018 Montgomery County Market Trends Report Median
2015 First Quarter Market Report
 2015 First Quarter Market Report CAAR Member Copy Expanded Edition Charlottesville Area First Quarter 2015 Highlights: Median sales price for the region was up 5.1% over Q1-2014, rising from $244,250 to
February 2018 Montgomery County Market Trends Report Closed sales dip while median sales price reaches highest February mark since 2007
 FOR IMMEDIATE RELEASE Contact: Bobette Banks 301-590-8764 Director of Communications Greater Capital Area Association of REALTORS bbanks@gcaar.com February 2018 Montgomery County Market Trends Report Closed
December 2018 Montgomery County Market Trends Report Median sales rise slightly from 2017; Active listings increase 5.1 percent
 FOR IMMEDIATE RELEASE Contact: Bobette Banks 301-590-8764 Director of Communications Greater Capital Area Association of REALTORS bbanks@gcaar.com December 2018 Montgomery County Market Trends Report Median
January 2019 Montgomery County Market Trends Report Average sales and new listings increase; closed sales decline
 FOR IMMEDIATE RELEASE Contact: Bobette Banks 301-590-8764 Director of Communications Greater Capital Area Association of REALTORS bbanks@gcaar.com January 2019 Montgomery County Market Trends Report Average
September 2017 Montgomery County Market Trends Report Median sales price highest since September 2007
 FOR IMMEDIATE RELEASE Contact: Bobette Banks 301-590-8764 Director of Communications Greater Capital Area Association of REALTORS bbanks@gcaar.com September 2017 Montgomery County Market Trends Report
June 2018 Montgomery County Market Trends Report Median sales price reaches highest June level on record
 FOR IMMEDIATE RELEASE Contact: Bobette Banks 301-590-8764 Director of Communications Greater Capital Area Association of REALTORS bbanks@gcaar.com June 2018 Montgomery County Market Trends Report Median
May 2017 Montgomery County Market Trends Report Median sales price increases 5.8 percent; active listings drop 11.8 percent
 FOR IMMEDIATE RELEASE Contact: Bobette Banks 301-590-8764 Director of Communications Greater Capital Area Association of REALTORS bbanks@gcaar.com May 2017 Montgomery County Market Trends Report Median
June 2017 Montgomery County Market Trends Report Median sales price up 1.1 percent highest for June since 2008
 FOR IMMEDIATE RELEASE Contact: Bobette Banks 301-590-8764 Director of Communications Greater Capital Area Association of REALTORS bbanks@gcaar.com June 2017 Montgomery County Market Trends Report Median
March 2018 Montgomery County Market Trends Report Median sales price reaches highest March level on record; days-on-market down from 2017
 FOR IMMEDIATE RELEASE Contact: Bobette Banks 301-590-8764 Director of Communications Greater Capital Area Association of REALTORS bbanks@gcaar.com March 2018 Montgomery County Market Trends Report Median
September 2017 Washington, DC Market Trends Report September median sales price drops 6.4 percent but still near record high
 FOR IMMEDIATE RELEASE Contact: Bobette Banks 301-590-8764 Director of Communications Greater Capital Area Association of REALTORS bbanks@gcaar.com September 2017 Washington, DC Market Trends Report September
November 2017 Montgomery County Market Trends Report Median sales price up slightly as median days on market quickens
 FOR IMMEDIATE RELEASE Contact: Bobette Banks 301-590-8764 Director of Communications Greater Capital Area Association of REALTORS bbanks@gcaar.com November 2017 Montgomery County Market Trends Report Median
nd Quarter Market Report
 2015 2 nd Quarter Market Report The voice of real estate in Central Virginia CAAR Member Copy Expanded Edition Charlottesville Area 2 nd Quarter 2015 Highlights: Closed sales in the Greater Charlottesville
November 2017 Washington, DC Market Trends Report Median sales price ties last year for highest November level on record
 FOR IMMEDIATE RELEASE Contact: Bobette Banks 301-590-8764 Director of Communications Greater Capital Area Association of REALTORS bbanks@gcaar.com November 2017 Washington, DC Market Trends Report Median
April 2018 Washington, DC Market Trends Report Home sales up 9.4 percent; median sales price reaches highest April on record
 N FOR IMMEDIATE RELEASE Contact: Bobette Banks 301-590-8764 Director of Communications Greater Capital Area Association of REALTORS bbanks@gcaar.com April 2018 Washington, DC Market Trends Report Home
FOR IMMEDIATE RELEASE Contact: Bobette Banks Director of Communications Greater Capital Area Association of REALTORS
 FOR IMMEDIATE RELEASE Contact: Bobette Banks 301-590-8764 Director of Communications Greater Capital Area Association of REALTORS bbanks@gcaar.com December 2018 Washington, DC Market Trends Report DC closes
May 2018 Washington, DC Market Trends Report Sales at record high for May while supply remains scarce
 FOR IMMEDIATE RELEASE Contact: Bryan Frantz 202-626-0097 Communications Specialist District of Columbia Association of REALTORS bfrantz@dcrealtors.org May 2018 Washington, DC Market Trends Report Sales
June 2018 Washington, DC Market Trends Report Median sales price reaches highest June level on record
 FOR IMMEDIATE RELEASE Contact: Bobette Banks 301-590-8764 Director of Communications Greater Capital Area Association of REALTORS bbanks@gcaar.com June 2018 Washington, DC Market Trends Report Median sales
May 2016 Washington, DC Market Trends Report Listings continue to move quickly as sales climb nearly 14 percent
 FOR IMMEDIATE RELEASE Contact: Bobette Banks 301-590-8764 Director of Communications Greater Capital Area Association of REALTORS bbanks@gcaar.com May 2016 Washington, DC Market Trends Report Listings
FOR IMMEDIATE RELEASE Contact: Bobette Banks Director of Communications Greater Capital Area Association of REALTORS
 FOR IMMEDIATE RELEASE Contact: Bobette Banks 301-590-8764 Director of Communications Greater Capital Area Association of REALTORS bbanks@gcaar.com April 2016 Washington, DC Market Trends Report Sales and
May 2016 Montgomery County Market Trends Report Double-digit gains in closed sales, exceeding the five-year May average
 FOR IMMEDIATE RELEASE Contact: Bobette Banks 301-590-8764 Director of Communications Greater Capital Area Association of REALTORS bbanks@gcaar.com May 2016 Montgomery County Market Trends Report Double-digit
January 2018 Washington, DC Market Trends Report Closed sales reach highest January level since 2005
 FOR IMMEDIATE RELEASE Contact: Bobette Banks 301-590-8764 Director of Communications Greater Capital Area Association of REALTORS bbanks@gcaar.com January 2018 Washington, DC Market Trends Report Closed
November 2018 Washington, DC Market Trends Report Median sales price highest November level in past 10 years
 FOR IMMEDIATE RELEASE Contact: Bryan Frantz 202.626.0097 Communications Specialist District of Columbia Association of REALTORS bfrantz@dcrealtors.org November 2018 Washington, DC Market Trends Report
January 2017 Washington, DC Market Trends Report Median Sales Price Up 4.6 percent Reaches Highest January Level on Record
 FOR IMMEDIATE RELEASE Contact: Bobette Banks 301-590-8764 Director of Communications Greater Capital Area Association of REALTORS bbanks@gcaar.com January 2017 Washington, DC Market Trends Report Median
August 2015 Washington, DC Market Trends Report Limited supply, high demand continue pushing prices to record highs
 FOR IMMEDIATE RELEASE Contact: Bobette Banks 301-590-8764 Director of Communications Greater Capital Area Association of REALTORS bbanks@gcaar.com August 2015 Washington, DC Market Trends Report Limited
March 2018 Washington, DC Market Trends Report Median sales price reaches highest March level on record
 FOR IMMEDIATE RELEASE Contact: Bryan Frantz 301-590-8765 Communications Specialist District of Columbia Association of REALTORS bfrantz@dcrealtors.org March 2018 Washington, DC Market Trends Report Median
July 2016 Washington, DC Market Trends Report July home prices remain at record highs in the District
 FOR IMMEDIATE RELEASE Contact: Bobette Banks 301-590-8764 Director of Communications Greater Capital Area Association of REALTORS bbanks@gcaar.com July 2016 Washington, DC Market Trends Report July home
FOR IMMEDIATE RELEASE Contact: Bobette Banks Director of Communications Greater Capital Area Association of REALTORS
 FOR IMMEDIATE RELEASE Contact: Bobette Banks 301-590-8764 Director of Communications Greater Capital Area Association of REALTORS bbanks@gcaar.com November 2015 Washington, DC Market Trends Report Median
March 2016 Washington, DC Market Trends Report March sales represent a 12 percent increase; top the five-year March average
 FOR IMMEDIATE RELEASE Contact: Bobette Banks 301-590-8764 Director of Communications Greater Capital Area Association of REALTORS bbanks@gcaar.com March 2016 Washington, DC Market Trends Report March sales
Washington, D.C. Metro Area December 2017 Housing Market Update
 Washington, D.C. Metro Area December 2017 Housing Market Update Washington D.C. Metro housing market closes out 2017 with record high December house price of $420,050; December inventories decline for
Baltimore, MD Metro Area September 2017 Housing Market Update
 Baltimore, MD Metro Area September 2017 Housing Market Update Baltimore Metro median sales price of $253,000 is near September record; Active inventories decline by 11.4% to lowest September level of the
MARKET AREA UPDATE Report as of: 1Q 2Q 3Q 4Q
 MARKET AREA UPDATE Report as of: 1Q 2Q 3Q 4Q Year: 2013 Market Area (City, State): Washington DC Metropolitan Area Provided by (Company / Companies): LONG & FOSTER REAL ESTATE, INC. What are the most significant
MARKET AREA UPDATE Report as of: 1Q 2Q 3Q 4Q
 MARKET AREA UPDATE Report as of: 1Q 2Q 3Q 4Q Year: 2014 Market Area (City, State): Washington DC Metropolitan Area Provided by (Company / Companies): LONG & FOSTER REAL ESTATE, INC. What are the most significant
See Full Corridor Study Volumes I and II as separate attachments.
 See Full Corridor Study Volumes I and II as separate attachments. See Housing Values 2000-2010 and 2000-2013 as separate attachments. 2013 2 nd Quarter and Mid-Year Market Report The voice of real estate
rd Quarter Market Report
 2012 3 rd Quarter Market Report The voice of real estate in Central Virginia CAAR Member Copy Expanded Edition Charlottesville Area 3 rd Quarter 2012 Highlights: Overall sales in Greater Charlottesville
MARKET AREA UPDATE Report as of: 1Q 2Q 3Q 4Q
 Year: 2013 Market Area (City, State): Baltimore Metropolitan Area MARKET AREA UPDATE Report as of: 1Q 2Q 3Q 4Q Provided by (Company / Companies): LONG & FOSTER REAL ESTATE, INC. What are the most significant
Single Family Sales Maine: Units
 Maine Home Connection 19 Commercial St Portland, Maine 04101 MaineHomeConnection.com Office: (207) 517-3100 Email: Info@MaineHomeConnection.com For the fourth consecutive year, Maine home sales set a new
Housing Supply Overview
 Housing Supply Overview A Research Tool Provided by the Greater San Diego Association of REALTORS December 2017 Quick Facts + 18.1% + 2.1% - 2.3% Inventory was again a driving metric in residential real
California Housing Market Update. Monthly Sales and Price Statistics September 2018
 California Housing Market Update Monthly Sales and Price Statistics September 2018 Sales Had the Largest Decline since March 2014 California, September 2018 Sales: 382,550 Units, -3.3% YTD, -12.4% YTY
Housing Supply Overview
 Housing Supply Overview A RESEARCH TOOL PROVIDED BY SOUTH CAROLINA REALTORS June 2018 We are firmly within summer during an economically strong year in the U.S., thus real estate activity is busy. There
California Housing Market Update. Monthly Sales and Price Statistics October 2018
 California Housing Market Update Monthly Sales and Price Statistics October 2018 Sales Had the 2 nd Largest Drop in the Last 6 Months California, October 2018 Sales: 397,060 Units, -3.7% YTD, -7.9% YTY
Housing Supply Overview
 Housing Supply Overview A RESEARCH TOOL PROVIDED BY SOUTH CAROLINA REALTORS March 2017 Low supply and steadily rising rates and prices have been the story so far after the first quarter of the year zipped
California Housing Market Update. Monthly Sales and Price Statistics December 2018
 California Housing Market Update Monthly Sales and Price Statistics December 2018 Sales Reached the Lowest Level since Jan 2015 California, December 2018 Sales: 372,260 Units, -5.2% YTD, -11.6% YTY 700,000
Monthly Indicators % % - 9.2%
 Monthly Indicators 2016 New Listings were down 1.4 percent for single family/duplex homes and 25.0 percent for townhouse-condo properties. Pending Sales increased 58.3 percent for single family/duplex
Monthly Indicators % % %
 Monthly Indicators 2016 Percent changes calculated using year-over-year comparisons. New Listings were down 27.6 percent for single family homes and 41.8 percent for townhouse-condo properties. Pending
Monthly Indicators + 4.8% - 3.5% %
 Monthly Indicators 2015 New Listings were up 45.0 percent for single family/duplex homes but decreased 44.1 percent for townhouse-condo properties. Pending Sales increased 14.3 percent for single family/duplex
2013 Year-End Market Report
 2013 Year-End Market Report The voice of real estate in Central Virginia CAAR Member Copy Expanded Edition Charlottesville Area Year-End 2013 Highlights: Yearly home sales in Greater Charlottesville were
California Housing Market Update. Monthly Sales and Price Statistics November 2018
 California Housing Market Update Monthly Sales and Price Statistics November 2018 Home Sales: Largest Decline Since 2014 California, November 2018 Sales: 381,400 Units, -4.6% YTD, -13.4% YTY 700,000 600,000
California Housing Market Update. Monthly Sales and Price Statistics January 2018
 California Housing Market Update Monthly Sales and Price Statistics January 2018 Sales Started with a Slight Decrease California, Jan. 2018 Sales: 388,800 Units, -2.9% YTD, -2.9% YTY 700,000 600,000 500,000
Housing Supply Overview
 Housing Supply Overview A RESEARCH TOOL PROVIDED BY SOUTH CAROLINA REALTORS February 2018 Mortgage rates are on the rise. When this happens, it means that buyers in the lower-priced categories tend to
Monthly Indicators. August Quick Facts + 7.0% + 7.3% %
 Monthly Indicators 2018 Indiana REALTORS have closed the books on, releasing their summary of existing-home sales from last month. All metrics are up on a statewide basis except inventory, which is certainly
Monthly Indicators. September Quick Facts + 0.2% + 5.0% %
 Monthly Indicators 2017 It s not just you there really are fewer homes for sale and more are selling. Indiana s statewide housing market has outpaced 2016 in sales and price growth 9 out of 9 months this
MLS of Greater Cincinnati - Charts for the Month: November 2017
 MLS of Greater Cincinnati - Charts for the Month: November 2017 The following charts provide an overview of what has occurred in the MLS over the past month. Each chart provides a historical trend. The
Monthly Indicators % + 9.7% %
 Monthly Indicators 2016 Percent changes calculated using year-over-year comparisons. New Listings were up 11.1 percent for single family homes and down 30.8 percent for townhouse-condo properties. Pending
Monthly Indicators + 7.3% + 6.6% + 8.3% Single-Family Market Overview Condo Market Overview New Listings Pending Sales.
 Monthly Indicators 2018 The three most prominent national market trends for residential real estate are the ongoing lack of abundant inventory, the steadily upward movement of home prices and year-over-year
STATPAK MARKET IN A MINUTE A SUMMARY OF MARKET CONDITIONS FOR AUGUST McEnearney.com CONTRACTS URGENCY INDEX INVENTORY INTEREST RATES
 STATPAK WASHINGTON, DC SEPTEMBER 2017 McEnearney.com MARKET IN A MINUTE A SUMMARY OF MARKET CONDITIONS FOR AUGUST 2017 Contract activity in August 2017 was up 4.9% from August 2016, and there were increases
California Housing Market Update. Monthly Sales and Price Statistics May 2018
 California Housing Market Update Monthly Sales and Price Statistics May 2018 Sales Lost Momentum as Mortgage Rates Continued to Climb California, May 2018 Sales: 409,270 Units, +0.3% YTD, -4.6% YTY 700,000
MARKET IN A MINUTE A SUMMARY OF MARKET CONDITIONS FOR SEPTEMBER & 3rd QUARTER 2017
 STATPAK LOUDOUN COUNTY OCTOBER 2017 McEnearney.com MARKET IN A MINUTE A SUMMARY OF MARKET CONDITIONS FOR SEPTEMBER & 3rd QUARTER 2017 Contract activity in September 2017 was up just 0.6% from September
Monthly Indicators. June Quick Facts - 1.8% + 5.8% %
 Monthly Indicators 2018 Indiana REALTORS have closed the book on, releasing their summary of existing-home sales from last month. Most notably, the sales price of homes single-family, townhomes, condos,
STATPAK MARKET IN A MINUTE A SUMMARY OF MARKET CONDITIONS FOR JULY McEnearney.com CONTRACTS URGENCY INDEX INVENTORY INTEREST RATES AFFORDABILITY
 STATPAK LOUDOUN COUNTY AUGUST 2017 McEnearney.com MARKET IN A MINUTE A SUMMARY OF MARKET CONDITIONS FOR JULY 2017 Contract activity in July 2017 was down 8.7% from July 2016, and there were decreases in
STATPAK MARKET IN A MINUTE A SUMMARY OF MARKET CONDITIONS FOR JANUARY McEnearney.com CONTRACTS URGENCY INDEX INVENTORY INTEREST RATES
 STATPAK LOUDOUN COUNTY FEBRUARY 2018 McEnearney.com MARKET IN A MINUTE A SUMMARY OF MARKET CONDITIONS FOR JANUARY 2018 Contract activity in January 2018 was down just 2.0% from January 2017, but that is
Monthly Indicators % % - 3.5%
 Monthly Indicators 2017 New Listings were up 6.3 percent for the category but decreased 33.1 percent for the category. Pending Sales increased 5.0 percent for but decreased 1.3 percent for. The Median
Monthly Indicators % % % Activity Overview New Listings Pending Sales. Closed Sales. Days on Market Until Sale. Median Sales Price
 Monthly Indicators 2017 tends to mark the waning of housing activity ahead of the school year. Not all buyers and sellers have children, but there are enough parents that do not want to uproot their children
Housing Supply Overview
 Housing Supply Overview A RESEARCH TOOL PROVIDED BY MINNEAPOLIS AREA REALTORS November 2018 Home prices have continued to increase, but price drops are becoming more of a reality as affordability concerns
STATPAK MARKET IN A MINUTE A SUMMARY OF MARKET CONDITIONS FOR MAY McEnearney.com CONTRACTS URGENCY INDEX INVENTORY INTEREST RATES AFFORDABILITY
 STATPAK WASHINGTON, DC JUNE 2017 McEnearney.com MARKET IN A MINUTE A SUMMARY OF MARKET CONDITIONS FOR MAY 2017 Contract activity in May 2017 was up 2.9% from May 2016, and there were increases for the
Housing Supply Overview
 Housing Supply Overview A RESEARCH TOOL PROVIDED BY SOUTH CAROLINA REALTORS April 217 Spring is in the air, and housing activity is heightening. There appear to be more buyers out on the prowl, given the
Monthly Indicators + 3.5% + 3.0% % Activity Overview New Listings Pending Sales. Closed Sales. Days on Market Until Sale. Median Sales Price
 Monthly Indicators 218 Housing price bubble chatter has increased this summer, as market observers attempt to predict the next residential real estate shift. It is too early to predict a change from higher
Housing Price Forecasts. Illinois and Chicago PMSA, June 2012
 Housing Price Forecasts Illinois and Chicago PMSA, June 2012 Presented To Illinois Association of REALTORS From R E A L Regional Economics Applications Laboratory, Institute of Government and Public Affairs
Monthly Indicators - 7.4% + 5.6% % Activity Overview New Listings Pending Sales. Closed Sales. Days on Market Until Sale. Median Sales Price
 Monthly Indicators 218 Rising home prices, higher interest rates and increased building material costs have pressured housing affordability to a ten-year low, according to the National Association of Home
MONTGOMERY COUNTY APRIL 2018
 STATPAK MONTGOMERY COUNTY APRIL 2018 McEnearney.com MARKET IN A MINUTE A SUMMARY OF MARKET CONDITIONS FOR MARCH 2018 Contract activity in March 2018 was down 6.0% from March 2017, and there were decreases
Coachella Valley Median Detached Home Price Jan Jan 2017
 The Desert Housing Report Median Price $450,000 Coachella Valley Median Detached Home Price Jan 2002 - Jan 2017 $400,000 $350,000 $300,000 $250,000 $335,000 $340,000 $200,000 $150,000 CV Detached Median
Monthly Indicators - 8.0% + 4.2% - 3.4% Activity Overview New Listings Pending Sales. Closed Sales. Days on Market Until Sale. Median Sales Price
 Monthly Indicators 2018 If the last few months are an indication of the temperature of housing markets across the country, a period of relative calm can be expected during the last three months of the
Housing Supply Overview
 Housing Supply Overview A RESEARCH TOOL PROVIDED BY SOUTH CAROLINA REALTORS January 2017 One of the new U.S. presidential administration's first moves was to remove a rate cut for loans backed by the Federal
Housing Supply Overview
 Housing Supply Overview A RESEARCH TOOL PROVIDED BY SOUTH CAROLINA REALTORS July 2017 Local news outlets across the nation have been delving into the cause for lower sales totals in their markets during
Monthly Indicators. September Monthly Snapshot + 2.0% + 7.4% %
 Monthly Indicators For residential real estate activity by members of the Florida REALTORS 2012 Most housing metrics should follow their usual, autumnal movements higher inventory and days on market, fewer
Monthly Indicators - 8.1% + 3.6% - 0.6% Activity Overview New Listings Pending Sales. Closed Sales. Days on Market Until Sale. Median Sales Price
 Monthly Indicators 2019 In addition to ongoing housing price increases and affordability concerns in the state of New York, the first quarter of 2019 saw a fair share of adverse weather as well. Sales
Monthly Indicators + 6.3% % + 4.1% Market Overview New Listings Pending Sales. Closed Sales. Days on Market Until Sale. Median Sales Price
 Monthly Indicators 2016 As anticipated at the outset of the year, demand has remained high through the first three quarters of 2016, propping up sales and prices despite heavy reductions in inventory and
MONTGOMERY COUNTY JULY 2018
 STATPAK MONTGOMERY COUNTY JULY 2018 McEnearney.com MARKET IN A MINUTE A SUMMARY OF MARKET CONDITIONS FOR JUNE & FIRST HALF 2018 Contract activity in June 2018 was up 1.2% from June 2017, solely because
Housing Supply Overview
 Housing Supply Overview A RESEARCH TOOL PROVIDED BY THE UPSTATE ALLIANCE OF REALTORS MLS December 2018 Housing affordability was a growing concern in 2018, and that is expected to intensify in 2019. Although
Monthly Indicators - 6.1% + 8.6% + 1.8% Activity Overview New Listings. Closed Sales Median Sales Price
 Monthly Indicators 2018 Just like last year at this time, prospective home buyers should expect a competitive housing market for the next several months. With payrolls trending upward and unemployment
Monthly Indicators. October Monthly Snapshot % + 9.0% %
 Monthly Indicators For residential real estate activity by members of the Florida REALTORS 2012 As we round out the remaining two months of the year, let's recap. Most markets shed listings, resulting
Monthly Indicators + 3.5% + 2.1% - 9.4% Activity Overview New Listings Pending Sales. Closed Sales. Days on Market Until Sale. Median Sales Price
 Monthly Indicators 217 How long can the residential real estate market go on like this? We are about two years into a national trend of dropping housing supply and increasing median sales prices. There
NORTHERN VIRGINIA MARCH 2017
 STATPAK NORTHERN VIRGINIA MARCH 2017 McEnearney.com MARKET IN A MINUTE A SUMMARY OF MARKET CONDITIONS FOR FEBRUARY 2017 Contract activity in February 2017 was up 4.0% from February 2016, and there were
Housing Supply Overview
 Housing Supply Overview A RESEARCH TOOL PROVIDED BY SOUTH CAROLINA REALTORS April 2016 We should see a healthy number of sales in most categories for the next few months, yet there is still some lingering
Housing Supply Overview
 Housing Supply Overview A RESEARCH TOOL PROVIDED BY SOUTH CAROLINA REALTORS February 2018 Mortgage rates are on the rise. When this happens, it means that buyers in the lower-priced categories tend to
Monthly Indicators + 5.7% % % Market Overview New Listings Pending Sales. Closed Sales. Days on Market Until Sale. Median Sales Price
 Monthly Indicators 2018 The three most prominent national market trends for residential real estate are the ongoing lack of abundant inventory, the steadily upward movement of home prices and year-over-year
The Knox County HOUSING MARKET
 T E C H REPORT SERIES The Knox HOUSING MARKET Date: August 2007 For more information: MPC Contact Person: Bryan Berry 215-2500 MPC Website and e-mail www.knoxmpc.org contact@knoxmpc.org INTRODUCTION In
STATPAK MARKET IN A MINUTE A SUMMARY OF MARKET CONDITIONS FOR FEBRUARY McEnearney.com CONTRACTS URGENCY INDEX INVENTORY INTEREST RATES
 STATPAK LOUDOUN COUNTY MARCH 2018 McEnearney.com MARKET IN A MINUTE A SUMMARY OF MARKET CONDITIONS FOR FEBRUARY 2018 Contract activity in February 2018 was almost unchanged, up just 0.2% from February
Housing Supply Overview
 Housing Supply Overview A RESEARCH TOOL PROVIDED BY SOUTH CAROLINA REALTORS May 2016 Sellers are getting more of their asking price, meaning higher sales prices in most categories. The overall inventory
PRINCE GEORGE S COUNTY FEBRUARY 2018
 STATPAK PRINCE GEORGE S COUNTY FEBRUARY 2018 McEnearney.com MARKET IN A MINUTE A SUMMARY OF MARKET CONDITIONS FOR JANUARY 2018 Contract activity in January 2018 was up 20.9% from January 2017, and there
ANALYSIS OF THE CENTRAL VIRGINIA AREA HOUSING MARKET 1st quarter 2013 By Lisa A. Sturtevant, PhD George Mason University Center for Regional Analysis
 ANALYSIS OF THE CENTRAL VIRGINIA AREA HOUSING MARKET 1st quarter By Lisa A. Sturtevant, PhD George Mason University Center for Regional Analysis Economic Overview Key economic factors in the first quarter
Monthly Indicators % % - 5.3% Activity Overview New Listings Pending Sales. Closed Sales. Days on Market Until Sale. Median Sales Price
 Monthly Indicators 2018 Housing price bubble chatter has increased this summer, as market observers attempt to predict the next residential real estate shift. It is too early to predict a change from higher