DATA FOR FEBRUARY Published March 22, Sales are up +13.6% month-over-month. The year-over-year comparison is up +7.4%.
|
|
|
- Toby Osborne
- 6 years ago
- Views:
Transcription


1 Permission is granted only to ARMLS Subscribers for reproduction with attribution on to ARMLS COPYRIGHT For questions regarding this publication contact DATA FOR FEBRUARY Published March 22, 2018 Sales are up +13.6% month-over-month. The year-over-year comparison is up +7.4%. Closed MLS sales with a close of escrow date from 2/1/2018 to 2/28/2018, 0 day DOM sales removed 1
2 New inventory is down -6.4% month-over-month while the year-over-year comparison shows a decrease of -1.2%. New MLS listings that were active for at least one day from 2/1/2018 to 2/28/2018, 0 day DOM sales removed Total inventory has a month-over-month increase of +0.5% while year-over-year reflects a decrease of -12.1%. Snapshot of statuses on 2/28/2018 2
3 Feburary UCB listings percent of total inventory was +19.7% with Feburary CCBS listings at +2.4% of total inventory.+6.7%.. Snapshot of statuses on 2/28/2018 Months supply of inventory for January was 3.56 with February at Current inventory of Active/UCB/CCBS divided by the monthly sales volume of FEBRUARY 2018, 0 day DOM sales removed 3
4 Average new list prices are up +5.0% year-overyear. The year-over-year median is up +7.3%. List prices of new listings with list dates from 2/1/2018 to 2/28/2018, 0 day DOM sales removed The average sales price is up +7.9% year-overyear while the year-overyear median sales price is also up +9.8%. MLS sales prices for closed listings with a close of escrow date from 2/1/2018 to 2/28/2018, 0 day DOM sales removed 4
5 An increase is forecasted for average sales price while February is predicted to have a decrease in median sales price. ARMLS proprietary predictive model forecast, 0 day DOM sales removed Foreclosures pending month-over-month showed a decrease of -0.5% while the yearover-year figure was down -10.9%. Snapshot of public records data on 2/28/2018 active residential notices and residential REO properties. Note: this graph was adjusted as total foreclosure counts were under reported for the last 16 months. 5
6 Distressed sales accounted for 2.2% of total sales, down from the previous month of 2.6%. Short sales dropped -51.5% year-over-year. Lender owned sales dropped -33.3% yearover-year.7%.. New MLS listings that were active for at least one day from 2/1/2018 to 2/28/2018, 0 day DOM sales removed Days on market were down -7 days year-overyear while month-overmonth decreased by -1. MLS sales prices for closed listings with a close of escrow date from 2/1/2018 to 2/28/2018, 0 day DOM sales removed 6


7 COMMENTARY by Tom Ruff ARMLS has been reporting median and average sales price and sales volume for 18 years. For the first two months of 2018, all three metrics ranked at the top or near the top of our charts. The ARMLS median sales price for February was $252,500, slightly exceeding our previous high of $252,000 in February of This should not be confused with our peak median price of $264,800 that occurred in June of We ll hear a lot of chatter about peak prices over the next few months as 2018 median numbers approximate those in In terms of sales volume, February came in fourth trailing only 2005, 2011 and Average sale prices were third behind only 2006 and The three charts below show where 2018 ranks in terms of ARMLS all-time numbers. Note when the average sales price is multiplied by total sales volume, the first two months of 2018 rank number one with total sales of $4,046,677,451. Total Sales Volume Average Sales Price 7

8 Total Sales Dollars What s Changed Inside the Numbers When we move away from ARMLS numbers and turn our attention to public records data and our transactional coding, we see a couple of subtle shifts inside the data. When viewing public records, I like to look at transactional coding both in terms of the year-over-year changes but also the yearly composition of each transactional type. For instance, when we view new construction, we see a 4.21% year-over-year increase in new home sales. However, when we view the composition of home sales, the percentage of new home sales for the year declined by.74% from 14.17% in 2017 to 13.43% in The chart below also shows the continued decline in all distressed sales: properties with an active notice, bank sales and short sales. I ve added a category to this chart- ibuyers. ibuyers are counted only when selling properties, not when buying. These purchases would be reflected in the NONMLS category while the sales take place on the MLS. In February, ibuyers accounted for 3.71% of all properties sold. 8


9 If you look closely at an Affidavit of Property Value, you ll notice section 7. Residential Buyer s Use. The Information Market tracks this data daily. This data element gives us insight into the relationship between properties purchased by owner occupants, rental properties and non-primary residences. When we view a summation of this data, we see a modest 2.8% increase in owner occupied homes and a significant change in the number and year-over-year composition of rental and non-primary properties. Rental and non-primary purchases have increased 28.67% and 35.04% year-over-year respectively. Owner occupied sales account for 69.14% of all sales this year compared to 74.17% last February. 9
10 From late 2011 to the spring of 2012, Maricopa County got a taste of the impact large institutional investors could have on our market as companies like Invitation Homes, Colony and American Homes for Rent began gobbling up distressed properties across the Valley. Although we continue to see these companies acquire properties in Maricopa County, their appetite is very select and modest. For instance, Invitation Homes, the largest holder of rental properties in Maricopa County, purchased an average of six homes per month in the past year. Their focus over the past few years had more to do with the consolidation of companies as opposed to the acquisition of individual properties. They were neither acquiring nor selling many properties, except by consolidation through mergers. In late November 2017 this all changed as the institutional buyer Cerberus SFR Holdings LP, named after Hades multi-headed dog that guards the gates of the Underworld to prevent the dead from leaving, entered our market. I m pretty sure they regret their name selection. Nonetheless, they are aggressively purchasing rental properties in Maricopa County and are the primary reason for the shift in our rental property metrics. Our records indicate they purchased 220 homes in February and their rate of purchase appears to be increasing. The median sales price of their purchases is $230,000, with the lowest point at $125,000 and the highest above $300,000. Over 90% of their purchases were listed on the MLS. This is not a group of poorly funded amateur investors. It s reported that Cerberus has $30 to $40 billion dollars under management. There s something about our market they like, and they are aggressively purchasing where our inventory levels are the lowest. This one will be interesting to watch. As for the increase in the number of non-primary purchases, the change in this metric can be attributed to the ibuyers mentioned above. Opendoor and Offerpad check the box C on all their purchases. 10

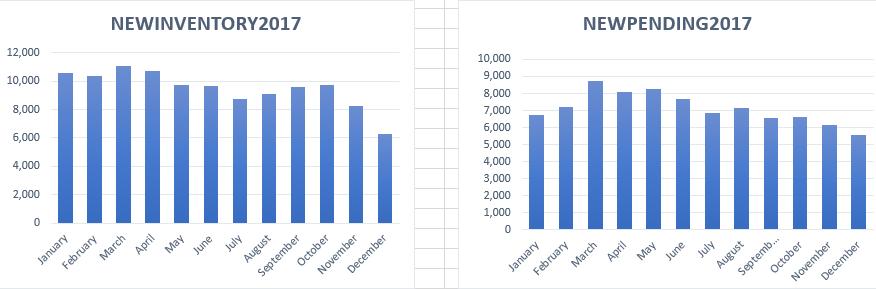
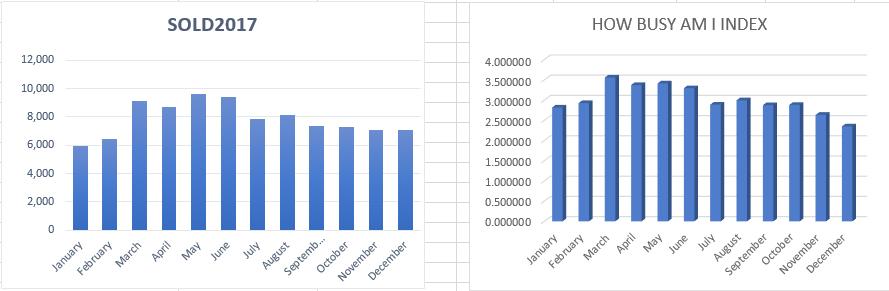
11 In Case You Didn t Know According to my recent neurotic study, March is the busiest month of your year. I broke down the real estate transaction into three phases from an agent s perspective: getting a listing, getting a property under contract and getting the sale through escrow to closing or what s known in the business as Miller Time! I took the total number of transactions for 2017 in each of these categories and created an index. Anything above 1.0 would cause higher than normal working hours and anything below 1.0 would be below the average number of working hours. March had the highest number of new listings last year, the highest number of properties going pending and the third highest number of properties closing. Combining the three, I came up with the How Busy Am I index. March, April, May and June are your busiest months of the year, which begs the question, why are you wasting your time reading this? 11
12 10
13 The ARMLS Pending Price Index (PPI) Last month STAT projected a median sales price for February of $250,000. The actual median sales price was $252,000. Our sales volume projection for February was 6,575. Sales volume in February was 6,911. Looking ahead to March, the ARMLS Pending Price Index anticipates the median sales price will be $250,900. Sales volume for the first two months of 2018 was 4.58% higher than 2017, with 12,933 sales in 2018 compared to 12,367 in We begin March with 7,351 pending contracts, 4,288 UCB listings and 522 CCBS giving us a total of 12,161 residential listings practically under contract. This compares to 11,879 of the same type of listings one year ago. ARMLS reported 9,116 sales in March of I expect 2018 volume to be higher at 9,130 despite one more business day last year. 11
DATA FOR APRIL Published May 15, Sales are down -4.4% month-over-month. The year-over-year comparison is up +3.7%. ARMLS STAT APRIL 2018
 Permission is granted only to ARMLS Subscribers for reproduction with attribution on to ARMLS COPYRIGHT 2018. For questions regarding this publication contact Brand@ARMLS.com. DATA FOR APRIL 2018 - Published
DATA FOR MAY Published June 15, Sales are up +10.3% month-over-month. The year-over-year comparison is up +2.8%. ARMLS STAT MAY 2018
 Permission is granted only to ARMLS Subscribers for reproduction with attribution on to ARMLS COPYRIGHT 2018. For questions regarding this publication contact Brand@ARMLS.com. DATA FOR MAY 2018 - Published
DATA FOR NOVEMBER Published December 20, Sales are down -2.7% month-over-month. The year-over-year comparison is at 4.0%.
 Permission is granted only to ARMLS Subscribers for reproduction with attribution on to ARMLS COPYRIGHT 2017. For questions regarding this publication contact Brand@ARMLS.com. DATA FOR NOVEMBER 2017 -
DATA FOR OCTOBER Published November 14, Sales are down -0.8% month-over-month. The year-over-year comparison is at 4.1%.
 Permission is granted only to ARMLS Subscribers for reproduction with attribution on to ARMLS COPYRIGHT 2017. For questions regarding this publication contact Brand@ARMLS.com. DATA FOR OCTOBER 2017 - Published
DATA FOR MAY Published June 23, Sales are up +11.3% month-over-month. The year-over-year comparison shows an increase of +11.1%.
 Permission is granted only to ARMLS Subscribers for reproduction with attribution on to ARMLS COPYRIGHT 2017. For questions regarding this publication contact Brand@ARMLS.com. DATA FOR MAY 2017 - Published
DATA FOR DECEMBER Published January 23, Sales are up.01% month-over-month. The year-over-year comparison is at +0.5%.
 Permission is granted only to ARMLS Subscribers for reproduction with attribution on to ARMLS COPYRIGHT 2017. For questions regarding this publication contact Brand@ARMLS.com. DATA FOR DECEMBER 2017 -
DATA FOR SEPTEMBER Published October 13, Sales are down -9.7% month-over-month. The year-over-year comparison is at 0%.
 Permission is granted only to ARMLS Subscribers for reproduction with attribution on to ARMLS COPYRIGHT 2017. For questions regarding this publication contact Brand@ARMLS.com. DATA FOR SEPTEMBER 2017 -
DATA FOR NOVEMBER Published December 20, Sales are down -9.3% month-overmonth. comparison is down -7.9%. ARMLS STAT NOVEMBER 2018
 Permission is granted only to ARMLS Subscribers for reproduction with attribution on to ARMLS COPYRIGHT 2018. For questions regarding this publication contact Brand@ARMLS.com. DATA FOR NOVEMBER 2018 -
DATA FOR JANUARY Published Feburary 16, Sales are down -14.0% month-over-month. The year-over-year comparison is up +2.5%.
 Permission is granted only to ARMLS Subscribers for reproduction with attribution on to ARMLS COPYRIGHT 2018. For questions regarding this publication contact Brand@ARMLS.com. DATA FOR JANUARY 2018 - Published
DATA FOR FEBRUARY Published March 20, Sales are up +19.6% month-over-month. The year-over-year comparison is down -7.3%.
 Permission is granted only to ARMLS Subscribers for reproduction with attribution on to ARMLS COPYRIGHT 2019. For questions regarding this publication contact Brand@ARMLS.com. DATA FOR FEBRUARY 2019 -
DATA FOR JULY Published August 16, Sales are down -7.7% month-over-month. The year-over-year comparison is up +6.7%. ARMLS STAT JULY 2018
 Permission is granted only to ARMLS Subscribers for reproduction with attribution on to ARMLS COPYRIGHT 2018. For questions regarding this publication contact Brand@ARMLS.com. DATA FOR JULY 2018 - Published
DATA FOR JUNE Published July 17, Sales are down -8.4% month-over-month. The year-over-year comparison is down -3.3%. ARMLS STAT JUNE 2018
 Permission is granted only to ARMLS Subscribers for reproduction with attribution on to ARMLS COPYRIGHT 2018. For questions regarding this publication contact Brand@ARMLS.com. DATA FOR JUNE 2018 - Published
FEBRUARY Published March 25, 2016
 Permission is granted only to ARMLS Subscribers for reproduction with attribution to ARMLS COPYRIGHT 2016. For questions regarding this publication contact Communication@ARMLS.com. FEBRUARY 2016 - Published
+6.5% year-over-year -15.8% month-over-month. ARMLS STAT - December 21, 2015 MONTHLY SALES
 ARMLS STAT - December 21, 2015 MONTHLY SALES +6.5% year-over-year -15.8% month-over-month Permission is granted only to ARMLS Subscribers for reproduction with attribution to ARMLS COPYRIGHT 2015. 1 ARMLS
DATA for FEBRUARY Published March 20, 2017
 Permission is granted only to ARMLS Subscribers for reproduction with attribution to ARMLS COPYRIGHT 2017. For questions regarding this publication contact Communication@ARMLS.com. DATA for FEBRUARY 2017
DATA FOR JANUARY Published February 19, Sales are down -16.3% month-over-month. The year-over-year comparison is down -11.9%.
 Permission is granted only to ARMLS Subscribers for reproduction with attribution on to ARMLS COPYRIGHT 2019. For questions regarding this publication contact Brand@ARMLS.com. DATA FOR JANUARY 2019 - Published
Weekly Market Activity Report
 Weekly Market Report A RESEARCH TOOL FROM THE MINNEAPOLIS AREA ASSOCIATION OF REALTORS BROUGHT TO YOU BY THE UNIQUE DATA-SHARING TRADITIONS OF THE REALTOR COMMUNITY For Week Ending July 8, 2017 Publish
The Market Watch Monthly Housing Report. Coachella Valley Median Detached Home Price Dec Dec 2016
 The Market Watch Monthly Housing Report Median Price $450,000 Coachella Valley Median Detached Home Price Dec 2002 - Dec 2016 $400,000 $350,000 $300,000 $339,930 $340,000 $250,000 $200,000 $150,000 CV
Weekly Market Activity Report
 Weekly Market Report A RESEARCH TOOL FROM THE MINNEAPOLIS AREA ASSOCIATION OF REALTORS BROUGHT TO YOU BY THE UNIQUE DATA-SHARING TRADITIONS OF THE REALTOR COMMUNITY For Week Ending February 24, 2018 Publish
Coachella Valley Median Detached Home Price April April 2017
 The Desert Housing Report Median Price $450,000 $400,000 Coachella Valley Median Detached Home Price April 2002 - $349,000 $389,000 $350,000 $300,000 $250,000 $200,000 $150,000 CV Detached Median Price
Weekly Market Activity Report A RESEARCH TOOL PROVIDED BY THE CHARLOTTE REGIONAL REALTOR ASSOCIATION FOR MORE INFORMATION CONTACT A REALTOR
 Weekly Market Report A RESEARCH TOOL PROVIDED BY THE CHARLOTTE REGIONAL REALTOR ASSOCIATION FOR MORE INFORMATION CONTACT A REALTOR For Week Ending February 3, 2018 Data current as of February 12, 2018
See Full Corridor Study Volumes I and II as separate attachments.
 See Full Corridor Study Volumes I and II as separate attachments. See Housing Values 2000-2010 and 2000-2013 as separate attachments. 2013 2 nd Quarter and Mid-Year Market Report The voice of real estate
Monthly Indicators + 1.2% - 2.1% % Activity Overview New Listings Pending Sales. Closed Sales. Days on Market Until Sale. Median Sales Price
 Monthly Indicators 2017 We can comfortably consider the first quarter to have been a good start for residential real estate in 2017. There was certainly plenty to worry over when the year began. Aside
rd Quarter Market Report
 2012 3 rd Quarter Market Report The voice of real estate in Central Virginia CAAR Member Copy Expanded Edition Charlottesville Area 3 rd Quarter 2012 Highlights: Overall sales in Greater Charlottesville
Monthly Indicators % + 4.8% %
 ly Indicators A RESEARCH TOOL PROVIDED BY THE CHARLOTTE REGIONAL REALTOR ASSOCIATION FOR MORE INFORMATION CONTACT A REALTOR 2013 We're halfway through the year and it seems our collective attention has
Monthly Indicators - 3.0% 0.0% % Activity Overview New Listings Pending Sales. Closed Sales. Days on Market Until Sale. Median Sales Price
 Monthly Indicators 2017 We can comfortably consider the first quarter to have been a good start for residential real estate in 2017. There was certainly plenty to worry over when the year began. Aside
Monthly Market Watch for the Prescott Quad City Area. Provided by Keller Williams Check Realty Statistics from August 2012 Prescott MLS
 August 2012 Monthly Market Watch for the Prescott Quad City Area Provided by Keller Williams Check Realty Statistics from August 2012 Prescott MLS Report Overview: This report includes MLS data for the
Monthly Indicators + 5.9% % % Activity Overview New Listings Pending Sales. Closed Sales. Days on Market Until Sale. Median Sales Price
 Monthly Indicators 2012 brought tragedy to many East Coast residents. The effects of Sandy compromised basic infrastructure, putting housing activity on hold in the affected areas as recovery took precedence.
Weekly Market Activity Report
 Weekly Market Report A RESEARCH TOOL FROM THE MINNEAPOLIS AREA ASSOCIATION OF REALTORS BROUGHT TO YOU BY THE UNIQUE DATA-SHARING TRADITIONS OF THE REALTOR COMMUNITY For Week Ending July 7, 2018 Publish
Provided by Keller Williams Realty Professional Partners Statistics from September 2010 MLS
 Monthly Market Watch for Maricopa County An overview of what is happening in the Maricopa County real estate market (using September 2010 statistics) Report overview: This report includes MLS data for
nd Quarter Market Report
 2015 2 nd Quarter Market Report The voice of real estate in Central Virginia CAAR Member Copy Expanded Edition Charlottesville Area 2 nd Quarter 2015 Highlights: Closed sales in the Greater Charlottesville
Weekly Market Activity Report A RESEARCH TOOL FROM MINNEAPOLIS AREA REALTORS
 Weekly Market Report A RESEARCH TOOL FROM MINNEAPOLIS AREA REALTORS For Week Ending November 3, 2018 Publish Date: November 12, 2018 All comparisons are to 2017 According to Freddie Mac, the 30-year fixed
Monthly Indicators % % - 2.5% Activity Overview New Listings Pending Sales. Closed Sales. Days on Market Until Sale. Median Sales Price
 Monthly Indicators 2019 It is worthwhile to mention the weather when discussing residential real estate for the state of New York for 2019, because this month has turned in some impressively cold and snowy
Monthly Indicators. December Monthly Snapshot - 0.7% + 7.5% - 5.3%
 Monthly Indicators 2014 Monthly Snapshot + 7.5% - 5.3% - 0.7% It was another recovery year in 2014, although not quite to the level of 2013. With a broad pattern of rising prices and stable to improving
Monthly Indicators. Monthly Snapshot. March % % 0.0%
 Monthly Indicators 2017 We can comfortably consider the first quarter to have been a good start for residential real estate in 2017. There was certainly plenty to worry over when the year began. Aside
The My Listings to Expire report allows you to forecast which of your listings will expire in a time period specified.
 Statistics Statistics is the segment of the program where you can run numerous types of reports regarding your personal sales data, data for your office or company, or for MLS as a whole. The Statistics
Summary Statistics. Closed Sales. Paid in Cash. Median Sale Price. Average Sale Price. Dollar Volume. Median Time to Sale.
 Summary Statistics July 216 July 215 Paid in Cash 24,83 26,165-8.% 6,48 8,533-24.9% $223,238 $199,999 11.6% Average Sale Price Dollar Volume $299,292 $277,17 8.% $7.2 Billion $7.3 Billion -.6% Median Percent
Monthly Market Watch for Maricopa County An overview of what is happening in the Maricopa County real estate market
 Monthly Market Watch for Maricopa County An overview of what is happening in the Maricopa County real estate market Provided by Susan Kraemer of Prudential Arizona Properties Report overview: This report
Summary Statistics. Closed Sales. Paid in Cash. Median Sale Price. Average Sale Price. Dollar Volume. Median Time to Sale.
 ly Market Detail - January 217 Summary Statistics January 217 January 216 Paid in Cash 7,29 6,791 6.2% 4,298 4,28 2.1% $161, $151, 6.6% Average Sale Price Dollar Volume $244,52 $235,221 4.% $1.8 Billion
Summary Statistics. Closed Sales. Paid in Cash. Median Sale Price. Average Sale Price. Dollar Volume. Median Time to Sale.
 Summary Statistics November 216 November 215 Paid in Cash 19,763 17,523 12.8% 5,827 6,65-11.8% $22, $199,99 1.% Average Sale Price Dollar Volume $29,49 $273,155 6.2% $5.7 Billion $4.8 Billion 19.8% Median
Monthly Indicators % + 3.3% %
 ly Indicators A RESEARCH TOOL PROVIDED BY THE CHARLOTTE REGIONAL REALTOR ASSOCIATION FOR MORE INFORMATION CONTACT A REALTOR 2012 It's been a giant year for the housing market and for sports teams named
Volume III Edition I 2011 Year end Recap What will 2012 Bring? Financing for Canadians Where are Canadians Buying in the Greater Phoenix area?
 The Realtors Canadians Trust www.arizonaforcanadians.com Volume III Edition I 2011 Year end Recap What will 2012 Bring? Financing for Canadians Where are Canadians Buying in the Greater Phoenix area? As
Monthly Indicators % + 8.2% % Market Overview New Listings Pending Sales. Closed Sales. Days on Market Until Sale. Median Sales Price
 Monthly Indicators 2017 We can comfortably consider the first quarter to have been a good start for residential real estate in 2017. There was certainly plenty to worry over when the year began. Aside
Summary Statistics. Closed Sales. Paid in Cash. Median Sale Price. Average Sale Price. Dollar Volume. Median Time to Sale.
 ly Market Detail - September 217 Summary Statistics September 217 September 216 Paid in Cash 18,3 22,653-2.4% 4,698 6,344-25.9% $239,9 $223, 7.6% Average Sale Price Dollar Volume $36,77 $289,781 5.9% $5.5
Summary Statistics. Closed Sales. Paid in Cash. Median Sale Price. Average Sale Price. Dollar Volume. Median Time to Sale.
 ly Market Detail - March 217 Summary Statistics March 217 March 216 Paid in Cash 25,921 23,714 9.3% 7,567 7,594 -.4% $231,9 $29,969 1.4% Average Sale Price Dollar Volume $318,115 $285,868 11.3% $8.2 Billion
Summary Statistics. Closed Sales. Paid in Cash. Median Sale Price. Average Sale Price. Dollar Volume. Median Time to Sale.
 Summary Statistics January 219 January 218 Paid in Cash 15,526 16,561-6.2% 4,556 5,34-9.5% $249,9 $24, 4.1% Average Sale Price Dollar Volume $34,241 $334,381 1.8% $5.3 Billion $5.5 Billion -4.6% Median
Summary Statistics. Closed Sales. Paid in Cash. Median Sale Price. Average Sale Price. Dollar Volume. Median Time to Sale.
 ly Market Detail - January 218 Summary Statistics January 218 January 217 Paid in Cash 7,634 7,29 5.9% 4,328 4,298.7% $179,9 $161, 11.7% Average Sale Price Dollar Volume $286,44 $244,52 17.1% $2.2 Billion
Year to Date (thru June)
") CAAR Market Report 2009 Mid-Year Published by the Charlottesville Area Association of REALTORS Where Are We Now? The pace of home purchases in the Charlottesville area continues to improve from the dismal
CAAR Market Report 2009 Mid-Year Published by the Charlottesville Area Association of REALTORS Where Are We Now? The pace of home purchases in the Charlottesville area continues to improve from the dismal
Coachella Valley Median Detached Home Price Mar Mar 2018
 Median Price $450,000 Coachella Valley Median Detached Home Price Mar 2002 - Mar 2018 $392,000 $400,000 $366,285 $350,000 $300,000 $250,000 $200,000 $150,000 Media Detached Price 4% Growth Curve Summary
Summary Statistics. Closed Sales. Paid in Cash. Median Sale Price. Average Sale Price. Dollar Volume. Median Time to Sale.
 Summary Statistics November 218 November 217 Paid in Cash 2,578 19,983 3.% 5,338 5,372 -.6% $255, $24, 6.3% Average Sale Price Dollar Volume $331,711 $314,76 5.4% $6.8 Billion $6.3 Billion 8.5% Median
Monthly Indicators % + 9.4% % Activity Overview New Listings Pending Sales. Closed Sales. Days on Market Until Sale. Median Sales Price
 Monthly Indicators 2017 The number of homes for sale, days on market and months of supply were all down in year-over-year comparisons in a majority of the country for the entirety of 2017, as was housing
2013 Year-End Market Report
 2013 Year-End Market Report The voice of real estate in Central Virginia CAAR Member Copy Expanded Edition Charlottesville Area Year-End 2013 Highlights: Yearly home sales in Greater Charlottesville were
Summary Statistics. Closed Sales. Paid in Cash. Median Sale Price. Average Sale Price. Dollar Volume. Median Time to Sale.
 ly Market Detail - May 218 Summary Statistics May 218 May 217 Paid in Cash 12,25 11,551 4.1% 6,24 6,285-1.3% $188, $177,6 5.9% Average Sale Price Dollar Volume $282,262 $261,48 7.9% $3.4 Billion $3. Billion
Real Estate Market Report December 2013
 Real Estate Market Report December 2013 A comprehensive report on the SW Riverside County real estate market. www.swriversidecountyhomes.com December, 2013 In December, The real estate market ended the
Summary Statistics. Closed Sales. Paid in Cash. Median Sale Price. Average Sale Price. Dollar Volume. Median Time to Sale.
 ly Market Detail - Q1 216 Summary Statistics Q1 216 Q1 215 Paid in Cash 57,913 57,742.3% 2,133 23,724-15.1% $23,5 $182, 11.8% Average Sale Price Dollar Volume $285,447 $266,453 7.1% $16.5 Billion $15.4
Summary Statistics. Closed Sales. Paid in Cash. Median Sale Price. Average Sale Price. Dollar Volume. Median Time to Sale.
 ly Market Detail - 213 Summary Statistics 213 212 Paid in Cash 225,46 23,85 11.% 11,334 92,853 9.1% $168,5 $145, 16.2% Average Sale Price Dollar Volume $246,86 $22,89 11.8% $55.5 Billion $44.7 Billion
Weekly Market Activity Report
 Weekly Market Report A RESEARCH TOOL FROM THE MINNEAPOLIS AREA ASSOCIATION OF REALTORS BROUGHT TO YOU BY THE UNIQUE DATA-SHARING TRADITIONS OF THE REALTOR COMMUNITY For Week Ending June 30, 2018 Publish
Monthly Indicators % - 1.6% + 6.0%
 ly Indicators A RESEARCH TOOL PROVIDED BY METRO MLS FOR ACTIVITY IN THE 4-COUNTY MILWAUKEE METROPOLITAN AREA 2019 Quick Facts It is worthwhile to mention the weather when discussing residential real estate
Monthly Indicators. Quick Facts - 0.9% December % + 7.1%
 Monthly Indicators 2017 The number of homes for sale, days on market and months of supply were all down in year-over-year comparisons in a majority of the country for the entirety of 2017, as was housing
Coachella Valley Median Detached Home Price Jan Jan 2017
 The Desert Housing Report Median Price $450,000 Coachella Valley Median Detached Home Price Jan 2002 - Jan 2017 $400,000 $350,000 $300,000 $250,000 $335,000 $340,000 $200,000 $150,000 CV Detached Median
Summary Statistics. Closed Sales. Paid in Cash. Median Sale Price. Average Sale Price. Dollar Volume. Median Time to Sale.
 ly Market Detail - Q1 217 Summary Statistics Q1 217 Q1 216 Paid in Cash 6,69 57,779 5.% 18,678 2,133-7.2% $226, $24,74 1.7% Average Sale Price Dollar Volume $311,2 $286,99 8.8% $18.9 Billion $16.5 Billion
2017 RESIDENTIAL REAL ESTATE MARKET REPORT
 2017 RESIDENTIAL REAL ESTATE MARKET REPORT Published January 26, 2018 Our market reports have been focused on the effects of low inventory on our housing market and for good reason. December 2017 marked
The Desert Housing Report. Coachella Valley Median Detached Home Price December December 2018
 Median Price $450,000 $400,000 Coachella Valley Median Detached Home Price December 2002 - $369,450 $389,944 $350,000 $300,000 $250,000 $200,000 $150,000 CV Detached Median Price 4% Growth Curve Summary
Summary Statistics. Closed Sales. Paid in Cash. Median Sale Price. Average Sale Price. Dollar Volume. Median Time to Sale.
 ly Market Detail - March 216 Summary Statistics March 216 March 215 Paid in Cash 4,128 4,313-4.3% 1,357 1,724-21.3% $292,25 $275, 6.3% Average Sale Price Dollar Volume $434,683 $44,392 7.5% $1.8 Billion
Summary Statistics. Closed Sales. Paid in Cash. Median Sale Price. Average Sale Price. Dollar Volume. Median Time to Sale.
 ly Market Detail - November 217 Summary Statistics November 217 November 216 Paid in Cash 19,99 19,725 1.3% 5,375 5,827-7.8% $24, $22, 9.1% Average Sale Price Dollar Volume $314,632 $29,579 8.3% $6.3 Billion
Summary Statistics. Closed Sales. Paid in Cash. Median Sale Price. Average Sale Price. Dollar Volume. Median Time to Sale.
 ly Market Detail - December 217 Summary Statistics December 217 December 216 Paid in Cash 9,193 8,673 6.% 4,774 4,842-1.4% $18, $166,9 7.8% Average Sale Price Dollar Volume $261,64 $235,44 11.1% $2.4 Billion
Monthly Indicators % + 6.9% - 1.7% Market Overview New Listings Pending Sales. Closed Sales. Days on Market Until Sale. Median Sales Price
 Monthly Indicators 2016 We are in the thick of an exciting period of home buying and selling, often with quick multiple offers that are near, at or even above asking price, depending on the factors of
Summary Statistics. Closed Sales. Paid in Cash. Median Sale Price. Average Sale Price. Dollar Volume. Median Time to Sale.
 ly Market Detail - September 216 Summary Statistics September 216 September 215 Paid in Cash 8,818 9,179-3.9% 4,917 5,477-1.2% $16, $15, 6.7% Average Sale Price Dollar Volume $221,69 $228,336-2.9% $2.
CONTENTS. Executive Summary 1. Southern Nevada Economic Situation 2 Household Sector 5 Tourism & Hospitality Industry
 CONTENTS Executive Summary 1 Southern Nevada Economic Situation 2 Household Sector 5 Tourism & Hospitality Industry Residential Trends 7 Existing Home Sales 11 Property Management Market 12 Foreclosure
Summary Statistics. Closed Sales. Paid in Cash. Median Sale Price. Average Sale Price. Dollar Volume. Median Time to Sale.
 ly Market Detail - September 217 Summary Statistics September 217 September 216 Paid in Cash 7,44 8,8-15.9% 3,9 4,92-2.7% $173, $16, 8.1% Average Sale Price Dollar Volume $239,877 $222,38 7.9% $1.8 Billion
Summary Statistics. Closed Sales. Paid in Cash. Median Sale Price. Average Sale Price. Dollar Volume. Median Time to Sale.
 ly Market Detail - February 216 Summary Statistics February 216 February 215 Paid in Cash 3,3 3,229 2.2% 1,216 1,355-1.3% $29, $265, 9.4% Average Sale Price Dollar Volume $465,268 $411,851 13.% $1.5 Billion
Summary Statistics. Closed Sales. Paid in Cash. Median Sale Price. Average Sale Price. Dollar Volume. Median Time to Sale.
 ly Market Detail - September 215 Summary Statistics September 215 September 214 Paid in Cash 22,813 2,553 11.% 7,764 8,6-3.7% $199,9 $18, 11.1% Average Sale Price Dollar Volume $27,724 $247,886 9.2% $6.2
Summary Statistics. Closed Sales. Paid in Cash. Median Sale Price. Average Sale Price. Dollar Volume. Median Time to Sale.
 ly Market Detail - March 215 Summary Statistics March 215 March 214 Paid in Cash 23,92 19,597 22.% 9,267 8,893 4.2% $19, $174, 9.2% Average Sale Price Dollar Volume $271,937 $257,335 5.7% $6.5 Billion
Summary Statistics. Closed Sales. Paid in Cash. Median Sale Price. Average Sale Price. Dollar Volume. Median Time to Sale.
 Summary Statistics Q3 218 Q3 217 Paid in Cash 28,894 26,39 9.5% 14,3 13,783 3.8% $182,5 $171,945 6.1% Average Sale Price Dollar Volume $254,582 $239,736 6.2% $7.4 Billion $6.3 Billion 16.3% Median Percent
Summary Statistics. Closed Sales. Paid in Cash. Median Sale Price. Average Sale Price. Dollar Volume. Median Time to Sale.
 ly Market Detail - October 218 Summary Statistics October 218 October 217 Paid in Cash 22,272 2,535 8.5% 5,97 5,347 11.7% $253,853 $235,9 7.6% Average Sale Price Dollar Volume $331,626 $38,94 7.4% $7.4
Summary Statistics. Closed Sales. Paid in Cash. Median Sale Price. Average Sale Price. Dollar Volume. Median Time to Sale.
 ly Market Detail - 216 Summary Statistics 216 215 Paid in Cash 268,731 266,29.9% 8,84 95,65-16.3% $219,9 $196, 12.2% Average Sale Price Dollar Volume $293,581 $276,482 6.2% $78.9 Billion $73.6 Billion
Monthly Indicators + 3.5% + 3.0% % Activity Overview New Listings Pending Sales. Closed Sales. Days on Market Until Sale. Median Sales Price
 Monthly Indicators 218 Housing price bubble chatter has increased this summer, as market observers attempt to predict the next residential real estate shift. It is too early to predict a change from higher
Monthly Indicators + 3.1% + 9.8% % Market Overview New Listings Pending Sales. Closed Sales
 Monthly Indicators 2017 How long can the residential real estate market go on like this? We are about two years into a national trend of dropping housing supply and increasing median sales prices. There
Manhattan New Dev. Market Report th Quarter mns.com
 Manhattan New Dev. Market Report 2012 4th Quarter TABLE OF CONTENTS TABLE OF CONTENTS 03 Introduction 04 Market Snapshot 09 Neighborhood Trends 09 Battery Park City 10 Chelsea 11 East Village 12 Financial
Washington, D.C. Metro Area December 2017 Housing Market Update
 Washington, D.C. Metro Area December 2017 Housing Market Update Washington D.C. Metro housing market closes out 2017 with record high December house price of $420,050; December inventories decline for
Monthly Indicators + 8.8% + 9.0% % Market Overview New Listings Pending Sales. Closed Sales. Days on Market Until Sale. Median Sales Price
 Monthly Indicators 2017 The facts of residential real estate have remained consistent in 2017. In year-overyear comparisons, the number of homes for sale has been fewer in most locales, and homes have
The Desert Housing Report. Coachella Valley Median Detached Home Price March March 2019 $392,000 $415,000
 Median Price $450,000 $400,000 $350,000 $300,000 $250,000 $200,000 $150,000 Coachella Valley Median Detached Home Price March 2002 - $392,000 $415,000 CV Detached Median Price Summary 4% Growth Curve The
Monthly Indicators % % - 5.3% Activity Overview New Listings Pending Sales. Closed Sales. Days on Market Until Sale. Median Sales Price
 Monthly Indicators 2018 Housing price bubble chatter has increased this summer, as market observers attempt to predict the next residential real estate shift. It is too early to predict a change from higher
Summary Statistics. Closed Sales. Paid in Cash. Median Sale Price. Average Sale Price. Dollar Volume. Median Time to Sale.
 ly Market Detail - September 217 Summary Statistics September 217 September 216 Paid in Cash 7,411 8,8-15.8% 3,92 4,92-2.7% $173, $16, 8.1% Average Sale Price Dollar Volume $239,786 $222,38 7.9% $1.8 Billion
Summary Statistics. Closed Sales. Paid in Cash. Median Sale Price. Average Sale Price. Dollar Volume. Median Time to Contract. Median Time to Sale
 Summary Statistics 217 216 Paid in Cash 3,84 3,63 6.6% 2,38 2,319 2.6% $225, $21, 7.1% Average Sale Price Dollar Volume $362,29 $328,965 1.1% $1.4 Billion $1.2 Billion 17.4% Median Percent of Original
Summary Statistics. Closed Sales. Paid in Cash. Median Sale Price. Average Sale Price. Dollar Volume. Median Time to Sale.
 ly Market Detail - February 218 Summary Statistics February 218 February 217 Paid in Cash 18,62 18,33 3.3% 5,588 5,859-4.6% $246,5 $225, 9.6% Average Sale Price Dollar Volume $336,61 $313,41 7.4% $6.3
Summary Statistics. Closed Sales. Paid in Cash. Median Sale Price. Average Sale Price. Dollar Volume. Median Time to Sale.
 ly Market Detail - April 218 Summary Statistics April 218 April 217 Paid in Cash 24,84 23,829 4.1% 6,429 6,573-2.2% $253,895 $234,9 8.1% Average Sale Price Dollar Volume $353,948 $32,574 1.4% $8.8 Billion
Summary Statistics. Closed Sales. Paid in Cash. Median Sale Price. Average Sale Price. Dollar Volume. Median Time to Sale.
 ly Market Detail - July 218 Summary Statistics July 218 July 217 Paid in Cash 25,488 24,546 3.8% 6,243 5,972 4.5% $255, $24, 6.3% Average Sale Price Dollar Volume $335,55 $316,887 5.7% $8.5 Billion $7.8
Single Family Sales Maine: Units
 Maine Home Connection 19 Commercial St Portland, Maine 04101 MaineHomeConnection.com Office: (207) 517-3100 Email: Info@MaineHomeConnection.com For the fourth consecutive year, Maine home sales set a new
Coachella Valley Median Detached Home Price May May 2018
 Median Price $450,000 $400,000 Coachella Valley Median Detached Home Price May 2002 - $389,000 $412,000 $350,000 $300,000 $250,000 $200,000 $150,000 CV Detached Median Price 4 % Growth Curve Summary The
Summary Statistics. Closed Sales. Paid in Cash. Median Sale Price. Average Sale Price. Dollar Volume. Median Time to Sale.
 ly Market Detail - December 16 Summary Statistics December 16 December 1 Paid in Cash 1.% N/A $6, $67, -3.7% Average Sale Price Dollar Volume $18,1 $67, 89.8% $6, $13, 37.% Median Percent of Original List
Scottsdale Area Association of REALTORS MARKET DATA REPORT. September Scottsdale Area Association of REALTORS
 Scottsdale Area Association of REALTORS MARKET DATA REPORT Scottsdale Area Association of REALTORS 8600 E Anderson Dr, Suite 200 Scottsdale, AZ 85255 SAARonline.com 480-945-2651 info@saaronline.com Listings
Summary Statistics. Closed Sales. Paid in Cash. Median Sale Price. Average Sale Price. Dollar Volume. Median Time to Sale.
 ly Market Detail - October 218 Summary Statistics October 218 October 217 Paid in Cash 268 243 1.3% 162 127 27.6% $233,745 $224, 4.4% Average Sale Price Dollar Volume $3,172 $334,247-1.2% $8.4 Million
Summary Statistics. Closed Sales. Paid in Cash. Median Sale Price. Average Sale Price. Dollar Volume. Median Time to Sale.
 Summary Statistics June 218 June 217 Paid in Cash 958 1,33-7.3% 193 221-12.7% $229,95 $22, 4.5% Average Sale Price Dollar Volume $274,57 $259,469 5.8% $263. Million $268. Million -1.9% Median Percent of
Summary Statistics. Closed Sales. Paid in Cash. Median Sale Price. Average Sale Price. Dollar Volume. Median Time to Sale.
 Summary Statistics May 218 May 217 Paid in Cash 1,518 1,58-3.9% 289 349-17.2% $355, $335, 6.% Average Sale Price Dollar Volume $456,861 $48,579 11.8% $693.5 Million $645.6 Million 7.4% Median Percent of
Monthly Indicators - 7.4% + 5.6% % Activity Overview New Listings Pending Sales. Closed Sales. Days on Market Until Sale. Median Sales Price
 Monthly Indicators 218 Rising home prices, higher interest rates and increased building material costs have pressured housing affordability to a ten-year low, according to the National Association of Home
Weekly Market Activity Report
 Weekly Market Report A RESEARCH TOOL FROM THE MINNEAPOLIS AREA ASSOCIATION OF REALTORS BROUGHT TO YOU BY THE UNIQUE DATA-SHARING TRADITIONS OF THE REALTOR COMMUNITY For Week Ending September 5, 2015 Publish
CONTENTS. Executive Summary. Southern Nevada Economic Situation 1 Household Sector 4 Tourism & Hospitality Industry
 CONTENTS Executive Summary Southern Nevada Economic Situation 1 Household Sector 4 Tourism & Hospitality Industry Residential Trends 6 Existing Home Sales 10 Property Management Market 11 Foreclosure Situation
Monthly Indicators % + 3.9% % 2 New Listings. 3 Pending Sales. 4 5 Days on Market Until Sale. 6 7 Average Sales Price
 Monthly Indicators 2012 It's been a giant year for the housing market and for sports teams named Giants. As we round out the remaining two months of the year, let's recap. Most markets shed listings, resulting
Summary Statistics. Closed Sales. Paid in Cash. Median Sale Price. Average Sale Price. Dollar Volume. Median Time to Sale.
 ly Market Detail - Q1 217 Summary Statistics Q1 217 Q1 216 Paid in Cash 2,96 2,713 9.1% 1,85 1,71 1.3% $249,9 $22,7 13.6% Average Sale Price Dollar Volume $351,61 $328,235 7.% $1. Billion $89.5 Million