WRF Webcast. Water Use in the Multi-family Housing Sector
|
|
|
- Ethan Kennedy
- 5 years ago
- Views:
Transcription

1 WRF Webcast Water Use in the Multi-family Housing Sector February 1, 2018 No part of this presentation may be copied, reproduced, or otherwise utilized without permission.
2 Webcast Agenda Introductions & background Maureen Hodgins 5 min Presentation Jack Kiefer 45 min Question & Answers 10 min Survey 4 questions for audience
3 WRF Research Demand Forecasting & Management Goal Help improve utility plans Drivers changing water use trends, population changes, limited supplies, and/or increasing costs $3.5 M 16 projects, 11 published, 5 ongoing
4 Check out later Published CII, 4375, 2015 Residential, 4309, 2016 Multi-family, 4554, 2018 To be published 2018 Demand patterns f/ sizing meters & service Lines, 4689, est 2018 Commercial, 4619, est 2018 Customer water use Factors impacting demand Published Climate change, 4263, 2013 Recession, 4458, 2016 Passive efficiency, 4495, est 2018 Irrigation controllers, 4227, 2016 To be published Urban landscape research needs, 4633, est 2018 Published Uncertainty & long term forecasts, 4558, 2016 Uncertainty in forecasts & planning Forecasting approaches Published Customer data, 4527, 2016 Short term, 4501, 2017 To be published Long term, 4667, est 2020 Probability mgmt, 4742, est 2020

5 Summary of demand forecasting & management research

6 Downloading the 4554 report waterrf.org search 4554 download PDF
7 FYI
8 Input your webinar questions here Q&A at end of webinar

9 Download presentation Slides and recording will be available to WRF subscribers WITHIN 24 hours after the webcast
10 Water Use in the Multi-family Housing Sector Jack C. Kiefer, Ph.D. Lisa R. Krentz No part of this presentation may be copied, reproduced, or otherwise utilized without permission.
11 Presentation Overview Background on WRF 4554 Data sources and collection methods Metrics and comparisons Examples and results of modeling variability in water use Summary and conclusions Recommendations
12 The Multi-family Housing Sector About 25% percent of housing (or about 33 million residences) in the U.S Share of multi-family dwellings increasing in some areas Multi-family housing dominant residential sector in some denser urban areas Many areas plan to direct future development or densify
13 Water Research Foundation Project 4554 Water Use in the Multi-family Housing Sector Objectives Narrow knowledge gaps Develop, demonstrate, and recommend analytical strategies for: Estimating multi-family water use Categorizing multi-family properties Forecasting water use for water use categories
14 Defining what is Multi-family Everything other than traditional single-family detached homes Any residential property w/2+ units Master-metered residential properties General practice to lump MF into general residential or commercial customer classes detached, semidetached, row house, or multi-family structures with 5 or more units. Ownership/Tenure Rental Apartments Duplex Multiplex Individually Owned Condominiums Townhouses Jointly Owned Cooperatives

15 What multi-family looks like

16 What multi-family looks like

17 What multi-family looks like

18 What multi-family looks like

19 What multi-family looks like

20 What multi-family looks like
21 Selected Research Questions To what extent does multi-family water use differ from single-family use? How does water use differ among subclasses of the multi-family sector? What factors influence water use in the multifamily sector and major sub-classes? Does greater development density lead to less use? What are the effects of given property features?
22 Data Collection Water use for multi-family properties or classes Number of dwelling units (scale measure) Sub-classifications Property characteristics Other potentially influential variables Price Income Climatic Secondary information only
23 Utility Partners Denver Water New York City Department of Environmental Protection Phoenix Water Services San Diego County Water Authority Tampa Bay Water
24 Other Key Data Sources U.S. Census American Housing Survey American Community Survey New York University Furman Center Fannie Mae
25 What the US Census tells us Increase in share of population living in multiple unit structures Rental tenure dominates Lower incomes Smaller households Younger householders Proportionally fewer (in unit) clothes washers and dish washers (especially renter-occupied)
26 30 US Counties with Largest Multi-family Housing Share (2015) County Estimated Population in Multiple Unit Structures Percent of Total Population New York County, New York 1,532, % Bronx County, New York 1,230, % Kings County, New York 2,152, % Hudson County, New Jersey 537, % Suffolk County, Massachusetts 543, % Queens County, New York 1,565, % Alexandria city, Virginia 92, % San Francisco County, California 469, % Essex County, New Jersey 426, % Arlington County, Virginia 121, % District of Columbia, District of Columbia 319, % Passaic County, New Jersey 249, % Providence County, Rhode Island 274, % Cook County, Illinois 2,312, % Westchester County, New York 417, % St. Louis city, Missouri 131, % Milwaukee County, Wisconsin 372, % Union County, New Jersey 217, % Albany County, New York 108, % Cass County, North Dakota 61, % Middlesex County, Massachusetts 564, % Fulton County, Georgia 352, % Essex County, Massachusetts 273, % Richmond city, Virginia 75, % Orleans Parish, Louisiana 135, % Grand Forks County, North Dakota 23, % Denver County, Colorado 234, % Los Angeles County, California 3,509, % Hampden County, Massachusetts 158, % Bristol County, Massachusetts 187, %
27 Selected High Population Counties with Largest Gains in Multi-family ( ) County 2015 Population Change in Population Change Single Unit Change Multiple Unit Gain in Multiple Unit Share (Percentage Points) San Diego County, California 3,213, , , , Queens County, New York 2,310,954 95,615-36, , Cook County, Illinois 5,147,733-58, ,641 80, Santa Clara County, California 1,881, , ,042 94, Kings County, New York 2,597, ,038-27, , Bexar County, Texas 1,868, , , , Hillsborough County, Florida 1,328, , ,129 72, King County, Washington 2,081, , , , Alameda County, California 1,607, , ,420 77, Suffolk County, New York 1,469,390 24, , Orange County, California 3,125, ,779 87,164 97, Middlesex County, Massachusetts 1,526, ,367 57,803 60, Nassau County, New York 1,341,365 31,289 14,298 18, Orange County, Florida 1,255, , ,064 80,
28 Top 30 Counties with Largest Gains in Multi-family ( ) County 2015 Population Gain in Multiple Unit Share (Percentage Points) Arlington County, Virginia 226, Monongalia County, West Virginia 98, Natrona County, Wyoming 80, Harrison County, Mississippi 196, Suffolk city, Virginia 87, Cattaraugus County, New York 75, Leon County, Florida 272, Polk County, Oregon 77, Grand Forks County, North Dakota 66, Vigo County, Indiana 99, Orleans Parish, Louisiana 377, Craighead County, Arkansas 100, Jefferson County, Texas 238, Bradley County, Tennessee 101, Cass County, North Dakota 166, Cumberland County, North Carolina 313, Rockland County, New York 318, Muskingum County, Ohio 84, Dorchester County, South Carolina 150, Union County, New Jersey 548, Forsyth County, North Carolina 358, Houston County, Georgia 148, Portsmouth city, Virginia 92, Erie County, Ohio 74, Adams County, Illinois 65, Elmore County, Alabama 77, Lane County, Oregon 354, Bartholomew County, Indiana 80, Monroe County, Florida 75, Armstrong County, Pennsylvania 66,
29 Comparison of Unit Usage Rates (gallons per unit per day) Utility Multi-family Sector (Composite) Units Mean (Grand) Median Denver (2014) 192, New York City (2014) 2,143,108* Phoenix (2014) 181, San Diego County (2012) Tampa Bay Water (2014) 423, n/a 280, *Excludes properties in One-Family Dwelling or Mixed Residential/Commercial Land Use Tax Classes Relatively weak association with climate Distributions skewed to the right
30 Comparison of Unit Usage Rates (gallons per unit per day) Utility Multi-family Sector (Composite) Units Mean (Grand) Single-Family Sector Median Units Mean Median Denver (2014) 192, , n/a New York City (2014) 2,143,108* , Phoenix (2014) 181, , San Diego County (2012) Tampa Bay Water (2014) MF<SF in all cases 423, n/a 670, n/a 280, , *Excludes properties designated as One-Family Dwelling or Mixed Residential/Commercial Stronger association with climate in SF sector
31 Annual Precipitation and Average Unit Use Single-Family
32 Annual Precipitation and Average Unit Use
33 Gallons per Capita per Day (GPCD) Estimated Average Annual Water Use Per Capita for Five Water Systems (gallons per capita per day) Single-Family Multifamily Denver (2014) New York City (2014) Phoenix (2014) San Diego County (2012) Tampa Bay Water (2014)
34 Gallons per Capita per Day (GPCD) Estimated Average "Min-Month" Water Use Per Capita for Five Water Systems (gallons per capita per day) Single-Family Multifamily Denver (2014) New York City (2014) Phoenix (2014) San Diego County (2012) Tampa Bay Water (2014)
35 Evaluation of Sub-Classification Do average usage patterns differ significantly based on definitional groupings? Different utilities define multi-family sector differently Different utilities sub-classify multi-family sector differently Analysis depends on use of external and linkable data Land use codes Property use codes Building types
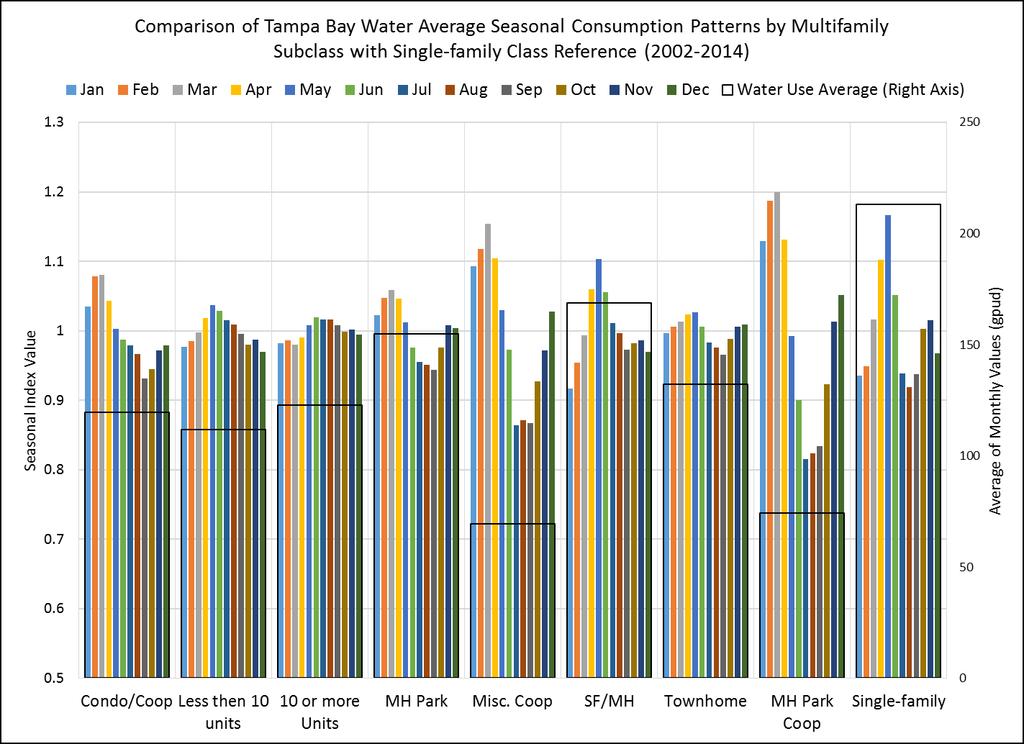
36 Sub-classification Example-Tampa Bay Water
37 Sub-classification Example-Tampa Bay Water

38 Sub-classification Example-Tampa Bay Water
39 New York City Classifications Multi-family Two or Three Family Dwellings Multi-family Buildings Mixed Residential & Commercial Two Family Dwellings 4 additional subclasses Condominiums 8 additional subclasses Elevator Apartments 10 additional subclasses Walk-up Apartments 10 additional subclasses Residence Multiple Use 7 additional subclasses
40 Gallons per Unit per Day (GPUD) 250 New York City Mean 2014 Unit Use by Residential Land Use Tax Classes (GPUD) One Family Dwellings Mixed Residential & Commercial Buildings Multi-Family Buildings Two-Three Family Dwelling
41 Gallons per Unit per Day (GPUD) 176 New York City Mean 2014 Unit Use for Building Classes within Multi-family Buildings" Land Use Tax Class (GPUD) ELEVATOR APARTMENTS CONDOMINIUMS WALK UP APARTMENTS Multifamily Buildings Class Average
42 Gallons per Unit per Day (GPUD) New York City Mean 2014 Unit Use for Building Sub-Classes within "Elevator Apartments" Building and Multi-family Buildings" Land Use Tax Class (GPUD) Fireproof (Standard Construction Without Stores) Co-op Conversion From Loft/Warehouse Miscellaneous Semi-fireproof (Without Stores) Converted Cooperatives (Other Than Condominiums) Artists in Residence Luxury Type Multifamily Buildings - Elevator Apartments Subclass Average
43 Gallons per Unit per Day (GPUD) 250 Phoenix 2014 Multi-family Annual Average Unit Usage Rates by Major Subclass (gallons per unit per day) Apartment Condominium Multiplex Multifamily Class Average
44 Median Unit Use and Housing Density (Phoenix)
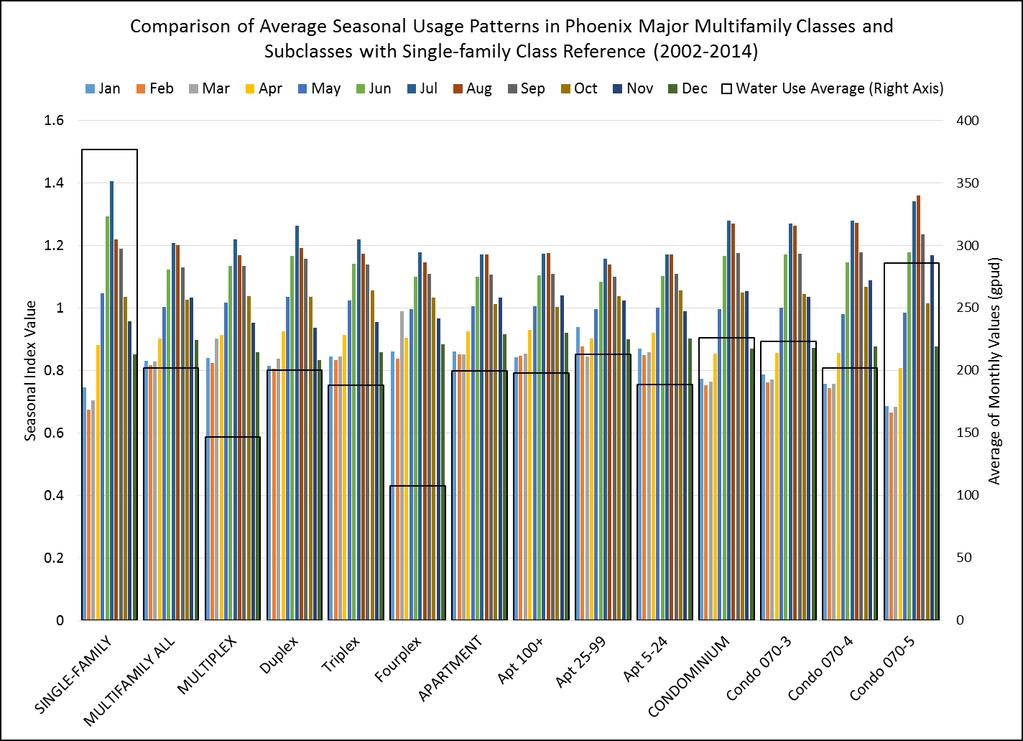
45 Seasonal Peaking and Housing Density (Phoenix)
46 Median Unit Use and Housing Density (Tampa Bay Water)
47 Median Unit Use and Housing Density (New York City)
48 Assessment of Multi-family Demand Determinants Regional water use and socioeconomic databases for San Diego County and Tampa Bay Water NYU Furman Center housing and demographic database Property-level water use and survey data from 2012 Fannie Mae Multi-family Market Research Energy and Water Survey Utility-provided databases with selected property attribute and geographic assignments Tampa Bay Water Phoenix New York City Denver
49 Multi-family Class-level Forecast Model (San Diego County) Balanced panel model of water use, socioeconomics, weather, and climate 22 agencies, 120 months each Variable Estimated Multifamily Elasticity Marginal Price for Water (inflation-adjusted) Median Household Income (inflationadjusted) Housing Density (housing units per acre) Household Size +0.56
50 Multi-family Class-level Forecast Model (San Diego County) Balanced panel model of water use, socioeconomics, weather, and climate 22 agencies, 120 months each Variable Estimated Multifamily Elasticity Estimated Single- Family Elasticity Marginal Price for Water (inflation-adjusted) < Median Household Income (inflationadjusted) < Housing Density (housing units per acre) Household Size <
51 Factor Analysis of NYC Community Districts Socioeconomic data from NYU Furman Center available for 57 metrics across 59 Community Districts (64 metrics total) 1. Aggregate premise level water use data to community district level 2. Condense demographic metrics into fewer thematic factors 3. Evaluate median water use per dwelling unit with respect to factor scores

52 Factor Analysis of NYC Community Districts Thematic Factor Affluence Poverty Property Value/Cooling Towers Severe Crowding Estimated Effect of 1 unit change in factor score -18 gpud +23 gpud +8 gpud +15 gpud

53 Property-level Assessments (Fannie Mae Survey) Sample of 955 multi-family properties for 2012 categorized by region
54 Property-level Assessments (Fannie Mae Survey) Regression analysis of cross-sectional data on multi-family property features, accounting for region (n=323) Variable Estimated Elasticity or Effect Average Cost of Water Presence of Pool +10% Tenant Pays for Water -17% Level + Mechanism Property Receives Govt Subsidy -12% Property Built >= % Senior Living Facility -18%
55 Data Available from Utility Partners for Property-level Assessments System Units Lot Size Year Built Assessed Value Presence of Pool(s) Presence of Reclaimed Water Presence of Cooling Tower(s) Denver X X (pervious area) X New York City X X X X X Phoenix X X X Tampa Bay Water X (Apt only X X X X X X X (Apt only)
56 System Denver (2015) Tampa Bay Water ( average) Phoenix ( average) New York City (2014) Class Density (Units/Acre) Elasticity Assessed Value Elasticity Effect of Pool(s) Effect of Reclaimed Water Effect of Cooling Tower(s) Age Profile Multi-family Total Multi-family Total % -20.5% +-+- Condo % -18.2% +-+ Townhouse % -18.4% +- Less than 10 Units % -17.4% or More Units % -4.7% Access to alternative supplies has significant Pools increase effect on TBW water use All density estimates Effects of income demands negative and proxy are mixed statistically significant Multi-family Total Apartment % +28.7% +-+ Condo Impact of cooling towers proportionally larger in the desert Multiplex Condominiums % +-+- Elevator Apartments % +-+- Walk-up Apartments % -+-+
57 Summary & Conclusions Water use per unit in the Multi-family sector is generally lower than water use per unit in the Single-family sector The gap between SF and MF unit usage rates narrows when accounting for household size and seasonality For a given climate, generally lower seasonal use in the MF sector relative to SF
58 Summary & Conclusions Development density is statistically important More units per acre (i.e., higher unit density) - lower unit usage rates Results are consistent with Notion of shared outdoor (and other) uses Less irrigated area
59 Summary & Conclusions Two main effects from densification Between class: MF is denser than SF Within class: more dense MF, generally less water use (per dwelling unit)
60 Summary & Conclusions Water use in the MF sector is also influenced by Climate and weather Property features (water end uses, age) Socioeconomics Price The estimated effects of water use determinants tend to vary by geographic area Underlying climate Sector/subclass structure
61 Summary & Conclusions The ability to obtain information on housing units is essential for: Accounting for scale differences Calculating densities Joins to tax appraiser data typically permits estimation of units and additional classification options Sub-classification of the MF sector matters Can affect sample statistics and modeling relationships Can t easily infer reasons for differences based on segmentation alone
62 Recommendations Patterns of urban development and re-development is a key area of future uncertainty Keep a watchful eye on housing trends Recognize potential impacts of densification and other development policies Investigate the underlying structure of the overall multifamily sector Test for statistical associations with key variables for the purposes of forecasting and profiling Seek more uniformity and consistency in classifying and sub-classifying multi-family Better metrics More robust comparisons
63 Q&A No part of this presentation may be copied, reproduced, or otherwise utilized without permission.
64 Thank you Comments or questions, please contact: For more information visit: No part of this presentation may be copied, reproduced, or otherwise utilized without permission.
65 Extra Support Slides No part of this presentation may be copied, reproduced, or otherwise utilized without permission.
66 SF Metric Value/MF Metric Value Ratio of Single-Family to Multifamily Usage Rate Estimates for Five Water Systems Ratio Annual Use per Unit Ratio Annual Use per Capita Ratio "Min-Month" Use per Capita Denver (2014) New York City (2014) Phoenix (2014) San Diego County (2012) Tampa Bay Water (2014)

 Avg Peak Avg Trough = 1.")
67 Denver ( ) Average Seasonal Patterns Avg Peak Avg Trough = 1.89 San Diego County ( ) Phoenix ( ) Avg Peak Avg Trough = 1.23 Avg Peak Avg Trough = 1.48


68 New York City (2011-AMR Sample) Average Seasonal Patterns Avg Peak Avg Trough = 1.10 Tampa Bay Water ( ) Unique Seasonal Pattern Spring is dry season Snowbirds /Spring Break Avg Peak Avg Trough = 1.06
69
70
71 Estimated Socioeconomic Effects for Tampa Bay Water Project data supporting Tampa Bay Water s forecast model re-development Multi-family Class Price Elasticity Income Elasticity All Multi-family Condo Townhouse Less than 10 Units or more Units Mobile Home (single unit) Mobile Home (multiple unit/parks) Single-Family to to +0.45
72 Calculated Value 25 Plot of Building Age Portion of Regression Equation = Exp( *AGE *AGE^ e-05*AGE^ e-08*AGE^4) Denver Age profile: Accounting for number of units and pervious area, housing stock built in 1986 would be simulated as using the most water per premise in Older Implied Calendar Year
73 Calculated Value Plot of Building Age Portion of Regression Equation Annual March September 5 0 Older Implied Calendar Year
Water Use in the Multi family Housing Sector. Jack C. Kiefer, Ph.D. Lisa R. Krentz
 Water Use in the Multi family Housing Sector Jack C. Kiefer, Ph.D. Lisa R. Krentz Presentation Overview Background on WRF 4554 Data sources Water use comparisons Examples of modeling variability in water
Multifamily Market Commentary September 2016
 Multifamily Market Commentary September 2016 Big Impact from Small Multifamily Properties Multifamily rental units can be found in high-rise structures or in garden-style buildings, but there are a number
Guide for Estimating Affordability and Cap Exclusions for 2018 Deliveries
 Guide for Estimating Affordability and Exclusions for 2018 Deliveries This is a reference guide for how the percentage excluded from the scorecard cap for an individual deal is calculated. The Multifamily
Business Creation Index
 Business Creation Index December 2016 National Association of REALTORS Research Department Introduction The new Business Creation Index (BCI) was created to monitor local economic conditions from the perspective
MULTIFAMILY TAX SUBSIDY PROJECT INCOME LIMITS
 MULTIFAMILY TAX SUBSIDY PROJECT INCOME LIMITS This chart is provided as a guide only for the following programs: Low Income Housing Tax Credit (LIHTC) Hula Mae Multi-Family Bonds (HMMF) Rental Housing
U.S. Home Price Insights Report
 U.S. Home Price Insights Report FEATURING CORELOGIC HPI Through September 2015 with Forecasts From October 2015 CoreLogic HPI National Overview With the September release, the CoreLogic HPI posted a gain
Condominium Conversions in. Determinants
 Condominium Conversions in San Francisco: GIS Analysis of Determinants by J. M. Pogodzinski, Economics Department and Urban and Regional Planning Department, San Jose State University Alicia T. Parker,
Download Presentation
 Condominium Conversions in San Francisco: GIS Analysis of Determinants by J. M. Pogodzinski, Economics Department and Urban and Regional Planning Department, San Jose State University Alicia T. Parker,
Black Knight Home Price Index Report: June Transactions U.S. Home Prices Up 0.8 Percent for the Month; Up 5.5 Percent Year-Over-Year
 For more information: Press Release Media contact: Michelle Kersch (904) 854-5043 michelle.kersch@bkfs.com Black Knight Home Price Index Report: June Transactions U.S. Home Prices Up 0.8 Percent for the
I. The Affordability Problem in Boston II. What is Affordable? III.Housing Costs IV.Housing Production V. What Can Public Policy Do? I.
 October 23, 2017 I. The Affordability Problem in Boston II. What is Affordable? III.Housing Costs IV.Housing Production V. What Can Public Policy Do? I. What is it Already Doing? II. Case Studies 2 West
Understanding Whom the LIHTC Program Serves
 Understanding Whom the LIHTC Program Serves Data on Tenants in LIHTC Units as of December 31, 2014 U.S. Department of Housing and Urban Development Office of Policy Development and Research Understanding
Multifamily Market Commentary December 2015 Single-Family Rental Sector Attracting Institutional Investment
 Multifamily Market Commentary December 2015 Single-Family Rental Sector Attracting Institutional Investment Prior to the Great Recession, the cratering of single-family home prices, and declines in the
VERMONT S RENTAL HOUSING AFFORDABILITY GAP CONTINUES TO GROW The Average Vermont Renter Can t Afford a Modest 2-Bedroom Apartment
 vermont affordable housing coalition FOR IMMEDIATE RELEASE: June 13, 2016 CONTACT: Erhard Mahnke, 802.233.2902, erhardm@vtaffordablehousing.org Renée Sarao, 802.660.9484, renee.vahc@gmail.com VERMONT S
Black Knight Home Price Index Report: December Transactions U.S. Home Prices Down 0.1 Percent for the Month; Up 4.5 Percent Year-Over-Year
 Press Release For more information: Media contact: Michelle Kersch 904.854.5043 michelle.kersch@bkfs.com Black Knight Home Price Index Report: December Transactions U.S. Home Prices Down 0.1 Percent for
OVERVIEW OF RECENT/EXPECTED ECONOMIC/HOUSING MARKET CONDITIONS CALIFORNIA SOCIETY OF MUNICIPAL BOND ANALYSTS
 OVERVIEW OF RECENT/EXPECTED ECONOMIC/HOUSING MARKET CONDITIONS CALIFORNIA SOCIETY OF MUNICIPAL BOND ANALYSTS RECENT RETURN TO STRONG ECONOMIC FUNDAMENTALS BUT EXTRAORDINARY FACTORS DRAMATICALLY TRANSFORMING
ECONOMIC PERSPECTIVES
 February 4, 2019 ECONOMIC PERSPECTIVES EXISTING HOME SALES IN FHLBNY AREA HELD UP BETTER THAN THE NATION, REGION IN 2018 Authored by Brian Jones, FHLBNY Financial Economist HIGHLIGHTS:» Existing home sales
Phoenix, Central and Northern Arizona
 Phoenix, Central and Northern Arizona End of Year Housing Report 1-8-354-5664 LongRealty.com 217 End of Year Housing Report SALES & INVENTORY Housing market trends For the overall real estate market in
Your Guide to Real Estate Customs by State
 Your Guide to Real Estate Customs by State First American Title Real Estate Customs by State Yes No State Title Insurance Rates Form of Conveyance State Encumbrance Forms Attorney State or Deed Transfer
Quarterly Indicators. Q Activity Snapshot + 3.5% + 3.1% % Activity Overview New Listings Pending Sales. Closed Sales.
 Quarterly Indicators Q4-2016 Activity Snapshot Most of 2016 offered the same monthly housing market highlights. The number of homes for sale was drastically down in year-over-year comparisons, along with
COMMERCIAL PROPERTY PRICES REMAIN IN SLOWDOWN PATTERN AS MARKET REACTS TO INVESTOR PULLBACK
 CCRSI RELEASE MARCH 2016 (With data through February 2016) COMMERCIAL PROPERTY PRICES REMAIN IN SLOWDOWN PATTERN AS MARKET REACTS TO INVESTOR PULLBACK DESPITE DECLINE IN PROPERTY PRICING, LEASING ACTIVITY
Housing Supply Restrictions Across the United States
 Housing Supply Restrictions Across the United States Relaxed building regulations can help labor flow and local economic growth. RAVEN E. SAKS LABOR MOBILITY IS the dominant mechanism through which local
NCSL TABLE REAL ESTATE TRANSFER TAXES
 NCSL TABLE REAL ESTATE TRANSFER TAXES State Tax Description Rate Alabama Deeds: $0.50/$500 0.10% Mortgages: $0.15/$100 0.15% Alaska None N/A Arizona Flat real estate transfer fee: Flat fee $2.00 Arkansas
Paper for presentation at the 2005 AAEA annual meeting Providence, RI July 24-27, 2005
 NEXT YEAR ON THE U.S. FARMLAND MARKET: AN INFORMATIONAL APPROACH Charles B. Moss, Ashok K. Mishra, And Kenneth Erickson Paper for presentation at the 2005 AAEA annual meeting Providence, RI July 24-27,
REALTOR.COM MARKET OUTLOOK
 REALTOR.COM MARKET OUTLOOK Realtor.com Economics October 2018 AGENDA Economic and housing data and insights from realtor.com National Forecast How well did we predict 2018? U.S. Economic Trends GDP, Jobs
Multifamily Metro Outlook: New York Spring 2018
 Overview The New York City metro is the nation s largest apartment market with 2.2 million rental units, of which 47 percent are rent-stabilized and 1.2 percent rent-controlled. As anticipated, a glut
U.S. Economic and Institutional Apartment Market Overview and Outlook. January 7, 2015
 U.S. Economic and Institutional Apartment Market Overview and Outlook January 7, 2015 Emerging Economic Trends Inflation Adjusted Crude Oil Prices In Alignment with Long-Term Average Price per Barrel (Nov.
Housing Characteristics
 CHAPTER 7 HOUSING The housing component of the comprehensive plan is intended to provide an analysis of housing conditions and need. This component contains a discussion of McCall s 1990 housing inventory
Federal Rental Assistance Provides Affordable Homes for Vulnerable People in All Types of Communities
 820 First Street NE, Suite 510 Washington, DC 20002 Tel: 202-408-1080 Fax: 202-408-1056 center@cbpp.org www.cbpp.org November 9, 2017 Federal Rental Assistance Provides Affordable Homes for Vulnerable
The Subject Section. Chapter 2. Property Address
 Chapter 2 The Subject Section The SUBJECT section of the URAR introduces the appraisal assignment by presenting important information about the subject property. The SUBJECT section provides spaces for
Demographic Multipliers ***** Development Impacts
 ***** #9109985 Sidney Wong, Ph.D., Community Data Analytics Daniel Miles, Ph.D., Econsult Solutions, Inc. National Planning Conference May 7, 2017 New York City Introduction Changes since 2000 Local Variations
City of Lonsdale Section Table of Contents
 City of Lonsdale City of Lonsdale Section Table of Contents Page Introduction Demographic Data Overview Population Estimates and Trends Population Projections Population by Age Household Estimates and
TUCSON and SOUTHERN ARIZONA
 TUCSON and SOUTHERN ARIZONA End of Year Housing Report (52) 818-454 Stephen@TeamWoodall.com 217 End of Year Housing Report SALES & INVENTORY Housing market trends For the overall real estate market in
State Tax Credits for Historic Preservation A State-by-State Summary. States with income tax incentives States that do not tax income
 State Tax Credits for Historic Preservation A State-by-State Summary www.nationaltrust.org policy@nthp.org 202-588-6167 Chart last updated: July 2007 States with income tax incentives States that do not
REQUIRED WITNESSES FOR A MORTGAGE OR DEED OF TRUST
 Document Systems, Inc. 20501 South Avalon Boulevard, Suite B Carson, CA 90746 Phone: 800-649-1362 Fax: 800-564-1362 Website: www.docmagic.com Email: compliance@docmagic.com REQUIRED WITNESSES FOR A MORTGAGE
High-priced homes have a unique place in the
 Livin' Large Texas' Robust Luxury Home Market Joshua G. Roberson December 3, 218 Publication 2217 High-priced homes have a unique place in the overall housing market. Their buyer pool, home characteristics,
Residential Demographic Multipliers
 Rutgers University, Center for Urban Policy Research Residential Demographic Multipliers Estimates of the Occupants of New Housing (Residents, School-Age Children, Public School-Age Children) by State,
Multifamily Market Commentary February 2017
 Multifamily Market Commentary February 2017 Affordable Multifamily Outlook Incremental Improvement Expected in 2017 We expect momentum in the overall multifamily sector to slow in 2017 due to elevated
LPS Home Price Index Report: October Transactions U.S. Home Prices Up 0.3 Percent for the Month; Up 4.3 Percent Year-Over-Year
 Press Release For more information: Media contact: Investor contact: Michelle Kersch Nancy Murphy (904) 854-5043 (904) 854-8640 michelle.kersch@lpsvcs.com nancy.murphy@lpsvcs.com LPS Home Price Index Report:
REALTOR.COM MARKET OUTLOOK
 REALTOR.COM MARKET OUTLOOK Realtor.com Economics May 2018 MOST COMPETITIVE SEASON ON RECORD Key expectations from realtor.com Existing Home Sales Struggle to Break Out Supply: Inventory, Prices, Affordability
Housing Affordability: Local and National Perspectives
 University of Pennsylvania ScholarlyCommons 2018 ADRF Network Research Conference Presentations ADRF Network Research Conference Presentations 11-2018 Housing Affordability: Local and National Perspectives
Myth Busting: The Truth About Multifamily Renters
 Myth Busting: The Truth About Multifamily Renters Multifamily Economics and Market Research With more and more Millennials entering the workforce and forming households, as well as foreclosed homeowners
CBRE INDUSTRIAL & LOGISTICS SPECIAL PROPERTIES GROUP
 CBRE INDUSTRIAL & LOGISTICS SPECIAL PROPERTIES GROUP 48+ REAL ESTATE EXPERTS 36 OFFICES U.S. & CANADA 27 SUCCESSFUL YEARS THE SPECIAL PROPERTIES GROUP provides specialized acquisition, disposition and
2011 Census Bulletin #4 Dwellings & Structure Type in Metro Vancouver
 2011 Census Bulletin #4 Dwellings & Structure Type in Metro Vancouver Regional Dwelling Count According to the 2011 Census figures recently released by Statistics Canada, there were 891,340 occupied private
MULTIFAMILY PAST, PRESENT AND FUTURE RESEARCH. City of Phoenix Water Services Department
 MULTIFAMILY PAST, PRESENT AND FUTURE RESEARCH City of Phoenix Water Services Department Overview 1. Background 2. Research a. Past b. Present c. Future Multifamily Developments Multifamily Unit Size 3,000
(904) (904)
 (904)") Press Release For more information: Media contact: Investor contact: Michelle Kersch Nancy Murphy (904) 854-5043 (904) 854-8640 michelle.kersch@lpsvcs.com nancy.murphy@lpsvcs.com LPS' April HPI Report:
Press Release For more information: Media contact: Investor contact: Michelle Kersch Nancy Murphy (904) 854-5043 (904) 854-8640 michelle.kersch@lpsvcs.com nancy.murphy@lpsvcs.com LPS' April HPI Report:
CBER-LIED Report on Housing Market Conditions
 CBER-LIED Report on Housing Market Conditions CBER and Lied Institute Report Volume 62, 1st, Housing Markets Conditions in 1 st Beginning with this issue of the CBER-LIED Report on Housing Market Conditions,
What is Proper Tax Policy for Smokeless Tobacco Products?
 September 22, 2006 What is Proper Tax Policy for Smokeless Tobacco Products? by Gerald Prante Fiscal Fact No. 65 While there exist a large literature and extensive policy discussion on the issue of cigarette
SPECIAL PROPERTIES GROUP INDUSTRIAL SERVICES
 SPECIAL PROPERTIES GROUP INDUSTRIAL SERVICES CBRE LIMITED INDUSTRIAL SERVICES WWW.CBRE.COM/SPG SPECIAL PROPERTIES GROUP The Special Properties Group provides specialized acquisition, disposition and consulting
Black Knight Home Price Index Report: October Transactions U.S. Home Prices Up 0.1 for the Month; Up 4.5 Percent Year-Over-Year
 Press Release For more information: Media contact: Michelle Kersch 904.854.5043 michelle.kersch@bkfs.com Black Knight Home Price Index Report: October Transactions U.S. Home Prices Up 0.1 for the Month;
CENTRE STREET
 Offering Memorandum 3945-51 CENTRE STREET San Diego, CA 92103 N O N - E N D O R S E M E N T A N D D I S C L A I M E R N O T I C E Non-Endorsements Marcus & Millichap is not affiliated with, sponsored by,
Toronto Economic & Housing Market Outlook 2003
 Toronto Economic & Housing Market Outlook 2003 First Line Mortgage Group Presentation June 2003 Toronto Area Real Estate Moving into Balance Ted Tsiakopoulos BA MA Senior Economist Ontario Business Centre
STATE OF THE MULTIFAMILY MARKET MACRO VIEW
 STATE OF THE MULTIFAMILY MARKET MACRO VIEW JEANETTE I. RICE, CRE AMERICAS HEAD OF MULTIFAMILY RESEARCH APRIL 19, 2018 Westchester/ Fairfield 2 JEANETTE I. RICE STATE OF U.S. MULTIFAMILY MARKET KEY INVESTMENT
National Housing Trends
 National Housing Trends 34% America s Choice of Best Long Term Investment 26% 17% 15% 6% Real Estate Stocks / Mutual Funds Gold Savings Accounts / CDs Bonds Gallup 2018 Total Existing Home Sales in thousands
The U.S. Housing Confidence Index
 March 2018 www.pulsenomics.com 2014-2018 Pulsenomics LLC Pulsenomics, Housing Confidence Survey, and Housing Confidence Index are trademarks of Pulsenomics LLC. HCI Each Housing Confidence Index (HCI)
State Housing Trust Fund Revenues 2017
 Center for Community Change Project www.housingtrustfundproject.org State Revenues 2017 State Revenue Sources Notes Alabama No revenue Arizona State Unclaimed Property Fund; net revenue from AHFA s single
MONROE COUNTY HOUSING NEEDS ASSESSMENT
 MONROE COUNTY HOUSING NEEDS ASSESSMENT PREPARED BY: FLORIDA INTERNATIONAL UNIVERSITY THE METROPOLITAN CENTER FOR: THE PARTNERSHIP FOR COMMUNITY HOUSING INTRODUCTION Overview and Methodology Tasks Labor
Briefing Book. State of the Housing Market Update San Francisco Mayor s Office of Housing and Community Development
 Briefing Book State of the Housing Market Update 2014 San Francisco Mayor s Office of Housing and Community Development August 2014 Table of Contents Project Background 2 Household Income Background and
Your Guide to. Real Estate. Customs by State
 Your Guide to Real Estate Customs by First American Title National Commercial Services Real Estate Customs by Title Insurance Rates Form of Conveyance Encumbrance Forms Attorney or Commitment Deed Transfer
OVERVIEW OF RECENT/EXPECTED ECONOMIC/ HOUSING MARKET CONDITIONS
 OVERVIEW OF RECENT/EXPECTED ECONOMIC/ HOUSING MARKET CONDITIONS STRONG ECONOMIC FUNDAMENTALS *BUT* EXTRAORDINARY SHORT-TERM FACTORS RESULTING IN MAJOR SHIFTS IN TYPES OF HOUSING PRODUCTS AND GEOGRAPHICAL
ALI-ABA Course of Study Commercial Lending and Banking Law January 29-31, 2009 Scottsdale, Arizona
 263 ALI-ABA Course of Study Commercial Lending and Banking Law--2009 January 29-31, 2009 Scottsdale, Arizona Legal and Regulatory Issues in the Creation, Perfection, and Enforcement of Security Interests
Foreclosures Copyright 2014 Rogue Investor
 Foreclosures www.rogueinvestor.com Copyright 2014 Rogue Investor Facts about foreclosures! 1.2 million homes are still in the process of foreclosure (January, 2014)! 2009: 1 in 84 homes were in foreclosure
2012 Profile of Home Buyers and Sellers New Jersey Report
 Prepared for: New Jersey Association of REALTORS Prepared by: Research Division December 2012 Table of Contents Introduction... 2 Highlights... 4 Conclusion... 7 Report Prepared by: Jessica Lautz 202-383-1155
Growing Demand for Smaller Industrial Properties
 Growing Demand for Smaller Industrial Properties Moderator: Lew Friedland, Colony Capital Panelists: Rene Circ, CoStar Portfolio Strategy Brian Fiumara, CBRE Andrew Mele, Trammell Crow Company #crec15
The Brookings Institution Metropolitan Policy Program Bruce Katz, Director
 The Brookings Institution Metropolitan Policy Program Bruce Katz, Director Rethinking Local Affordable Housing Strategies Housing Washington 2004 September 21, 2004 Rethinking Affordable Housing Strategies
National Housing Trends
 National Housing Trends 34% America s Choice of Best Long Term Investment 26% 17% 15% 6% Real Estate Stocks / Mutual Funds Gold Savings Accounts / CDs Bonds Gallup 2018 Housing Affordability 197 Index
PROPERTY VALUE IMPACT STUDY PROPOSED SOLAR FARM KANE COUNTY, IL
 PROPERTY VALUE IMPACT STUDY PROPOSED SOLAR FARM KANE COUNTY, IL Patricia L. McGarr, MAI, CRE, FRICS Andrew Lines, MAI December 2018 CohnReznick LLP Licenses and Accreditations Member of the Appraisal Institute
Volume Title: Well Worth Saving: How the New Deal Safeguarded Home Ownership
 This PDF is a selection from a published volume from the National Bureau of Economic Research Volume Title: Well Worth Saving: How the New Deal Safeguarded Home Ownership Volume Author/Editor: Price V.
Market Trends and Outlook
 Residential Remodeling Market Trends and Outlook Kermit Baker Remodeling Futures Conference April 3, 2012 Remodeling Market Overview 1. Home improvement spending totaled an estimated $290 billion last
OBSERVATION. TD Economics IS THE AMERICAN HOUSING REBOUND SUSTAINABLE?
 OBSERVATION TD Economics IS THE AMERICAN HOUSING REBOUND SUSTAINABLE? Highlights 2012 was a very good year for the U.S. housing market. Home prices were up almost 8% and housing starts by close to 30%.
Appendix 1: Gisborne District Quarterly Market Indicators Report April National Policy Statement on Urban Development Capacity
 Appendix 1: Gisborne District Quarterly Market Indicators Report April 2018 National Policy Statement on Urban Development Capacity Quarterly Market Indicators Report April 2018 1 Executive Summary This
Housing Issues Report Shoreline Towers Inc. Proposal 2313 & 2323 Lake Shore Boulevard West. Prepared by PMG Planning Consultants November 18, 2014
 Housing Issues Report Shoreline Towers Inc. Proposal 2313 & 2323 Lake Shore Boulevard West Prepared by PMG Planning Consultants November 18, 2014 PMG Planning Consultants Toronto, Canada M6A 1Y7 Tel. (416)
Kitchener-Cambridge-Waterloo and Guelph CMAs
 H o u s i n g M a r k e t I n f o r m a t i o n Housing Now Kitchener-Cambridge-Waterloo and Guelph CMAs C a n a d a M o r t g a g e a n d H o u s i n g C o r p o r a t i o n Date Released: Kitchener-Cambridge-Waterloo
MULTIFAMILY APARTMENT MARKETS IN THE WEST: METRO AREA APARTMENT CYCLES AND THEIR TRENDS MANOVA TEST:
 MULTIFAMILY APARTMENT MARKETS IN THE WEST: METRO AREA APARTMENT CYCLES AND THEIR TRENDS MANOVA TEST: CONSTRAINED AND UNCONSTRAINED MARKETS STRUCTURAL EFFECTIVE RENTS AND OCCUPANCY RATES Written by Lawrence
 More details >>> HERE
 A STUDY OF THE DISTRICT OF COLUMBIA S APARTMENT RENTAL MARKET 2000 TO 2015: THE ROLE OF MILLENNIALS
 A STUDY OF THE DISTRICT OF COLUMBIA S APARTMENT RENTAL MARKET 2000 TO 2015: THE ROLE OF MILLENNIALS Fahad Fahimullah, Yi Geng, & Daniel Muhammad Office of Revenue Analysis District of Columbia Government
2018 Housing Market Outlook. Central Coast Realty Group Business Symposium February 22, 2018 Oscar Wei Senior Economist
 2018 Housing Market Outlook Central Coast Realty Group Business Symposium February 22, 2018 Oscar Wei Senior Economist Overview Economic Update California Housing Market Outlook Regional Housing Market
TRACKING AND EXPLAINING NEIGHBORHOOD SOCIO-ECONOMIC CHANGE IN U.S. METROPOLITAN AREAS BETWEEN 1990 AND 2010, WITH SPECIAL ATTENTION TO GENTRIFICATION
 TRACKING AND EXPLAINING NEIGHBORHOOD SOCIO-ECONOMIC CHANGE IN U.S. METROPOLITAN AREAS BETWEEN 1990 AND 2010, WITH SPECIAL ATTENTION TO GENTRIFICATION John D. Landis, University of Pennsylvania Federal
SJC Comprehensive Plan Update Housing Needs Assessment Briefing. County Council: October 16, 2017 Planning Commission: October 20, 2017
 SJC Comprehensive Plan Update 2036 Housing Needs Assessment Briefing County Council: October 16, 2017 Planning Commission: October 20, 2017 Overview GMA Housing Element Background Demographics Employment
Black Knight Home Price Index Report: December Transactions U.S. Home Prices Up 0.1 Percent for the Month; Up 8.4 Percent Year-Over-Year
 Press Release For more information: Michelle Kersch Black Knight Financial Services 904.854.5043 michelle.kersch@bkfs.com Black Knight Home Price Index Report: December Transactions U.S. Home Prices Up
2015 Housing Report. kelowna.ca. April Water Street Kelowna, BC V1Y 1J4 TEL FAX
 2015 Housing Report April 2016 1435 Water Street Kelowna, BC V1Y 1J4 TEL 250 469-8610 FAX 250 862-3349 ask@kelowna.ca kelowna.ca TABLE OF CONTENTS Introduction... 1 Housing Starts... 1 Ownership Housing
(904) (904)
 (904)") Press Release For more information: Media contact: Investor contact: Michelle Kersch Nancy Murphy (904) 854-5043 (904) 854-8640 michelle.kersch@lpsvcs.com nancy.murphy@lpsvcs.com LPS Home Price Index Report:
Press Release For more information: Media contact: Investor contact: Michelle Kersch Nancy Murphy (904) 854-5043 (904) 854-8640 michelle.kersch@lpsvcs.com nancy.murphy@lpsvcs.com LPS Home Price Index Report:
6. Review of Property Value Impacts at Rapid Transit Stations and Lines
 6. Review of Property Value Impacts at Rapid Transit Stations and Lines 6.0 Review of Property Value Impacts at Rapid Transit Station April 3, 2001 RICHMOND/AIRPORT VANCOUVER RAPID TRANSIT PROJECT Technical
Morningside Heights Harlem. Peter Comitini Senior VP Associate Broker The Corcoran Group
 Sutton Area TriBeCa Upper East Side Upper West Side Washington Heights West Village The Corcoran Report Battery Park City Beekman Carnegie Hill Central Park South Chelsea Flatiron Clinton East Harlem East
Goomzee Corporation Fall MLS Platforms. America s MLS Platform Vendors & Market Distribution. Goomzee Research
 Fall 2009 MLS Platforms America s MLS Platform Vendors & Market Distribution Goomzee s MLS Vendor Market Research Over 500 MLS organizations were polled in this research report. This was initially an internal
City Housing Trust Fund Revenues 2018
 City Revenues 2018 Project Center for Community Change www.housingtrustfundproject.org City Revenue Sources Notes Juneau, Alaska General and State Capital Budget Tucson, Arizona MF rental conversion fee;
Document under Separate Cover Refer to LPS State of Housing
 Document under Separate Cover Refer to LPS5-17 216 State of Housing Contents Housing in Halton 1 Overview The Housing Continuum Halton s Housing Model 3 216 Income & Housing Costs 216 Indicator of Housing
Local Board/Association Presidents, Executive Officers, and NYSAR Regional Vice Presidents
 Memo To: Local Board/Association Presidents, Executive Officers, and NYSAR Regional Vice Presidents From: NYSAR President Christine CJ DelVecchio Date: 5/23/18 Re: April 2018 Housing Market Reports The
The Scope and Use of Local Parcel Tax in California: New Findings from a New Database
 The Scope and Use of Local Parcel Tax in California: New Findings from a New Database Soomi Lee University of La Verne Slee4@laverne.edu 111 th National Tax Association Meeting November 15, 2018 New Orleans,
New affordable housing production hits record low in 2014
 1 Falling Further Behind: Housing Production in the Twin Cities Region December 2015 Key findings Only a small percentage of added housing units were affordable to households with low and moderate incomes.
ANALYSIS OF WATER USE PATTERNS IN MULTI- FAMILY RESIDENCES FINAL REPORT
 ANALYSIS OF WATER USE PATTERNS IN MULTI- FAMILY RESIDENCES FINAL REPORT OCTOBER 2008 Prepared for; Irvine Ranch Water District 15600 Sand Canyon Ave PO Box 57000 Irvine, CA 92619-7000 Prepared by: William
No Survey Required w/ Survey. Affidavit. Affidavit. Affidavit
 STATE Purchase Residential Refinance Residential Additional Information Survey Required: Survey Required: Alabama AL No survey required w/ Survey w/survey Alaska AK Yes Survey Required Survey required
Positioned for Performance. j u n e Fine Arts Building Berkeley, CA
 Positioned for Performance j u n e 2009 Fine Arts Building Berkeley, CA Trump Place New York, NY 180 Riverside Equity Residential has a portfolio of high-quality assets focused in high-growth markets where
Pennsylvania Tax Credit Rental Housing Survey
 2012 Pennsylvania Tax Credit Rental Housing Survey 155 East Columbus Street Suite 220 Pickerington, OH 43147 Bowen National Research conducted a statewide survey of approximately 65% of Tax Credit rental
Fannie Mae Affordable Lender Meeting
 Fannie Mae Affordable Lender Meeting MAH Madness November 13, 2017 2017 Fannie Mae. Trademarks of Fannie Mae. Millions Our Stat Sheet Team Name: Multifamily Affordable Housing (MAH) $5,000 $4,500 $4,000
1.0 % 0.7 % 0.7 % 0.0 % 1,072. RENTAL MARKET REPORT Victoria CMA $850 $988. Date Released: The overall vacancy rate *...
 HOUSING MARKET INFORMATION RENTAL MARKET REPORT C A N A D A M O R T G A G E A N D H O U S I N G C O R P O R A T I O N Date Released: 2017 The overall vacancy rate *... INCREASED to 0.7 % Below CMA Similar
REAL ESTATE MARKET OVERVIEW 1 st Half of 2015
 REAL ESTATE MARKET OVERVIEW 1 st Half of 2015 With Comparisons to the 2 nd Half of 2014 September 4, 2015 Prepared for: First Bank of Wyoming Prepared by: Ken Markert, AICP MMI Planning 2319 Davidson Ave.
2016 Census Bulletin Changing Composition of the Housing Stock
 Metro Vancouver s Role Every five years, the Census of Canada provides benchmark data that is instrumental in analyzing and evaluating local government planning policies and services. Representing member
Annual Report on the New York State Market FOR RESIDENTIAL REAL ESTATE ACTIVITY IN THE STATE OF NEW YORK
 Annual Report on the New York State Market FOR RESIDENTIAL REAL ESTATE ACTIVITY IN THE STATE OF NEW YORK FOR RESIDENTIAL REAL ESTATE ACTIVITY IN THE STATE OF NEW YORK While the 2017 housing market was
Attachment 3. Guelph s Housing Statistical Profile
 Attachment 3 Guelph s Housing Statistical Profile Table of Contents 1. Population...1 1.1 Current Population (26)...1 1.2 Comparative Growth, Guelph and Ontario (21-26)...1 1.3 Total Household Growth (21
Research in Brief. August Rent Control Changes in California Posing Significant Uncertainty. ARA Research and Strategy. Research in Brief 1
 ARA Research and Strategy Research in Brief Authored By: Stanley L. Iezman Chairman & CEO siezman@aracapital.com Christopher Macke Managing Director, Research & Strategy cmacke@aracapital.com Maximilian