SJC Comprehensive Plan Update Housing Needs Assessment Briefing. County Council: October 16, 2017 Planning Commission: October 20, 2017
|
|
|
- Denis Roland Morris
- 5 years ago
- Views:
Transcription
1 SJC Comprehensive Plan Update 2036 Housing Needs Assessment Briefing County Council: October 16, 2017 Planning Commission: October 20, 2017

2 Overview GMA Housing Element Background Demographics Employment / Income / Affordability Housing Stock and Permit Trends Housing Need Estimates Questions and Comments
3 Housing Social Well- Being Quality of Life Housing Element Economy Growth Management Act Housing Element To help ensure the vitality and character of neighborhoods, Encourage the availability of affordable housing to all, Promote a variety of residential densities and housing types, and Encourage preservation of the existing housing stock.
4 GMA Update Requirements Mandatory Housing Element requirements: Inventory and analyze existing and projected housing needs; Determine the number of units necessary for projected growth; Include goals, policies, and objectives for housing preservation, improvement, and development; Identify sufficient land for housing; and Provide for the existing and projected needs of all economic segments.
5 Continuous Public Participation: Refined preliminary August draft Incorporates public comments on first draft Refine draft after Council / Planning Commission Foundation for housing goals, policies and strategic actions Uses best available data: Housing Needs Assessment U.S. Census, American Community Survey, Washington Regional Economic Analysis Project, Office of Financial Management (OFM), U.S. Department of Housing and Urban Development, Runstad Center for Real Estate Studies, and 2015 Washington State Housing Needs Assessment.

6 Demographics, Employment and Income Population Age Homeless Employment by Industry Income / Wages / Affordability
7 SJC Selected Population Projection: Based on its Proportionate Share of the State Projection Year OFM Medium SJC Population Growth Rate SJC Proportionate Share Washington State Population (OFM Medium Projection) , % 0.23% 7,183, , % 0.23% 7,411, , % 0.23% 7,793, , % 0.23% 8,154, , % 0.23% 8,483, , % 0.23% 8,546,278

8 Older, Aging Population Aging population; Less year olds than State Percent 20 to 40 year olds State: 28% County: 16% Percent Over the age 50 State: 34% County: 58%
9 San Juan County Point in Time Homeless Count, The 2017 Point in Time Count recorded the highest number of homeless or at risk since the inception of the count. Many lived in substandard structures Individuals Considered Homeless Individuals Considered at Risk of Homelessness Total
10 SJC Covered Employment Classified by Industry, 2016 and Industry Average Annual Wage Most common jobs are some of the lowest paid Professional and technical services $56,141 Utilities $75,633 Other $37,355 Accommodation and food services $22,824 Accommodation, Food Services and Retail Trade make up one third of jobs Average pay between $23,000 and $31,000 a year Manufacturing $39,737 Arts, entertainment, and recreation $19,296 Educational services $36,207 Other services, except public administration $28,062 GOVERNMENT $45,724 Health care and social assistance $30,584 Construction $38,062 Retail trade $30,981

11 2015 Per Capita Income / 2016 Average Annual Wage The County s per capita income of $60,489 was the second highest in the State behind King County and reflects the high number of retirees in the County The average annual wage in 2016 was $33,890. The State average was $60,489. $70,000 $60,000 $50,000 $40,000 $30,000 $20,000 $10,000 State State Less King San Juan $
12 Employment and Income Employment and incomes affect housing affordability Unemployment rates fluctuate up to 3% between January August One third of workers are employed in low wage jobs Employment is heavily affected by tourism and seasonal swings in unemployment United Way estimates that 11% of the population lives below the Federal Poverty Limit and another 22% lives above this limit but does not earn enough to afford basic households needs
13 Income and Housing Affordability San Juan County Code Occupants pay no more than 30% of gross monthly income for total housing costs, including property taxes, insurance and monthly utilities, excluding telephone (owners and renters) Also affordable housing refers to housing serving as the primary residence for very low-, low-, moderate- and middle-income households as defined by the U.S. Dept. of Housing and Urban Development (HUD)
14 HUD Area Median Family Income (AMFI) Limit Guidelines, 2017 The County s Area Median Family Income as defined by HUD is $67,600. Median 2017 Income Limit BASE Area Income Category person persons persons persons persons persons San Juan Extremely Low 30% 14,250 16,250 20,420 24,600 28,780 32,960 County $67,600 Very Low 50% 23,700 27,050 30,450 33,800 36,550 39,250 Low 80% 37,900 43,300 48,700 54,100 58,450 62,800 Moderate 95% 44,950 51,400 57,800 64,220 69,350 74,500 Middle 120% 56,800 64,900 73,000 81,120 87,600 94,100 Low Upper 150% 71,000 81,100 91, , , ,600 Of the households in San Juan County, nearly 40% have income that is considered either low, very low or extremely low according to HUD s guidelines.
15 Household Income Distribution (AFMI) HAMFI Most common: Home owners making more than 100% AMFI, Home owners making between 50 to 80% AMFI, and Renters making above 100 percent AMFI. Renters making less than 30% of the AMFI are the second most common renter household. Owner Renter Total % 2036 Projected Household Income <= 30% % 1,031 Household Income >30% to <=50% % 1,050 Household Income >50% to <=80% , % 1,644 Household Income >80% to <=100% % 1,006 Household Income >100% 3, , % 4,789 Total 5,480 2,135 7,615 9,521 With the same household income distribution, 2,083 households are projected to be below 50% of the AMI by 2036 with 3,728 households categorized as either low income or below.

16 Cost-Burdened Households Owner Occupied 37% in the $50,000 to $74,999 income bracket 78% having less than $20,000 (extremely low income)

17 Cost Burdened Household Trends From , the % of cost-burdened households increased in nearly all income brackets Lack of affordable housing options affects nearly every income bracket More common for middle and moderateincome households to become cost-burdened by housing In 2015, there were 3,100 cost-burdened households 3,713 cost-burdened households are projected by 2036

18 Affordable Home Price Based on a Household s Annual Income *Assumes 25% of gross income threshold, 30-year fixed rate mortgage, 5% down, and 4.5% interest

19 Rental Housing Units by Gross Rent, One-quarter of the rental stock has a gross rent of $1,250 or more/month 13% have no cash rent (4% State average.) May be ADUs on properties where the tenants labor in lieu of paying rent
20 Another Look: Housing Affordability Index (HAI) Measures the ability of a middleincome family to make mortgage payments on a median price home Based on a ratio of income to the minimum outlay needed to qualify median priced home mortgage An index of 100 = balance between a family s ability to pay and the cost. Area Median Resale Price Q ($) HAI First- time Home Buyer HAI County $453, State $324, Higher indexes = more affordable Lower indexes = less affordable
21 Housing Affordability Index (HAI), SJC HAI was 79.8, a full 44.5 points lower than the State s (1 st Q 2017) Least affordable County in State First time buyers disadvantaged because of the down payment needed for an average price home Since 2008, there is a correlation with the State s housing market as a whole. San Juan County WA State
22 Affordability Gap of nearly $170,000 between an affordable house for those making the Area Median Income (AMI) and the median resale price of a home. Only 18% percent of houses in the County are valued at a price that would be considered affordable to the 46% of households making $50,000 or less. For households making $50,000 or less, there is one affordable rental unit for every 2.7 households.

23 Housing Inventory
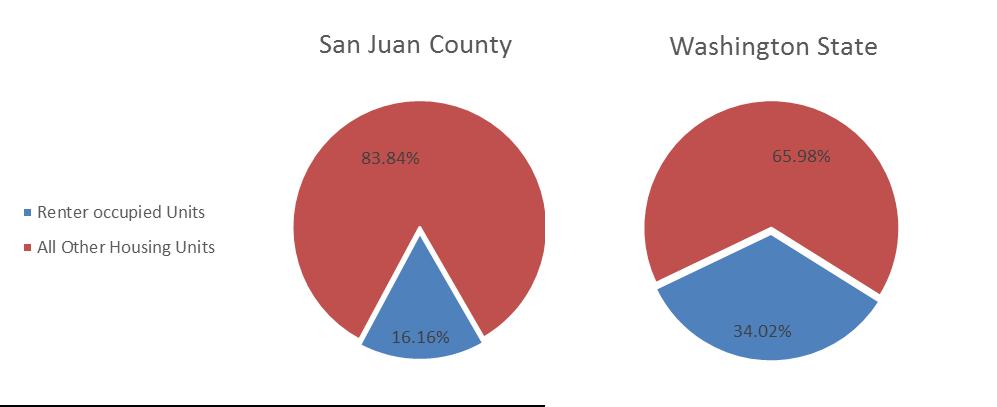
24 Housing Inventory 3,561 new housing units were created between (356 a year) 56% built for or converted to seasonal, recreational or occasional (21 per year) Vacant units increased 9.1% The majority of vacant units are used for seasonal, recreational or occasional use Units were converted from Owner Occupied to Vacant at roughly 6% Total housing units Owner occupied Renter occupied Vacant housing units Percentage of Total Owner occupied Renter occupied Vacant housing units Vacant Housing Unit by Type 2000 Census 2010 Census Change from ACS 9,752 13, ,619 4,754 5, ,507 1,712 2, ,201 3,286 5, , % 40.26% -8.49% 40.44% 17.56% 16.92% -0.63% 16.16% 33.70% 42.82% +9.12% 43.40% For seasonal, recreational, or occasional use 2,776 4, ,808 For sale only For rent Rented or sold, not occupied For migrant workers Other vacant
25 Housing Inventory by Island, 2010 Island / Area Total Units % of Total Vacant Units % of Total Rental Units % of Total San Juan County 13,313 5,700 2,253 Lopez Island Orcas Island San Juan Island 3, , % % 4, , % % 5, , % 1, % Friday Harbor 1, % % Unincorporated San Juan Island 4, , % %
26 Age of Housing Stock and Substandard Housing Increase from 1.7% to 3.2% in occupied units lacking complete plumbing facilities (2010 to 2015). State steady at 0.5% Family Resource Centers indicate that the number of families living in substandard housing with poor conditions such as trailers, RVs or tents is increasing The largest percentage of respondents to the 2017 Homeless Count were those living in substandard structures Primarily constructed after the 1970s
27 Number of Housing Permits Housing Types and Housing Permits Construction slowed over the past decade In 2015, 84% of structures were 1- unit detached, 63% statewide Only 3.4% of structures consist of five or more units, 19.5% statewide New multi-family projects almost entirely ceased between Lack of multi-family housing units Total San Juan County Housing Permits Multi-Family Unit Permits Lack of diversity in housing structures
28 New Residents to New Housing Units, ,500 Between the ratio of new housing units created to new residents was over 2 to 1 4,000 3,500 3,000 2,500 2,197 4,042 3,677 3,561 Despite having 13,619 housing units in 2016 for a population 16,314, housing availability is an issue 2,000 1,500 1, , New Residents New Housing Units
29 Occupancy
30 Housing Units by Occupancy Type, % of the housing stock are Vacation Rental (VR) units VR units have grown modestly over the past 10 years New dwelling unit permits have steady declined Not a large jump in the total number of VR units, but they are becoming a larger share of the housing stock.
31 Vacation Rental Permits Compared to Dwelling Unit Permits From , there were on average 5.5 new dwelling units created for every VR permit issued per year From , there were only 2.18 new dwellings units per VR permit per year.

32 Vacation Rental Permits Declining housing building permits seems to be a greater issue than the increasing number of vacation rentals. Total No. of Vacation Rental Permits Units by Occupancy Type: Proportions since 2000
 = nearly 30% higher than the rest of")
33 Owner-Occupied Housing by Value (1000s), and Median Value (MV) $465,500: ACS year Median Value estimate Median price every year since 2012: 8% in 2014, 6% in 2015 and 6% in 2016 The WA Center for Real Estate Research: $453,100 median resale price ( st Quarter) = nearly 30% higher than the rest of WA
34 Median Home Prices Compared to Median Wages,


35 Housing Need Projections
36 2036 Housing Need Estimates Based solely on the projected population increase of 3,109 by 2036, 1,524 new housing units will be needed. Of those, 809 would be allotted to Urban Growth Areas. Occupancies needed: 1,097 for owner-occupied units and 428 for renter-occupied. From , 56% of all new housing units were built for seasonal, recreational or occasional use. Based on this trend an additional 853 housing units (1,524 X 56%) would be needed to satisfy demand for seasonal or recreational use. A total of 2,377 new housing units might be needed to meet the 2036 housing needs for both permanent residents and seasonal residents. DCD is still assessing the seasonal population statistics which may change the seasonal analysis.
37 2036 Housing Projections Based on Adopted Population Island 2016 Population % Population By Island (2016) 2036 Population By Island % Population By Island (2036) Pop Growth by Island Total # New Housing Units** Housing Units UGA San Juan Island (unincorp.)* 5, % 6, % Friday Harbor 2, % 3, % San Juan Island Subtotal 7, % 9, % 1, Orcas 5, % 6, % 1, Lopez 2, % 2, % Shaw % % Total Ferry Served Islands 15, % 18, % 3,032 1, Total Non-Ferry Served % % Total 16, % 19, % 3,109 1,
38 2036 Housing Projections Needed By Income Distribution Owner Renter Total % 2036 Projected Household Income <= 30% HAMFI % 1,031 Household Income >30% to <=50% HAMFI % 1,050 Household Income >50% to <=80% HAMFI , % 1,644 Household Income >80% to <=100% HAMFI % 1,006 Household Income >100% HAMFI 3, , % 4,789 Total 5,480 2,135 7,615 9,521 To allow affordability, the following are estimated to be needed by 2036: 333 units for those making 50% of the Area Median Income (AMI) or less, 424 units for those making between % of the AMI, and 767 units for those making above 100% of the AMI.

39 Visit the Project Website and Subscribe for Update News Project website: Subscribe to receive future notices: (look for Comprehensive Plan Update under News Flash)
40 Reserve Slides
41 Changes in the October Draft Updated Executive Summary and Introduction Added Key Issues Summary to each section Section headings were re-organized / streamlined Some tables & figures were re-arranged for flow Corrected math error in housing projection Expanded info on the # of housing units needed Added Tables 5-3 and Added Table 5-10 Re-wrote parts of sections and Expanded parts of section 5.4 for clarity Added Figures 5-3, 5-7, 5-8, 5-10 and 5-12 Added excerpt of Census definitions: Vacant Housing Units Expanded section Edited parts of section Edited Figure 5-18 to include State demographics Expanded Added definition of HUD income limits Added excerpt: 2013 Community Conversations Expanded section 5.5 Added excerpt from Lopez Family Resource Center 2017 Affordable Housing Assessment Edited and expanded section Added excerpt from 2016 SJC Strategic Action Plan Added Conclusion Section 5.7 Added Matrix of State, Federal and Private Housing Programs as Table 5-17
 The majority of income is earned")
42 Figure 5-4. Major Components of Total Personal Income, 2015 ($1,000s) The majority of income is earned through property income. Earned Income can be viewed as compensation for labor services


43 Figure 5-5. Percent of Total Personal Income: Earned Income 22% Property Income 16.9% Transfer Payments 5.0% Large increases in Property Income and Transfer Payments share are often associated with counties that experienced an influx of relatively affluent retirees.
4. HOUSEHOLD INCOME AND AFFORDABILITY
 4. HOUSEHOLD INCOME AND AFFORDABILITY The analysis of the Household and Affordability section relied primarily on data from the State Department of Housing and Community Development (HCD), California Tax
Town of Limon Comprehensive Plan CHAPTER 4 HOUSING. Limon Housing Authority Affordable Housing
 CHAPTER 4 HOUSING Limon Housing Authority Affordable Housing 40 VISION Throughout the process to create this comprehensive plan, the community consistently voiced the need for more options in for-sale
Little Haiti Community Needs Assessment: Housing Market Analysis December 2015
 Little Haiti Community Needs Assessment: Housing Market Analysis December 2015 Prepared by: EXECUTIVE SUMMARY Background The Little Haiti Housing Needs Assessment provides a current market perspective
CHAPTER 2: HOUSING. 2.1 Introduction. 2.2 Existing Housing Characteristics
 CHAPTER 2: HOUSING 2.1 Introduction Housing Characteristics are related to the social and economic conditions of a community s residents and are an important element of a comprehensive plan. Information
ECONOMIC CURRENTS. Vol. 5 Issue 2 SOUTH FLORIDA ECONOMIC QUARTERLY. Key Findings, 2 nd Quarter, 2015
 ECONOMIC CURRENTS THE Introduction SOUTH FLORIDA ECONOMIC QUARTERLY Economic Currents provides an overview of the South Florida regional economy. The report presents current employment, economic and real
MONROE COUNTY HOUSING NEEDS ASSESSMENT
 MONROE COUNTY HOUSING NEEDS ASSESSMENT PREPARED BY: FLORIDA INTERNATIONAL UNIVERSITY THE METROPOLITAN CENTER FOR: THE PARTNERSHIP FOR COMMUNITY HOUSING INTRODUCTION Overview and Methodology Tasks Labor
Housing Indicators in Tennessee
 Housing Indicators in l l l By Joe Speer, Megan Morgeson, Bettie Teasley and Ceagus Clark Introduction Looking at general housing-related indicators across the state of, substantial variation emerges but
Housing Characteristics
 CHAPTER 7 HOUSING The housing component of the comprehensive plan is intended to provide an analysis of housing conditions and need. This component contains a discussion of McCall s 1990 housing inventory
Quarterly Housing Market Update
 Quarterly Housing Market Update An Overview New Hampshire s current housing market performance, as well as its overall economy, is slowly improving, with positives such as increasing employment and rising
Rural Housing Challenges in Tennessee: Socio-economic Drivers, Problems and Opportunities
 Rural Housing Challenges in Tennessee: Socio-economic Drivers, Problems and Opportunities Presented at: 19 th Annual Rural Development Conference April 28, 2014 Hulya Arik, PhD Economist Tennessee Housing
Young-Adult Housing Demand Continues to Slide, But Young Homeowners Experience Vastly Improved Affordability
 Young-Adult Housing Demand Continues to Slide, But Young Homeowners Experience Vastly Improved Affordability September 3, 14 The bad news is that household formation and homeownership among young adults
Housing & Neighborhoods Trends
 Housing & Neighborhoods Trends Where do we stand in 2017 At A Glance: Indicator Trend Comparison to State Financial Housing Burden Tax Burden To Note: In 2017, there were a number of Housing & Neighborhood
REGIONAL. Rental Housing in San Joaquin County
 Lodi 12 EBERHARDT SCHOOL OF BUSINESS Business Forecasting Center in partnership with San Joaquin Council of Governments 99 26 5 205 Tracy 4 Lathrop Stockton 120 Manteca Ripon Escalon REGIONAL analyst april
H o u s i n g N e e d i n E a s t K i n g C o u n t y
 1999 2000 2001 2002 2003 2004 2005 2006 2007 2008 2009 2010 Number of Affordable Units H o u s i n g N e e d i n E a s t K i n g C o u n t y HOUSING AFFORDABILITY Cities planning under the state s Growth
Town of Prescott Valley 2013 Land Use Assumptions
 Town of Prescott Valley 2013 Land Use Assumptions Raftelis Financial Consultants, Inc. November 22, 2013 Table of Contents Purpose of this Report... 1 The Town of Prescott Valley... 2 Summary of Land Use
CHAPTER 7 HOUSING. Housing May
 CHAPTER 7 HOUSING Housing has been identified as an important or very important topic to be discussed within the master plan by 74% of the survey respondents in Shelburne and 65% of the respondents in
HOUSINGSPOTLIGHT. The Shrinking Supply of Affordable Housing
 HOUSINGSPOTLIGHT National Low Income Housing Coalition Volume 2, Issue 1 February 2012 The Shrinking Supply of Affordable Housing One way to measure the affordable housing problem in the U.S. is to compare
Briefing Book. State of the Housing Market Update San Francisco Mayor s Office of Housing and Community Development.
 Briefing Book State of the Housing Market Update 2014 San Francisco Mayor s Office of Housing and Community Development August 2014 Table of Contents Project Background 2 Household Income Background and
Briefing Book. State of the Housing Market Update San Francisco Mayor s Office of Housing and Community Development
 Briefing Book State of the Housing Market Update 2014 San Francisco Mayor s Office of Housing and Community Development August 2014 Table of Contents Project Background 2 Household Income Background and
Residential Real Estate Market Overview: September 2017 Data
 Residential Real Estate Market Overview: September 2017 Data 2017 Mark A. Melikian Chief Valuation Officer mark.melikian@summitvaluations.com 2800 River Road, Suite 460 The following is a market data summary
HOUSING AFFORDABILITY
 HOUSING AFFORDABILITY (RENTAL) 2016 A study for the Perth metropolitan area Research and analysis conducted by: In association with industry experts: And supported by: Contents 1. Introduction...3 2. Executive
ECONOMIC CURRENTS. Vol. 3, Issue 1. THE SOUTH FLORIDA ECONOMIC QUARTERLY Introduction
 ECONOMIC CURRENTS THE SOUTH FLORIDA ECONOMIC QUARTERLY Introduction Economic Currents provides an overview of the South Florida regional economy. The report contains current employment, economic and real
The Impact of Market Rate Vacancy Increases Eleven-Year Report
 The Impact of Market Rate Vacancy Increases Eleven-Year Report January 1, 1999 - December 31, 2009 Santa Monica Rent Control Board April 2010 TABLE OF CONTENTS Summary 1 Vacancy Decontrol s Effects on
Integrating Housing into Regional Planning
 Integrating Housing into Regional Planning Background SCI provides resources to more fully integrate housing and economic vitality into Metro Vision Housing and economic vitality identifies as areas of
October 17, Proposal Due Date: Friday, November 10, 2017 by 4:00 pm
 Request for Proposal (RFP) For Housing Study and Needs Assessment Lamoille County Planning Commission (LCPC) Lamoille Housing Partnership (LHP) Stowe Land Trust (Identified below as The Contracting Partners
Housing Market Update
 Housing Market Update September 2017 EXECUTIVE SUMMARY TIGHT HOUSING MARKET CONTINUES, REFLECTS LOW INVENTORY AND HIGHER PRICES Dean J. Christon, Executive Director September 2017 The trend continues in
APPENDIX A. Market Study Standards and Requirements
 APPENDIX A Market Study Standards and Requirements Section 42(m)(1)(A)(iii) of the IRS Code and Section IV(A)(2) of the 2018 Qualified Allocation Plan (QAP) require market studies for all low-income housing
Housing Needs in Burlington s Downtown & Waterfront Areas
 Housing Needs in s Downtown & Waterfront Areas Researched and written by Vermont Housing Finance Agency for the City of Planning & Zoning Department 10/31/2011 Contents Introduction... 2 Executive Summary...
MONTGOMERY COUNTY RENTAL HOUSING STUDY. NEIGHBORHOOD ASSESSMENT June 2016
 MONTGOMERY COUNTY RENTAL HOUSING STUDY NEIGHBORHOOD ASSESSMENT June 2016 AGENDA Model Neighborhood Presentation Neighborhood Discussion Timeline Discussion Next Steps 2 WORK COMPLETED Socioeconomic Analysis
2015 New York City. Housing Security Profile and Affordable Housing Gap Analysis
 2015 New York City Housing Security Profile and Affordable Housing Gap Analysis 1 Contents: Housing Insecurity in New York City 3 A City of Renters. 6 Where the Housing Insecure Population Lives 16 Housing
Comprehensive Plan York, Maine HOUSING
 HOUSING This chapter is a portion of the Inventory and Analysis section of the York Comprehensive Plan. Its purpose is to provide information about the housing stock in York. The text of this Chapter is
The supply of single-family homes for sale remains
 Oh Give Me a (Single-Family Rental) Home Harold D. Hunt and Clare Losey December, 18 Publication 2218 The supply of single-family homes for sale remains tight in many markets across the United States.
7/14/2016. Needed Housing. Workforce Housing. Planning for Needed Housing June 30, 2016 GOAL 10: HOUSING OAR (10)
") Needed Housing Planning for Needed Housing June 30, 2016 Damon Runberg, Oregon Employment Dept. Jim Long, City of Bend Affordable Housing Mgr. Tom Kemper, Housing Works Executive Director GOAL 10: HOUSING
Needed Housing Planning for Needed Housing June 30, 2016 Damon Runberg, Oregon Employment Dept. Jim Long, City of Bend Affordable Housing Mgr. Tom Kemper, Housing Works Executive Director GOAL 10: HOUSING
Eddy County Affordable Housing Plan Executive Summary July 2015
 1 Eddy County Affordable Housing Plan Executive Summary All of Eddy County is experiencing a serious housing shortage due to an influx of new labor working in the oil and gas fields. During the latest
Metro Atlanta Rental Housing Affordability: How Hot is Too Hot for Low-Income Workers?
 Metro Atlanta Rental Housing Affordability: How Hot is Too Hot for Low-Income Workers? July 2018 Atlanta Regional Commission For more information, contact: cdegiulio@atlantaregional.org Metro Atlanta s
Key Findings from the General Plan Comprehensive Review Trends and Forecasts Report September 2016
 Key Findings from the General Plan Comprehensive Review Trends and Forecasts Report September 2016 Context Requirements of the General Plan The County of Hawai i Planning Director initiated a comprehensive
WELLSVILLE AFFORDABLE HOUSING PLAN
 WELLSVILLE AFFORDABLE HOUSING PLAN 2014 DRAFT 2.2 Wellsville: Affordable Housing Plan 2014 Page 2 DRAFT 2.2 Wellsville: Affordable Housing Plan 2014 Table of Contents Summary of Affordable Housing Conditions...
3 RENTAL HOUSING STOCK
 3 RENTAL HOUSING STOCK The nation s rental housing comes in all structure types, sizes, prices, and locations. But with the recent growth in high-income renter households, most additions to the stock have
Addressing the Impact of Housing for Virginia s Economy
 Addressing the Impact of Housing for Virginia s Economy A REPORT FOR VIRGINIA S HOUSING POLICY ADVISORY COUNCIL NOVEMBER 2017 Appendix Report 2: Housing the Commonwealth's Future Workforce 2014-2024 Jeannette
Ontario Rental Market Study:
 Ontario Rental Market Study: Renovation Investment and the Role of Vacancy Decontrol October 2017 Prepared for the Federation of Rental-housing Providers of Ontario by URBANATION Inc. Page 1 of 11 TABLE
Housing Market Update
 Housing Market Update March 2017 New Hampshire s Housing Market and Challenges Market Overview Dean J. Christon Executive Director, New Hampshire Housing Finance Authority New Hampshire s current housing
The Impact of Market Rate Vacancy Increases Eight-Year Report
 The Impact of Market Rate Vacancy Increases Eight-Year Report January 1, 1999 - December 31, 2006 Santa Monica Rent Control Board March 2007 TABLE OF CONTENTS Summary 1 Units Rented at Market Rates Rates
HOUSING AFFORDABILITY IN MAINE: TAKING STOCK. Henry O. Pollakowski. Housing Affordability Initiative MIT Center for Real Estate
 HOUSING AFFORDABILITY IN MAINE: TAKING STOCK Henry O. Pollakowski Housing Affordability Initiative MIT Center for Real Estate Draft Final Report: March 4, 2009 Contributors: Maurice Dalton, Holly Horrigan,
Town of Washington, New Hampshire Master Plan 2015
 OVERVIEW OF CURRENT SITUATION: Currently the town consists of one zoning district. The Land Use Ordinance allows a single family or duplex home on a four- acre lot or on a previously approved non- conforming
ECONOMIC CURRENTS. Vol. 4, Issue 3. THE Introduction SOUTH FLORIDA ECONOMIC QUARTERLY
 ECONOMIC CURRENTS THE Introduction SOUTH FLORIDA ECONOMIC QUARTERLY Vol. 4, Issue 3 Economic Currents provides an overview of the South Florida regional economy. The report presents current employment,
Modeling Housing Affordability in Corpus Christi, Texas
 Modeling Housing Affordability in Corpus Christi, Texas December 13, 2018 Overview I. Background II. Owner-Occupied Housing Affordability III. Renter-Occupied Housing Affordability IV. Future Housing Needs
Affordable Housing Bonus Program. Public Questions and Answers - #2. January 26, 2016
 Affordable Housing Bonus Program Public Questions and Answers - #2 January 26, 2016 The following questions about the Affordable Housing Bonus Program were submitted by the public to the Planning Department
City of Dothan Affordable Housing Study. Community Presentation November 6 th, 2017
 City of Dothan Affordable Housing Study Community Presentation November 6 th, 2017 Welcome and Introduction Agenda Welcome and Introduction Background Study Goals Process Findings Q & A / Discussion Next
MONTE SERENO HOUSING ELEMENT
 MONTE SERENO 2015-2023 HOUSING ELEMENT PURPOSE OF THE WORKSHOP Understand Housing Element goals and requirements Share critical time lines and actions Solicit your ideas Identify ways for you to be involved
City of Lonsdale Section Table of Contents
 City of Lonsdale City of Lonsdale Section Table of Contents Page Introduction Demographic Data Overview Population Estimates and Trends Population Projections Population by Age Household Estimates and
III. Housing Profile and Analysis
 III. Housing Profile and Analysis 3-1 III. Housing Profile and Analysis A. Housing Types Information on the type of housing available is important to have a clear picture of what Lacey has in its housing
Attachment 3. Guelph s Housing Statistical Profile
 Attachment 3 Guelph s Housing Statistical Profile Table of Contents 1. Population...1 1.1 Current Population (26)...1 1.2 Comparative Growth, Guelph and Ontario (21-26)...1 1.3 Total Household Growth (21
HOUSING ELEMENT Inventory Analysis
 HOUSING ELEMENT Inventory Analysis 2.100 INVENTORY Age of Housing Stock Table 2.25 shows when Plantation's housing stock was constructed. The latest available data with this kind of breakdown is 2010.
The Metropolitan Transportation Plan/Sustainable Communities Strategy and the SACOG Region s Housing Market. July 2013
 The Metropolitan Transportation Plan/Sustainable Communities Strategy and the SACOG Region s Housing Market July 2013 Draft Housing Report Purpose Provide regional data on: MTP/SCS projected growth/housing
Housing Study & Needs Assessment
 Housing Study & Needs Assessment Phase II Public Engagement Presentation #2 Winston-Salem, North Carolina January 25, 2018 MEETING OVERVIEW Welcome & Introductions Purpose & Goals Community Discussions
Downtown Housing Policy
 Downtown Housing Policy Background The Downtown Development Authority (DDA) has requested that city staff and other interested Commissions and Boards assist it in developing a Housing Policy to apply within
RESIDENTIAL MARKET STUDY. for the TOWN OF CHAPEL HILL PREPARED BY DEVELOPMENT CONCEPTS, INC.
 RESIDENTIAL MARKET STUDY for the TOWN OF CHAPEL HILL PREPARED BY DEVELOPMENT CONCEPTS, INC. JANUARY 2010 1 Chapel Hill Housing Trends 2 Housing Demand 3 Housing Affordability i AGENDA just the facts, ma
Research Report #6-07 LEGISLATIVE REVENUE OFFICE.
 HOUSING AFFORDABILITY IN OREGON Research Report #6-07 LEGISLATIVE REVENUE OFFICE http://www.leg.state.or.us/comm/lro/home.htm STATE OF OREGON LEGISLATIVE REVENUE OFFICE H-197 State Capitol Building Salem,
Key Findings on the Affordability of Rental Housing from New York City s Housing and Vacancy Survey 2008
 Furman Center for real estate & urban policy New York University school of law n wagner school of public service 110 West 3rd Street, Suite 209, New York, NY 10012 n Tel: (212) 998-6713 n www.furmancenter.org
Table of Contents. Title Page # Title Page # List of Tables ii 6.7 Rental Market - Townhome and Apart ment Rents
 RESIDENTIAL MONITORING REPORT 2013 Table of Contents Title Page # Title Page # List of Tables ii 6.7 Rental Market - Townhome and Apart ment Rents 21 List of Figures iii 7.0 Other Housing Demands and Trends
HOUSING ELEMENT TABLE OF CONTENTS INTRODUCTION...HO- 1 BAINBRIDGE ISLAND SNAPSHOT: PEOPLE AND HOUSING.. HO-1
 HOUSING ELEMENT TABLE OF CONTENTS PAGE INTRODUCTION...HO- 1 BAINBRIDGE ISLAND SNAPSHOT: PEOPLE AND HOUSING.. HO-1 GMA GOAL AND REQUIREMENTS FOR HOUSING. HO-1 HOUSING NEEDS..HO-2 HOUSING ELEMENT VISION...HO-3
New affordable housing production hits record low in 2014
 1 Falling Further Behind: Housing Production in the Twin Cities Region December 2015 Key findings Only a small percentage of added housing units were affordable to households with low and moderate incomes.
TABLE OF CONTENTS TABLE OF FIGURES
 PREPARED FOR THE CITY OF BEVERLY HILLS RENT STABILIZATION ANALYSIS DRAFT DATA BRIEF JULY 26, 2018 TABLE OF CONTENTS TABLE OF FIGURES TABLE OF CONTENTS INTRODUCTION... 3 RSO BUILDING STOCK CHARACTERISTICS...
Median Income and Median Home Price
 Homeownership Remains Unaffordable; Rental Affordability Showing Signs of Improvement Richard E. Taylor, Research Manager at MaineHousing MaineHousing has released the 217 Maine Homeownership and Rental
Washington Market Highlights: Third Quarter 2018
 Washington State s Housing Market 3rd Quarter 2018 Washington Market Highlights: Third Quarter 2018 Existing home sales rose in the third quarter by 0.1 percent to a seasonally adjusted annual rate of
Queenstown-Lakes Data REINZ SLIDE 1
 Queenstown-Lakes Data REINZ SLIDE 1 OTAGO REGION SCORECARD Net Migration (year to) Unemployment (Q3) Weekly Earnings (Median) House Prices (Median) Sep 16: 1,954 Q3 2016: 3.7% 2016: $1,054 YE Sep 16: $337k
INLAND EMPIRE REGIONAL INTELLIGENCE REPORT. School of Business. April 2018
 INLAND EMPIRE REGIONAL INTELLIGENCE REPORT April 2018 Key economic indicators suggest that the Inland Empire s economy will continue to expand throughout the rest of 2018, building upon its recent growth.
Missing Middle Housing Types Showcasing examples in Springfield, Oregon
 Missing Middle Housing Types Showcasing examples in Springfield, Oregon MissingMiddleHousing.com is powered by Opticos Design Illustration 2015 Opticos Design, Inc. Missing Middle Housing Study Prepared
Carver County AFFORDABLE HOUSING UPDATE
 Carver County AFFORDABLE HOUSING UPDATE July 2017 City of Carver Community Partners Research, Inc. Lake Elmo, MN Executive Summary - Carver Key Findings - 2017 Affordable Housing Study Update Carver has
/'J (Peter Noonan, Rent Stabilization and Housing, Manager)VW
VW") CITY COUNCIL CONSENT CALENDAR OCTOBER 17, 2016 SUBJECT: INITIATED BY: INFORMATION ON PROPERTIES REMOVED FROM THE RENTAL MARKET USING THE ELLIS ACT, SUBSEQUENT NEW CONSTRUCTION, AND AFFORDABLE HOUSING HUMAN
CITY COUNCIL CONSENT CALENDAR OCTOBER 17, 2016 SUBJECT: INITIATED BY: INFORMATION ON PROPERTIES REMOVED FROM THE RENTAL MARKET USING THE ELLIS ACT, SUBSEQUENT NEW CONSTRUCTION, AND AFFORDABLE HOUSING HUMAN
housing future for our a stronger community, region, and state
 housing for our future a stronger community, region, and state Outline Existing conditions Where does Hanover fit in and how does it compare? Working towards solutions Who is MHP? MISSION: Use private
TENNESSEE HOUSING MARKET
 1st Quarter 212 TENNESSEE HOUSING MARKET David A. Penn, Director Business and Economic Research Center Jennings A. Jones College of Business Middle Tennessee State University This quarterly series is supported
4.11 POPULATION AND HOUSING
 4.11 POPULATION AND HOUSING INTRODUCTION This section of the Draft Environmental Report (Draft EIR; DEIR) describes the current population and demographic characteristics and housing and employment conditions
Washington Market Highlights: Fourth Quarter 2018
 Washington State s Housing Market 4th Quarter 2018 Washington Market Highlights: Fourth Quarter 2018 Existing home sales fell in the fourth quarter by 2.7 percent to a seasonally adjusted annual rate of
Chapter 4: Housing and Neighborhoods
 Chapter 4: Housing and Neighborhoods Introduction Medina is a growing community that provides a variety of housing types and neighborhood styles while protecting and enhancing the City s open spaces and
Housing Price Forecasts. Illinois and Chicago PMSA, March 2018
 Housing Price Forecasts Illinois and Chicago PMSA, March 2018 Presented To Illinois Realtors From R E A L Regional Economics Applications Laboratory, Institute of Government and Public Affairs University
Affordably- Priced Housing
 Affordably- Priced Housing Can the next generation afford to live in Chester County? Chester County Planning Commission This slide deck is an annotated version of one presented at the Chesco2020 Affordably-Priced
Washington Market Highlights: Fourth Quarter 2017
 Washington State s Housing Market 4th Quarter 2017 Washington Market Highlights: Fourth Quarter 2017 Existing home sales declined in the fourth quarter by 0.2 percent to a seasonally adjusted annual rate
Ontario Rental Market Study Results: Measuring the Supply Gap / Renovation Investment and the Role of Vacancy Decontrol
 Ontario Rental Market Study Results: Measuring the Supply Gap / Renovation Investment and the Role of Vacancy Decontrol AGENDA Measuring the Supply Gap Estimating Current Rental Demand in Ontario Drivers
Oakland s Housing Equity Roadmap Presentation to Oakland Planning Commission
 Oakland s Housing Equity Roadmap Presentation to Oakland Planning Commission 3.4.15 Goals of the Oakland Housing Equity Roadmap 1. Provide comprehensive policy framework: Provide strategies to address
State of Renters and Their Homes
 State of Renters and Their Homes As rents rose and renters incomes remained stagnant from to, many New Yorkers continued to face heavy rent burdens. In, roughly 30 percent of the city s renter households
HOUSING NEEDS ANALYSIS & ASSESSMENT REQUEST FOR PROPOSALS
 HOUSING NEEDS ANALYSIS & ASSESSMENT REQUEST FOR PROPOSALS I. Introduction Sibley County is located southwest of the seven-county metro. It directly borders Scott, Carver, McLeod, Le Sueur, Renville, and
Welcome to the Bellingham City Council. Town Hall
 Welcome to the Bellingham City Council Town Hall June 13, 2017 Affordable housing and homelessness June 2017 Affordability and homelessness Since 2012 What happened? Next steps Housing prices are growing
Housing Element Amendment. Borough of High Bridge
 Housing Element Amendment Borough of High Bridge Hunterdon County New Jersey September, 2004 Prepared for: The Borough of High Bridge 71 Main Street High Bridge, N.J. 08829 Prepared by: Art Bernard, P.P.
City of New Albany. Analysis of Impediments to Fair Housing Choice Draft. January 16, 2015
 January 16, 2015 City of New Albany Analysis of Impediments to Fair Housing Choice Draft Redevelopment Department 311 Hauss Square, Room 325 New Albany, Indiana 47150 Table of Contents I: Introduction,
4. Parks and Recreation Fee Facility Needs and Cost Estimates Fee Calculation Nexus Findings 24
 TABLE OF CONTENTS CHAPTER PAGE 1. Introduction and Summary of Calculated Fees 1 1.1 Background and Study Objectives 1 1.2 Organization of the Report 2 1.3 Calculated Development Impact Fees 2 2. Fee Methodology
Single Family Sales Maine: Units
 Maine Home Connection 19 Commercial St Portland, Maine 04101 MaineHomeConnection.com Office: (207) 517-3100 Email: Info@MaineHomeConnection.com For the fourth consecutive year, Maine home sales set a new
The rapidly rising price of single-family homes in. Change and Challenges East Austin's Affordable Housing Problem
 Change and Challenges East 's Affordable Housing Problem Harold D. Hunt and Clare Losey March 2, 2017 Publication 2161 The rapidly rising price of single-family homes in East has left homeownership out
ATTACHMENT B DRAFT NON-RESIDENTIAL NEXUS ANALYSIS. Prepared for City of Sonoma. Prepared by: Keyser Marston Associates, Inc.
 ATTACHMENT B DRAFT NON-RESIDENTIAL NEXUS ANALYSIS Prepared for City of Sonoma Prepared by: Keyser Marston Associates, Inc. February 2018 TABLE OF CONTENTS I. INTRODUCTION... 1 Purpose... 1 Analysis Scope...
COUNTY OF SONOMA PERMIT AND RESOURCE MANAGEMENT DEPARTMENT 2550 Ventura Avenue, Santa Rosa, CA (707) FAX (707)
 FAX (707)") COUNTY OF SONOMA PERMIT AND RESOURCE MANAGEMENT DEPARTMENT 2550 Ventura Avenue, Santa Rosa, CA 95403 (707) 565-1900 FAX (707) 565-1103 MEMO Date:, 1:05 p.m. To: Sonoma County Planning Commission From:
COUNTY OF SONOMA PERMIT AND RESOURCE MANAGEMENT DEPARTMENT 2550 Ventura Avenue, Santa Rosa, CA 95403 (707) 565-1900 FAX (707) 565-1103 MEMO Date:, 1:05 p.m. To: Sonoma County Planning Commission From:
ECONOMIC CURRENTS. Vol. 3, Issue 3 SOUTH FLORIDA ECONOMIC QUARTERLY. Introduction
 ECONOMIC CURRENTS THE Introduction SOUTH FLORIDA ECONOMIC QUARTERLY Economic Currents provides an overview of the South Florida regional economy. The report presents current employment, economic and real
Housing Price Forecasts. Illinois and Chicago PMSA, August 2016
 Housing Price Forecasts Illinois and Chicago PMSA, August 2016 Presented To Illinois Association of Realtors From R E A L Regional Economics Applications Laboratory, Institute of Government and Public
Hamilton s Housing Market and Economy
 Hamilton s Housing Market and Economy Growth Indicator Report November 2016 hamilton.govt.nz Contents 3. 4. 5. 6. 7. 7. 8. 9. 10. 11. Introduction New Residential Building Consents New Residential Sections
Document under Separate Cover Refer to LPS State of Housing
 Document under Separate Cover Refer to LPS5-17 216 State of Housing Contents Housing in Halton 1 Overview The Housing Continuum Halton s Housing Model 3 216 Income & Housing Costs 216 Indicator of Housing
November An updated analysis of the overall housing needs of the City of Aberdeen. Prepared by: Community Partners Research, Inc.
 City of Aberdeen HOUSING STUDY UPDATE November 2010 An updated analysis of the overall housing needs of the City of Aberdeen Prepared by: Community Partners Research, Inc. nd 10865 32 Street North Lake
2011 Census Bulletin #4 Dwellings & Structure Type in Metro Vancouver
 2011 Census Bulletin #4 Dwellings & Structure Type in Metro Vancouver Regional Dwelling Count According to the 2011 Census figures recently released by Statistics Canada, there were 891,340 occupied private
M A N H A T T A N 69 THE FURMAN CENTER FOR REAL ESTATE & URBAN POLICY. Financial District Greenwich Village/Soho
 M A N H A T T A N Page Financial District 301 72 Greenwich Village/Soho 302 73 Lower East Side/Chinatown 303 74 Clinton/Chelsea 304 75 69 THE FURMAN CENTER FOR REAL ESTATE & URBAN POLICY Midtown 305 76
A Comparative Analysis of Affordable Housing in Saudi Arabia
 j A Comparative Analysis of Affordable Housing in Saudi Arabia By Dr. Adel S. Al-Dosary Presented To Low Cost Building Systems in Urban Settlement Symposium May 16-19, 2005,Amman, Jordan ١ Outline of Presentation
Housing Affordability in Lexington, Kentucky
 University of Kentucky UKnowledge CBER Research Report Center for Business and Economic Research 6-29-2009 Housing Affordability in Lexington, Kentucky Christopher Jepsen University of Kentucky, chris.jepsen@uky.edu
City of Exeter Housing Element
 D. Housing Stock Characteristics Government Code Section 65583(a) requires an analysis and documentation of household characteristics, including level of payment compared to ability to pay, housing characteristics,