Santa Barbara Ranch TDR Feasibility Analysis VOLUME III - APPENDICES
|
|
|
- Peter Poole
- 5 years ago
- Views:
Transcription
1 Santa Barbara Ranch TDR Feasibility Analysis VOLUME III - APPENDICES
2 Santa Barbara Ranch TDR Feasibility Analysis TECHNICAL APPENDIX A Receiving Site Maps
3
4
5

6
7

8

9

10

11
12 Santa Barbara Ranch TDR Feasibility Analysis TECHNICAL APPENDIX B Preliminary Receiving Site Identification
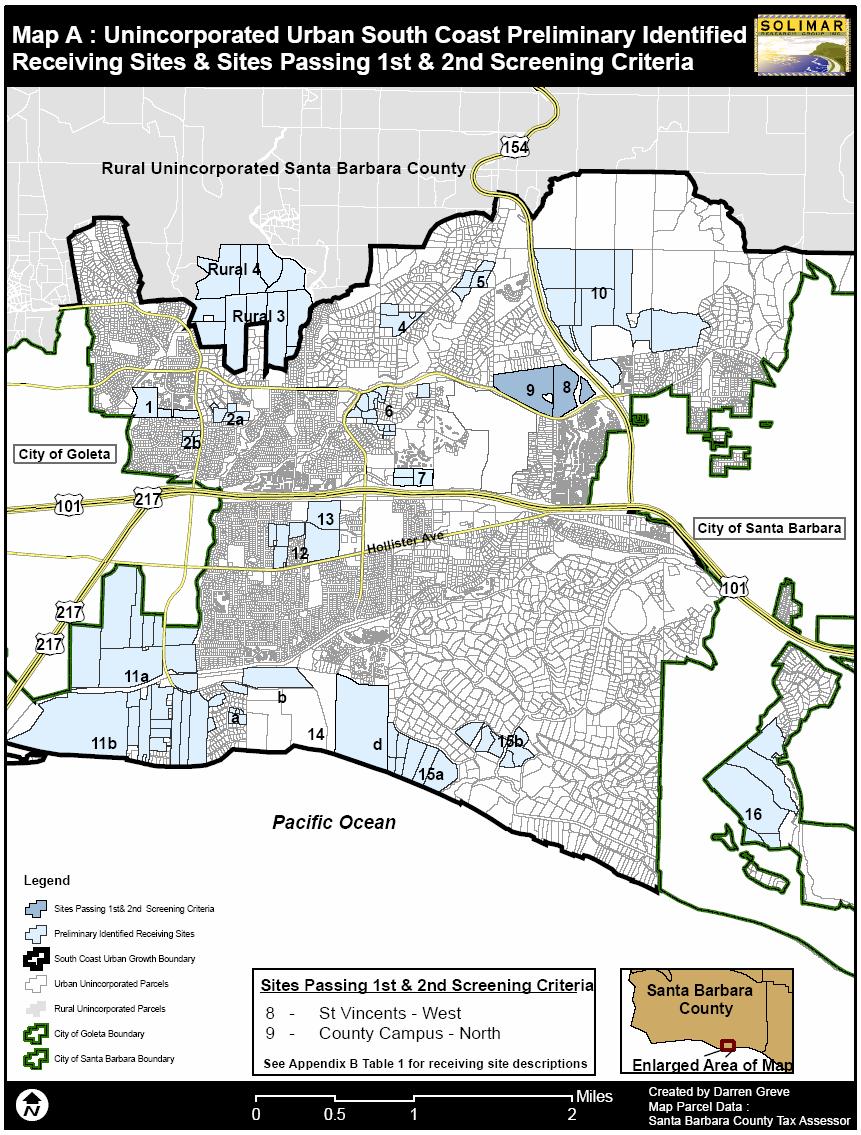
13 Appendix B: PRELIMINARY RECEIVING SITE IDENTIFICATION Potential Receiving Sites in Unincorporated Urban South Coast (see map A) Sites within the existing urban growth boundary of the unincorporated South Coast with receiving site potential are located either north or south of Highway 101. In addition areas exist in Isla Vista as indicated for higher density in the IV Comprehensive Plan, as well sites in and around the Summerland/Montecito areas. All of these potential sites vary significantly in their current zoning, geography and subsequent value. Sites range in location and attributes, ranging from ocean bluffs with prominent ocean views, Santa Ynez mountain foothill sites, agricultural sites, to urban transportation corridor locations. The up-zone potential of these sites varies depending upon surrounding land uses, densities and site topographical constraints. The unincorporated areas of the South Coast have a notorious history of residents un-accepting of infill development, especially at increased densities. Therefore many of these sites, while possessing the economic potential, may have limited political traction as viable receiving sites. Especially noteworthy in this regards in the Patterson Ag block which the community has strongly committed to retaining its agricultural zoning. In addition some of the identified receiving sites are being considered for re-zone for affordable housing. Residents of the areas surrounding these potential affordable sites are averse to the notion of high densities typical of affordable housing and are more amenable to the idea of medium density market rate units that would come with a re-zone as a receiving site. This presents a challenging situation for decision makers in this area of the South Coast - weighing the tradeoffs of providing affordable units with preserving open space. Table 1 Potential Receiving Sites in Urban Unincorporated Urban South Coast (#s correspond to locations on Maps A, C) A. Sites north of 101, from HWY 154 to Goleta City limits Noel Christmas Tree Farm (1) Area 2 (2a,2b) Area 4 (4) Area 5 (5) Area 6 (6) MTD (7) 26 acre Ag I -5 site with a limited Christmas tree farm operation, surrounded by medium density residential. Potential exists for up-zone to 4.6 units/ac. Owner has proposed development to the County in the past indicating a willingness to develop. 2 clusters of parcels with low density residential zoning (1-E-1 and DR 1.8) totaling 20 acres; sites have the potential to up-zone to surrounding medium density. Clustering of parcels with low density residential zoning (1-E-1). 1 unit per acre Clustering of parcels with low density residential zoning (1-E-1); site possesses significant topographical constraints Clustering of parcels with very low density residential zoning (3-E-1). 1 unit/3 acres. 19 acre site zoned AG I-5 with 17 buildable acres near
14 St Vincents west (8) HWY 101. Site has been identified by County in the DRAFT Potential Housing Opportunity A list for rezone for affordable housing. Potential exists for upzone to 4.6 units/ac acre site with low density DR-1 (1unit/ac) zoning in foothill area alongside HWY 154. The Goleta Community Plan Policy LUDS-GV-6 requires all units located on the western most parcel. Site has been identified by County in the DRAFT Potential Housing Opportunity B list for re-zone. Development proposals have been submitted to the County indicating a willingness to develop. Potential exists for up zone to 3.3 units/ac. San Marcos Foothills (10) Large cluster of parcels totaling 377acres. The County recently approved a development proposal from Bermant Development Co. for a total of 15 market rate and 5 affordable units on 50 acres of the site. All though after the fact, an interesting question is how much would the developer be willing to pay to add extra units on this site? Because the site has just completed a lengthy approval process we assume limited potential to increase density beyond the 20 units. County Campus North (9) County owned 37.5 acre parcel zoned REC (0 units/ac) with some County administration buildings. 22 acres of site have been identified buildable in the Draft Potential Housing Opportunity B list for re-zone. Potential exists for up-zone to 3.3 units/ac B. Sites south of HWY 101 South Patterson Ag Block (11a) Public Utilities Parcel (11b) San Marcos Ag Block (12) San Simeon School site (13) Sites Surrounding More Mesa (14 a,b,c,d) Hope Ranch vacant parcels (15 a,b) 313 acre site with Ag zoning; site is currently under intensive agricultural use. Limited political support for re-zone to residential 147 acre bluff parcel located near Goleta beach. Currently used for underground gas storage. Site is currently unavailable for residential uses 51 acre Ag cluster surrounded by residential and commercial uses. Limited political support for re-zone to residential 23 acre low density (DR 3.3) residential site with potential to increase density but limited value due to proximity to HWY 101 and the relatively high baseline zoning Potential sites surround the existing open space bluff of More Mesa to the west, north and east. To the west sites, possess Ag and low density residential zoning. To the north is a County owned parcel with environmental constraints and sites with low density residential zoning. To the East, the owner of More Mesa has building potential on 40 acres at low density residential zoning. All these sites have varying degrees of up-zone potential High value parcels both along the bluffs east of More Mesa and parcels further inland with existing low
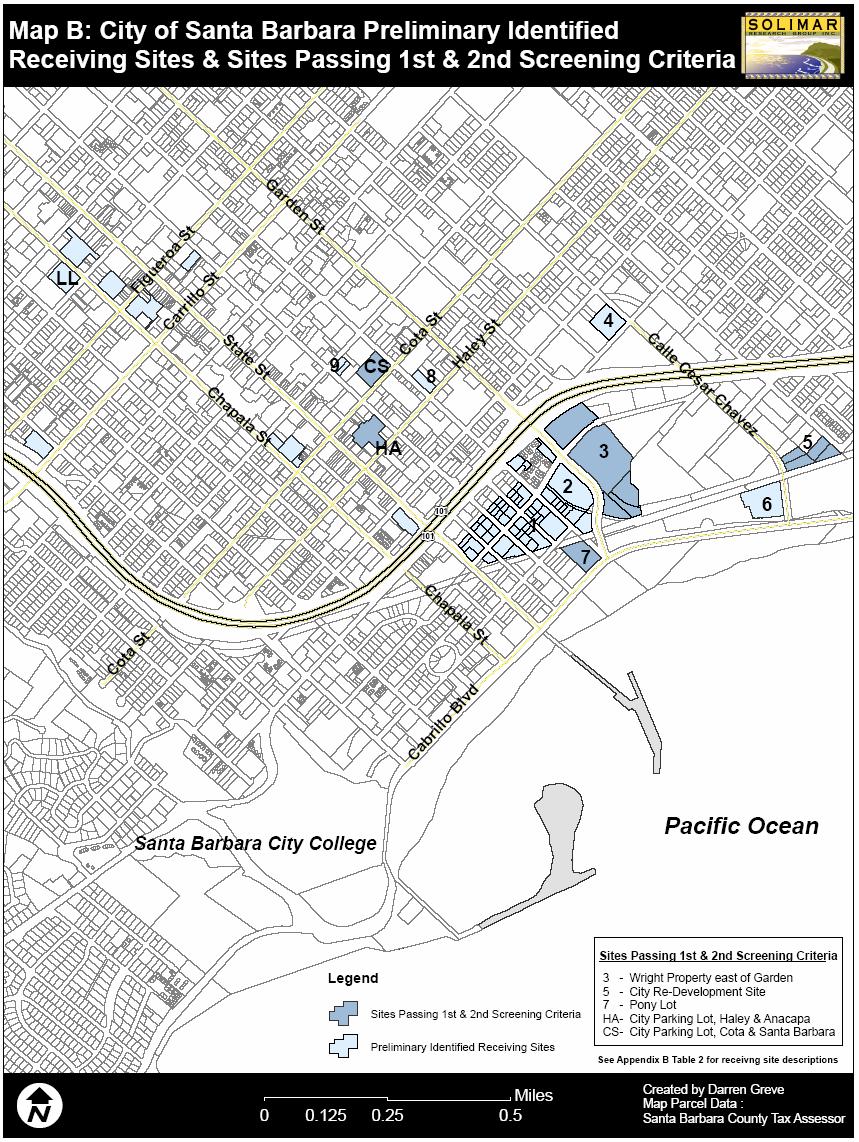
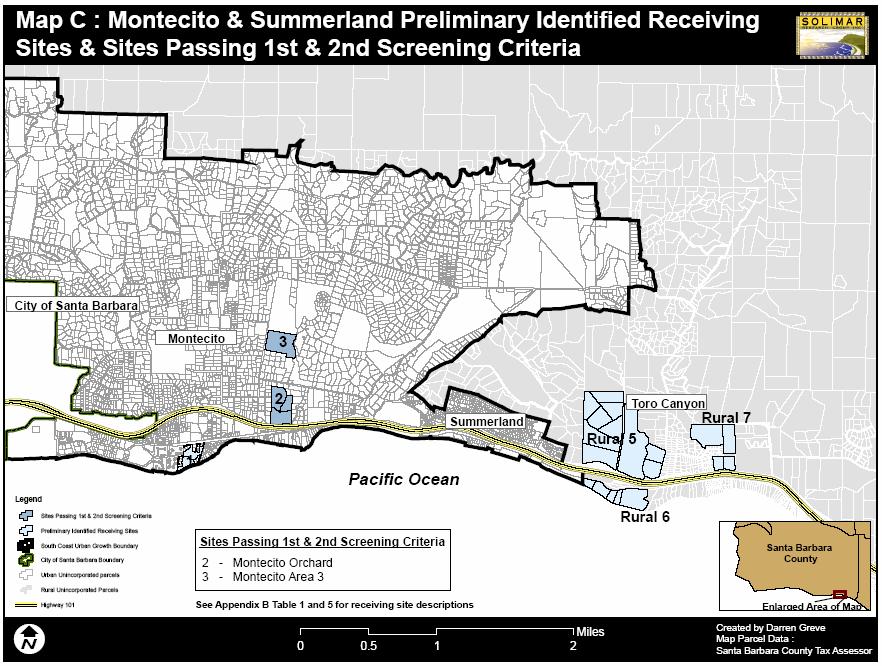
15 density zoning (1 unit/2.5, 3.5). Hope Ranch CC&Rs have minimum lot size requirements of 1 unit/1.5 acres. Potential may exist to up-zone these parcels to the 1.5 ac zoning. Las Positas (16) 130 acre cluster with low density RR-20 zoning, but significant hillside constraints. Up-zone potential is significantly limited C. Isla Vista Alternative 6 of the IV Draft Master Plan calls for further density increase beyond the 30 units/acre to 60 units/ac in certain areas along El Collegio rd. Thus moving build out from 1500 to 3000 units. IV represents a unique opportunity as residents are generally not opposed to higher densities D. Montecito/Summerland (see Map C) Western bluffs (1) 10 acre site with PRD zoning and no minimum lot size Montecito Orchard (2) 30 acre site with AG I-5 zoning adjacent to Hwy 101 in Montecito. Site is surrounded by low to medium density residential housing. Potential exists for up zone to 1.8 units/acre. Montecito Area 3 (3) acre parcel of very low density (1unit/3 acre) zoning. Parcel is surrounded by low /medium density residential housing. Potential exists for up-zone to1.8 units/acre. Potential Receiving Sites in the City of Santa Barbara (see map B) The City of Santa Barbara possesses scarce amounts of land available for future development; much of the City is built out and the little existing vacant land is highly constrained. A promising option available to the City for increasing its housing stock lies in re-zoning or up-zoning areas with industrial zoning to accommodate higher density mixed use or townhome style development which is currently in high demand in the downtown areas. In addition the City owned public parking lots offer some political traction to serve as receiving sites for development credits from the Gaviota Coast. On these sites the City may consider high density residential developments only if there is complete replacement of all parking lots. Table 2 Potential Receiving Sites in the City of Santa Barbara (#s correspond to location on Map B) Funk Zone (1) A 4 block square area bordered by Garden/ State and Cabrillo /Hwy 101 near the waterfront in downtown Santa Barbara. Area has current zoning of HRC and OC zoning with a 30% commercial requirement. The HRC and OC zoning allows for R-3 densities. Because of this allowed density the Funk Zone possesses limited up-zone potential Wright Property a. west of Garden St. (2) 4.5 acre site located downtown adjacent to funk zone. Site is used for industrial purposes but has R-3 zoning.
16 Site has a current development proposal for 160 units. Subsequently site has limited capacity as viable receiving site. b. east of Garden St. (3) 13.2 acre site located downtown near funk zone. Site has mixture of industrial and commercial zoning (HRC -2 and M-1). The potential exists to re-zone parts of the site to high density mixed use town homes at 20 units/acre similar to the Yanonali Townhomes on West side of Garden st..site lies within the coastal zone City Housing Authority (4) Vacant 1.8 acre site owned by the City Housing Authority; City is processing a development proposal for 90 affordable units on the site. Because of this we assume minimal potential for increased density Re-Development Agency site (5) These sites total 6.5 acres near the downtown waterfront. Many of the parcels are vacant. The City Re- Development Agency owns 2.5 acres, with the remainder in private ownership. Potential exists to rezone the sites from the current M-1 industrial zoning to high density mixed use Vacant Lot (6) 3 acre vacant parcel across from the Fess Parker Hotel. Lot has M-1 industrial zoning and would require an LCP amendment to allow residential development south of the rail road tracks. Ortega industrial (8).49 acre parcel with industrial CM zoning. CM zoning allows for high density R-3 residential uses which significantly limits up zone potential. Haley Industrial (9).61 acre parcel with industrial CM zoning. CM zoning allows for high density R-3 residential uses which significantly limits up zone potential. Las Positas School site (10) 9 acre vacant site owned by the School District with 1 unit/3 ac zoning, but School district is considering selling the parcel for residential development. City Owned Parking Lots City Parking Lot Louise Lowry (LL).81 acre parking lot. City conducted a study in 2003 to assess redevelopment of site for affordable housing project that maintains the existing # of public parking lots on site. Potential exists for up zone to 50 units/acre. Site is located within coastal zone City Parking Lot Cota/Santa Barbara St. (CS) 1.46 acre parking lot. City conducted a study in 2003 to assess redevelopment of site for affordable housing project that maintains the existing # of public parking lots on site. Potential exists for up zone to 50 units/acre. Site is located within coastal zone Pony Lot (7) 1.7 acre City owned Redevelopment Agency parking lot located on ocean side of Cabrillo. Potential exists for up-zone to 20 units/acre. Site is located within coastal zone and would require an amendment to the LCP to allow residential development south of the railroad tracks. City Parking Lot Haley/Anacapa (HA) 1.74 acre parking lot. City conducted a study in 2003 to assess redevelopment of site for affordable housing project that maintains the existing # of public parking lots on site. Site is located within coastal zone
17 Potential Receiving Sites in the City of Goleta (see Map D) The City of Goleta is currently drafting its General Plan which calls for the re-zone of certain parcels to residential uses. The recently incorporated City is very protective of its remaining agriculturally zoned land and has adopted a slow growth attitude with very few development projects permitted; it is unlikely any developments or rezones will proceed until the General Plan is adopted. Furthermore, the current political environment is such that the City is unlikely to support development transfers from County lands to areas within its jurisdiction because of previous development patterns in the Goleta Valley before incorporation. Despite this, there is a strong voice from residents and developers alike for increased development in certain areas. With these thoughts in mind, preliminary identified receiving sites were chosen based upon their consistency with proposed draft General Plan re-zones and current land uses and potentials for development. Sites are located in two general areas, north and south of Highway 101, and are zoned for either Agriculture or industrial/commercial purposes. All of these sites have the potential for significant up-zone to higher density residential uses. Table 3 Potential Receiving Sites in the City of Goleta (#s correspond to location on Map D) A. Sites north of 101 Ellwood Canyon (1) 33 acre parcel with AG I-10 zoning surrounded by medium density residential development. Potential exists for rezone to 4.6 units/acre. Couvillion (2) 14 acre parcel with AG II-40 zoning surrounded by medium density residential development. Potential exists for rezone to 4.6 units/acre Roman Catholic Ag Parcel (3) 10 acre parcel with DR 4.6 zoning surrounded by medium density residential development adjacent to Hwy 101. Site is currently in agricultural uses. Bishop Ranch (4) 287 acre parcel with AG II-40 zoning, not in agricultural production adjacent to Hwy 101. The owner (Larwin Devlopment Co) has submitted a preliminary development proposal for a project with units, but the City insists on maintaining Ag zoning. Potential exists for rezone from Ag to 4.6 units/acre. Stow Canyon (5) 6.5 acre parcel with residential 3.3 units/acre zoning currently under Ag uses; potential for up-zone to higher density Herold (6) 10 acre parcel with low density residential zoning 1 unit/acre with potential for up-zone to higher density Next to Herold (7) 4.7 acre parcel with low density residential zoning 1.8 units/acre with limited up-zone to higher density B. Sites south of 101 Vacant western parcel (8) 14 acre parcel with medium density residential zoning (8 units/acre) with limited up-zone potential. Site is
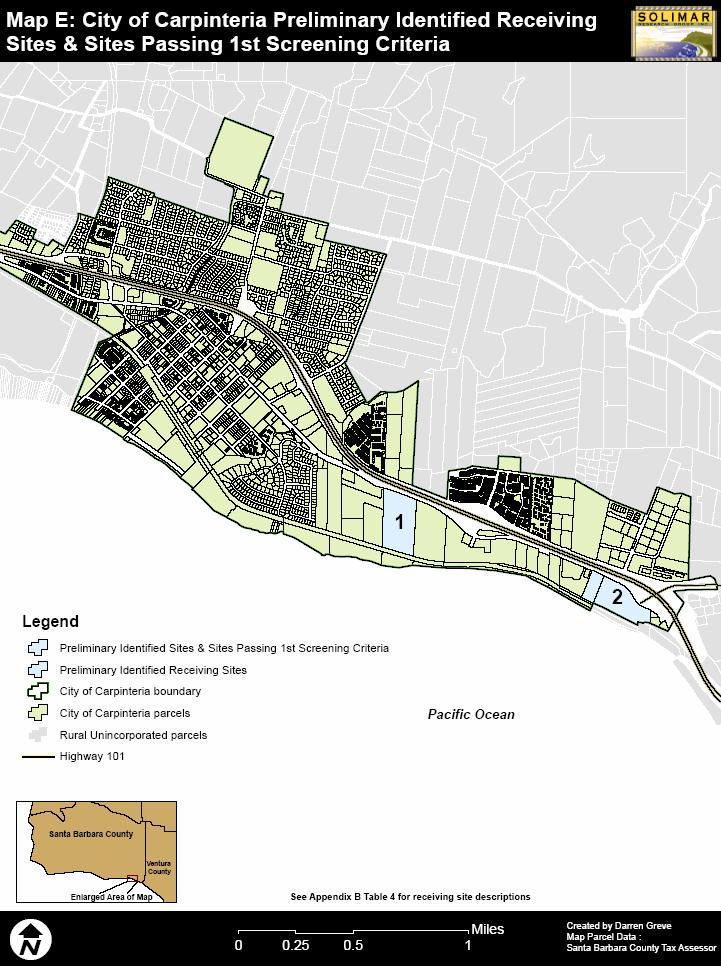
18 Across Camino Real (9) Across Camino Real (10) Mixed-Use (11) Commercial (12) East of HWY 217 (13) Bacara Resort located within coastal zone Cluster of 3 parcels totaling 10.8 acres zoned commercial/office which the City is considering for rezone to medium/high density mix residential uses 22 acre parcel zoned commercial which the City is considering for re-zone to medium/high density residential uses. We assume up-zone potential to 20 units/acre A Cluster of many parcels being zoned for a business park with the potential for residential mixed use development of certain portions Site is zoned for commercial, currently in Ag but is likely to remain zoned for commercial uses in the draft general plan. Site has limited potential as receiving site due to its strictly commercial zoning 17 acre site with residential (DR 4.6) and industrial (MHS) zoning being considered for re-zone to medium/high residential density The Bacara Resort is applying for an expansion onto adjacent property; potential exists to require TDR purchases for this Potential Receiving Sites in the City of Carpinteria (see Map F) The City of Carpinteria has a strong intention to preserve the existing green-belt surrounding the City s urban area. The City s General Plan identifies the City boundary as a rigid line serving both as a City limit and limit to of urbanization. Because of this, much of the agricultural, vacant and/or low density residential parcels in the City s sphere of influence would not act as viable receiving sites for development. However, two prominent and high valued bluff top sites could act as receiving sites for rural development. The degree of up-zone potential remains uncertain on these sites. Table 4 Potential Receiving Sites in the City of Carpinteria (#s correspond to location on Map F) Western Bluffs site (1) 23 acre bluff top parcel currently zoned PUD. Under the PUD zoning we assume a baseline density of 1.8 units/acre and up zone potential to 3.3 units/acre. The owner has in the past submitted a development proposal for the site. Site is within coastal zone. Eastern Bluffs site (2) 22 acre bluff top parcel currently zoned commercialresort. It may be possible to up-zone the site by allowing a mix of residential uses along with the resort zoning and or allow for more allowed rooms in the resort Potential Rural Receiving Sites Located Outside the South Coast UGB (see Maps A, C, D) Policy 2-13 specifies that receiving areas be located inside existing urban areas of the County. However, we feel it is prudent to also assess potential receiving sites along the
19 rural areas of the Gaviota Coast as well as sites adjacent to but outside the South Coast s existing UGB. It is not our recommendation to execute a TDR program in a way that violates Policy 2-13; rather, it is a goal of this report to explore the full range of possibilities about how a TDR transfer could be most effectively implemented. Sites adjacent but north of the current UGB between Goleta and the City of Santa Barbara possess some slope constraints and would likely be developed with relatively low density residential zoning (1 to 1.8 units/acre). These sites lie within the foothills of the Santa Ynez mountains and therefore possess highly valued views which would create strong developer demand in a TDR transfer. Table 5 Potential South Coast Rural Receiving Sites outside UGB : (#s correspond to location on Maps A, C, D ) 156 acre cluster of 3 parcels adjacent to the urban growth boundary on Goleta s western edge. The land is currently zoned agriculture but is in use as a golf course. Glen Annie Golf Course The site has slope constraints suggesting 30-50% (Rural 2, Map D) buildability at low to medium densities of 3.3 units/acre. The owner has recently expressed interest in using the land for residential purposes as the golf course is no longer profitable. 166 acre parcel located in foothills north of Cathedral Oaks rd, outside but adjacent to the current UGB with expansive views. Site is zoned AG II-40. Due to slope Rural 4 (Map A) constraints site would likely be developed at low density zoning of 1 to 1.8 units/acre. Site is Outside coastal zone, not under Williamson Act Rural 3 (Map A) Large 189 acre cluster of parcels with Ag I -20 zoning surrounded by low and medium density neighborhoods. Potential to up-zone to low density residential. Not under Williamson Act protection. Site Ag parcels between Summerland & Toro Canyon (Rural 5, Map C) Toro Canyon Parcels Adjacent to Polo fields (Rural 7, Map C) Summerland Eastern Bluffs (Rural 6, Map C) has slope constraints. 10 parcels totaling approximately 145 acres with Ag I - 20 zoning. Potential may exist to up-zone to 1 unit/5 ac or 1unit/acre. 4 parcels totaling 45 acres with AG I-10, REC and DR 3.3 zoning. Possible potential to up-zone to 1unit/5 ac zoning. 30 acres of 5 bluff top parcels with 3-E-1 zoning (3 acre min) May have the potential to up-zone to 1 acre min zoning. Area has significant geologic constraints that would indicate only very low allowed densities. Rural Unincorporated Gaviota Coast (see Map E) Sites located within the unincorporated Gaviota Coast, while not within the existing urban/rural boundary, have political and economic benefits that deserve analysis. It is assumed optimal sites are located in and around areas with pre-existing rural residential development or in locations between existing rural subdivisions and the current
20 urban/rural boundary. Three areas within Gaviota meet these general criteria: (1) Rancho Tajiguas subdivision, (2) El Capitan Subdivision, and (3) sites between Rancho Embarcadero and Goleta s western urban boundary that is Winchester and Ellwood Canyons. These areas have predominantly Ag -100 zoning, and/or very low density 5 acre minimum lot size restrictions. The subsequent up-zone potential of these sites would most likely be limited to low density residential for consistency with surrounding land uses. Yet moving from 5 acre minimums or Ag 100 zoning to 1 acre minimum lot sizes, in conjunction with the values associated the lots, has the potential to create strong market demand in this area. Alternatively, the Local Coastal Plan identifies the need for visitor serving lodges within the Gaviota. This suggests that it may even prove feasible to use higher density hotel development in the Winchester/Ellwood area to absorb development from the Santa Barbara Ranch. The benefit of addressing sites along the Gaviota Coast is that they face less political opposition than do sites in the other jurisdictions previously discussed; these sites possess an immediate and direct spatial connection with the Santa Barbara Ranch property allowing residents to witness the social benefit of transferred development. Table 6 Potential Receiving Sites in Unincorporated Gaviota Coast: (#s correspond to location on Map E) Winchester & Ellwood Canyons (Rural Three potential parcels zoned Ag II-100 located 1a, 1b, 1c) between the existing rural subdivision Rancho Embarcadero and Goleta s western urban limit line. Their location is ideal for making development contiguous with existing urban areas along Goleta s western edge. The parcels may have potential for upzone to surrounding area low to medium residential densities of 1.8 and 3.3 units/acre. Parcel R1a was recently up for sale. Area is partially within coastal zone. El Capitan rural subdivision (2) Private subdivision located east of the El Capitan parcel and contains 20 lots with 10 acre minimum lot sizes. Potential may exist for up-zone to 1 acre minimums. Parcels not under Williamson Act protection. Potential Receiving Sites in Santa Ynez, Los Olivos, Ballard (see Map G) The unincorporated Santa Ynez valley including the urban areas of Santa Ynez, Los Olivos, and Ballard is currently re-drafting its community plan. Sites within the unincorporated Santa Ynez Valley have several advantages over other areas. They avoid some of the geopolitical obstacles that receiving sites in incorporated areas possess, they are located within the 3 rd Supervisorial District, and have development values similar to those found along the South Coast. Discussions with community planners along with current development trends indicate strong demand for rural residential ranchette developments. Within the inner rural area
21 surrounding Los Olivos, Ballard, and Santa Ynez, 80-90% of the Agricultural land has been subdivided into 5 or 10 acre ranchette parcels which are arguably not viable for agricultural production. The community is strongly opposed to high density development in this inner rural area, but is not opposed to ranchette development. The remaining sites, with predominantly Ag 40 zoning, while technically not within an urban area, are not located within a strictly rural area, yet they possess the greatest potential in the Santa Ynez to receive development from the Santa Barbara Ranch. The current concern is whether or not to allow the few remaining large low density Ag parcels within the inner rural zone to subdivide into 5 or 10 acre parcels similar to the surrounding parcels. Community attitudes seem to be amenable with allowing these parcels to subdivide and instead focus on maintaining the large tracts of Ag land outside the inner rural area. This creates the opportunity to require TDR purchases for the subdivision of these lower density Ag parcels into 20, 10, or 5 acre rural ranchettes. In addition to the inner rural receiving sites, a handful of sites have been identified by the community in its Housing Summit Group for up-zone potential. These urban sites are located throughout the Town of Santa Ynez with sizes ranging from 1 to 5 acres. The densities of these sites have yet to be determined, but could range from units/acre. Table 7 Potential Receiving Sites in Unincorporated Santa Ynez Valley (see map G) A. Inner Rural Receiving Sites 21 parcels (940 acres) with Ag I 40 zoning located between Los Olivos, Ballard, and Santa Ynez. The community has supported up-zoning parcels to surrounding rural residential densities of 1 unit /10 acres or 1/20 within the inner rural area. B. Housing Summit Group Sites Multiple small parcels totaling 33 acres of urban Santa Ynez parcels zoned with low residential density 1-E-1. Community has identified these parcels for potential upzone to higher density (12-20 units/acre). Potential Receiving Sites in Orcutt (see Map H) Potential receiving sites in the unincorporated community of Orcutt are identified from the Orcutt Community Plan and the Clark Avenue re-development plan. The Orcutt Planning Area contains 43 Key Sites and Mini EIR sites, principally vacant and underdeveloped parcels. These undeveloped key sites are identified as having the greatest potential for development which would have community wide influence. We have identified four general areas that could provide potential receiving sites: (A) key sites within walking distance of old town (B) key sites with commercial mixed use potential, (C) redevelopment potential in Old Town Orcutt, and (D) key sites west of the airport. The developable land surrounding Orcutt is severely constrained by threatened and endangered species habitat which acts to restrict and in many cases reduce the number of units allowed despite the existing zoning as spelled out in the key site plans. Therefore, up-zone potential on many of these identified key sites, and their subsequent feasibility as receiving sites is significantly limited.
22 Table 8 Potential Receiving Sites in Orcutt (#s correspond to location on Map H) A. Walking distance to old town Orcutt. Key Site 14 (1) 87 acres with low density 1.5 units/acre residential zoning, could be up-zoned to higher density. Key Site 15 (2) 53 acres with low density 4 units/acre residential zoning, could be up-zoned to higher density Key Site 16 (3) 12 acres zoned for commercial Key Site 17 (4) 20 acres with 8 units/acre residential zoning, limited up-zone potential B. Commercial Sites Key Site 1 and 2 (6) 42 acres with commercial zoning C. Downtown Redevelopment Potential Clark Avenue (5) D. West of Airport Key Site 21 (7) Key Site 22 (8) Many parcels with redevelopment potential to high density mixed use 340 acres with low density residential zoning (maximum 150 units) 1179 acres with rural residential RR-20 zoning; site calls for the potential re-zone to higher density ( units) with the use of TDR. However, the site has significant threatened and endangered habitat constraints Potential Receiving Sites in the City of Santa Maria and Surrounding Area (see Map I) The City of Santa Maria has three general categories of potential receiving sites: (A) rural lands along the City s urban fringe that have been or are likely to be added to the City s sphere of influence for future development, (B) residential parcels within the City s current boundary that could be up-zoned to higher density, and urban in-fill parcels undergoing rezone to mixed use high density development. These three categories each represent an opportunity for increasing density with a TDR mechanism. In the first case the LAFCO could seek to influence the City in the approval process regarding the use of TDR on parcels the City wishes to add to its sphere of influence. In the second case the City could decide to increase residential zoning contingent upon the developer purchase of TDR. The infill option would allow the City planning department and City Council a decision regarding the use of TDR as a means of increasing vertical development on pre-identified sites the City wishes to re-zone for mixed use. An important consideration regarding the feasibility of receiving sites in the Santa Maria area is the significant distance between the City and the Santa Barbara Ranch. Even though total development values of potential receiving sites may be significantly large it is unlikely to outweigh the political difficulties caused by the lack of spatial connection to the Santa Barbara Ranch. Table 9 Potential Receiving Sites in Santa Maria (#s correspond to location on map I) A. Rural lands long urban fringe
23 Bradley Ranch (1) Urban Ag west of 101 (2) Ag sites in north eastern corner (4) Mahoney Ranch (7) Western Ag lands (6) B. Low density residential parcels w/in City Sites north east of 101 (3) Illif property (5) The Bradley Ranch is a large, acre unincorporated parcel located on the eastern urban fringe of the City and east side of highway 101. The parcel is currently under agricultural use (AG 10, 20, but is a future proposed annex to the City. The site is south of the eastern no urban development zone as identified in City Resolution acre Ag I-40 zoned parcel currently within the City s sphere of influence. Site is surrounded by urban development; City is considering re-zone to urban development Parcels totaling 264 acres of Ag II-40 zoning bordering the City boundary north of the City s no urban development zone as written in City resolution The 460 acre site is located along the south-western edge of the City. It is zoned for a planned development with varying densities. The Mahoney Ranch has been approved and recorded by the LAFCO for sphere expansion on November 9, acres of Ag I-10 lands adjacent to City s western boundary; area was identified in County 2030 land inventory as having potential for urban development 32 acres lower density residential (R-1) zoning that could be up-zoned to higher residential density 45 acres of lower density residential (R-1) zoning that could be up-zoned to higher residential density Potential Receiving Sites in Lompoc The City of Lompoc is currently constrained in its ability to acquire new land for residential development. The LAFCO is limiting the spread of the city into the surrounding prime agricultural lands. Demand for new development is strong in Lompoc; developable land is limited in relation to a population that has nearly doubled in the last thirty years. The WYE development located north of the City of Lompoc and south of Vandenberg Village between Harris Grade road to the east and Highway 1 to the west has the greatest potential to serve as a receiving site for development transfers in the City of Lompoc and surrounding area. The current development proposal identifies 7 areas of which only areas 2,3, and 4 have potential to increase project density. Table 10 Potential Receiving Sites in Lompoc WYE Development 322 acre site lying within the Lompoc s urban growth boundary, currently County controlled, but the City of Lompoc will be proposing a sphere expansion to the LAFCO within the next three months. Most of the land within the site is zoned under the County s zoning guidelines for residential development at lower densities of between Res-3.3 and 4.6 (maximum of 4.6 units/acre), and DR 4.6. Of the 322 acres 149 has development pending with a plan for 476 units (3.1
24 units/acre). Area 2 Area 3 Area 4 63 acres with low density zoning (3-5units/acre); potential may exist to increase density 26 acres with low density zoning (2-3units/acre); potential may exist to increase density 27 acres with low density zoning (1-2units/acre); potential may exist to increase density Potential Receiving Sites in Buellton Agricultural lands surround the City, and a greenbelt is proposed for the agricultural lands between the Buellton and Solvang. Buellton was the fastest growing city in the County in the 1990 s, growing at an average rate of 2% a year. When Buellton incorporated the LAFCO included agricultural lands west, north and east of the existing urban community within the city boundary. Since that time almost all of this land has been developed. Currently there are proposals for potential urban expansion on large tracts west and north of the current City limit. Table 9 Potential Receiving Sites in Buellton A. Lands to the west of City limits 185 acre area to the west of the City s sphere of influence is bordered by the County s rural boundary line. The site contains 19 individual parcels, mostly rural residential ranchettes and agricultural crops B. Lands to the north of City limits The lands to the north are highly visible from Highways 101 and 246 and contain many steep slopes with significant areas of prime soils, yet the area is currently used for grazing
25 Santa Barbara Ranch TDR Feasibility Analysis TECHNICAL APPENDIX C Primary Receiving Site Screening
26 Appendix C: PRIMARY RECEIVING SITE SCREENING The following excel spreadsheets show the primary economic criteria to screen sites for further analysis under screen #2. With this initial screening we simply compare the Total development value of a TDR up-zone on the receiving sites with the Total development value of the proposed MOU project. The assumed TDR up-zone for each site is based on surrounding area land uses and densities; the selling price of units was determined through market research of recent sales in the area during year Sites that have a Total development value that is generally greater than 10% of the Total development value proposed in the MOU project pass this first screen. Several sites passing this screen have close to, but less than 10% value but were retained for their potential promise as receiving sites regardless. The excel Tables are organized as follows: Table 1: Unincorporated Urban South Coast Receiving Sites Table 2: City of Goleta Receiving Sites Table 3: City of Santa Barbara Receiving Sites Table 4: City of Carpinteria Receiving Sites Table 5: Unincorporated Rural South Coast Receiving Sites Table 6: Santa Ynez Receiving Sites Table 7: Orcutt Receiving Sites Table 8: Santa Maria Receiving Sites Table 9: Lompoc Receiving Sites 1
27 Appendix C, Table 1: Unincorporated South Coast Primary Screening Sites meeting both Economic & Political Primary Screening Criteria (these sites subject to further screening) Urban Unincorporated South Coast Receiving Sites APN Total Parcel(s) Size Total Buildable Acres Current Zoning (units/acre) # of Zoning Estimated # of Additional Units w/ TDR Up-Zone (density bonus) YTD Median Home Price (see note 5) Total Development Value of Density Bonus on Receiving Site % of SBR Development Value (SBR = 326 mill) Sites north of 101, between 154 to Goleta City limits (Map A) (1) Noel Christmas Tree Farm , 057, (60%) AG I (@4.6 units/acre, see note 1 below) 1,093,700 75,465, (2) Area 2 a , 027, (60%) 1-E (@ 4.6 units/acre, see note 1 below) 1,093,700 28,436, b , 059, (60%) DR (@ 4.6 units/acre, see note 1 below) 1,093,700 17,499, (4) Area , (60%) 1-E (50%, see note 2 below) 1,093,700 6,562, (5) Area , 014, 017, 018, 020, (25%) 1-E-1 (constrained) 9 4 (50%, see note 2 below) 1,093,700 4,374, (6) Area , 023,017, 020, 007, 3-E-1 (1 unit/3 ac), 006, 014, (60%) 4 30 (@ 3.3 units/acre, see note 3 below 1,093,700 32,811, (60%) 1-E (@ 3.3 units/acre, see note 3 below 1,093,700 6,562, (7) MTD (see note 8) , 005, (90%) AG I (@ 4.6 units/acre) 1,093,700 82,027, (8) St Vincents east DR % 1,093, west (see Note 8) (60%) DR (@3.3 units/acre) 1,425,000 65,550, (9) County Campus - North (see note 8, 9) ; (60%) zoned REC (county admin buildings, etc) 0 73 (@ 3.3 units/acre) 1,425, ,025, (10) San Marcos Foothills many Bermant Development (50%) PRD - 75 (not to exceed 75) 20 houses proposed 10 (50%) 1,675,000 16,750, South of 101 (Map A) (11) South Patterson Ag Block (a) Ag Parcels many (60%) AG I - 5, (@ 3.3 units/acre) 953, ,584, (b) Public Utility parcel (60%) PU (public utilities) (@ 1.8 units/acre) 2,415, ,570, (12) San Marcos Ag , , , 010, AG (@4.6 units/acre) 953, ,684, (13) San Simeon Scool Site (60%) DR (@ 4.6 units/acre) 953,900 17,170, (14) More Mesa (see note 1) (a) western parcels , 001; , , 2.4, 3.6 (60%) AG I-5 (7.37 ac), 20-R-1 (4 ac), DR-1(6ac) 1, 4, 3 13, 4, 9 (@DR-3.3) 1,093,700 28,436, (b) county owned (25%) Res 40 (environmetally constrained) 0 30 (@ DR 3.3) 1,093,700 32,811, {c} northern parcels , 021, 019, 020, (60%), 3.2 (60%) DR -.5 (4.5 ac), DR 1.8 (5.29) 1, 6 8, 4 (@ DR -3.3) 1,093,700 13,124, (d) eastern parcel RES 1.8 (10.5), 3.3 (16),.7 (14) 19, 41, (@3.3), 0, 8 (@1.8) 2,415,200 55,549, (15a) Bluffs near More Mesa (see note 7) , 013, 015, 016, 008, 006, (60%) 2.5-E-1 (2.5 ac min lot size) 18 7 (40%) 2,415,200 16,906, (15b) Various Vacant non Bluff parcels (60%) 2.5-E-1 (2.5 ac min lot size) 2 1 (40%) 2,415,200 2,415,200 total , 007; ; (60%) 3.5-E-1 (3.5 ac min lot size) 6 8 (130%) 2,415,200 19,321,600 (16) Las Positas (a) DR (60%) DR , (b) Hillside Constrained (25%) RR-20 (Slope Constrained) 3 3 (100%) 2,415,200 7,245, Montecito (Map C) (1) western bluffs PRD (no minimal lot size) (2) Avacado Orchard , 052, 053, 051, 049, (60%) AG I (@ 1.8 units/acre) 2,177,300 65,319, (3) Area 3 (north parcel) (60%) 1unit/10 acres 2 41 (@1.8 units/ac) ) 2,177,300 89,269, (3) Area 3 (south parcel) (60%) 1 unit/3 acres 4 19 (1.8 units/ac) 2,177,300 41,368, Isla Vista (see note 4) UC - Ocean Road (#) corresponds to location on Maps A, C in Appendix A 4. IV master plan Alt 6 proposes a buildout at 3000 additional units (original proposed 1,500) 5. data obtained from Economic Outlook 2005 for Santa Barbara County; as of April value obtained from Bermant development pro forma in County Planning Commission staff report 7. Hope Ranch CCR allow for minumum lot size of 1.5 acres 8. MTD, Calle Real Campus, and St Vincents sites are on the County's DRAFT Affordable Housing re-zone site list 9. County Campus is a county owned parcel; the county is considering re-zoning for residential 2
28 Appendix C, Table 2 : City of Goleta Primary Screening Sites meeting both Economic & Political Primary Screening Criteria (these sites subject to further screening) Goleta Receiving Sites APN Total Parcel(s) Size Total Buildable Acres Current Zoning (units/acre) # of Current Zoning Estimated # Additional Units w/ YTD Median Home TDR Up-Zone (density bonus) Price (April 05) Total Development Value of Density Bonus % of SBR Development Value (SBR = 326 mill) North of 101 (1) Ellwood Canyon (60%) AG I (@ 4.6 units/acre) 1,008,700 89,774, (2) Couvillion (60%) AG II (@ 4.6 units/acre) 1,008,700 37,321, (3) Roman Catholic Parcel (60%) DR (100%) 1,008,700 27,234, (4) Bishop Ranch , , (60%) AG I (@ 4.6 units/ac, note 1 below) 1,008, ,925, (5) Stowe Canyon Ag (60%) 10-R-1 (3.3 units/acre) (100%) 1,008,700 13,113, (6) Herold Ag (60%) 1-E (100%) 1,008,700 6,052, (7) next to Herod (60%) DR (100%) 1,008,700 5,043, South of 101 (8) western most parcel (vacant) (60%) DR ,900 0 (9) 3 clustered parcels (vacant) , 006, (90%) MHS (Draft GP calls for rezone to medium/high density) (@ 12 units/acre) 521,458 61,010, (10) Across Camino Real (vacant) (90%) MHS (Draft GP calls for rezone to medium/high density) (@ 12 units/acre) 521, ,585, (11) Numerous parcels , 004; , 028,027,024, (25%) note 1 M-1 (Draft GP calls for rezone to mixed use) units/acre) 521, ,579, (12) Ag parcel (80%) zoned C-V (GP calls for zoning to remian commercial) (13) Vacant east of (80%) DR 4.6 (GP re-zone to med & high density residential) (100%) 521,458 14,600, (80%) MHS (GP re-zone to med & high density residential) 0 98 (12 units/acre) 521,458 51,102,884 (14) Bacara Resort (#) corresponds to location on Map D in Appendix A 3
29 Appendix C, Table 3: City of Santa Barbara Primary Screening Sites meeting both Economic & Political Primary Screening Criteria (these sites subject to further screening) City of Santa Barbara Receiving Sites APN Total Parcel(s) Size Total Buildable Acres Current Zoning (units/acre) # of Current Zoning Estimated # of Additional Units w/ TDR Up- Zone (% density bonus) YTD Median Townhome/Condo Price (see note 5) Total Development Value of Density Bonus 1 Funk Zone many (90%) HRC, OC with Residential, R-3 allowed mixed use 0 1,125,000 (2 bedroom) 0 0 see note 4 2 Wright Property West of Garden st , 021, (90%) Residential, R-3 % of SBR Development Value (SBR = 326 mill) Has development plan for 160 townhomes (40 units/acre) 0 1,125,000 (2 bedroom) Wright Property East of Garden st. Area B , 014, 028, (60%) HRC-2 (height limit 3 stories 45') 0 40 (@ mixed-use 20 units/ac) 1,125,000 45,000, Area C (60%) Ocean M-1 (height limit 3 stories 45') 0 80 (@ mixued-use 20 units/acre) 1,125,000 90,000, Area D (60%) M-1, (45,000 sqft 25% office (height limit 3 stories 45')) 0 36 (@ mixued-use 20 units/acre) 1,125,000 40,500, see note 2 4 City Housing Authority vacant Has PRD for 90 affordable units 0 1,125, (a) City owned Redevelopment Agency ,035,029, (80%) M-1 0 (see note 1) 40 (@ mixed-use 20 units/ac) 1,125,000 45,000, (b) adjacent parcels not owned by city (90%) M (@ mixed-use 20 units/ac) 1,125,000 49,500, Vacant across from Fess Parker Hotel (60%) M (@ 20 units/ac) 1,125,000 40,500, Pony Lot - Redevelopment site (80%) M (@ mixed-use 20 units/ac) 1,125,000 31,500, see note 2 8 Oretega/Anacapa streets , (90%) CM (allows R-3) 13 (30 units/ac) minimal 9 Haley/Santa Barbara streets (90%) CM (allows R-3) 16 (@ 30 units/ac) minimal City owned Parking Lots (LL) Louise Lowry Parking lot (60' height restriction) 0 41 (@ 50 units/acre) 1,125,000 46,125, (CS) Cota Parking lot (60' height restriction) 0 73 (@ 50 units/acre) 1,125,000 82,125, (HA) Haley/Anacapa Parking lot (60' height restriction) 0 87 (@ 50 units/acre) 1,125,000 97,875, Chapala/Anapamu Parking lot (60' height restriction) 0 Chapala/Victoria Parking lot (60' height restriction) 0 Anacapa/Figueroa 1 1 Parking lot (60' height restriction) 0 Gutierrez/state Parking lot (60' height restriction) 0 Carrillo/castillo Parking lot (60' height restriction) 0 10 Las Positas (a) school site (60%) E-1 (see note 3) 0???? 24 (@ 4.6 units/acre) 1,093,700 26,248, (b) low density res , A (100%) 2,415,200 7,245, City owned near airport , 065, 072, (60%) commercial (unlikely to be re-zoned to res uses) (@ mixed-use 30 units/ac) 521, ,402, (#) corresponds to location on Map B in Appendix A (1) City re-zone and evaluating development proposals ; development on site needs to provide a social benefit and eliminate existing blight (2) mixed use densities assumed to be 30 units/acre (3) school site has been proposed to be sold for residential development (4) R-3 zoning is assumed to allow zero up zone potential as high densities are currently entitled to the property; only opportunity for up-zone is to allow residential increases above the constrained 70% maximum (5) values obtained from Economic Outlook 2005 for Santa Barbara County, and recent townhome sales listings in downtown area 4
30 Appendix C, Table 4: City of Carpinteria Primary Screening Sites meeting both Economic & Political Primary Screening Criteria (these sites subject to further screening) City of Carpinteria Receiving Sites APN Total Parcel(s) Size Total Buildable Acres Current Zoning (units/acre) # of Current Zoning Estimated # of Additional Units w/ TDR (% YTD Median Home Price (see density bonus) note 3) Total Development Value of Density Bonus % of SBR Development Value (SBR = 363 mill) 1 Western Bluff site (60%) PUD (1) 25 (@ LCP allowed 1.8 units/ac) 21 (@ 3.3 units/ac) 2,500,000 52,500, ??? 2 Eastern Bluff site , (60%) V-C (Resort- commercial) no residential units see note 2 2,500, (1) site has proposed development of 120 units (2) the site has potential to be up-zoned to allow for a mix of residential units with resort/hotel zoning (3) data obtained from Economic Outlook 2005 for Santa Barabara County Appendix C, Table 5: Unincorporated Rural South Coast Primary Screening Sites meeting both Economic & Political Primary Screening Criteria (these sites subject to further screening) Rural Unincorporated South Coast Receiving Sites APN Total Parcel(s) Size Sites outside but adjacent to Goleta's Urban Limit Line Total Buildable Acres Current Zoning (units/acre) # of Zoning Estimated # of Additional Units w/ TDR Up-Zone (density bonus) YTD Median Home Price (see note 5) Total Development Value of Density Bonus % of SBR Development Value (SBR = 326 mill) (R-1) Winchester Canyon (a, b) Vincent's Property , (40%) AG (@ 3.3 units/ac) 1,275, ,850, (c) Cavalleto , (20%) AG (@ 1.8 units/ac) 1,275,000 44,625, El Capitan Subdivision (see note2) 14 ten acre sites RR (@ 1 unit/ 5 ac) 2,000,000 28,000, large parcels to the north , Ag (@ 1 unit/ 20 ac) 2,000,000 42,000, (R-2) Glen Annie Golf Course (30%) AG II (@ 1.8 units/acre) 1,680, ,440, (R-3) Rural Area 3 - north & adjacent to UGB (R-4) Rural Parcels - north UGB , 017,005,037,051; , ,043; (30%) , 006; ; ; , (30%) AG I - 20 (constrained) 6 96 (@ 1.8 units/acre, see note 1 1,680, ,280, AG II-40 (slope constrained) 2 84 (@ 1.8 units/ac) 1,680, ,120, (R-5) AG parcels between Summerland and Toro Canyon a , through AG (Ag - 5) 2,177,300 28,304, b , AG ,177,300 6,531,900 (R-7) Toro Canyon adjacent to Polo fields a (60%) AG I (@ 4.6 units/ac) 1,500,000 88,500, b (60%) REC 0 34 (@4.6 units/sc) 1,500,000 51,000, c , (60%) DR (@4.6 units/ac) 1,000,000 8,000, (R-6)Summerland Eastern Bluffs , 009, 013, (50%) -1(3 ac min parcel s 5 10 (1-E-1) 3,000,000 30,000, (#) corresponds to location on Maps D,E,A, & C in Appendix A 5
31 Appendix C, Table 6 : Santa Ynez Primary Screening Sites meeting both Economic & Political Primary Screening Criteria (these sites subject to further screening) Santa Ynez Receiving Sites (see note 1) APN Total Parcel(s) Size Total Buildable Acres Current Zoning (units/acre) # of Current Zoning Estimated # of Additional Units w/ TDR Up- Zone (1/ 5 ac. re- zone, 800% density bonus) 1/ 10 ac. Re-zone, 400% density bonus 1/ 20 ac.re-zone, 100% density Bonus YTD Median Home Price (see note 2) Total Development Value of Density Bonus (1 unit/5ac) 1unit/10ac 1unit/20ac Inner Rural Area AG I ,600 12,356,400 5,295,600 1,765, AG I ,600 10,591,200 5,295,600 1,765, AG I ,600 10,591,200 5,295,600 1,765, AG I ,600 10,591,200 4,413,000 1,765, AG I ,600 5,295,600 2,647,800 1,765, AG I ,600 6,178,200 2,647,800 1,765, AG I ,600 4,413,000 1,765,200 1,765, AG I ,600 2,647,800 1,765, , AG I ,600 2,647,800 1,765, , AG I ,600 3,530,400 1,765, , AG I ,600 4,413,000 1,765, , AG I ,600 15,004,200 6,178,200 2,647, AG I ,600 10,591,200 5,295,600 1,765, AG I ,600 5,295,600 2,647,800 1,765, AG I ,600 3,530,400 1,765, , AG I ,600 3,530,400 1,765, , AG I ,600 3,530,400 1,765, , AG I ,600 4,413,000 2,647, , AG I ,600 6,178,200 3,530,400 1,765, AG I , , AG I ,600 7,060,800 3,530,400 1,765, AG II ,600 17,652,000 7,943,400 3,530,400 TOTALS ,924,600 71,490,600 32,656,200 see note 2 see note 2 see note 2 % of SBR Development 1 unit/5ac (SBR = 326 mill) 1unit/10ac % 1unit/20ac Urban Santa Ynez Town # AG (60%) 1 44 (@ 4.6 Units/ac) 882,600 38,834, # E (90%) 2 10 (@ 4.6 units/ac) 882,600 8,826, # E (90%) 2 7 (@ 4.6 u/ac) 882,600 6,178, # E-1 4 (90%) 4 14 (@ 4.6 u/ac) 882,600 12,356, # , 017, CH , # E (90%) 2 7 (@ 4.6 u/ac) 882,600 6,178, # , 029, R-1 2 (90%) 6 3 (4.6 u/ac) 882,600 2,647, see note 3 total Urban Los Olivos Urban Ballard none none Notes: 1. all the inner rural area parcels have existing zoning of 1 unit/40 acres; the communitiy indicated possible upzoning of these parcels in the inner rural area during the Community Plan process 2. data obtained from 2005 Economic Outlook for Santa Barbara County; as of April inner rural parcels could be subdivided to several rural ranchette low densities (5, 10, or 20 units/acre) 4. Urban sites 1-9 identified by the Santa Ynez Housing Summit Group 6
32 Appendix C, Table 7 : Orcutt Primary Screening Sites meeting both Economic & Political Primary Screening Criteria (these sites subject to further screening) Orcutt Receiving Sites APN Total Parcel(s) Size Total Buildable Acres Current Zoning (units/acre) # of Units (or Current Zoning Estimated # of Additional Units w/ TDR Up-Zone (% density bonus) YTD Median Home Price (April 05) Total Development Value of Density Bonus on Receiving Site % of SBR Development Value (SBR = 326 mill) Walking distance to Old Town (1) Key site (60%) PRD (1.5/ac, 16'height restrict) (50% see note 1 below) 420,000 16,380,000 5 (2) Key site PRD (4/ac, max 200) (50% see note 1 below) 420,000 42,000, industrial XXX XXX 0 3 commercial(c-2) XXX XXX 0 (3) Key Site , (80%) commercial (SC- shopping center)????? 0 (4) Key Site ,-05, (80%) Res (8/ac) (50%) 420,000 26,880,000 8 Old Town Re-Development (5) Clark Ave and Broadway many 5 5 (100%) Commercial (@ mixed use 20 units/acre) 320,000 32,000, Commercial Sites near 101 (6) Key Site 1 (see note 3) Commercial (C-2) 375,000 sqft (6) Key Site 2 (see note 3) ,03,04 18 Commercial (C-2) 280,000 sqft West of Airport (7) Key Site ,-6,-8,-14, (60%) PD - low density Res (max 150) (50%) 420,000 31,500, (8) Key Site 22 (see note 4) (50%) RR PRD (1000% see note 2 below) 420,000 1,260,000, Notes: (#) corresponds to location on Map H in Appendix A Key site info obtained from the Orcutt Community Plan 1. Key sites 14,15 are 'gateway sites' and thus require a lower density - likely density bonus could be 50% 2. Key site 17 calls for high density PRD re-zone once Orcutt is 60% build out with use TDR 3. sites with only commercial uses are screened from further analysis with the assumption additional commercial development will not generate the necessary values 4. Site has significant threatened and endangered species habitat that will likely make the site unsuitable as potential receivig site. 7
33 Appendix C, Table 8: City of Santa Maria Primary Screening Sites meeting both Economic & Political Primary Screening Criteria (these sites subject to further screening) Santa Maria Receiving Sites APN Total Parcel(s) Size Total Buildable Acres Current Zoning (units/acre) # of Current Zoning Estimated # of Additional Units w/ TDR Up-Zone (% density bonus) YTD Median Home Price (April 05) Total Development Value of Density Bonus % of SBR Development Value (SBR = 326 mill) (1) Bradley Ranch (unincorporated - would be a LAFCO conditional (60% AG II 1-10, (@ 3.3 units/acre) 420, ,000, (2) Urban Ag site west of 101, north of betteravia (unincorporated - would be a LAFCO conditional (60%) AG I (@4.6 units/acre) 420, ,160, (3) Sites east of 101, north of Main (within City) Tamooka (100%) R-1/10,000 (density = 4/acre) (100%) 420,000 7,560,000 2 Walnut Grove (100%) R-1/8,000 (density = 4/acre) (100%) 420,000 24,780,000 8 Silva Estates (100%) R-1/6000 (density = 5/ac) (100%) 420,000 26,460,000 8 (4) Ag sites east of 101, north of Main st. (unincorporated - would be a LAFCO conditional , 014,042, (60%) AG II (@ 3.3 units/acre) 420, ,308, (5) Illif Property (100%) R-1 (> 6000sqft) (100%) 420,000 94,500, (6) Western Ag lands (unincorporated) see note (60%) AG (@ 3.3 units/acre) 420,000 1,063,020, (7) Mahoney Ranch (60%) RD (Tiger salamander constrain , (8) Mixed-Use Sites Notes: (#) corresponds to location on Map I in Appendix A 1. Site identified in County 2030 Open Lands document as having development potential and re-zone from Ag 2. Many of these sites are outide the City limits and thus potentially could have the LAFCO condition their incorporation with the use of TDR 8
34 Appendix C, Table 9 : City of Lompoc Primary Screening Sites meeting both Economic & Political Primary Screening Criteria (these sites subject to further screening) Lompoc Receiving Sites APN Total Parcel(s) Size Total Buildable Current Zoning # of Current Zoning Estimated # of Additional Units w/ TDR Up- YTD Median Home Price (see note 2) Total Development Value of Density Bonus % of SBR Development Value Acres (units/acre) Zone (% density bonus) on Receiving Site (SBR = 326 mill) Wye Res single family 473 area 1 10 (8-12/ac) area 2 63 (3-5/ac) (100%) 420,000 79,800, area 3 26 (2-3/ac) (100%) 420,000 21,840, area 4 27 (1-2/ac) (100%) 420,000 11,340, area 5 12 School area Park area 7 8 Open Space Sea Breeze Estate 366 Bodger Subdivision information obtained from WYE development EIR report data from 2005 Economic Outlook ; as of April
35 Santa Barbara Ranch TDR Feasibility Analysis TECHNICAL APPENDIX D 2nd Screening of Receiver Sites
36 Appendix D: SECONDARY RECEIVING SITE SCREENING WILLINGNESS TO PAY FOR TDRS In order to determine a developer s willingness to pay (WTP) for TDRs on receiving sites passing the 1 st screen we developed and applied the theory as described in section 5.5. We measure developer s WTP for TDRs using the following basic formula: Willingness To Pay = Capitalized Land Value with TDR Up-Zone Pre-Development Agreement Land Costs Capitalized land value is simply the added value the land acquires with newly entitled higher density residential development. More specifically, a developer s willingness to pay for a TDR is simply the added land cost a developer is willing to incur for additional density while still acquiring a net profit that is 15% of total project revenues. Subtracted from this added land cost or TDR value should be the pre-development agreement land costs, if any, the developer pays the receiving site landowner. Pre-development agreements typically involve the landowner acting as an equity partner who profit shares with the developer at the end of the project. This enables the landowner to capture a portion of the capitalized value the land acquires when it is up-zoned as a receiving site. In our model we assume the receiving site landowner captures 5% of project revenues 1. This definition of WTP holds for any development project regardless of density or type. Therefore, to estimate WTP, developer revenues and costs were modeled using a pro-forma methodology. The Microsoft excel worksheets below illustrate this approach with worksheets included for each of the receiving sites that passed the first screen. The pro-forma model is organized into two basic categories - revenues and costs- so as to arrive at a net profit that is, total revenues less total costs. We use the excel tool solver to calculate the TDR Value cell with a constraint that the net profit be fixed at 15% of total revenue. We assume 15% here based on conversations with local area developers. In essence this generates the total added value to the land with an up-zone to the ascribed density given our assumed fixed costs. To determine revenues, density generated unit counts for a specific site given its size (and constraints) are multiplied by the estimated selling price of a unit. House sales information was obtained from real estate multiple listing (MLS) data, market surveys, and local area median sales price data from the 2005 Economic Forecast for Santa Barbara County. 1 Research showed receiving site landowners in Burlington County s TDR program, NJ, had engaged in 5% revenue sharing with developer to capture value added to their land with a TDR up-zone. 1
37 We also estimate revenues for projects with 15% and 30% of the units set aside for workforce housing. In so doing we base the selling price of these units on the reported values for a 4 person HH that is earning 120% - 200% of the 2004 area median income of $64,000. In the County controlled areas this equates to a mandatory selling price of $330,000/unit, and in the City of Santa Barbara $450,000. Density assumptions for each receiving site were based on surrounding land uses, densities and the site s topographic constraints. The density up-zone assumptions we use are modest and range only from 1.8 units/acre to 4.6 units/acre in residential neighborhoods and 20 to 50 units/acre in downtown sites. In most cases, we also assumed that only between 15% and 60% of the property was buildable, depending on local conditions 2. In so doing we base our unit count calculations on the reduced buildable area to further reflect land use realities. Project fixed costs in the pro-forma were ascertained through conversations with local developers 3 and are organized as follows: 1. Land Costs (with existing zoning & total with capitalized value) 2. Development Costs (building construction & site ) Developer Fee (costs of developer overhead) 5. Marketing Costs 6. Financing Costs 7. Commission & Closing Costs The land costs we assumed ranged from 22,000/acre for rural land with agricultural zoning to $1.5 million/acre for parcels with industrial zoning along the waterfront. Urban parcels with agricultural zoning were assumed to sell between $100,000 and $150,000/acre depending on location. Receiving sites with a significant amount of allowed by right residential development were further analyzed to estimate the market price of the land. Alternatively, for the City owned parking lots we assume land costs of $0. Construction costs were assumed to be $ /sf for residential space. For the higher density condo sites in downtown Santa Barbara (including the City owned parking lots) we assume parking construction costs of $17,000/space for above grade podium parking and $45,000/space for the replacement of the public parking spaces. Site that is, the costs associated with grading, sewer, water, and roads, were assumed to be 15% and 30% of total building construction costs for urban and rural sites respectively. 2 We assume 60% of parcel size to be the default buildable area in cases with moderate site constraints. 3 Bermant Co., Comstock Homes, Investec, and Tobes Group 2
38 Indirect costs the costs associated with permitting, design, impact fees, legal fees, and insurance, were assumed to be 25% of construction costs. Developer fees the costs of the developer s overhead, were assumed to be 3% of project revenues. Financing costs - that is, the interest paid to the banks for lent money, is calculated assuming a linear draw on debt with an interest rate that is 1% above prime rates. This amounts to an 8% interest payment on 60% of 75% of all costs including the land. The remaining 25% of costs are assumed to be financed by equity investors. Marketing costs and Commission & Closing costs are modeled to each be 2.5% of project revenues. Net Profit was determined by subtracting the total project costs from the total project revenue. We use the excel tool solver to calculate a TDR Value with a constraint that the net profit be fixed at 15% of total value, and the assumed fixed costs. Further detailed pro-forma assumptions are indicated in the notes in the excel worksheets. The WTP calculations for each of the receiving sites in Table are shown below and organized as follows: 1. Unincorporated Urban South Coast Receiving Sites 2. City of Santa Barbara Receiving Sites 3. Unincorporated Rural South Coast Receiving Sites 4. Santa Ynez Receiving Sites 5. City of Carpinteria Receiving Sites 6. City of Goleta Receiving Sites Each page has the WTP calculations for each site under 100% market rate, 85% market rate with 15% workforce, and 70% market rate with 30% workforce scenarios. 3
39 Urban Unincorporated Santa Barbara County Receiving Sites - WTP 1. Noel Christmas Tree Farm (1) 2. MTD Site (7) 3. County Campus North (9) 4. St Vincets West (8) 5. More Mesa East (14d) 6. Montecito Orchard (2) 7. Montecito Area (3) 4
40 Appendix D: Secondary Screening - Developer Willingness to Pay for TDRs Appendix D: Secondary Screening - Developer Willingness to Pay for TDRs Appendix D: Secondary Screening - Developer Willingness to Pay for TDRs Unincorporated South Coast: Noel Christmas Tree Farm Unincorporated South Coast: Noel Christmas Tree Farm Unincorporated South Coast: Noel Christmas Tree Farm 100% residential market rate single family units Mixed Income ( 85% market rate, 15% affordable workforce units) single family units Mixed Income ( 70% market rate, 30% affordable workforce units) single family units Site Characteristics Site Characteristics Site Characteristics Parcel(s) Size 26 Parcel(s) Size 26 Parcel(s) Size 26 Buildable Area (1) 60% 15.6 Buildable Area (1) 60% 15.6 Buildable Area (1) 60% 15.6 Existing Zoning Ag - 5 Existing Zoning Ag - 5 Existing Zoning Ag - 5 TDR Re-zone / Up-zone (2) 4.6 units/ac TDR Re-zone / Up-zone (2) 4.6 units/ac TDR Re-zone / Up-zone (2) 4.6 units/ac Development Program Development Program Development Program Residential Residential Residential # of units w/ existing zoning 3 # of units w/ existing zoning 3 # of units w/ existing zoning 3 # of units w/ TDR up-zone (based on buildable area) 69 # of units w/ TDR up-zone (based on buildable area) 69 # of units w/ TDR up-zone (based on buildable area) 69 # of Total Units 72 # of Total Units 72 # of Total Units 72 Average Market Rate Unit Size (3) 2,000 Average Market Rate Unit Size (3) 2,000 Average Market Rate Unit Size (3) 2,000 Average Affordable Rate Unit Size (3) Average Affordable Rate Unit Size (3) 1,500 Average Affordable Rate Unit Size (3) 1,500 Building Revenue Assumption Total Building Revenue Assumption Total Building Revenue Assumption Total Residential Residential Residential Market Rate Units 100% 69 Market Rate Units 85% 58 Market Rate Units 70% 48 Average Sale Price / sqft (4) $434 Average Sale Price / sqft (4) $434 Average Sale Price / sqft (4) $434 Average Unit Sale Price (4) $868,500 Average Unit Sale Price (4) $868,500 Average Unit Sale Price (4) $868,500 Affordable Units 0% 0 Affordable Units 15% 10 Affordable Units 30% 21 Area Median Income (4-person HH) Area Median Income (4-person HH) $64,700 Area Median Income (4-person HH) $64,700 Income Category (% of AMI) Income Category (% of AMI) % Income Category (% of AMI) % Sales Price Sales Price $330,000 Sales Price $330,000 Total Project Revenue 59,718,060 Total Project Revenue 54,163,971 Total Project Revenue 48,609,882 Land (per acre and total, see note 5) $100,000 2,600,000 Land (per acre and total, see note 5) $100,000 2,600,000 Land (per acre and total, see note 5) $100,000 2,600,000 Value of TDR's (6) 15,553,887 Value of TDR's (6) 12,488,410 Value of TDR's (6) 9,422,838 Total Land Value 18,153,887 Total Land Value 15,088,410 Total Land Value 12,022,838 Building Construction Building Construction Building Construction Res. Construction Costs per sqft $120 16,502,400 Res. Construction Costs per sqft $120 15,883,560 Res. Construction Costs per sqft $120 15,264,720 Site Development Costs (7) 15% 2,475,360 Site Development Costs (7) 15% 2,382,534 Site Development Costs (7) 15% 2,289,708 Comm. Construction Costs per sqft $80 0 Comm. Construction Costs per sqft $80 0 Comm. Construction Costs per sqft $80 0 (8) 25% 5,394,440 (8) 25% 5,216,524 (8) 25% 5,038,607 Developer Fee (9) 3% 1,791,542 Developer Fee (9) 3% 1,624,919 Developer Fee (9) 3% 1,458,296 Financing Financing Financing Debt Financing (10) 3,456,775 Debt Financing (10) 3,135,284 Debt Financing (10) 2,813,785 Equity Partner Financing (see profit spilt below, note 11) Equity Partner Financing (see profit spilt below, note 11) Equity Partner Financing (see profit spilt below, note 11) Marketing (% of Tot.Rev) 2.5% 1,492,952 Marketing (% of Tot.Rev) 2.5% 1,354,099 Marketing (% of Tot.Rev) 2.5% 1,215,247 Commission & Closing Costs (% of Tot.Rev) 2.5% 1,492,952 Commission & Closing Costs (% of Tot.Rev) 2.5% 1,354,099 Commission & Closing Costs (% of Tot.Rev) 2.5% 1,215,247 Total 50,760,307 Total 46,039,430 Total 41,318,448 Net Profit 8,957,753 Net Profit 8,124,541 Net Profit 7,291,434 Net Profit as a % of Revenues (11) 15.0% Net Profit as a % of Revenues (11) 15.0% Net Profit as a % of Revenues (11) 15.0% (Profit Split: 20% to developer and 80% to equity partner) (Profit Split: 20% to developer and 80% to equity partner) (Profit Split: 20% to developer and 80% to equity partner) Developer Funds Available for TDRs Developer Funds Available for TDRs Developer Funds Available for TDRs Total Value of TDR's (from above) 15,553,887 Total Value of TDR's (from above) 12,488,410 Total Value of TDR's (from above) 9,422,838 Less Pre-Development Agreement Land Payment (12) 5% 2,985,903 Less Pre-Development Agreement Land Payment (12) 5% 2,708,199 Less Pre-Development Agreement Land Payment (12) 5% 2,430,494 Developers' Total Willingness to Pay for TDRs 12,567,984 Developers' Total Willingness to Pay for TDRs 9,780,212 Developers' Total Willingness to Pay for TDRs 6,992,343 Per unit Willingness to PAY for TDR 182,780 Per unit Willingness to PAY for TDR 142,237 Per unit Willingness to PAY for TDR 101,692 (1) 60% of total parcel(s) size, because of minimal sight constraints (1) 60% of total parcel(s) size (1) 60% of total parcel(s) size (2) Estimated allowed up-zoning based on surrounding landuses and densities (2) Estimated allowed up-zoning based on surrounding landuses and densities (2) Estimated allowed up-zoning based on surrounding landuses and densities (3) Average size for a single family detached unit at 4.6 units/acre (3) Average size for a single family detached unit at 4.6 units/acre (3) Average size for a single family detached unit at 4.6 units/acre (4) Based on surrounding like sales from dataquick, MLS, County Assessor (4) Based on surrounding like sales from dataquick, MLS, County Assessor (4) Based on surrounding like sales from dataquick, MLS, County Assessor (5) Determined from sales of property with like zoning (Ag land inside UGB assumed to sell at $100k/acre) (5) Determined from sales of property with like zoning (Ag land inside UGB assumed to sell at $100k/acre) (5) Determined from sales of property with like zoning (Ag land inside UGB assumed to sell at $100k/acre) (6) Added value to the land with TDR up-zone; determined by a fixed net profit of 15% (6) Added value to the land with TDR up-zone; determined by a fixed net profit of 15% (6) Added value to the land with TDR up-zone; determined by a fixed net profit of 15% (7) % construction costs for grading, sewer, water, and roads (more constrained sites face greater site costs) (7) % construction costs for grading, sewer, water, and roads (more constrained sites face greater site costs) (7) % construction costs for grading, sewer, water, and roads (more constrained sites face greater site costs) (8) % of direct costs that includes permitting costs, impact fees, legal, insurance and design costs (8) % of direct costs that includes permitting costs, impact fees, legal, insurance and design costs (8) % of direct costs that includes permitting costs, impact fees, legal, insurance and design costs (9) % of revenue developers charge to cover project overhead (9) % of revenue developers charge to cover project overhead (9) % of revenue developers charge to cover project overhead (10) Assumes bank loans 75% of total project costs, with a linear draw; interest payment 7% on 60% of this amount for 2 years (10) Assumes bank loans 75% of total project costs, with a linear draw; interest payment 7% on 60% of this amount for 2 years (10) Assumes bank loans 75% of total project costs, with a linear draw; interest payment 7% on 60% of this am (11) Private equity investors expect 80% split of net profit with no 'preferred return' payments during development period (11) Private equity investors expect 80% split of net profit with no 'preferred return' payments during development period (11) Private equity investors expect 80% split of net profit with no 'preferred return' payments during developm (12) % of total revenue landowner receives as payment above baseline land costs in a pre-development agreement; (12) % of total revenue landowner receives as payment above baseline land costs in a pre-development agreement; (12) % of total revenue landowner receives as payment above baseline land costs in a pre-development agre this amount compensates receiving site land owner for capitalized land value with a TDR up-zone this amount compensates receiving site land owner for capitalized land value with a TDR up-zone this amount compensates receiving site land owner for capitalized land value with a TDR up-zone 5
41 Appendix D: Secondary Screening - Developer Willingness to Pay for TDRs Appendix D: Secondary Screening - Developer Willingness to Pay for TDRs Appendix D: Secondary Screening - Developer Willingness to Pay for TDRs Unincorporated South Coast MTD Site Unincorporated South Coast MTD Site Unincorporated South Coast MTD Site 100% residential market rate single family units Mixed Income ( 85% market rate, 15% affordable workforce units) single family units Mixed Income ( 70% market rate, 30% affordable workforce units) single family units Site Characteristics Site Characteristics Site Characteristics Parcel(s) Size 19 Parcel(s) Size 19 Parcel(s) Size 19 Buildable Area (1) 17.2 Buildable Area (1) 17.2 Buildable Area (1) 17.2 Existing Zoning Ag - 5 Existing Zoning Ag - 5 Existing Zoning Ag - 5 TDR Re-zone / Up-zone (2) 4.6 units/ac TDR Re-zone / Up-zone (2) 4.6 units/ac TDR Re-zone / Up-zone (2) 4.6 units/ac Development Program Development Program Development Program Residential Residential Residential # of units w/ existing zoning 3 # of units w/ existing zoning 3 # of units w/ existing zoning 3 # of units w/ TDR up-zone (based on buildable area) 76 # of units w/ TDR up-zone (based on buildable area) 76 # of units w/ TDR up-zone (based on buildable area) 76 # of Total Units 79 # of Total Units 79 # of Total Units 79 Average Market Rate Unit Size (3) 2,000 Average Market Rate Unit Size (3) 2,000 Average Market Rate Unit Size (3) 2,000 Average Affordable Rate Unit Size (3) Average Affordable Rate Unit Size (3) 1,500 Average Affordable Rate Unit Size (3) 1,500 Building Revenue Assumption Total Building Revenue Assumption Total Building Revenue Assumption Total Residential Residential Residential Market Rate Units 100% 76 Market Rate Units 85% 65 Market Rate Units 70% 53 Average Sale Price / sqft (4) $434 Average Sale Price / sqft (4) $434 Average Sale Price / sqft (4) $434 Average Unit Sale Price (4) $868,500 Average Unit Sale Price (4) $868,500 Average Unit Sale Price (4) $868,500 Affordable Units 0% 0 Affordable Units 15% 11 Affordable Units 30% 23 Area Median Income (4-person HH) Area Median Income (4-person HH) $64,700 Area Median Income (4-person HH) $64,700 Income Category (% of AMI) Income Category (% of AMI) % Income Category (% of AMI) % Sales Price Sales Price $330,000 Sales Price $330,000 Total Project Revenue 66,110,220 Total Project Revenue 59,961,627 Total Project Revenue 53,813,034 Land (per acre and total, see note 5) $100,000 1,900,000 Land (per acre and total, see note 5) $100,000 1,900,000 Land (per acre and total, see note 5) $100,000 1,900,000 Value of TDR's (6) 18,441,742 Value of TDR's (6) 15,047,985 Value of TDR's (6) 11,654,225 Total Land Value 20,341,742 Total Land Value 16,947,985 Total Land Value 13,554,225 Building Construction Building Construction Building Construction Res. Construction Costs per sqft $120 18,268,800 Res. Construction Costs per sqft $120 17,583,720 Res. Construction Costs per sqft $120 16,898,640 Site Development Costs (7) 15% 2,740,320 Site Development Costs (7) 15% 2,637,558 Site Development Costs (7) 15% 2,534,796 Comm. Construction Costs per sqft $80 0 Comm. Construction Costs per sqft $80 0 Comm. Construction Costs per sqft $80 0 (8) 25% 5,727,280 (8) 25% 5,530,320 (8) 25% 5,333,359 Developer Fee (9) 3% 1,983,307 Developer Fee (9) 3% 1,798,849 Developer Fee (9) 3% 1,614,391 Financing Financing Financing Debt Financing (10) 3,826,793 Debt Financing (10) 3,470,878 Debt Financing (10) 3,114,962 Equity Partner Financing (see profit spilt below, note 11) Equity Partner Financing (see profit spilt below, note 11) Equity Partner Financing (see profit spilt below, note 11) Marketing (% of Tot.Rev) 2.5% 1,652,756 Marketing (% of Tot.Rev) 2.5% 1,499,041 Marketing (% of Tot.Rev) 2.5% 1,345,326 Commission & Closing Costs (% of Tot.Rev) 2.5% 1,652,756 Commission & Closing Costs (% of Tot.Rev) 2.5% 1,499,041 Commission & Closing Costs (% of Tot.Rev) 2.5% 1,345,326 Total 56,193,753 Total 50,967,391 Total 45,741,025 Net Profit 9,916,467 Net Profit 8,994,236 Net Profit 8,072,009 Net Profit as a % of Revenues (11) 15.0% Net Profit as a % of Revenues (11) 15.0% Net Profit as a % of Revenues (11) 15.0% (Profit Split: 20% to developer and 80% to equity partner) (Profit Split: 20% to developer and 80% to equity partner) (Profit Split: 20% to developer and 80% to equity partner) Developer Funds Available for TDRs Developer Funds Available for TDRs Developer Funds Available for TDRs Total Value of TDR's (from above) 18,441,742 Total Value of TDR's (from above) 15,047,985 Total Value of TDR's (from above) 11,654,225 Less Pre-Development Agreement Land Payment (12) 5% 3,305,511 Less Pre-Development Agreement Land Payment (12) 5% 2,998,081 Less Pre-Development Agreement Land Payment (12) 5% 2,690,652 Developers' Total Willingness to Pay for TDRs 15,136,231 Developers' Total Willingness to Pay for TDRs 12,049,904 Developers' Total Willingness to Pay for TDRs 8,963,574 Per unit Willingness to PAY for TDR 198,847 Per unit Willingness to PAY for TDR 158,301 Per unit Willingness to PAY for TDR 117,756 (1) 90% of total parcel(s) size as identified by County in Afforadability Re-Zone List A (1) 90% of total parcel(s) size as identified by County in Afforadability Re-Zone List A (1) 90% of total parcel(s) size as identified by County in Afforadability Re-Zone List A (2) Estimated allowed up-zoning based on surrounding landuses and densities (2) Estimated allowed up-zoning based on surrounding landuses and densities (2) Estimated allowed up-zoning based on surrounding landuses and densities (3) Average size for a single family detached unit at 4.6 units/acre (3) Average size for a single family detached unit at 4.6 units/acre (3) Average size for a single family detached unit at 4.6 units/acre (4) Based on surrounding like sales from dataquick, MLS, County Assessor (4) Based on surrounding like sales from dataquick, MLS, County Assessor (4) Based on surrounding like sales from dataquick, MLS, County Assessor (5) Determined from sales of property with like zoning (Ag land inside UGB assumed to sell at $100k/acre) (5) Determined from sales of property with like zoning (Ag land inside UGB assumed to sell at $100k/acre) (5) Determined from sales of property with like zoning (Ag land inside UGB assumed to sell at $100k/acre) (6) Added value to the land with TDR up-zone; determined by a fixed net profit of 15% (6) Added value to the land with TDR up-zone; determined by a fixed net profit of 15% (6) Added value to the land with TDR up-zone; determined by a fixed net profit of 15% (7) % construction costs for grading, sewer, water, and roads (more constrained sites face greater site costs) (7) % construction costs for grading, sewer, water, and roads (more constrained sites face greater site costs) (7) % construction costs for grading, sewer, water, and roads (more constrained sites face greater site costs) (8) % of direct costs that includes permitting costs, impact fees, legal, insurance and design costs (8) % of direct costs that includes permitting costs, impact fees, legal, insurance and design costs (8) % of direct costs that includes permitting costs, impact fees, legal, insurance and design costs (9) % of revenue developers charge to cover project overhead (9) % of revenue developers charge to cover project overhead (9) % of revenue developers charge to cover project overhead (10) Assumes bank loans 75% of total project costs, with a linear draw; interest payment 7% on 60% of this amount for 2 years (10) Assumes bank loans 75% of total project costs, with a linear draw; interest payment 7% on 60% of this amount for 2 years (10) Assumes bank loans 75% of total project costs, with a linear draw; interest payment 7% on 60% of this am (11) Private equity investors expect 80% split of net profit with no 'preferred return' payments during development period (11) Private equity investors expect 80% split of net profit with no 'preferred return' payments during development period (11) Private equity investors expect 80% split of net profit with no 'preferred return' payments during developm (12) % of total revenue landowner receives as payment above baseline land costs in a pre-development agreement; (12) % of total revenue landowner receives as payment above baseline land costs in a pre-development agreement; (12) % of total revenue landowner receives as payment above baseline land costs in a pre-development agre this amount compensates receiving site land owner for capitalized land value with a TDR up-zone this amount compensates receiving site land owner for capitalized land value with a TDR up-zone this amount compensates receiving site land owner for capitalized land value with a TDR up-zone 6
42 Appendix D: Secondary Screening - Developer Willingness to Pay for TDRs Appendix D: Secondary Screening - Developer Willingness to Pay for TDRs Appendix D: Secondary Screening - Developer Willingness to Pay for TDRs Unincorporated South Coast Cathedral Oaks County Campus Unincorporated South Coast Cathedral Oaks County Campus Unincorporated South Coast Cathedral Oaks County Campus 100% residential market rate single family units Mixed Income ( 85% market rate, 15% affordable workforce units) single family units Mixed Income ( 70% market rate, 30% affordable workforce units) single family units Site Characteristics Site Characteristics Site Characteristics Parcel(s) Size Parcel(s) Size Parcel(s) Size Buildable Area (1) 22 Buildable Area (1) 22 Buildable Area (1) 22 Existing Zoning REC Existing Zoning REC Existing Zoning REC TDR Re-zone / Up-zone (2) 3.3 units/ac TDR Re-zone / Up-zone (2) 3.3 units/ac TDR Re-zone / Up-zone (2) 3.3 units/ac Development Program Development Program Development Program Residential Residential Residential # of units w/ existing zoning 0 # of units w/ existing zoning 0 # of units w/ existing zoning 0 # of units w/ TDR up-zone (based on buildable area) 73 # of units w/ TDR up-zone (based on buildable area) 73 # of units w/ TDR up-zone (based on buildable area) 73 # of Total Units 73 # of Total Units 73 # of Total Units 73 Average Market Rate Unit Size (3) 3,000 Average Market Rate Unit Size (3) 3,000 Average Market Rate Unit Size (3) 3,000 Average Affordable Rate Unit Size (3) Average Affordable Rate Unit Size (3) 1,500 Average Affordable Rate Unit Size (3) 1,500 Building Revenue Assumption Total Building Revenue Assumption Total Building Revenue Assumption Total Residential Residential Residential Market Rate Units 100% 73 Market Rate Units 85% 62 Market Rate Units 70% 51 Average Sale Price / sqft (4) $475 Average Sale Price / sqft (4) $475 Average Sale Price / sqft (4) $475 Average Unit Sale Price (4) ######### Average Unit Sale Price (4) $1,425,000 Average Unit Sale Price (4) $1,425,000 Affordable Units 0% 0 Affordable Units 15% 11 Affordable Units 30% 22 Area Median Income (4-person HH) Area Median Income (4-person HH) $64,700 Area Median Income (4-person HH) $64,700 Income Category (% of AMI) Income Category (% of AMI) % Income Category (% of AMI) % Sales Price Sales Price $330,000 Sales Price $330,000 Total Project Revenue 103,455,000 Total Project Revenue 91,530,450 Total Project Revenue 79,605,900 Land (per acre and total, see note 5) $100,000 2,200,000 Land (per acre and total, see note 5) $100,000 2,200,000 Land (per acre and total, see note 5) $100,000 2,200,000 Value of TDR's (6) 33,351,456 Value of TDR's (6) 27,677,581 Value of TDR's (6) 22,003,672 Total Land Value 35,551,456 Total Land Value 29,877,581 Total Land Value 24,203,672 Building Construction Building Construction Building Construction Res. Construction Costs per sqft $120 26,136,000 Res. Construction Costs per sqft $120 24,175,800 Res. Construction Costs per sqft $120 22,215,600 Site Development Costs (7) 15% 3,920,400 Site Development Costs (7) 15% 3,626,370 Site Development Costs (7) 15% 3,332,340 Comm. Construction Costs per sqft $80 0 Comm. Construction Costs per sqft $80 0 Comm. Construction Costs per sqft $80 0 (8) 25% 8,064,100 (8) 25% 7,500,543 (8) 25% 6,936,985 Developer Fee (9) 3% 3,103,650 Developer Fee (9) 3% 2,745,914 Developer Fee (9) 3% 2,388,177 Financing Financing Financing Debt Financing (10) 5,988,497 Debt Financing (10) 5,298,244 Debt Financing (10) 4,607,988 Equity Partner Financing (see profit spilt below, note 11) Equity Partner Financing (see profit spilt below, note 11) Equity Partner Financing (see profit spilt below, note 11) Marketing (% of Tot.Rev) 2.5% 2,586,375 Marketing (% of Tot.Rev) 2.5% 2,288,261 Marketing (% of Tot.Rev) 2.5% 1,990,148 Commission & Closing Costs (% of Tot.Rev) 2.5% 2,586,375 Commission & Closing Costs (% of Tot.Rev) 2.5% 2,288,261 Commission & Closing Costs (% of Tot.Rev) 2.5% 1,990,148 Total 87,936,853 Total 77,800,974 Total 67,665,058 Net Profit 15,518,147 Net Profit 13,729,476 Net Profit 11,940,842 Net Profit as a % of Revenues (11) 15.0% Net Profit as a % of Revenues (11) 15.0% Net Profit as a % of Revenues (11) 15.0% (Profit Split: 20% to developer and 80% to equity partner) (Profit Split: 20% to developer and 80% to equity partner) (Profit Split: 20% to developer and 80% to equity partner) Developer Funds Available for TDRs Developer Funds Available for TDRs Developer Funds Available for TDRs Total Value of TDR's (from above) 33,351,456 Total Value of TDR's (from above) 27,677,581 Total Value of TDR's (from above) 22,003,672 Less Pre-Development Agreement Land Payment (12) 5% 5,172,750 Less Pre-Development Agreement Land Payment (12) 5% 4,576,523 Less Pre-Development Agreement Land Payment (12) 5% 3,980,295 Developers' Total Willingness to Pay for TDRs 28,178,706 Developers' Total Willingness to Pay for TDRs 23,101,059 Developers' Total Willingness to Pay for TDRs 18,023,377 Per unit Willingness to PAY for TDR 388,136 Per unit Willingness to PAY for TDR 318,196 Per unit Willingness to PAY for TDR 248,256 (1) 58% of total parcel(s) size; 22 acres identified in County's inventory List A as potential sites to be Re-zoned for Affordability (1) 58% of total parcel(s) size; 22 acres identified in County's inventory List A as potential sites to be Re-zoned for Affordability (1) 58% of total parcel(s) size; 22 acres identified in County's inventory List A as potential sites to be Re-zoned for Afforda (2) Estimated allowed up-zoning based on surrounding landuses and densities (2) Estimated allowed up-zoning based on surrounding landuses and densities (2) Estimated allowed up-zoning based on surrounding landuses and densities (3) Average size for a single family detached unit at 3.3 units/acre (3) Average size for a single family detached unit at 3.3 units/acre (3) Average size for a single family detached unit at 3.3 units/acre (4) Based on surrounding like sales from dataquick, MLS, County Assessor (4) Based on surrounding like sales from dataquick, MLS, County Assessor (4) Based on surrounding like sales from dataquick, MLS, County Assessor (5) Determined from sales of property with like zoning (Ag and REC land inside UGB assumed to sell at $100k/acre) (5) Determined from sales of property with like zoning (Ag and REC land inside UGB assumed to sell at $100k/acre) (5) Determined from sales of property with like zoning (Ag and REC land inside UGB assumed to sell at $100k/acre) (6) Added value to the land with TDR up-zone; determined by a fixed net profit of 15% (6) Added value to the land with TDR up-zone; determined by a fixed net profit of 15% (6) Added value to the land with TDR up-zone; determined by a fixed net profit of 15% (7) % construction costs for grading, sewer, water, and roads (more constrained sites face greater site costs) (7) % construction costs for grading, sewer, water, and roads (more constrained sites face greater site costs) (7) % construction costs for grading, sewer, water, and roads (more constrained sites face greater site costs) (8) % of direct costs that includes permitting costs, impact fees, legal, insurance and design costs (8) % of direct costs that includes permitting costs, impact fees, legal, insurance and design costs (8) % of direct costs that includes permitting costs, impact fees, legal, insurance and design costs (9) % of revenue developers charge to cover project overhead (9) % of revenue developers charge to cover project overhead (9) % of revenue developers charge to cover project overhead (10) Assumes bank loans 75% of total project costs, with a linear draw; interest payment 7% on 60% of this amount for 2 years (10) Assumes bank loans 75% of total project costs, with a linear draw; interest payment 7% on 60% of this amount for 2 years (10) Assumes bank loans 75% of total project costs, with a linear draw; interest payment 7% on 60% of this amount for 2 y (11) Private equity investors expect 80% split of net profit with no 'preferred return' payments during development period (11) Private equity investors expect 80% split of net profit with no 'preferred return' payments during development period (11) Private equity investors expect 80% split of net profit with no 'preferred return' payments during development period (12) % of total revenue landowner receives as payment above baseline land costs in a pre-development agreement; (12) % of total revenue landowner receives as payment above baseline land costs in a pre-development agreement; (12) % of total revenue landowner receives as payment above baseline land costs in a pre-development agreement; this amount compensates receiving site land owner for capitalized land value with a TDR up-zone this amount compensates receiving site land owner for capitalized land value with a TDR up-zone this amount compensates receiving site land owner for capitalized land value with a TDR up-zone 7
43 Appendix D: Secondary Screening - Willingness to Pay for TDRs Appendix D: Secondary Screening - Willingness to Pay for TDRs Appendix D: Secondary Screening - Willingness to Pay for TDRs Unincorporated South Coast: St Vincents - West Unincorporated South Coast: St Vincents - West Unincorporated South Coast: St Vincents - West 100% residential market rate single family units Mixed Income ( 85% market rate, 15% affordable workforce units) single family units Mixed Income ( 70% market rate, 30% affordable workforce units) single family units Site Characteristics Site Characteristics Site Characteristics Parcel(s) Size Parcel(s) Size Parcel(s) Size Buildable Area (1) 60% 20 Buildable Area (1) 60% 20 Buildable Area (1) 60% 20 Existing Zoning DR - 1 Existing Zoning DR - 1 Existing Zoning DR - 1 TDR Re-zone / Up-zone (2) 3.3 TDR Re-zone / Up-zone (2) 3.3 TDR Re-zone / Up-zone (2) 3.3 Development Program Development Program Development Program Residential Residential Residential # of units w/ existing zoning (including east parcel) 20 # of units w/ existing zoning (including east parcel) 20 # of units w/ existing zoning (including east parcel) 20 # of units w/ TDR up-zone (based on buildable area) 46 # of units w/ TDR up-zone (based on buildable area) 46 # of units w/ TDR up-zone (based on buildable area) 46 # of Total Units 66 # of Total Units 66 # of Total Units 66 Average Market Rate Unit Size (3) 3,000 Average Market Rate Unit Size (3) 3,000 Average Market Rate Unit Size (3) 3,000 Average Affordable Rate Unit Size (3) Average Affordable Rate Unit Size (3) 1,500 Average Affordable Rate Unit Size (3) 1,500 Building Revenue Assumption Total Building Revenue Assumption Total Building Revenue Assumption Total Residential Residential Residential Market Rate Units 100% 66 Market Rate Units 85% 56 Market Rate Units 70% 46 Average Sale Price / sqft (4) $475 Average Sale Price / sqft (4) $475 Average Sale Price / sqft (4) $475 Average Unit Sale Price (4) $1,425,000 Average Unit Sale Price (4) $1,425,000 Average Unit Sale Price (4) $1,425,000 Affordable Units 0% 0 Affordable Units 15% 10 Affordable Units 30% 20 Area Median Income (4-person HH) Area Median Income (4-person HH) $64,700 Area Median Income (4-person HH) $64,700 Income Category (% of AMI) Income Category (% of AMI) % Income Category (% of AMI) % Sales Price Sales Price $330,000 Sales Price $330,000 Sub Total Project Revenue 94,068,810 Sub Total Project Revenue 83,226,142 Sub Total Project Revenue 72,383,474 less revenue at exsitng zoning 28,505,700 less revenue at exsitng zoning 28,505,700 less revenue at exsitng zoning 28,505,700 Total TDR Project Revenue 65,563,110 Total TDR Project Revenue 54,720,442 Total TDR Project Revenue 43,877,774 0 Land (per acre and total, see note 5) $256,266 8,543,916 Land (per acre and total, see note 5) $256,266 8,543,916 Land (per acre and total, see note 5) $256,266 8,543,916 Value of TDR's (6) 23,666,507 Value of TDR's (6) 18,255,974 Value of TDR's (6) 12,845,518 Total Land Value 32,210,423 Total Land Value 26,799,890 Total Land Value 21,389,434 Building Construction Building Construction Building Construction Res. Construction Costs per sqft $120 23,764,752 Res. Construction Costs per sqft $120 21,982,396 Res. Construction Costs per sqft $120 20,200,039 Site Development Costs (7) 15% 3,564,713 Site Development Costs (7) 15% 3,297,359 Site Development Costs (7) 15% 3,030,006 Comm. Construction Costs per sqft $80 0 Comm. Construction Costs per sqft $80 0 Comm. Construction Costs per sqft $80 0 (8) 25% 8,968,345 (8) 25% 8,455,918 (8) 25% 7,943,490 Developer Fee (9) 3% 2,822,064 Developer Fee (9) 3% 2,496,784 Developer Fee (9) 3% 2,171,504 Financing Financing Financing Debt Financing (10) 5,563,763 Debt Financing (10) 4,916,523 Debt Financing (10) 4,269,289 Equity Partner Financing (see profit spilt below, note 11) Equity Partner Financing (see profit spilt below, note 11) Equity Partner Financing (see profit spilt below, note 11) Marketing (% of Tot.Rev) 2.5% 2,351,720 Marketing (% of Tot.Rev) 2.5% 2,080,654 Marketing (% of Tot.Rev) 2.5% 1,809,587 Commission,& Closing Costs (% of Tot.Rev) 2.5% 712,643 Commission,& Closing Costs (% of Tot.Rev) 2.5% 712,643 Commission,& Closing Costs (% of Tot.Rev) 2.5% 712,643 Sub Total 79,958,423 Sub Total 70,742,166 Sub Total 61,525,992 less costs at exsitng zoning 24,229,845 less costs at exsitng zoning 24,229,845 less costs at exsitng zoning 24,229,845 Total TDR 55,728,578 Total TDR 46,512,321 Total TDR 37,296,147 Net Profit (additional w/ TDR) 9,834,532 Net Profit (additional w/ TDR) 8,208,121 Net Profit (additional w/ TDR) 6,581,627 Net TDR Profit as a % of Revenues (11) 15.0% Net TDR Profit as a % of Revenues (11) 15.0% Net TDR Profit as a % of Revenues (11) 15.0% (Profit Split: 20% to developer and 80% to equity partner) (Profit Split: 20% to developer and 80% to equity partner) (Profit Split: 20% to developer and 80% to equity partner) Developer Funds Available for TDRs Developer Funds Available for TDRs Developer Funds Available for TDRs Total Value of TDR's (from above) 23,666,507 Total Value of TDR's (from above) 18,255,974 Total Value of TDR's (from above) 12,845,518 Less Pre-Development Agreement Land Payment (12) 5% 3,278,156 Less Pre-Development Agreement Land Payment (12) 5% 2,736,022 Less Pre-Development Agreement Land Payment (12) 5% 2,193,889 Developers' Total Willingness to Pay for TDRs 20,388,351 Developers' Total Willingness to Pay for TDRs 15,519,952 Developers' Total Willingness to Pay for TDRs 10,651,629 Per unit Willingness to PAY for TDR 443,136 Per unit Willingness to PAY for TDR 337,323 Per unit Willingness to PAY for TDR 231,511 (1) 60% of total parcel size (1) 60% of total parcel size (1) 60% of total parcel size (2) Estimated allowed up-zoning based on surrounding landuses and densities (2) Estimated allowed up-zoning based on surrounding landuses and densities (2) Estimated allowed up-zoning based on surrounding landuses and densities (3) Average size for a single family detached unit at 3.3 units/acre (3) Average size for a single family detached unit at 3.3 units/acre (3) Average size for a single family detached unit at 3.3 units/acre (4) Based on surrounding like sales from dataquick, MLS, County Assessor (4) Based on surrounding like sales from dataquick, MLS, County Assessor (4) Based on surrounding like sales from dataquick, MLS, County Assessor (5) Determined by setting TDR value to zero with net profit of 15% at existing zoning; (5) Determined by setting TDR value to zero with net profit of 15% at existing zoning; (5) Determined by setting TDR value to zero with net profit of 15% at existing zoning; sites have higher land prices with residential zoning sites have higher land prices with residential zoning sites have higher land prices with residential zoning (6) Added value to the land with TDR up-zone; determined by a fixed net profit of 15% (6) Added value to the land with TDR up-zone; determined by a fixed net profit of 15% (6) Added value to the land with TDR up-zone; determined by a fixed net profit of 15% (7) % construction costs for grading, sewer, water, and roads (more constrained sites face greater site costs) (7) % construction costs for grading, sewer, water, and roads (more constrained sites face greater site costs) (7) % construction costs for grading, sewer, water, and roads (more constrained sites face greater site costs) (8) % of direct costs that includes permitting costs, impact fees, legal, insurance and design costs (8) % of direct costs that includes permitting costs, impact fees, legal, insurance and design costs (8) % of direct costs that includes permitting costs, impact fees, legal, insurance and design costs (9) % of revenue developers charge to cover project overhead (9) % of revenue developers charge to cover project overhead (9) % of revenue developers charge to cover project overhead (10) Assumes bank loans 75% of total project costs, with a linear draw; interest payment 7% on 60% of this amount for 2 years (10) Assumes bank loans 75% of total project costs, with a linear draw; interest payment 7% on 60% of this amount for 2 years (10) Assumes bank loans 75% of total project costs, with a linear draw; interest payment 7% on 60% of this am (11) Private equity investors expect 80% split of net profit with no 'preferred return' payments during development period (11) Private equity investors expect 80% split of net profit with no 'preferred return' payments during development period (11) Private equity investors expect 80% split of net profit with no 'preferred return' payments during developm (12) % of total revenue landowner receives as payment above baseline land costs in a pre-development agreement; (12) % of total revenue landowner receives as payment above baseline land costs in a pre-development agreement; (12) % of total revenue landowner receives as payment above baseline land costs in a pre-development agree this amount compensates receiving site land owner for capitalized land value with a TDR up-zone this amount compensates receiving site land owner for capitalized land value with a TDR up-zone this amount compensates receiving site land owner for capitalized land value with a TDR up-zone 8
44 Appendix D: Secondary Screening - Developer Willingness to Pay for TDRs Appendix D: Secondary Screening - Developer Willingness to Pay for TDRs Appendix D: Secondary Screening - Developer Willingness to Pay for TDRs Unincorporatd South Coast More Mesa - east (14d) Unincorporatd South Coast More Mesa - east (14d) Unincorporatd South Coast More Mesa - east (14d) 100% residential market rate single family units Mixed Income ( 85% market rate, 15% affordable workforce units) single family units Mixed Income ( 70% market rate, 30% affordable workforce units) single family units Site Characteristics Site Characteristics Site Characteristics Parcel(s) Size 265 Parcel(s) Size 265 Parcel(s) Size 265 Buildable Area (1) 40.5 Buildable Area (1) 40.5 Buildable Area (1) 40.5 Existing Zoning RES 1.8, 3.3,.7 Existing Zoning RES 1.8, 3.3,.7 Existing Zoning RES 1.8, 3.3,.7 TDR Re-zone / Up-zone (2) RES 3.3, 0, 1.8 TDR Re-zone / Up-zone (2) RES 3.3, 0, 1.8 TDR Re-zone / Up-zone (2) RES 3.3, 0, 1.8 Development Program Development Program Development Program Residential Residential Residential # of units w/ existing zoning 70 # of units w/ existing zoning 70 # of units w/ existing zoning 70 # of units w/ TDR up-zone (based on buildable area) 23 # of units w/ TDR up-zone (based on buildable area) 23 # of units w/ TDR up-zone (based on buildable area) 23 # of Total Units 93 # of Total Units 93 # of Total Units 93 Average Market Rate Unit Size (3) 3,000 Average Market Rate Unit Size (3) 3,000 Average Market Rate Unit Size (3) 3,000 Average Affordable Rate Unit Size (3) 1,500 Average Affordable Rate Unit Size (3) 1,500 Average Affordable Rate Unit Size (3) 1,500 Building Revenue Assumption Total Building Revenue Assumption Total Building Revenue Assumption Total Residential Residential Residential Market Rate Units 100% 93 Market Rate Units 85% 79 Market Rate Units 70% 65 Average Sale Price / sqft (4) $675 Average Sale Price / sqft (4) $675 Average Sale Price / sqft (4) $675 Average Unit Sale Price (4) $2,025,000 Average Unit Sale Price (4) $2,025,000 Average Unit Sale Price (4) $2,025,000 Affordable Units 0% 0 Affordable Units 15% 14 Affordable Units 30% 28 Area Median Income (4-person HH) $64,700 Area Median Income (4-person HH) $64,700 Area Median Income (4-person HH) $64,700 Income Category (% of AMI) % Income Category (% of AMI) % Income Category (% of AMI) % Sales Price $330,000 Sales Price $330,000 Sales Price $330,000 Sub Total Project Revenue 188,325,000 Sub Total Project Revenue 164,679,750 Sub Total Project Revenue 141,034,500 less revenue at existing zoning 141,750,000 less revenue at existing zoning 141,750,000 less revenue at existing zoning 141,750,000 Total TDR Project Revenue 46,575,000 Total TDR Project Revenue 22,929,750 Total TDR Project Revenue -715,500 Land (per acre and total, see note 5) $1,216,144 49,253,844 Land (per acre and total, see note 5) $1,216,144 49,253,844 Land (per acre and total, see note 5) $1,216,144 49,253,844 Value of TDR's (6) 21,309,426 Value of TDR's (6) 7,846,323 Value of TDR's (6) 0 Total Land Value 70,563,270 Total Land Value 57,100,167 Total Land Value 49,253,844 Building Construction Building Construction Building Construction Res. Construction Costs per sqft $120 33,480,000 Res. Construction Costs per sqft $120 30,969,000 Res. Construction Costs per sqft $120 28,458,000 Site Development Costs (7) 25% 8,370,000 Site Development Costs (7) 25% 7,742,250 Site Development Costs (7) 25% 7,114,500 Comm. Construction Costs per sqft $80 0 Comm. Construction Costs per sqft $80 0 Comm. Construction Costs per sqft $80 0 (8) 25% 22,775,961 (8) 25% 21,991,274 (8) 25% 21,206,586 Developer Fee (9) 3% 5,649,750 Developer Fee (9) 3% 4,940,393 Developer Fee (9) 3% 4,231,035 Financing Financing Financing Debt Financing (10) 10,985,441 Debt Financing (10) 9,573,960 Debt Financing (10) 8,600,589 Equity Partner Financing (see profit spilt below, note 11) Equity Partner Financing (see profit spilt below, note 11) Equity Partner Financing (see profit spilt below, note 11) Marketing (% of Tot.Rev) 2.5% 4,708,125 Marketing (% of Tot.Rev) 2.5% 4,116,994 Marketing (% of Tot.Rev) 2.5% 3,525,863 Commission,& Closing Costs (% of Tot.Rev) 2.5% 3,543,750 Commission,& Closing Costs (% of Tot.Rev) 2.5% 3,543,750 Commission,& Closing Costs (% of Tot.Rev) 2.5% 3,543,750 Sub Total 160,076,297 Sub Total 139,977,787 Sub Total 125,934,167 less costs at existing zoning 120,487,500 less costs at existing zoning 120,487,500 less costs at existing zoning 120,487,500 Total TDR 39,588,797 Total TDR 19,490,287 Total TDR 5,446,667 Net Profit (additional w/ TDR) 6,986,203 Net Profit (additional w/ TDR) 3,439,463 Net Profit (additional w/ TDR) -6,162,167 Net TDR Profit as a % of Revenues (11) 15.0% Net TDR Profit as a % of Revenues (11) 15.0% Net TDR Profit as a % of Revenues (11) 0.0% (Profit Split: 20% to developer and 80% to equity partner) (Profit Split: 20% to developer and 80% to equity partner) (Profit Split: 20% to developer and 80% to equity partner) Developer Funds Available for TDRs Developer Funds Available for TDRs Developer Funds Available for TDRs Total Value of TDR's (from above) 21,309,426 Total Value of TDR's (from above) 7,846,323 Total Value of TDR's (from above) 0 Less Pre-Development Agreement Land Payment (12) 5% 2,328,750 Less Pre-Development Agreement Land Payment (12) 5% 1,146,488 Less Pre-Development Agreement Land Payment (12) 5% -35,775 Developers' Total Willingness to Pay for TDRs 18,980,676 Developers' Total Willingness to Pay for TDRs 6,699,836 Developers' Total Willingness to Pay for TDRs 0 Per unit Willingness to PAY for TDR 825,247 Per unit Willingness to PAY for TDR 291,297 Per unit Willingness to PAY for TDR 0 (1) As identified in the More Mesa specific Plan with 40.5 acres of buildable area (1) As identified in the More Mesa specific Plan with 40.5 acres of buildable area (1) As identified in the More Mesa specific Plan with 40.5 acres of buildable area (2) Estimated allowed up-zoning based on surrounding landuses and densities (2) Estimated allowed up-zoning based on surrounding landuses and densities (2) Estimated allowed up-zoning based on surrounding landuses and densities (3) Average size for a single family detached unit at 1.8 units/acre (3) Average size for a single family detached unit at 1.8 units/acre (3) Average size for a single family detached unit at 1.8 units/acre (4) Based on surrounding like sales from dataquick, MLS, County Assessor (4) Based on surrounding like sales from dataquick, MLS, County Assessor (4) Based on surrounding like sales from dataquick, MLS, County Assessor (5) Determined by setting TDR value to zero with net profit of 15% at existing zoning; sites have higher land prices with residential z(5) Determined by setting TDR value to zero with net profit of 15% at existing zoning; sites have higher land prices with res(5) Determined by setting TDR value to zero with net profit of 15% at existing zoning; sites have higher land pric (6) Added value to the land with TDR up-zone; determined by a fixed net profit of 15% (6) Added value to the land with TDR up-zone; determined by a fixed net profit of 15% (6) Added value to the land with TDR up-zone; determined by a fixed net profit of 15% (7) % construction costs for grading, sewer, water, and roads (more constrained sites face greater site costs) (7) % construction costs for grading, sewer, water, and roads (more constrained sites face greater site costs) (7) % construction costs for grading, sewer, water, and roads (more constrained sites face greater site costs) (8) % of direct costs that includes permitting costs, impact fees, legal, insurance and design costs (8) % of direct costs that includes permitting costs, impact fees, legal, insurance and design costs (8) % of direct costs that includes permitting costs, impact fees, legal, insurance and design costs (9) % of revenue developers charge to cover project overhead (9) % of revenue developers charge to cover project overhead (9) % of revenue developers charge to cover project overhead (10) Assumes bank loans 75% of total project costs, with a linear draw; interest payment 7% on 60% of this amount for 2 years (10) Assumes bank loans 75% of total project costs, with a linear draw; interest payment 7% on 60% of this amount for 2 ye(10) Assumes bank loans 75% of total project costs, with a linear draw; interest payment 7% on 60% of this amo (11) Private equity investors expect 80% split of net profit with no 'preferred return' payments during development period (11) Private equity investors expect 80% split of net profit with no 'preferred return' payments during development period (11) Private equity investors expect 80% split of net profit with no 'preferred return' payments during developme (12) % of total revenue landowner receives as payment above baseline land costs in a pre-development agreement; (12) % of total revenue landowner receives as payment above baseline land costs in a pre-development agreement; (12) % of total revenue landowner receives as payment above baseline land costs in a pre-development agreem this amount compensates receiving site land owner for capitalized land value with a TDR up-zone this amount compensates receiving site land owner for capitalized land value with a TDR up-zone this amount compensates receiving site land owner for capitalized land value with a TDR up-zone 9
45 Appendix D: Secondary Screening - Developer Willingness to Pay for TDRs Appendix D: Secondary Screening - Developer Willingness to Pay for TDRs Appendix D: Secondary Screening - Developer Willingness to Pay for TDRs Unincorporated South Coast: Montecito Avocado Orchard - area 2 Unincorporated South Coast: Montecito Avocado Orchard - area 2 Unincorporated South Coast: Montecito Avocado Orchard - area 2 100% residential market rate single family units Mixed Income ( 85% market rate, 15% affordable workforce units) single family units Mixed Income ( 70% market rate, 30% affordable workforce units) single family units Site Characteristics Site Characteristics Site Characteristics Parcel(s) Size 30.5 Parcel(s) Size 30.5 Parcel(s) Size 30.5 Buildable Area (1) 60% 18.3 Buildable Area (1) 60% 18.3 Buildable Area (1) 60% 18.3 Existing Zoning Ag - 5 Existing Zoning Ag - 5 Existing Zoning Ag - 5 TDR Re-zone / Up-zone (2) 1.8 units/ac TDR Re-zone / Up-zone (2) 1.8 units/ac TDR Re-zone / Up-zone (2) 1.8 units/ac Development Program Development Program Development Program Residential Residential Residential # of units w/ existing zoning 3 # of units w/ existing zoning 3 # of units w/ existing zoning 3 # of units w/ TDR up-zone (based on buildable area) 30 # of units w/ TDR up-zone (based on buildable area) 30 # of units w/ TDR up-zone (based on buildable area) 30 # of Total Units 33 # of Total Units 33 # of Total Units 33 Average Market Rate Unit Size (3) 3,000 Average Market Rate Unit Size (3) 3,000 Average Market Rate Unit Size (3) 3,000 Average Affordable Rate Unit Size (3) Average Affordable Rate Unit Size (3) 1,500 Average Affordable Rate Unit Size (3) 1,500 Building Revenue Assumption Total Building Revenue Assumption Total Building Revenue Assumption Total Residential Residential Residential Market Rate Units 100% 30 Market Rate Units 85% 25 Market Rate Units 70% 21 Average Sale Price / sqft (4) $650 Average Sale Price / sqft (4) $650 Average Sale Price / sqft (4) $650 Average Unit Sale Price (4) $1,950,000 Average Unit Sale Price (4) $1,950,000 Average Unit Sale Price (4) $1,950,000 Affordable Units 0% 0 Affordable Units 15% 4 Affordable Units 30% 9 Area Median Income (4-person HH) Area Median Income (4-person HH) $64,700 Area Median Income (4-person HH) $64,700 Income Category (% of AMI) Income Category (% of AMI) % Income Category (% of AMI) % Sales Price Sales Price $330,000 Sales Price $330,000 Total Project Revenue 58,383,000 Total Project Revenue 51,107,580 Total Project Revenue 43,832,160 Land (per acre and total, see note 5) $150,000 4,575,000 Land (per acre and total, see note 5) $150,000 4,575,000 Land (per acre and total, see note 5) $150,000 4,575,000 Value of TDR's (6) 20,362,754 Value of TDR's (6) 17,505,916 Value of TDR's (6) 14,649,065 Total Land Value 24,937,754 Total Land Value 22,080,916 Total Land Value 19,224,065 Building Construction Building Construction Building Construction Res. Construction Costs per sqft $120 10,778,400 Res. Construction Costs per sqft $120 9,161,640 Res. Construction Costs per sqft $120 7,544,880 Site Development Costs (7) 15% 1,616,760 Site Development Costs (7) 15% 1,374,246 Site Development Costs (7) 15% 1,131,732 Comm. Construction Costs per sqft $80 0 Comm. Construction Costs per sqft $80 0 Comm. Construction Costs per sqft $80 0 (8) 25% 4,242,540 (8) 25% 3,777,722 (8) 25% 3,312,903 Developer Fee (9) 3% 1,751,490 Developer Fee (9) 3% 1,533,227 Developer Fee (9) 3% 1,314,965 Financing Financing Financing Debt Financing (10) 3,379,502 Debt Financing (10) 2,958,365 Debt Financing (10) 2,537,227 Equity Partner Financing (see profit spilt below, note 11) Equity Partner Financing (see profit spilt below, note 11) Equity Partner Financing (see profit spilt below, note 11) Marketing (% of Tot.Rev) 2.5% 1,459,575 Marketing (% of Tot.Rev) 2.5% 1,277,690 Marketing (% of Tot.Rev) 2.5% 1,095,804 Commission & Closing Costs (% of Tot.Rev) 2.5% 1,459,575 Commission & Closing Costs (% of Tot.Rev) 2.5% 1,277,690 Commission & Closing Costs (% of Tot.Rev) 2.5% 1,095,804 Total 49,625,596 Total 43,441,494 Total 37,257,380 Net Profit 8,757,404 Net Profit 7,666,086 Net Profit 6,574,780 Net Profit as a % of Revenues (11) 15.0% Net Profit as a % of Revenues (11) 15.0% Net Profit as a % of Revenues (11) 15.0% (Profit Split: 20% to developer and 80% to equity partner) (Profit Split: 20% to developer and 80% to equity partner) (Profit Split: 20% to developer and 80% to equity partner) Developer Funds Available for TDRs Developer Funds Available for TDRs Developer Funds Available for TDRs Total Value of TDR's (from above) 20,362,754 Total Value of TDR's (from above) 17,505,916 Total Value of TDR's (from above) 14,649,065 Less Pre-Development Agreement Land Payment (12) 5% 2,919,150 Less Pre-Development Agreement Land Payment (12) 5% 2,555,379 Less Pre-Development Agreement Land Payment (12) 5% 2,191,608 Developers' Total Willingness to Pay for TDRs 17,443,604 Developers' Total Willingness to Pay for TDRs 14,950,537 Developers' Total Willingness to Pay for TDRs 12,457,457 Per unit Willingness to PAY for TDR 582,619 Per unit Willingness to PAY for TDR 499,350 Per unit Willingness to PAY for TDR 416,081 (1) 60% of total parcel(s) size (1) 60% of total parcel(s) size (1) 60% of total parcel(s) size (2) Estimated allowed up-zoning based on surrounding landuses and densities (2) Estimated allowed up-zoning based on surrounding landuses and densities (2) Estimated allowed up-zoning based on surrounding landuses and densities (3) Average size for a single family detached unit at 1.8 units/acre (3) Average size for a single family detached unit at 1.8 units/acre (3) Average size for a single family detached unit at 1.8 units/acre (4) Based on surrounding like sales from dataquick, MLS, County Assessor (4) Based on surrounding like sales from dataquick, MLS, County Assessor (4) Based on surrounding like sales from dataquick, MLS, County Assessor (5) Determined from sales of property with like zoning (Ag land inside UGB assumed to sell at $100k/acre) (5) Determined from sales of property with like zoning (Ag land inside UGB assumed to sell at $100k/acre) (5) Determined from sales of property with like zoning (Ag land inside UGB assumed to sell at $100k/acre) (6) Added value to the land with TDR up-zone; determined by a fixed net profit of 15% (6) Added value to the land with TDR up-zone; determined by a fixed net profit of 15% (6) Added value to the land with TDR up-zone; determined by a fixed net profit of 15% (7) % construction costs for grading, sewer, water, and roads (more constrained sites face greater site costs) (7) % construction costs for grading, sewer, water, and roads (more constrained sites face greater site costs) (7) % construction costs for grading, sewer, water, and roads (more constrained sites face greater site costs) (8) % of direct costs that includes permitting costs, impact fees, legal, insurance and design costs (8) % of direct costs that includes permitting costs, impact fees, legal, insurance and design costs (8) % of direct costs that includes permitting costs, impact fees, legal, insurance and design costs (9) % of revenue developers charge to cover project overhead (9) % of revenue developers charge to cover project overhead (9) % of revenue developers charge to cover project overhead (10) Assumes bank loans 75% of total project costs, with a linear draw; interest payment 7% on 60% of this amount for 2 years (10) Assumes bank loans 75% of total project costs, with a linear draw; interest payment 7% on 60% of this amount for 2 years (10) Assumes bank loans 75% of total project costs, with a linear draw; interest payment 7% on 60% of this amount (11) Private equity investors expect 80% split of net profit with no 'preferred return' payments during development period (11) Private equity investors expect 80% split of net profit with no 'preferred return' payments during development period (11) Private equity investors expect 80% split of net profit with no 'preferred return' payments during development p (12) % of total revenue landowner receives as payment above baseline land costs in a pre-development agreement; (12) % of total revenue landowner receives as payment above baseline land costs in a pre-development agreement; (12) % of total revenue landowner receives as payment above baseline land costs in a pre-development agreemen this amount compensates receiving site land owner for capitalized land value with a TDR up-zone this amount compensates receiving site land owner for capitalized land value with a TDR up-zone this amount compensates receiving site land owner for capitalized land value with a TDR up-zone 10
46 Appendix D: Secondary Screening - Developer Willingness to Pay for TDRs Appendix D: Secondary Screening - Developer Willingness to Pay for TDRs Appendix D: Secondary Screening - Developer Willingness to Pay for TDRs Unincorporated South Coast: Montecito Area 3 Unincorporated South Coast: Montecito Area 3 Unincorporated South Coast: Montecito Area 3 100% residential market rate single family units Mixed Income ( 85% market rate, 15% affordable workforce units) single family units Mixed Income ( 70% market rate, 30% affordable workforce units) single family units Site Characteristics Site Characteristics Site Characteristics Parcel(s) Size Parcel(s) Size Parcel(s) Size Buildable Area (1) 60% Buildable Area (1) 60% Buildable Area (1) 60% Existing Zoning.3 unit/acre Existing Zoning.3 unit/acre Existing Zoning.3 unit/acre TDR Re-zone / Up-zone (2) 1.8 units/acre TDR Re-zone / Up-zone (2) 1.8 units/acre TDR Re-zone / Up-zone (2) 1.8 units/acre Development Program Development Program Development Program Residential Residential Residential # of units w/ existing zoning 4 # of units w/ existing zoning 4 # of units w/ existing zoning 4 # of units w/ TDR up-zone (based on buildable area) 19 # of units w/ TDR up-zone (based on buildable area) 19 # of units w/ TDR up-zone (based on buildable area) 19 # of Total Units 23 # of Total Units 23 # of Total Units 23 Average Market Rate Unit Size (3) 3,000 Average Market Rate Unit Size (3) 3,000 Average Market Rate Unit Size (3) 3,000 Average Affordable Rate Unit Size (3) Average Affordable Rate Unit Size (3) 1,500 Average Affordable Rate Unit Size (3) 1,500 Building Revenue Assumption Total Building Revenue Assumption Total Building Revenue Assumption Total Residential Residential Residential Market Rate Units 100% 19 Market Rate Units 85% 16 Market Rate Units 70% 13 Average Sale Price / sqft (4) $650 Average Sale Price / sqft (4) $650 Average Sale Price / sqft (4) $650 Average Unit Sale Price (4) $1,950,000 Average Unit Sale Price (4) ######### Average Unit Sale Price (4) $1,950,000 Affordable Units 0% 0 Affordable Units 15% 3 Affordable Units 30% 6 Area Median Income (4-person HH) Area Median Income (4-person HH) $64,700 Area Median Income (4-person HH) $64,700 Income Category (% of AMI) Income Category (% of AMI) % Income Category (% of AMI) % Sales Price Sales Price $330,000 Sales Price $330,000 Total Project Revenue 37,311,300 Total Project Revenue 32,661,738 Total Project Revenue 28,012,176 Land (per acre and total, see note 5) $150,000 3,189,000 Land (per acre and total, see note 5) $150,000 3,189,000 Land (per acre and total, see note 5) $150,000 3,189,000 Value of TDR's (6) 12,681,808 Value of TDR's (6) 10,113,428 Value of TDR's (6) 7,545,073 Total Land Value 15,870,808 Total Land Value 13,302,428 Total Land Value 10,734,073 Building Construction Building Construction Building Construction Res. Construction Costs per sqft $120 6,888,240 Res. Construction Costs per sqft $120 6,371,622 Res. Construction Costs per sqft $120 5,855,004 Site Development Costs (7) 15% 1,033,236 Site Development Costs (7) 15% 955,743 Site Development Costs (7) 15% 878,251 Comm. Construction Costs per sqft $80 0 Comm. Construction Costs per sqft $80 0 Comm. Construction Costs per sqft $80 0 (8) 25% 2,777,619 (8) 25% 2,629,091 (8) 25% 2,480,564 Developer Fee (9) 3% 1,119,339 Developer Fee (9) 3% 979,852 Developer Fee (9) 3% 840,365 Financing Financing Financing Debt Financing (10) 2,159,761 Debt Financing (10) 1,890,621 Debt Financing (10) 1,621,484 Equity Partner Financing (see profit spilt below, note 11) Equity Partner Financing (see profit spilt below, note 11) Equity Partner Financing (see profit spilt below, note 11) Marketing (% of Tot.Rev) 2.5% 932,783 Marketing (% of Tot.Rev) 2.5% 816,543 Marketing (% of Tot.Rev) 2.5% 700,304 Commission & Closing Costs (% of Tot.Rev) 2.5% 932,783 Commission & Closing Costs (% of Tot.Rev) 2.5% 816,543 Commission & Closing Costs (% of Tot.Rev) 2.5% 700,304 Total 31,714,568 Total 27,762,445 Total 23,810,350 Net Profit 5,596,732 Net Profit 4,899,293 Net Profit 4,201,826 Net Profit as a % of Revenues (11) 15.0% Net Profit as a % of Revenues (11) 15.0% Net Profit as a % of Revenues (11) 15.0% (Profit Split: 20% to developer and 80% to equity partner) (Profit Split: 20% to developer and 80% to equity partner) (Profit Split: 20% to developer and 80% to equity partner) Developer Funds Available for TDRs Developer Funds Available for TDRs Developer Funds Available for TDRs Total Value of TDR's (from above) 12,681,808 Total Value of TDR's (from above) 10,113,428 Total Value of TDR's (from above) 7,545,073 Less Pre-Development Agreement Land Payment (12) 5% 1,865,565 Less Pre-Development Agreement Land Payment (12) 5% 1,633,087 Less Pre-Development Agreement Land Payment (12) 5% 1,400,609 Developers' Total Willingness to Pay for TDRs 10,816,243 Developers' Total Willingness to Pay for TDRs 8,480,341 Developers' Total Willingness to Pay for TDRs 6,144,464 Per unit Willingness to PAY for TDR 565,289 Per unit Willingness to PAY for TDR 443,208 Per unit Willingness to PAY for TDR 321,128 (1) 60% of total parcel(s) size (1) 60% of total parcel(s) size (1) 60% of total parcel(s) size (2) Estimated allowed up-zoning based on surrounding landuses and densities (2) Estimated allowed up-zoning based on surrounding landuses and densities (2) Estimated allowed up-zoning based on surrounding landuses and densities (3) Average size for a single family detached unit at 1.8 units/acre (3) Average size for a single family detached unit at 1.8 units/acre (3) Average size for a single family detached unit at 1.8 units/acre (4) Based on surrounding like sales from dataquick, MLS, County Assessor (4) Based on surrounding like sales from dataquick, MLS, County Assessor (4) Based on surrounding like sales from dataquick, MLS, County Assessor (5) Determined from sales of property with like zoning (Ag land inside UGB assumed to sell at $100k/acre) (5) Determined from sales of property with like zoning (Ag land inside UGB assumed to sell at $100k/acre) (5) Determined from sales of property with like zoning (Ag land inside UGB assumed to sell at $100k/acre) (6) Added value to the land with TDR up-zone; determined by a fixed net profit of 15% (6) Added value to the land with TDR up-zone; determined by a fixed net profit of 15% (6) Added value to the land with TDR up-zone; determined by a fixed net profit of 15% (7) % construction costs for grading, sewer, water, and roads (more constrained sites face greater site costs) (7) % construction costs for grading, sewer, water, and roads (more constrained sites face greater site costs) (7) % construction costs for grading, sewer, water, and roads (more constrained sites face greater site costs) (8) % of direct costs that includes permitting costs, impact fees, legal, insurance and design costs (8) % of direct costs that includes permitting costs, impact fees, legal, insurance and design costs (8) % of direct costs that includes permitting costs, impact fees, legal, insurance and design costs (9) % of revenue developers charge to cover project overhead (9) % of revenue developers charge to cover project overhead (9) % of revenue developers charge to cover project overhead (10) Assumes bank loans 75% of total project costs, with a linear draw; interest payment 7% on 60% of this amount for 2 years (10) Assumes bank loans 75% of total project costs, with a linear draw; interest payment 7% on 60% of this amount for 2 years (10) Assumes bank loans 75% of total project costs, with a linear draw; interest payment 7% on 60% of this a (11) Private equity investors expect 80% split of net profit with no 'preferred return' payments during development period (11) Private equity investors expect 80% split of net profit with no 'preferred return' payments during development period (11) Private equity investors expect 80% split of net profit with no 'preferred return' payments during develop (12) % of total revenue landowner receives as payment above baseline land costs in a pre-development agreement; (12) % of total revenue landowner receives as payment above baseline land costs in a pre-development agreement; (12) % of total revenue landowner receives as payment above baseline land costs in a pre-development agr this amount compensates receiving site land owner for capitalized land value with a TDR up-zone this amount compensates receiving site land owner for capitalized land value with a TDR up-zone this amount compensates receiving site land owner for capitalized land value with a TDR up-zone 11
47 City of Santa Barbara Receiving Sites - WTP 1. Wright Property - East (3) 2. Cota st. City Parking Lot (CS) 3. Haley/Anacapa City Parking Lot (HA) 4. Chapala/Carillo City Parking Lot 5. Louise Lowry City Parking Lot (LL) 6. City Redevelopment Lots (5) 7. Pony Parking Lot Redevelopment Agency (7) 12
48 Appendix D: Secondary Screening - Developer Willingness to Pay for TDRs Appendix D: Secondary Screening - Developer Willingness to Pay for TDRs Appendix D: Secondary Screening - Developer Willingness to Pay for TDRs City of Santa Barbara : Wright Property - East of Garden st. City of Santa Barbara : Wright Property - East of Garden st. City of Santa Barbara : Wright Property - East of Garden st. 100% residential market rate townhomes (no commercial) - 20 units/acre Mixed Income townhomes - 15% workforce (no commercial) - 20 units/acre Mixed Income townhomes - 30% workforce (no commercial) - 20 units/acre Site Characteristics Site Characteristics Site Characteristics Parcel(s) Size Parcel(s) Size Parcel(s) Size Buildable Area (1) 7.79 Buildable Area (1) 7.79 Buildable Area (1) 7.79 Existing Zoning M - 1, HRC - 2 Existing Zoning M - 1, HRC - 2 Existing Zoning M - 1, HRC - 2 TDR Re-zone / Up-zone (2) 20 units/ac TDR Re-zone / Up-zone (2) 20 units/ac TDR Re-zone / Up-zone (2) 20 units/ac Development Program Development Program Development Program Residential Residential Residential # of units w/ existing zoning 0 # of units w/ existing zoning 0 # of units w/ existing zoning 0 # of units w/ TDR up-zone 156 # of units w/ TDR up-zone 156 # of units w/ TDR up-zone 156 # of Total Units 156 # of Total Units 156 # of Total Units 156 Average Market Rate Unit Size (3) 1,250 Average Market Rate Unit Size (3) 1,250 Average Market Rate Unit Size (3) 1,250 Average Affordable Rate Unit Size (3) 850 Average Affordable Rate Unit Size (3) 850 Average Affordable Rate Unit Size (3) 850 Commercial Commercial Commercial Allowed square footage 0 Allowed square footage 0 Allowed square footage 0 Additional Up-zone square footage 0 Additional Up-zone square footage 0 Additional Up-zone square footage 0 Parking Parking Parking Residential Spaces (4) 351 Residential Spaces (4) 327 Residential Spaces (4) 304 Commercial Spaces (4) 0 Commercial Spaces (4) 0 Commercial Spaces (4) 0 Building Revenue Assumption Total Building Revenue Assumption Total Building Revenue Assumption Total Residential Residential Residential Market Rate Units 100% 156 Market Rate Units 85% 132 Market Rate Units 70% 109 Average Sale Price / sqft (5) $900 Average Sale Price / sqft (5) $900 Average Sale Price / sqft (5) $900 Average Unit Sale Price (5) $1,125, ,365,000 Average Unit Sale Price (5) $1,125, ,060,250 Average Unit Sale Price (5) $1,125, ,755,500 Affordable Units 0% 0 Affordable Units 15% 23 Affordable Units 30% 47 Area Median Income (4-person HH) $64,700 Area Median Income (4-person HH) $64,700 Area Median Income (4-person HH) $64,700 Income Category (% of AMI) % Income Category (% of AMI) % Income Category (% of AMI) % Sales Price $450,000 0 Sales Price $450,000 10,521,900 Sales Price $450,000 21,043,800 Commercial 0 0 Commercial 0 0 Commercial 0 0 Lease Rate Lease Rate Lease Rate Revenue Periods/year Revenue Periods/year Revenue Periods/year Gross Annual Income Gross Annual Income Gross Annual Income Less Vacancy Less Vacancy Less Vacancy Less Operating Expenses Less Operating Expenses Less Operating Expenses Net Operating Income Net Operating Income Net Operating Income Capitalized Value 0 Capitalized Value 0 Capitalized Value 0 Total Project Revenue 175,365,000 Total Project Revenue 159,582,150 Total Project Revenue 143,799,300 Land (per acre and total, see note 6) $1,500,000 19,485,000 Land (per acre and total, see note 6) $1,500,000 19,485,000 Land (per acre and total, see note 6) $1,500,000 19,485,000 Value of TDR's (7) 57,471,414 Value of TDR's (7) 48,403,692 Value of TDR's (7) 39,335,970 Total Land Value 76,956,414 Total Land Value 67,888,692 Total Land Value 58,820,970 Building Construction Building Construction Building Construction Res. Construction Costs per sqft $130 25,330,500 Res. Construction Costs per sqft $130 24,114,636 Res. Construction Costs per sqft $130 22,898,772 Site Development Costs (8) 15% 3,799,575 Site Development Costs (8) 15% 3,617,195 Site Development Costs (8) 15% 3,434,816 Comm. Construction Costs per sqft $80 0 Comm. Construction Costs per sqft $80 0 Comm. Construction Costs per sqft $80 0 Parking (podium) Construction (per space see note $17,000 5,962,410 Parking (podium) Construction (per space see note 9) $17,000 5,564,916 Parking (podium) Construction (per space see note 9) $17,000 5,167,422 (10) 25% 13,644,371 (10) 25% 13,195,437 (10) 25% 12,746,502 Developer Fee (11) 3% 5,260,950 Developer Fee (11) 3% 4,787,465 Developer Fee (11) 3% 4,313,979 Financing Financing Financing Debt Financing (12) 10,214,429 Debt Financing (12) 9,295,131 Debt Financing (12) 8,375,832 Equity Partner Financing (see profit spilt below, note 13) Equity Partner Financing (see profit spilt below, note 13) Equity Partner Financing (see profit spilt below, note 13) Marketing & Commission (% of Tot.Rev) 4.5% 7,891,425 Marketing & Commission (% of Tot.Rev) 4.5% 7,181,197 Marketing & Commission (% of Tot.Rev) 4.5% 6,470,969 Total 149,060,075 Total 135,644,668 Total 122,229,261 Net Profit 26,304,925 Net Profit 23,937,482 Net Profit 21,570,039 Net Profit as a % of Revenues (expected to be 15%) 15.0% Net Profit as a % of Revenues (expected to be 15%) 15.0% Net Profit as a % of Revenues (expected to be 15%) 15.0% (Profit Split: 20% to developer and 80% to equity partner) (Profit Split: 20% to developer and 80% to equity partner) (Profit Split: 20% to developer and 80% to equity partner) Developer Funds Available for TDRs Developer Funds Available for TDRs Developer Funds Available for TDRs Total Value of TDR's (from above) 57,471,414 Total Value of TDR's (from above) 48,403,692 Total Value of TDR's (from above) 39,335,970 Less Pre-Development Agreement Land Payment (14) 5% 8,768,250 Less Pre-Development Agreement Land Payment (14) 5% 7,979,108 Less Pre-Development Agreement Land Payment (14) 5% 7,189,965 Developers' Total Willingness to Pay for TDRs 48,703,164 Developers' Total Willingness to Pay for TDRs 40,424,584 Developers' Total Willingness to Pay for TDRs 32,146,005 Per unit Willingness to PAY for TDR 312,440 Per unit Willingness to PAY for TDR 259,331 Per unit Willingness to PAY for TDR 206,223 (1) 60% of total parcel(s) size (1) 60% of total parcel(s) size (1) 60% of total parcel(s) size (2) Estimated allowed up-zoning based on surrounding landuses and densities; (2) Estimated allowed up-zoning based on surrounding landuses and densities; (2) Estimated allowed up-zoning based on surrounding landuses and densities; three stories- two residential above one level of above street level parking three stories- two residential above one level of above street level parking three stories- two residential above one level of above street level parking (3) Average size for a luxury 2-bedroom townhome at 20 units/acre (3) Average size for a luxury 2-bedroom townhome at 20 units/acre (3) Average size for a luxury 2-bedroom townhome at 20 units/acre (4) 2 for every market rate unit, 1 for workforce and 1 for every 4 units; # comm lots = 1/500sqft comm (4) 2 for every market rate unit, 1 for workforce and 1 for every 4 units; # comm lots = 1/500sqft comm (4) 2 for every market rate unit, 1 for workforce and 1 for every 4 units; # comm lots = 1/500sqft comm (5) Based on surrounding like sales from dataquick, MLS, County Assessor (5) Based on surrounding like sales from dataquick, MLS, County Assessor (5) Based on surrounding like sales from dataquick, MLS, County Assessor (6) Determined from sales of property with like zoning and/or County Assessor appraised Land value (6) Determined from sales of property with like zoning and/or County Assessor appraised Land value (6) Determined from sales of property with like zoning and/or County Assessor appraised Land value (7) Added value to the land with TDR up-zone; determined by a fixed net profit of 15% (7) Added value to the land with TDR up-zone; determined by a fixed net profit of 15% (7) Added value to the land with TDR up-zone; determined by a fixed net profit of 15% (8)% construction costs for grading, sewer, water, and roads (8)% construction costs for grading, sewer, water, and roads (8)% construction costs for grading, sewer, water, and roads (9) Assumes podium style parking with each space 380 sf at a cost of $45/sf for a total of $17,000/space (9) Assumes podium style parking with each space 380 sf at a cost of $45/sf for a total of $17,000/space (9) Assumes podium style parking with each space 380 sf at a cost of $45/sf for a total of $17,000/space (10) % of direct costs that includes permitting costs, impact fees, legal, insurance and design costs (10) % of direct costs that includes permitting costs, impact fees, legal, insurance and design costs (10) % of direct costs that includes permitting costs, impact fees, legal, insurance and design costs (12) Assumes bank loans 75% of total project costs, with a linear draw; interest payment 7% on 60% of this amount for 2 years (12) Assumes bank loans 75% of total project costs, with a linear draw; interest payment 7% on 60% of this amount for 2 years (12) Assumes bank loans 75% of total project costs, with a linear draw; interest payment 7% on 60% of this amount for (13) Private equity investors expect 80% split of net profit with no 'preferred return' payments during development period (13) Private equity investors expect 80% split of net profit with no 'preferred return' payments during development period (13) Private equity investors expect 80% split of net profit with no 'preferred return' payments during development perio (14) % of total revenue landowner receives as payment above baseline land costs in a pre-development agreement; (14) % of total revenue landowner receives as payment above baseline land costs in a pre-development agreement; (14) % of total revenue landowner receives as payment above baseline land costs in a pre-development agreement; this amount compensates receiving site land owner for capitalized land value with a TDR up-zone this amount compensates receiving site land owner for capitalized land value with a TDR up-zone this amount compensates receiving site land owner for capitalized land value with a TDR up-zone 13
49 Appendix D: Secondary Screening - Developer Willingness to Pay for TDRs Appendix D: Secondary Screening - Developer Willingness to Pay for TDRs Appendix D: Secondary Screening - Developer Willingness to Pay for TDRs City Santa Barbara - Cota & Santa Barbara st Public Parking Lot City Santa Barbara - Cota & Santa Barbara st Public Parking Lot City Santa Barbara - Cota & Santa Barbara st Public Parking Lot 100% residential market rate Condos- 50 units/ac, 4 levels Mixed Income Condos, 15% workforce- 50 units/ac, 4 levels Mixed Income Condos, 30% workforce- 50 units/ac, 4 levels Site Characteristics Site Characteristics Site Characteristics Parcel(s) Size 1.46 Parcel(s) Size 1.46 Parcel(s) Size 1.46 Buildable Area (1) 1.46 Buildable Area (1) 1.46 Buildable Area (1) 1.46 Existing Zoning Parking lot Existing Zoning Parking lot Existing Zoning Parking lot TDR Re-zone / Up-zone (2) 50 units/ac TDR Re-zone / Up-zone (2) 50 units/ac TDR Re-zone / Up-zone (2) 50 units/ac Development Program Development Program Development Program Residential Residential Residential # of units w/ existing zoning 0 # of units w/ existing zoning 0 # of units w/ existing zoning 0 # of units w/ TDR up-zone 73 # of units w/ TDR up-zone 73 # of units w/ TDR up-zone 73 # of Total Units 73 # of Total Units 73 # of Total Units 73 Average Market Rate Unit Size (3) 1,250 Average Market Rate Unit Size (3) 1,250 Average Market Rate Unit Size (3) 1,250 Average Affordable Rate Unit Size (3) 850 Average Affordable Rate Unit Size (3) 850 Average Affordable Rate Unit Size (3) 850 Commercial Commercial Commercial Allowed square footage 0 Allowed square footage 0 Allowed square footage 0 Additional Up-zone square footage 0 Additional Up-zone square footage 0 Additional Up-zone square footage 0 Parking Parking Parking Residential Spaces (4) 164 Residential Spaces (4) 153 Residential Spaces (4) 142 Commercial Spaces (4) 0 Commercial Spaces (4) 0 Commercial Spaces (4) 0 Replacement Spaces (4) 219 Replacement Spaces (4) 219 Replacement Spaces (4) 219 Building Revenue Assumption Total Building Revenue Assumption Total Building Revenue Assumption Total Residential Residential Residential Market Rate Units 100% 73 Market Rate Units 85% 62 Market Rate Units 70% 51 Average Sale Price / sqft (5) $900 Average Sale Price / sqft (5) $900 Average Sale Price / sqft (5) $900 Average Unit Sale Price (5) $1,125,000 82,125,000 Average Unit Sale Price (5) $1,125,000 69,806,250 Average Unit Sale Price (5) $1,125,000 57,487,500 Affordable Units 0% 0 Affordable Units 15% 11 Affordable Units 30% 22 Area Median Income (4-person HH) $64,700 Area Median Income (4-person HH) $64,700 Area Median Income (4-person HH) $64,700 Income Category (% of AMI) % Income Category (% of AMI) % Income Category (% of AMI) % Sales Price $450,000 Sales Price $450,000 Sales Price $450,000 Commercial 0 0 Commercial 0 0 Commercial 0 0 Lease Rate Lease Rate Lease Rate Revenue Periods/year Revenue Periods/year Revenue Periods/year Gross Annual Income Gross Annual Income Gross Annual Income Less Vacancy Less Vacancy Less Vacancy Less Operating Expenses Less Operating Expenses Less Operating Expenses Net Operating Income Net Operating Income Net Operating Income Capitalized Value 0 Capitalized Value 0 Capitalized Value 0 Total Project Revenue 82,125,000 Total Project Revenue 74,733,750 Total Project Revenue 67,342,500 Land (per acre and total, see note 6) $0 0 Land (per acre and total, see note 6) $0 0 Land (per acre and total, see note 6) $0 0 Value of TDR's (7) 20,253,216 Value of TDR's (7) 16,389,886 Value of TDR's (7) 12,526,710 Total Land Value 20,253,216 Total Land Value 16,389,886 Total Land Value 12,526,710 Building Construction Building Construction Building Construction Res. Construction Costs per sqft $130 11,862,500 Res. Construction Costs per sqft $130 11,293,100 Res. Construction Costs per sqft $130 10,723,700 Site Development Costs (8) 15% 1,779,375 Site Development Costs (8) 15% 1,693,965 Site Development Costs (8) 15% 1,608,555 Comm. Construction Costs per sqft $80 0 Comm. Construction Costs per sqft $80 0 Comm. Construction Costs per sqft $80 0 Parking (podium) Construction (per space see note $45,000 17,246,250 Parking (podium) Construction (per space see note 9) $45,000 16,753,500 Parking (podium) Construction (per space see note 9) $45,000 16,260,750 (10) 25% 7,722,031 (10) 25% 7,435,141 (10) 25% 7,148,251 Developer Fee (11) 3% 2,463,750 Developer Fee (11) 3% 2,242,013 Developer Fee (11) 3% 2,020,275 Financing Financing Financing Debt Financing (12) 4,783,516 Debt Financing (12) 4,352,993 Debt Financing (12) 3,922,483 Equity Partner Financing (see profit spilt below, note 13) Equity Partner Financing (see profit spilt below, note 13) Equity Partner Financing (see profit spilt below, note 13) Marketing & Commission (% of Tot.Rev) 4.5% 3,695,625 Marketing & Commission (% of Tot.Rev) 4.5% 3,363,019 Marketing & Commission (% of Tot.Rev) 4.5% 3,030,413 Total 69,806,262 Total 63,523,617 Total 57,241,137 Net Profit 12,318,738 Net Profit 11,210,133 Net Profit 10,101,363 Net Profit as a % of Revenues (expected to be 15%) 15.0% Net Profit as a % of Revenues (expected to be 15%) 15.0% Net Profit as a % of Revenues (expected to be 15%) 15.0% (Profit Split: 20% to developer and 80% to equity partner) (Profit Split: 20% to developer and 80% to equity partner) (Profit Split: 20% to developer and 80% to equity partner) Developer Funds Available for TDRs Developer Funds Available for TDRs Developer Funds Available for TDRs Total Value of TDR's (from above) 20,253,216 Total Value of TDR's (from above) 16,389,886 Total Value of TDR's (from above) 12,526,710 Less Pre-Development Agreement Land Payment (14) 0% 0 Less Pre-Development Agreement Land Payment (14) 0% 0 Less Pre-Development Agreement Land Payment (14) 0% 0 Developers' Total Willingness to Pay for TDRs 20,253,216 Developers' Total Willingness to Pay for TDRs 16,389,886 Developers' Total Willingness to Pay for TDRs 12,526,710 Per unit Willingness to PAY for TDR 277,441 Per unit Willingness to PAY for TDR 224,519 Per unit Willingness to PAY for TDR 171,599 (1) 100% of total parcel(s) size (1) 100% of total parcel(s) size (1) 100% of total parcel(s) size (2) Estimated allowed up-zoning based on surrounding landuses and densities; (2) Estimated allowed up-zoning based on surrounding landuses and densities; (2) Estimated allowed up-zoning based on surrounding landuses and densities; 4 levels- 3 residential above 1 below and 1 above grade parking 4 levels- 3 residential above 1 below and 1 above grade parking 4 levels- 3 residential above 1 below and 1 above grade parking (3) Average size for a luxury 2-bedroom townhome at 20 units/acre (3) Average size for a luxury 2-bedroom townhome at 20 units/acre (3) Average size for a luxury 2-bedroom townhome at 20 units/acre (4) 2 for every market rate unit, 1 for workforce and 1 for every 4 units;1/500sqft com; replacement spaces from 2003 study (4) 2 for every market rate unit, 1 for workforce and 1 for every 4 units;1/500sqft com; replacement spaces from 2003 study (4) 2 for every market rate unit, 1 for workforce and 1 for every 4 units;1/500sqft com; replacement spaces from 20 (5) Based on surrounding like sales from dataquick, MLS, County Assessor (5) Based on surrounding like sales from dataquick, MLS, County Assessor (5) Based on surrounding like sales from dataquick, MLS, County Assessor (6) Determined from sales of property with like zoning and/or County Assessor appraised Land value (6) Determined from sales of property with like zoning and/or County Assessor appraised Land value (6) Determined from sales of property with like zoning and/or County Assessor appraised Land value (7) Added value to the land with TDR up-zone; determined by a fixed net profit of 15% (7) Added value to the land with TDR up-zone; determined by a fixed net profit of 15% (7) Added value to the land with TDR up-zone; determined by a fixed net profit of 15% (8)% construction costs for grading, sewer, water, and roads (8)% construction costs for grading, sewer, water, and roads (8)% construction costs for grading, sewer, water, and roads (9) cost estimate taken from City 2003 feasibility study which used $26K, assuming here 70% increase in costs (9) cost estimate taken from City 2003 feasibility study which used $26K, assuming here 70% increase in costs (9) cost estimate taken from City 2003 feasibility study which used $26K, assuming here 70% increase in costs (10) % of direct costs that includes permitting costs, impact fees, legal, insurance and design costs (10) % of direct costs that includes permitting costs, impact fees, legal, insurance and design costs (10) % of direct costs that includes permitting costs, impact fees, legal, insurance and design costs (12) Assumes bank loans 75% of total project costs, with a linear draw; interest payment 7% on 60% of this amount for 2 years (12) Assumes bank loans 75% of total project costs, with a linear draw; interest payment 7% on 60% of this amount for 2 years (12) Assumes bank loans 75% of total project costs, with a linear draw; interest payment 7% on 60% of this amoun (13) Private equity investors expect 80% split of net profit with no 'preferred return' payments during development period (13) Private equity investors expect 80% split of net profit with no 'preferred return' payments during development period (13) Private equity investors expect 80% split of net profit with no 'preferred return' payments during development p (14) % of total revenue landowner receives as payment above baseline land costs in a pre-development agreement; (14) % of total revenue landowner receives as payment above baseline land costs in a pre-development agreement; (14) % of total revenue landowner receives as payment above baseline land costs in a pre-development agreemen this amount compensates receiving site land owner for capitalized land value with a TDR up-zone this amount compensates receiving site land owner for capitalized land value with a TDR up-zone this amount compensates receiving site land owner for capitalized land value with a TDR up-zone 14
50 Appendix D: Secondary Screening - Developer Willingness to Pay for TDRs Appendix D: Secondary Screening - Developer Willingness to Pay for TDRs Appendix D: Secondary Screening - Developer Willingness to Pay for TDRs City Santa Barbara - Haley & Anacapa st Public Parking Lot City Santa Barbara - Haley & Anacapa st Public Parking Lot City Santa Barbara - Haley & Anacapa st Public Parking Lot 100% residential market rate Condos- 50 units/ac, 4 levels Mixed Income Condos, 15% workforce- 50 units/ac, 4 levels Mixed Income Condos, 30% workforce- 50 units/ac, 4 levels Site Characteristics Site Characteristics Site Characteristics Parcel(s) Size 1.74 Parcel(s) Size 1.74 Parcel(s) Size 1.74 Buildable Area (1) 1.74 Buildable Area (1) 1.74 Buildable Area (1) 1.74 Existing Zoning Parking lot Existing Zoning Parking lot Existing Zoning Parking lot TDR Re-zone / Up-zone (2) 50 units/ac TDR Re-zone / Up-zone (2) 50 units/ac TDR Re-zone / Up-zone (2) 50 units/ac Development Program Development Program Development Program Residential Residential Residential # of units w/ existing zoning 0 # of units w/ existing zoning 0 # of units w/ existing zoning 0 # of units w/ TDR up-zone 87 # of units w/ TDR up-zone 87 # of units w/ TDR up-zone 87 # of Total Units 87 # of Total Units 87 # of Total Units 87 Average Market Rate Unit Size (3) 1,250 Average Market Rate Unit Size (3) 1,250 Average Market Rate Unit Size (3) 1,250 Average Affordable Rate Unit Size (3) 850 Average Affordable Rate Unit Size (3) 850 Average Affordable Rate Unit Size (3) 850 Commercial Commercial Commercial Allowed square footage 0 Allowed square footage 0 Allowed square footage 0 Additional Up-zone square footage 0 Additional Up-zone square footage 0 Additional Up-zone square footage 0 Parking Parking Parking Residential Spaces (4) 196 Residential Spaces (4) 183 Residential Spaces (4) 170 Commercial Spaces (4) 0 Commercial Spaces (4) 0 Commercial Spaces (4) 0 Replacement Spaces (4) 260 Replacement Spaces (4) 260 Replacement Spaces (4) 260 Building Revenue Assumption Total Building Revenue Assumption Total Building Revenue Assumption Total Residential Residential Residential Market Rate Units 100% 87 Market Rate Units 85% 74 Market Rate Units 70% 61 Average Sale Price / sqft (5) $900 Average Sale Price / sqft (5) $900 Average Sale Price / sqft (5) $900 Average Unit Sale Price (5) $1,125,000 97,875,000 Average Unit Sale Price (5) $1,125,000 83,193,750 Average Unit Sale Price (5) $1,125,000 68,512,500 Affordable Units 0% 0 Affordable Units 15% 13 Affordable Units 30% 26 Area Median Income (4-person HH) $64,700 Area Median Income (4-person HH) $64,700 Area Median Income (4-person HH) $64,700 Income Category (% of AMI) % Income Category (% of AMI) % Income Category (% of AMI) % Sales Price $450,000 Sales Price $450,000 Sales Price $450,000 Commercial 0 0 Commercial 0 0 Commercial 0 0 Lease Rate Lease Rate Lease Rate Revenue Periods/year Revenue Periods/year Revenue Periods/year Gross Annual Income Gross Annual Income Gross Annual Income Less Vacancy Less Vacancy Less Vacancy Less Operating Expenses Less Operating Expenses Less Operating Expenses Net Operating Income Net Operating Income Net Operating Income Capitalized Value 0 Capitalized Value 0 Capitalized Value 0 Total Project Revenue 97,875,000 Total Project Revenue 89,066,250 Total Project Revenue 80,257,500 Land (per acre and total, see note 6) $0 0 Land (per acre and total, see note 6) $0 0 Land (per acre and total, see note 6) $0 0 Value of TDR's (7) 24,193,643 Value of TDR's (7) 19,589,397 Value of TDR's (7) 14,985,256 Total Land Value 24,193,643 Total Land Value 19,589,397 Total Land Value 14,985,256 Building Construction Building Construction Building Construction Res. Construction Costs per sqft $130 14,137,500 Res. Construction Costs per sqft $130 13,458,900 Res. Construction Costs per sqft $130 12,780,300 Site Development Costs (8) 15% 2,120,625 Site Development Costs (8) 15% 2,018,835 Site Development Costs (8) 15% 1,917,045 Comm. Construction Costs per sqft $80 0 Comm. Construction Costs per sqft $80 0 Comm. Construction Costs per sqft $80 0 Parking (podium) Construction (per space see note $45,000 20,508,750 Parking (podium) Construction (per space see note 9) $45,000 19,921,500 Parking (podium) Construction (per space see note 9) $45,000 19,334,250 (10) 25% 9,191,719 (10) 25% 8,849,809 (10) 25% 8,507,899 Developer Fee (11) 3% 2,936,250 Developer Fee (11) 3% 2,671,988 Developer Fee (11) 3% 2,407,725 Financing Financing Financing Debt Financing (12) 5,700,902 Debt Financing (12) 5,187,813 Debt Financing (12) 4,674,733 Equity Partner Financing (see profit spilt below, note 13) Equity Partner Financing (see profit spilt below, note 13) Equity Partner Financing (see profit spilt below, note 13) Marketing & Commission (% of Tot.Rev) 4.5% 4,404,375 Marketing & Commission (% of Tot.Rev) 4.5% 4,007,981 Marketing & Commission (% of Tot.Rev) 4.5% 3,611,588 Total 83,193,764 Total 75,706,223 Total 68,218,795 Net Profit 14,681,236 Net Profit 13,360,027 Net Profit 12,038,705 Net Profit as a % of Revenues (expected to be 15%) 15.0% Net Profit as a % of Revenues (expected to be 15%) 15.0% Net Profit as a % of Revenues (expected to be 15%) 15.0% (Profit Split: 20% to developer and 80% to equity partner) (Profit Split: 20% to developer and 80% to equity partner) (Profit Split: 20% to developer and 80% to equity partner) Developer Funds Available for TDRs Developer Funds Available for TDRs Developer Funds Available for TDRs Total Value of TDR's (from above) 24,193,643 Total Value of TDR's (from above) 19,589,397 Total Value of TDR's (from above) 14,985,256 Less Pre-Development Agreement Land Payment (14) 0% 0 Less Pre-Development Agreement Land Payment (14) 0% 0 Less Pre-Development Agreement Land Payment (14) 0% 0 Developers' Total Willingness to Pay for TDRs 24,193,643 Developers' Total Willingness to Pay for TDRs 19,589,397 Developers' Total Willingness to Pay for TDRs 14,985,256 Per unit Willingness to PAY for TDR 278,088 Per unit Willingness to PAY for TDR 225,165 Per unit Willingness to PAY for TDR 172,244 (1) 100% of total parcel(s) size (1) 100% of total parcel(s) size (1) 100% of total parcel(s) size (2) Estimated allowed up-zoning based on surrounding landuses and densities; (2) Estimated allowed up-zoning based on surrounding landuses and densities; (2) Estimated allowed up-zoning based on surrounding landuses and densities; 4 levels- 3 residential above 1 below and 1 above grade parking 4 levels- 3 residential above 1 below and 1 above grade parking 4 levels- 3 residential above 1 below and 1 above grade parking (3) Average size for a luxury 2-bedroom townhome at 20 units/acre (3) Average size for a luxury 2-bedroom townhome at 20 units/acre (3) Average size for a luxury 2-bedroom townhome at 20 units/acre (4) 2 for every market rate unit, 1 for workforce and 1 for every 4 units;1/500sqft com; replacement spaces from 2003 study (4) 2 for every market rate unit, 1 for workforce and 1 for every 4 units;1/500sqft com; replacement spaces from 2003 study (4) 2 for every market rate unit, 1 for workforce and 1 for every 4 units;1/500sqft com; replacement spaces from 20 (5) Based on surrounding like sales from dataquick, MLS, County Assessor (5) Based on surrounding like sales from dataquick, MLS, County Assessor (5) Based on surrounding like sales from dataquick, MLS, County Assessor (6) Determined from sales of property with like zoning and/or County Assessor appraised Land value (6) Determined from sales of property with like zoning and/or County Assessor appraised Land value (6) Determined from sales of property with like zoning and/or County Assessor appraised Land value (7) Added value to the land with TDR up-zone; determined by a fixed net profit of 15% (7) Added value to the land with TDR up-zone; determined by a fixed net profit of 15% (7) Added value to the land with TDR up-zone; determined by a fixed net profit of 15% (8)% construction costs for grading, sewer, water, and roads (8)% construction costs for grading, sewer, water, and roads (8)% construction costs for grading, sewer, water, and roads (9) cost estimate taken from City 2003 feasibility study which used $26K, assuming here 70% increase in costs (9) cost estimate taken from City 2003 feasibility study which used $26K, assuming here 70% increase in costs (9) cost estimate taken from City 2003 feasibility study which used $26K, assuming here 70% increase in costs (10) % of direct costs that includes permitting costs, impact fees, legal, insurance and design costs (10) % of direct costs that includes permitting costs, impact fees, legal, insurance and design costs (10) % of direct costs that includes permitting costs, impact fees, legal, insurance and design costs (12) Assumes bank loans 75% of total project costs, with a linear draw; interest payment 7% on 60% of this amount for 2 years (12) Assumes bank loans 75% of total project costs, with a linear draw; interest payment 7% on 60% of this amount for 2 years (12) Assumes bank loans 75% of total project costs, with a linear draw; interest payment 7% on 60% of this amoun (13) Private equity investors expect 80% split of net profit with no 'preferred return' payments during development period (13) Private equity investors expect 80% split of net profit with no 'preferred return' payments during development period (13) Private equity investors expect 80% split of net profit with no 'preferred return' payments during development p (14) % of total revenue landowner receives as payment above baseline land costs in a pre-development agreement; (14) % of total revenue landowner receives as payment above baseline land costs in a pre-development agreement; (14) % of total revenue landowner receives as payment above baseline land costs in a pre-development agreemen this amount compensates receiving site land owner for capitalized land value with a TDR up-zone this amount compensates receiving site land owner for capitalized land value with a TDR up-zone this amount compensates receiving site land owner for capitalized land value with a TDR up-zone 15
51 Appendix D: Secondary Screening - Developer Willingness to Pay for TDRs Appendix D: Secondary Screening - Developer Willingness to Pay for TDRs Appendix D: Secondary Screening - Developer Willingness to Pay for TDRs City Santa Barbara - Cabrillo/Chapala st Public Parking Lot City Santa Barbara - Cabrillo/Chapala st Public Parking Lot City Santa Barbara - Cabrillo/Chapala st Public Parking Lot 100% residential market rate Condos- 50 units/ac, 4 levels Mixed Income Condos, 15% workforce- 50 units/ac, 4 levels Mixed Income Condos, 30% workforce- 50 units/ac, 4 levels Site Characteristics Site Characteristics Site Characteristics Parcel(s) Size 1.27 Parcel(s) Size 1.27 Parcel(s) Size 1.27 Buildable Area (1) Buildable Area (1) Buildable Area (1) Existing Zoning Parking lot Existing Zoning Parking lot Existing Zoning Parking lot TDR Re-zone / Up-zone (2) 50 units/ac TDR Re-zone / Up-zone (2) 50 units/ac TDR Re-zone / Up-zone (2) 50 units/ac Development Program Development Program Development Program Residential Residential Residential # of units w/ existing zoning 0 # of units w/ existing zoning 0 # of units w/ existing zoning 0 # of units w/ TDR up-zone 51 # of units w/ TDR up-zone 51 # of units w/ TDR up-zone 51 # of Total Units 51 # of Total Units 51 # of Total Units 51 Average Market Rate Unit Size (3) 1,250 Average Market Rate Unit Size (3) 1,250 Average Market Rate Unit Size (3) 1,250 Average Affordable Rate Unit Size (3) 850 Average Affordable Rate Unit Size (3) 850 Average Affordable Rate Unit Size (3) 850 Commercial Commercial Commercial Allowed square footage 0 Allowed square footage 0 Allowed square footage 0 Additional Up-zone square footage 0 Additional Up-zone square footage 0 Additional Up-zone square footage 0 Parking Parking Parking Residential Spaces (4) 114 Residential Spaces (4) 107 Residential Spaces (4) 99 Commercial Spaces (4) 0 Commercial Spaces (4) 0 Commercial Spaces (4) 0 Replacement Spaces (4) 200 Replacement Spaces (4) 200 Replacement Spaces (4) 200 Building Revenue Assumption Total Building Revenue Assumption Total Building Revenue Assumption Total Residential Residential Residential Market Rate Units 100% 51 Market Rate Units 85% 43 Market Rate Units 70% 36 Average Sale Price / sqft (5) $900 Average Sale Price / sqft (5) $900 Average Sale Price / sqft (5) $900 Average Unit Sale Price (5) ######## 57,150,000 Average Unit Sale Price (5) $1,125,000 48,577,500 Average Unit Sale Price (5) $1,125,000 40,005,000 Affordable Units 0% 0 Affordable Units 15% 8 Affordable Units 30% 15 Area Median Income (4-person HH) $64,700 Area Median Income (4-person HH) $64,700 Area Median Income (4-person HH) $64,700 Income Category (% of AMI) % Income Category (% of AMI) % Income Category (% of AMI) % Sales Price $450,000 Sales Price $450,000 Sales Price $450,000 Commercial 0 0 Commercial 0 0 Commercial 0 0 Lease Rate Lease Rate Lease Rate Revenue Periods/year Revenue Periods/year Revenue Periods/year Gross Annual Income Gross Annual Income Gross Annual Income Less Vacancy Less Vacancy Less Vacancy Less Operating Expenses Less Operating Expenses Less Operating Expenses Net Operating Income Net Operating Income Net Operating Income Capitalized Value 0 Capitalized Value 0 Capitalized Value 0 Total Project Revenue 57,150,000 Total Project Revenue 52,006,500 Total Project Revenue 46,863,000 Land (per acre and total, see note 6) $0 0 Land (per acre and total, see note 6) $0 0 Land (per acre and total, see note 6) $0 0 Value of TDR's (7) 3,416,564 Value of TDR's (7) 728,158 Value of TDR's (7) 0 Total Land Value 3,416,564 Total Land Value 728,158 Total Land Value 0 Building Construction Building Construction Building Construction Res. Construction Costs per sqft $130 8,255,000 Res. Construction Costs per sqft $130 7,858,760 Res. Construction Costs per sqft $130 7,462,520 Site Development Costs (8) 15% 1,238,250 Site Development Costs (8) 15% 1,178,814 Site Development Costs (8) 15% 1,119,378 Comm. Construction Costs per sqft $80 0 Comm. Construction Costs per sqft $80 0 Comm. Construction Costs per sqft $80 0 Parking (podium) Construction (per space see note $45,000 14,143,500 Parking (podium) Construction (per space see note 9) $45,000 13,800,600 Parking (podium) Construction (per space see note 9) $45,000 13,457,700 Transit Center Redevelopment (8) 8,000,000 Transit Center Redevelopment (8) 8,000,000 Transit Center Redevelopment (8) 8,000,000 (10) 25% 5,909,188 (10) 25% 5,709,544 (10) 25% 5,509,900 Developer Fee (11) 3% 1,714,500 Developer Fee (11) 3% 1,560,195 Developer Fee (11) 3% 1,405,890 Financing Financing Financing Debt Financing (12) 3,328,806 Debt Financing (12) 3,029,214 Debt Financing (12) 2,882,520 Equity Partner Financing (see profit spilt below, note 13) Equity Partner Financing (see profit spilt below, note 13) Equity Partner Financing (see profit spilt below, note 13) Marketing & Commission (% of Tot.Rev) 4.5% 2,571,750 Marketing & Commission (% of Tot.Rev) 4.5% 2,340,293 Marketing & Commission (% of Tot.Rev) 4.5% 2,108,835 Total 48,577,557 Total 44,205,577 Total 41,946,743 Net Profit 8,572,443 Net Profit 7,800,923 Net Profit 4,916,257 Net Profit as a % of Revenues (expected to be 15%) 15.0% Net Profit as a % of Revenues (expected to be 15%) 15.0% Net Profit as a % of Revenues (expected to be 15%) 10.5% (Profit Split: 20% to developer and 80% to equity partner) (Profit Split: 20% to developer and 80% to equity partner) (Profit Split: 20% to developer and 80% to equity partner) Developer Funds Available for TDRs Developer Funds Available for TDRs Developer Funds Available for TDRs Total Value of TDR's (from above) 3,416,564 Total Value of TDR's (from above) 728,158 Total Value of TDR's (from above) 0 Less Pre-Development Agreement Land Payment (14) 0% 0 Less Pre-Development Agreement Land Payment (14) 0% 0 Less Pre-Development Agreement Land Payment (14) 0% 0 Developers' Total Willingness to Pay for TDRs 3,416,564 Developers' Total Willingness to Pay for TDRs 728,158 Developers' Total Willingness to Pay for TDRs 0 Per unit Willingness to PAY for TDR 67,255 Per unit Willingness to PAY for TDR 14,334 Per unit Willingness to PAY for TDR 0 (1) Assume 20% of total parcel size is devoted to transit center redevelopment (1) Assume 20% of total parcel size is devoted to transit center redevelopment (1) Assume 20% of total parcel size is devoted to transit center redevelopment (2) Estimated allowed up-zoning based on surrounding landuses and densities; (2) Estimated allowed up-zoning based on surrounding landuses and densities; (2) Estimated allowed up-zoning based on surrounding landuses and densities; 4 levels- 3 residential above 1 below and 1 above grade parking 4 levels- 3 residential above 1 below and 1 above grade parking 4 levels- 3 residential above 1 below and 1 above grade parking (3) Average size for a luxury 2-bedroom townhome at 20 units/acre (3) Average size for a luxury 2-bedroom townhome at 20 units/acre (3) Average size for a luxury 2-bedroom townhome at 20 units/acre (4) 2 for every market rate unit, 1 for workforce and 1 for every 4 units;1/500sqft com; replacement spaces from 2003 study (4) 2 for every market rate unit, 1 for workforce and 1 for every 4 units;1/500sqft com; replacement spaces from 2003 study (4) 2 for every market rate unit, 1 for workforce and 1 for every 4 units;1/500sqft com; replacement spaces from 20 (5) Based on surrounding like sales from dataquick, MLS, County Assessor (5) Based on surrounding like sales from dataquick, MLS, County Assessor (5) Based on surrounding like sales from dataquick, MLS, County Assessor (6) Determined from sales of property with like zoning and/or County Assessor appraised Land value (6) Determined from sales of property with like zoning and/or County Assessor appraised Land value (6) Determined from sales of property with like zoning and/or County Assessor appraised Land value (7) Added value to the land with TDR up-zone; determined by a fixed net profit of 15% (7) Added value to the land with TDR up-zone; determined by a fixed net profit of 15% (7) Added value to the land with TDR up-zone; determined by a fixed net profit of 15% (8)% construction costs for grading, sewer, water, and roads ; Also assumed $8 million for relplacement of transit center (8)% construction costs for grading, sewer, water, and roads ; Also assumed $8 million for relplacement of transit center (8)% construction costs for grading, sewer, water, and roads ; Also assumed $8 million for relplacement of transit c (9) cost estimate taken from City 2003 feasibility study which used $26K, assuming here 70% increase in costs (9) cost estimate taken from City 2003 feasibility study which used $26K, assuming here 70% increase in costs (9) cost estimate taken from City 2003 feasibility study which used $26K, assuming here 70% increase in costs (10) % of direct costs that includes permitting costs, impact fees, legal, insurance and design costs (10) % of direct costs that includes permitting costs, impact fees, legal, insurance and design costs (10) % of direct costs that includes permitting costs, impact fees, legal, insurance and design costs (12) Assumes bank loans 75% of total project costs, with a linear draw; interest payment 7% on 60% of this amount for 2 years(12) Assumes bank loans 75% of total project costs, with a linear draw; interest payment 7% on 60% of this amount for 2 years (12) Assumes bank loans 75% of total project costs, with a linear draw; interest payment 7% on 60% of this amoun (13) Private equity investors expect 80% split of net profit with no 'preferred return' payments during development period (13) Private equity investors expect 80% split of net profit with no 'preferred return' payments during development period (13) Private equity investors expect 80% split of net profit with no 'preferred return' payments during development p (14) % of total revenue landowner receives as payment above baseline land costs in a pre-development agreement; (14) % of total revenue landowner receives as payment above baseline land costs in a pre-development agreement; (14) % of total revenue landowner receives as payment above baseline land costs in a pre-development agreemen this amount compensates receiving site land owner for capitalized land value with a TDR up-zone this amount compensates receiving site land owner for capitalized land value with a TDR up-zone this amount compensates receiving site land owner for capitalized land value with a TDR up-zone 16
52 Appendix D: Secondary Screening - Developer Willingness to Pay for TDRs Appendix D: Secondary Screening - Developer Willingness to Pay for TDRs Appendix D: Secondary Screening - Developer Willingness to Pay for TDRs City Santa Barbara - Louis Lowry Public Parking Lot City Santa Barbara - Louis Lowry Public Parking Lot City Santa Barbara - Louis Lowry Public Parking Lot 100% residential market rate Condos- 50 units/ac, 4 levels Mixed Income Condos, 15% workforce- 50 units/ac, 4 levels Mixed Income Condos, 30% workforce- 50 units/ac, 4 levels Site Characteristics Site Characteristics Site Characteristics Parcel(s) Size 0.81 Parcel(s) Size 0.81 Parcel(s) Size 0.81 Buildable Area (1) 0.81 Buildable Area (1) 0.81 Buildable Area (1) 0.81 Existing Zoning Parking lot Existing Zoning Parking lot Existing Zoning Parking lot TDR Re-zone / Up-zone (2) 50 units/ac TDR Re-zone / Up-zone (2) 50 units/ac TDR Re-zone / Up-zone (2) 50 units/ac Development Program Development Program Development Program Residential Residential Residential # of units w/ existing zoning 0 # of units w/ existing zoning 0 # of units w/ existing zoning 0 # of units w/ TDR up-zone 41 # of units w/ TDR up-zone 41 # of units w/ TDR up-zone 41 # of Total Units 41 # of Total Units 41 # of Total Units 41 Average Market Rate Unit Size (3) 1,250 Average Market Rate Unit Size (3) 1,250 Average Market Rate Unit Size (3) 1,250 Average Affordable Rate Unit Size (3) 850 Average Affordable Rate Unit Size (3) 850 Average Affordable Rate Unit Size (3) 850 Commercial Commercial Commercial Allowed square footage 0 Allowed square footage 0 Allowed square footage 0 Additional Up-zone square footage 0 Additional Up-zone square footage 0 Additional Up-zone square footage 0 Parking Parking Parking Residential Spaces (4) 91 Residential Spaces (4) 85 Residential Spaces (4) 79 Commercial Spaces (4) 0 Commercial Spaces (4) 0 Commercial Spaces (4) 0 Replacement Spaces (4) 109 Replacement Spaces (4) 109 Replacement Spaces (4) 109 Building Revenue Assumption Total Building Revenue Assumption Total Building Revenue Assumption Total Residential Residential Residential Market Rate Units 100% 41 Market Rate Units 85% 34 Market Rate Units 70% 28 Average Sale Price / sqft (5) $900 Average Sale Price / sqft (5) $900 Average Sale Price / sqft (5) $900 Average Unit Sale Price (5) ######## 45,562,500 Average Unit Sale Price (5) $1,125,000 38,728,125 Average Unit Sale Price (5) $1,125,000 31,893,750 Affordable Units 0% 0 Affordable Units 15% 6 Affordable Units 30% 12 Area Median Income (4-person HH) $64,700 Area Median Income (4-person HH) $64,700 Area Median Income (4-person HH) $64,700 Income Category (% of AMI) % Income Category (% of AMI) % Income Category (% of AMI) % Sales Price $450,000 Sales Price $450,000 Sales Price $450,000 Commercial 0 0 Commercial 0 0 Commercial 0 0 Lease Rate Lease Rate Lease Rate Revenue Periods/year Revenue Periods/year Revenue Periods/year Gross Annual Income Gross Annual Income Gross Annual Income Less Vacancy Less Vacancy Less Vacancy Less Operating Expenses Less Operating Expenses Less Operating Expenses Net Operating Income Net Operating Income Net Operating Income Capitalized Value 0 Capitalized Value 0 Capitalized Value 0 Total Project Revenue 45,562,500 Total Project Revenue 41,461,875 Total Project Revenue 37,361,250 Land (per acre and total, see note 6) $0 0 Land (per acre and total, see note 6) $0 0 Land (per acre and total, see note 6) $0 0 Value of TDR's (7) 11,939,449 Value of TDR's (7) 9,796,142 Value of TDR's (7) 7,652,834 Total Land Value 11,939,449 Total Land Value 9,796,142 Total Land Value 7,652,834 Building Construction Building Construction Building Construction Res. Construction Costs per sqft $130 6,581,250 Res. Construction Costs per sqft $130 6,265,350 Res. Construction Costs per sqft $130 5,949,450 Site Development Costs (8) 15% 987,188 Site Development Costs (8) 15% 939,803 Site Development Costs (8) 15% 892,418 Comm. Construction Costs per sqft $80 0 Comm. Construction Costs per sqft $80 0 Comm. Construction Costs per sqft $80 0 Parking (podium) Construction (per space see note $45,000 9,005,625 Parking (podium) Construction (per space see note 9) $45,000 8,732,250 Parking (podium) Construction (per space see note 9) $45,000 8,458,875 (10) 25% 4,143,516 (10) 25% 3,984,351 (10) 25% 3,825,186 Developer Fee (11) 3% 1,366,875 Developer Fee (11) 3% 1,243,856 Developer Fee (11) 3% 1,120,838 Financing Financing Financing Debt Financing (12) 2,653,864 Debt Financing (12) 2,415,017 Debt Financing (12) 2,176,169 Equity Partner Financing (see profit spilt below, note 13) Equity Partner Financing (see profit spilt below, note 13) Equity Partner Financing (see profit spilt below, note 13) Marketing & Commission (% of Tot.Rev) 4.5% 2,050,313 Marketing & Commission (% of Tot.Rev) 4.5% 1,865,784 Marketing & Commission (% of Tot.Rev) 4.5% 1,681,256 Total 38,728,079 Total 35,242,552 Total 31,757,025 Net Profit 6,834,421 Net Profit 6,219,323 Net Profit 5,604,225 Net Profit as a % of Revenues (expected to be 15%) 15.0% Net Profit as a % of Revenues (expected to be 15%) 15.0% Net Profit as a % of Revenues (expected to be 15%) 15.0% (Profit Split: 20% to developer and 80% to equity partner) (Profit Split: 20% to developer and 80% to equity partner) (Profit Split: 20% to developer and 80% to equity partner) Developer Funds Available for TDRs Developer Funds Available for TDRs Developer Funds Available for TDRs Total Value of TDR's (from above) 11,939,449 Total Value of TDR's (from above) 9,796,142 Total Value of TDR's (from above) 7,652,834 Less Pre-Development Agreement Land Payment (14) 0% 0 Less Pre-Development Agreement Land Payment (14) 0% 0 Less Pre-Development Agreement Land Payment (14) 0% 0 Developers' Total Willingness to Pay for TDRs 11,939,449 Developers' Total Willingness to Pay for TDRs 9,796,142 Developers' Total Willingness to Pay for TDRs 7,652,834 Per unit Willingness to PAY for TDR 294,801 Per unit Willingness to PAY for TDR 241,880 Per unit Willingness to PAY for TDR 188,959 (1) 100% of total parcel(s) size (1) 100% of total parcel(s) size (1) 100% of total parcel(s) size (2) Estimated allowed up-zoning based on surrounding landuses and densities; (2) Estimated allowed up-zoning based on surrounding landuses and densities; (2) Estimated allowed up-zoning based on surrounding landuses and densities; 4 levels- 3 residential above 1 below and 1 above grade parking 4 levels- 3 residential above 1 below and 1 above grade parking 4 levels- 3 residential above 1 below and 1 above grade parking (3) Average size for a luxury 2-bedroom townhome at 20 units/acre (3) Average size for a luxury 2-bedroom townhome at 20 units/acre (3) Average size for a luxury 2-bedroom townhome at 20 units/acre (4) 2 for every market rate unit, 1 for workforce and 1 for every 4 units;1/500sqft com; replacement spaces from 2003 study (4) 2 for every market rate unit, 1 for workforce and 1 for every 4 units;1/500sqft com; replacement spaces from 2003 study (4) 2 for every market rate unit, 1 for workforce and 1 for every 4 units;1/500sqft com; replacement spaces from 20 (5) Based on surrounding like sales from dataquick, MLS, County Assessor (5) Based on surrounding like sales from dataquick, MLS, County Assessor (5) Based on surrounding like sales from dataquick, MLS, County Assessor (6) Determined from sales of property with like zoning and/or County Assessor appraised Land value (6) Determined from sales of property with like zoning and/or County Assessor appraised Land value (6) Determined from sales of property with like zoning and/or County Assessor appraised Land value (7) Added value to the land with TDR up-zone; determined by a fixed net profit of 15% (7) Added value to the land with TDR up-zone; determined by a fixed net profit of 15% (7) Added value to the land with TDR up-zone; determined by a fixed net profit of 15% (8)% construction costs for grading, sewer, water, and roads (8)% construction costs for grading, sewer, water, and roads (8)% construction costs for grading, sewer, water, and roads (9) cost estimate taken from City 2003 feasibility study which used $26K, assuming here 70% increase in costs (9) cost estimate taken from City 2003 feasibility study which used $26K, assuming here 70% increase in costs (9) cost estimate taken from City 2003 feasibility study which used $26K, assuming here 70% increase in costs (10) % of direct costs that includes permitting costs, impact fees, legal, insurance and design costs (10) % of direct costs that includes permitting costs, impact fees, legal, insurance and design costs (10) % of direct costs that includes permitting costs, impact fees, legal, insurance and design costs (12) Assumes bank loans 75% of total project costs, with a linear draw; interest payment 7% on 60% of this amount for 2 years(12) Assumes bank loans 75% of total project costs, with a linear draw; interest payment 7% on 60% of this amount for 2 years (12) Assumes bank loans 75% of total project costs, with a linear draw; interest payment 7% on 60% of this amoun (13) Private equity investors expect 80% split of net profit with no 'preferred return' payments during development period (13) Private equity investors expect 80% split of net profit with no 'preferred return' payments during development period (13) Private equity investors expect 80% split of net profit with no 'preferred return' payments during development p (14) % of total revenue landowner receives as payment above baseline land costs in a pre-development agreement; (14) % of total revenue landowner receives as payment above baseline land costs in a pre-development agreement; (14) % of total revenue landowner receives as payment above baseline land costs in a pre-development agreemen this amount compensates receiving site land owner for capitalized land value with a TDR up-zone this amount compensates receiving site land owner for capitalized land value with a TDR up-zone this amount compensates receiving site land owner for capitalized land value with a TDR up-zone 17
53 Appendix D: Secondary Screening - Developer Willingness to Pay for TDRs Appendix D: Secondary Screening - Developer Willingness to Pay for TDRs Appendix D: Secondary Screening - Developer Willingness to Pay for TDRs City of Santa Barbara : Redevelopment Site City of Santa Barbara : Redevelopment Site City of Santa Barbara : Redevelopment Site 100% residential market rate townhomes (no commercial) - 20 units/acre Mixed Income Townhomes - 15% Workforce - 20 units/ac Mixed Income Townhomes - 30% Workforce - 20 units/ac Site Characteristics Site Characteristics Site Characteristics Parcel(s) Size 2.5 Parcel(s) Size 2.5 Parcel(s) Size 2.5 Buildable Area (1) 2.00 Buildable Area (1) 2.00 Buildable Area (1) 2.00 Existing Zoning M - 1, HRC - 2 Existing Zoning M - 1, HRC - 2 Existing Zoning M - 1, HRC - 2 TDR Re-zone / Up-zone (2) 20 units/ac TDR Re-zone / Up-zone (2) 20 units/ac TDR Re-zone / Up-zone (2) 20 units/ac Development Program Development Program Development Program Residential Residential Residential # of units w/ existing zoning 0 # of units w/ existing zoning 0 # of units w/ existing zoning 0 # of units w/ TDR up-zone 40 # of units w/ TDR up-zone 40 # of units w/ TDR up-zone 40 # of Total Units 40 # of Total Units 40 # of Total Units 40 Average Market Rate Unit Size (3) 1,250 Average Market Rate Unit Size (3) 1,250 Average Market Rate Unit Size (3) 1,250 Average Affordable Rate Unit Size (3) 850 Average Affordable Rate Unit Size (3) 850 Average Affordable Rate Unit Size (3) 850 Commercial Commercial Commercial Allowed square footage 0 Allowed square footage 0 Allowed square footage 0 Additional Up-zone square footage 0 Additional Up-zone square footage 0 Additional Up-zone square footage 0 Parking Parking Parking Residential Spaces (4) 90 Residential Spaces (4) 84 Residential Spaces (4) 78 Commercial Spaces (4) 0 Commercial Spaces (4) 0 Commercial Spaces (4) 0 Building Revenue Assumption Total Building Revenue Assumption Total Building Revenue Assumption Total Residential Residential Residential Market Rate Units 100% 40 Market Rate Units 85% 34 Market Rate Units 70% 28 Average Sale Price / sqft (5) $900 Average Sale Price / sqft (5) $900 Average Sale Price / sqft (5) $900 Average Unit Sale Price (5) $1,125,000 45,000,000 Average Unit Sale Price (5) $1,125,000 38,250,000 Average Unit Sale Price (5) $1,125,000 31,500,000 Affordable Units 0% 0 Affordable Units 15% 6 Affordable Units 30% 12 Area Median Income (4-person HH) $64,700 Area Median Income (4-person HH) $64,700 Area Median Income (4-person HH) $64,700 Income Category (% of AMI) % Income Category (% of AMI) % Income Category (% of AMI) % Sales Price $450,000 0 Sales Price $450,000 2,700,000 Sales Price $450,000 5,400,000 Commercial 0 0 Commercial 0 0 Commercial 0 0 Lease Rate Lease Rate Lease Rate Revenue Periods/year Revenue Periods/year Revenue Periods/year Gross Annual Income Gross Annual Income Gross Annual Income Less Vacancy Less Vacancy Less Vacancy Less Operating Expenses Less Operating Expenses Less Operating Expenses Net Operating Income Net Operating Income Net Operating Income Capitalized Value 0 Capitalized Value 0 Capitalized Value 0 Total Project Revenue 45,000,000 Total Project Revenue 40,950,000 Total Project Revenue 36,900,000 Land (per acre and total, see note 6) $1,149,126 2,872,815 Land (per acre and total, see note 6) $1,149,126 2,872,815 Land (per acre and total, see note 6) $1,149,126 2,872,815 Value of TDR's (7) 17,406,606 Value of TDR's (7) 15,079,739 Value of TDR's (7) 12,752,892 Total Land Value 20,279,421 Total Land Value 17,952,554 Total Land Value 15,625,707 Building Construction Building Construction Building Construction Res. Construction Costs per sqft $130 6,500,000 Res. Construction Costs per sqft $130 6,188,000 Res. Construction Costs per sqft $130 5,876,000 Site Development Costs (8) 15% 975,000 Site Development Costs (8) 15% 928,200 Site Development Costs (8) 15% 881,400 Comm. Construction Costs per sqft $80 0 Comm. Construction Costs per sqft $80 0 Comm. Construction Costs per sqft $80 0 Parking (podium) Construction (per space see note 9 $17,000 1,530,000 Parking (podium) Construction (per space see note 9) $17,000 1,428,000 Parking (podium) Construction (per space see note $17,000 1,326,000 (10) 25% 2,969,454 (10) 25% 2,854,254 (10) 25% 2,739,054 Developer Fee (11) 3% 1,350,000 Developer Fee (11) 3% 1,228,500 Developer Fee (11) 3% 1,107,000 Financing Financing Financing Debt Financing (12) 2,621,102 Debt Financing (12) 2,385,202 Debt Financing (12) 2,149,303 Equity Partner Financing (see profit spilt below, note 13) Equity Partner Financing (see profit spilt below, note 13) Equity Partner Financing (see profit spilt below, note 13) Marketing & Commission (% of Tot.Rev) 4.5% 2,025,000 Marketing & Commission (% of Tot.Rev) 4.5% 1,842,750 Marketing & Commission (% of Tot.Rev) 4.5% 1,660,500 Total 38,249,977 Total 34,807,459 Total 31,364,963 Net Profit 6,750,023 Net Profit 6,142,541 Net Profit 5,535,037 Net Profit as a % of Revenues (expected to be 15%) 15.0% Net Profit as a % of Revenues (expected to be 15%) 15.0% Net Profit as a % of Revenues (expected to be 15%) 15.0% (Profit Split: 20% to developer and 80% to equity partner) (Profit Split: 20% to developer and 80% to equity partner) (Profit Split: 20% to developer and 80% to equity partner) Developer Funds Available for TDRs Developer Funds Available for TDRs Developer Funds Available for TDRs Total Value of TDR's (from above) 17,406,606 Total Value of TDR's (from above) 15,079,739 Total Value of TDR's (from above) 12,752,892 Less Pre-Development Agreement Land Payment (14) 5% 2,250,000 Less Pre-Development Agreement Land Payment (14) 5% 2,047,500 Less Pre-Development Agreement Land Payment (14) 5% 1,845,000 Developers' Total Willingness to Pay for TDRs 15,156,606 Developers' Total Willingness to Pay for TDRs 13,032,239 Developers' Total Willingness to Pay for TDRs 10,907,892 Per unit Willingness to PAY for TDR 378,915 Per unit Willingness to PAY for TDR 325,806 Per unit Willingness to PAY for TDR 272,697 (1) 80% of total parcel(s) size (1) 80% of total parcel(s) size (1) 80% of total parcel(s) size (2) Estimated allowed up-zoning based on surrounding landuses and densities; (2) Estimated allowed up-zoning based on surrounding landuses and densities; (2) Estimated allowed up-zoning based on surrounding landuses and densities; three stories- two residential above one level of above street level parking three stories- two residential above one level of above street level parking three stories- two residential above one level of above street level parking (3) Average size for a luxury 2-bedroom townhome at 20 units/acre (3) Average size for a luxury 2-bedroom townhome at 20 units/acre (3) Average size for a luxury 2-bedroom townhome at 20 units/acre (4) 2 for every market rate unit, 1 for workforce and 1 for every 4 units; # comm lots = 1/500sqft comm (4) 2 for every market rate unit, 1 for workforce and 1 for every 4 units; # comm lots = 1/500sqft comm (4) 2 for every market rate unit, 1 for workforce and 1 for every 4 units; # comm lots = 1/500sqft comm (5) Based on surrounding like sales from dataquick, MLS, County Assessor (5) Based on surrounding like sales from dataquick, MLS, County Assessor (5) Based on surrounding like sales from dataquick, MLS, County Assessor (6) City purchased property in 2001 for $2,872,815; assumes City would sell to recoup costs and make $ in dev agreement (6) City purchased property in 2001 for $2,872,815; assumes City would sell to recoup costs and make $ in dev agreement (6) City purchased property in 2001 for $2,872,815; assumes City would sell to recoup costs and make $ in d (7) Added value to the land with TDR up-zone; determined by a fixed net profit of 15% (7) Added value to the land with TDR up-zone; determined by a fixed net profit of 15% (7) Added value to the land with TDR up-zone; determined by a fixed net profit of 15% (8)% construction costs for grading, sewer, water, and roads (8)% construction costs for grading, sewer, water, and roads (8)% construction costs for grading, sewer, water, and roads (9) Assumes podium style parking with each space 380 sf at a cost of $45/sf for a total of $17,000/space (9) Assumes podium style parking with each space 380 sf at a cost of $45/sf for a total of $17,000/space (9) Assumes podium style parking with each space 380 sf at a cost of $45/sf for a total of $17,000/space (10) % of direct costs that includes permitting costs, impact fees, legal, insurance and design costs (10) % of direct costs that includes permitting costs, impact fees, legal, insurance and design costs (10) % of direct costs that includes permitting costs, impact fees, legal, insurance and design costs (12) Assumes bank loans 75% of total project costs, with a linear draw; interest payment 7% on 60% of this amount for 2 years (12) Assumes bank loans 75% of total project costs, with a linear draw; interest payment 7% on 60% of this amount for 2 years (12) Assumes bank loans 75% of total project costs, with a linear draw; interest payment 7% on 60% of this (13) Private equity investors expect 80% split of net profit with no 'preferred return' payments during development period (13) Private equity investors expect 80% split of net profit with no 'preferred return' payments during development period (13) Private equity investors expect 80% split of net profit with no 'preferred return' payments during develop (14) % of total revenue landowner receives as payment above baseline land costs in a pre-development agreement; (14) % of total revenue landowner receives as payment above baseline land costs in a pre-development agreement; (14) % of total revenue landowner receives as payment above baseline land costs in a pre-development agr this amount compensates receiving site land owner for capitalized land value with a TDR up-zone this amount compensates receiving site land owner for capitalized land value with a TDR up-zone this amount compensates receiving site land owner for capitalized land value with a TDR up-zone 18
54 Appendix D: Secondary Screening - Developer Willingness to Pay for TDRs Appendix D: Secondary Screening - Developer Willingness to Pay for TDRs Appendix D: Secondary Screening - Developer Willingness to Pay for TDRs City of Santa Barbara : Pony Lot City of Santa Barbara : Pony Lot City of Santa Barbara : Pony Lot 100% residential market rate townhomes (no commercial) - 20 units/acre Mixed Income townhomes - 15% workforce (no commercial) - 20 units/acre Mixed Income townhomes - 30% workforce (no commercial) - 20 units/acre Site Characteristics Site Characteristics Site Characteristics Parcel(s) Size 2 Parcel(s) Size 2 Parcel(s) Size 2 Buildable Area (1) 1.40 Buildable Area (1) 1.40 Buildable Area (1) 1.40 Existing Zoning M - 1, HRC - 2 Existing Zoning M - 1, HRC - 2 Existing Zoning M - 1, HRC - 2 TDR Re-zone / Up-zone (2) 20 units/ac TDR Re-zone / Up-zone (2) 20 units/ac TDR Re-zone / Up-zone (2) 20 units/ac Development Program Development Program Development Program Residential Residential Residential # of units w/ existing zoning 0 # of units w/ existing zoning 0 # of units w/ existing zoning 0 # of units w/ TDR up-zone 28 # of units w/ TDR up-zone 28 # of units w/ TDR up-zone 28 # of Total Units 28 # of Total Units 28 # of Total Units 28 Average Market Rate Unit Size (3) 1,250 Average Market Rate Unit Size (3) 1,250 Average Market Rate Unit Size (3) 1,250 Average Affordable Rate Unit Size (3) 850 Average Affordable Rate Unit Size (3) 850 Average Affordable Rate Unit Size (3) 850 Commercial Commercial Commercial Allowed square footage 0 Allowed square footage 0 Allowed square footage 0 Additional Up-zone square footage 0 Additional Up-zone square footage 0 Additional Up-zone square footage 0 Parking Parking Parking Residential Spaces (4) 63 Residential Spaces (4) 59 Residential Spaces (4) 55 Commercial Spaces (4) 0 Commercial Spaces (4) 0 Commercial Spaces (4) 0 Building Revenue Assumption Total Building Revenue Assumption Total Building Revenue Assumption Total Residential Residential Residential Market Rate Units 100% 28 Market Rate Units 85% 24 Market Rate Units 70% 20 Average Sale Price / sqft (5) $900 Average Sale Price / sqft (5) $900 Average Sale Price / sqft (5) $900 Average Unit Sale Price (5) $1,125,000 31,500,000 Average Unit Sale Price (5) $1,125,000 26,775,000 Average Unit Sale Price (5) $1,125,000 22,050,000 Affordable Units 0% 0 Affordable Units 15% 4 Affordable Units 30% 8 Area Median Income (4-person HH) $64,700 Area Median Income (4-person HH) $64,700 Area Median Income (4-person HH) $64,700 Income Category (% of AMI) % Income Category (% of AMI) % Income Category (% of AMI) % Sales Price $450,000 0 Sales Price $450,000 1,890,000 Sales Price $450,000 3,780,000 Commercial 0 0 Commercial 0 0 Commercial 0 0 Lease Rate Lease Rate Lease Rate Revenue Periods/year Revenue Periods/year Revenue Periods/year Gross Annual Income Gross Annual Income Gross Annual Income Less Vacancy Less Vacancy Less Vacancy Less Operating Expenses Less Operating Expenses Less Operating Expenses Net Operating Income Net Operating Income Net Operating Income Capitalized Value 0 Capitalized Value 0 Capitalized Value 0 Total Project Revenue 31,500,000 Total Project Revenue 28,665,000 Total Project Revenue 25,830,000 Land (per acre and total, see note 6) $1,500,000 3,000,000 Land (per acre and total, see note 6) $1,500,000 3,000,000 Land (per acre and total, see note 6) $1,500,000 3,000,000 Value of TDR's (7) 10,948,352 Value of TDR's (7) 9,319,530 Value of TDR's (7) 7,690,737 Total Land Value 13,948,352 Total Land Value 12,319,530 Total Land Value 10,690,737 Building Construction Building Construction Building Construction Res. Construction Costs per sqft $130 4,550,000 Res. Construction Costs per sqft $130 4,331,600 Res. Construction Costs per sqft $130 4,113,200 Site Development Costs (8) 15% 682,500 Site Development Costs (8) 15% 649,740 Site Development Costs (8) 15% 616,980 Comm. Construction Costs per sqft $80 0 Comm. Construction Costs per sqft $80 0 Comm. Construction Costs per sqft $80 0 Parking (podium) Construction (per space see note $17,000 1,071,000 Parking (podium) Construction (per space see note $17, ,600 Parking (podium) Construction (per space see note $17, ,200 (10) 25% 2,325,875 (10) 25% 2,245,235 (10) 25% 2,164,595 Developer Fee (11) 3% 945,000 Developer Fee (11) 3% 859,950 Developer Fee (11) 3% 774,900 Financing Financing Financing Debt Financing (12) 1,834,773 Debt Financing (12) 1,669,641 Debt Financing (12) 1,504,512 Equity Partner Financing (see profit spilt below, note 13) Equity Partner Financing (see profit spilt below, note 13) Equity Partner Financing (see profit spilt below, note 13) Marketing & Commission (% of Tot.Rev) 4.5% 1,417,500 Marketing & Commission (% of Tot.Rev) 4.5% 1,289,925 Marketing & Commission (% of Tot.Rev) 4.5% 1,162,350 Total 26,775,000 Total 24,365,221 Total 21,955,474 Net Profit 4,725,000 Net Profit 4,299,779 Net Profit 3,874,526 Net Profit as a % of Revenues (expected to be 15%) 15.0% Net Profit as a % of Revenues (expected to be 15%) 15.0% Net Profit as a % of Revenues (expected to be 15%) 15.0% (Profit Split: 20% to developer and 80% to equity partner) (Profit Split: 20% to developer and 80% to equity partner) (Profit Split: 20% to developer and 80% to equity partner) Developer Funds Available for TDRs Developer Funds Available for TDRs Developer Funds Available for TDRs Total Value of TDR's (from above) 10,948,352 Total Value of TDR's (from above) 9,319,530 Total Value of TDR's (from above) 7,690,737 Less Pre-Development Agreement Land Payment (14) 5% 1,575,000 Less Pre-Development Agreement Land Payment (14) 5% 1,433,250 Less Pre-Development Agreement Land Payment (14) 5% 1,291,500 Developers' Total Willingness to Pay for TDRs 9,373,352 Developers' Total Willingness to Pay for TDRs 7,886,280 Developers' Total Willingness to Pay for TDRs 6,399,237 Per unit Willingness to PAY for TDR 334,763 Per unit Willingness to PAY for TDR 281,653 Per unit Willingness to PAY for TDR 228,544 (1) 70% of total parcel(s) size (1) 70% of total parcel(s) size (1) 70% of total parcel(s) size (2) Estimated allowed up-zoning based on surrounding landuses and densities; (2) Estimated allowed up-zoning based on surrounding landuses and densities; (2) Estimated allowed up-zoning based on surrounding landuses and densities; three stories- two residential above one level of above street level parking three stories- two residential above one level of above street level parking three stories- two residential above one level of above street level parking (3) Average size for a luxury 2-bedroom townhome at 20 units/acre (3) Average size for a luxury 2-bedroom townhome at 20 units/acre (3) Average size for a luxury 2-bedroom townhome at 20 units/acre (4) 2 for every market rate unit, 1 for workforce and 1 for every 4 units; # comm lots = 1/500sqft comm (4) 2 for every market rate unit, 1 for workforce and 1 for every 4 units; # comm lots = 1/500sqft comm (4) 2 for every market rate unit, 1 for workforce and 1 for every 4 units; # comm lots = 1/500sqft comm (5) Based on surrounding like sales from dataquick, MLS, County Assessor (5) Based on surrounding like sales from dataquick, MLS, County Assessor (5) Based on surrounding like sales from dataquick, MLS, County Assessor (6) Determined from sales of property with like zoning and/or County Assessor appraised Land value (6) Determined from sales of property with like zoning and/or County Assessor appraised Land value (6) Determined from sales of property with like zoning and/or County Assessor appraised Land value (7) Added value to the land with TDR up-zone; determined by a fixed net profit of 15% (7) Added value to the land with TDR up-zone; determined by a fixed net profit of 15% (7) Added value to the land with TDR up-zone; determined by a fixed net profit of 15% (8)% construction costs for grading, sewer, water, and roads (8)% construction costs for grading, sewer, water, and roads (8)% construction costs for grading, sewer, water, and roads (9) Assumes podium style parking with each space 380 sf at a cost of $45/sf for a total of $17,000/space (9) Assumes podium style parking with each space 380 sf at a cost of $45/sf for a total of $17,000/space (9) Assumes podium style parking with each space 380 sf at a cost of $45/sf for a total of $17,000/space (10) % of direct costs that includes permitting costs, impact fees, legal, insurance and design costs (10) % of direct costs that includes permitting costs, impact fees, legal, insurance and design costs (10) % of direct costs that includes permitting costs, impact fees, legal, insurance and design costs (12) Assumes bank loans 75% of total project costs, with a linear draw; interest payment 7% on 60% of this amount for 2 years (12) Assumes bank loans 75% of total project costs, with a linear draw; interest payment 7% on 60% of this amount for 2 years (12) Assumes bank loans 75% of total project costs, with a linear draw; interest payment 7% on 60% of this am (13) Private equity investors expect 80% split of net profit with no 'preferred return' payments during development period (13) Private equity investors expect 80% split of net profit with no 'preferred return' payments during development period (13) Private equity investors expect 80% split of net profit with no 'preferred return' payments during developm (14) % of total revenue landowner receives as payment above baseline land costs in a pre-development agreement; (14) % of total revenue landowner receives as payment above baseline land costs in a pre-development agreement; (14) % of total revenue landowner receives as payment above baseline land costs in a pre-development agree this amount compensates receiving site land owner for capitalized land value with a TDR up-zone this amount compensates receiving site land owner for capitalized land value with a TDR up-zone this amount compensates receiving site land owner for capitalized land value with a TDR up-zone 19
55 Unincorporated Rural South Coast Receiving Sites - WTP 1. Winchester/Ellwood Canyon (Rural 1a,b ) 2. Winchester/Ellwood Canyon (Rural 1c) 3. Glen Annie Golf Course (Rural 2) 4. Rural Area 3 5. Rural Area 4 6. Summerland Eastern Bluffs (Rural 6) 20
56 Appendix D: Secondary Screening - Developer Willingness to Pay for TDRs Appendix D: Secondary Screening - Developer Willingness to Pay for TDRs Appendix D: Secondary Screening - Developer Willingness to Pay for TDRs Unincorporated South Coast: Winchester Canyon - Vincent's Property (R 1a,b) Unincorporated South Coast: Winchester Canyon - Vincent's Property (R 1a,b) Unincorporated South Coast: Winchester Canyon - Vincent's Property (R 1a,b) 100% residential market rate single family units Mixed Income ( 85% market rate, 15% affordable workforce units) single family units Mixed Income ( 85% market rate, 15% affordable workforce units) single family units Site Characteristics Site Characteristics Site Characteristics Parcel(s) Size 163 Parcel(s) Size 163 Parcel(s) Size 163 Buildable Area (1) 40% 65.2 Buildable Area (1) 40% 65.2 Buildable Area (1) 40% 65.2 Existing Zoning AG Existing Zoning AG Existing Zoning AG TDR Re-zone / Up-zone (2) 3.3 units/ac TDR Re-zone / Up-zone (2) 3.3 units/ac TDR Re-zone / Up-zone (2) 3.3 units/ac Development Program Development Program Development Program Residential Residential Residential # of units w/ existing zoning 1 # of units w/ existing zoning 1 # of units w/ existing zoning 1 # of units w/ TDR up-zone (based on buildable area) 214 # of units w/ TDR up-zone (based on buildable area) 214 # of units w/ TDR up-zone (based on buildable area) 214 # of Total Units 215 # of Total Units 215 # of Total Units 215 Average Market Rate Unit Size (3) 3,000 Average Market Rate Unit Size (3) 3,000 Average Market Rate Unit Size (3) 3,000 Average Affordable Rate Unit Size (3) Average Affordable Rate Unit Size (3) 1,500 Average Affordable Rate Unit Size (3) 1,500 Building Revenue Assumption Total Building Revenue Assumption Total Building Revenue Assumption Total Residential Residential Residential Market Rate Units 100% 214 Market Rate Units 85% 182 Market Rate Units 70% 150 Average Sale Price / sqft (4) $425 Average Sale Price / sqft (4) $425 Average Sale Price / sqft (4) $425 Average Unit Sale Price (4) $1,275,000 Average Unit Sale Price (4) $1,275,000 Average Unit Sale Price (4) $1,275,000 Affordable Units 0% 0 Affordable Units 15% 32 Affordable Units 30% 64 Area Median Income (4-person HH) Area Median Income (4-person HH) $64,700 Area Median Income (4-person HH) $64,700 Income Category (% of AMI) Income Category (% of AMI) % Income Category (% of AMI) % Sales Price Sales Price $330,000 Sales Price $330,000 Total Project Revenue 273,054,000 Total Project Revenue 242,696,820 Total Project Revenue 212,339,640 Land (per acre and total, see note 5) $22,000 3,586,000 Land (per acre and total, see note 5) $22,000 3,586,000 Land (per acre and total, see note 5) $22,000 3,586,000 Value of TDR's (6) 74,317,210 Value of TDR's (6) 61,372,858 Value of TDR's (6) 48,428,506 Total Land Value 77,903,210 Total Land Value 64,958,858 Total Land Value 52,014,506 Building Construction Building Construction Building Construction Res. Construction Costs per sqft $120 77,097,600 Res. Construction Costs per sqft $120 71,315,280 Res. Construction Costs per sqft $120 65,532,960 Site Development Costs (7) 20% 15,419,520 Site Development Costs (7) 20% 14,263,056 Site Development Costs (7) 20% 13,106,592 Comm. Construction Costs per sqft $80 0 Comm. Construction Costs per sqft $80 0 Comm. Construction Costs per sqft $80 0 (8) 25% 24,025,780 (8) 25% 22,291,084 (8) 25% 20,556,388 Developer Fee (9) 3% 8,191,620 Developer Fee (9) 3% 7,280,905 Developer Fee (9) 3% 6,370,189 Financing Financing Financing Debt Financing (10) 15,805,743 Debt Financing (10) 14,048,516 Debt Financing (10) 12,291,290 Equity Partner Financing (see profit spilt below, note 11) Equity Partner Financing (see profit spilt below, note 11) Equity Partner Financing (see profit spilt below, note 11) Marketing (% of Tot.Rev) 2.5% 6,826,350 Marketing (% of Tot.Rev) 2.5% 6,067,421 Marketing (% of Tot.Rev) 2.5% 5,308,491 Commission & Closing Costs (% of Tot.Rev) 2.5% 6,826,350 Commission & Closing Costs (% of Tot.Rev) 2.5% 6,067,421 Commission & Closing Costs (% of Tot.Rev) 2.5% 5,308,491 Total 232,096,173 Total 206,292,540 Total 180,488,906 Net Profit 40,957,827 Net Profit 36,404,280 Net Profit 31,850,734 Net Profit as a % of Revenues (11) 15.0% Net Profit as a % of Revenues (11) 15.0% Net Profit as a % of Revenues (11) 15.0% (Profit Split: 20% to developer and 80% to equity partner) (Profit Split: 20% to developer and 80% to equity partner) (Profit Split: 20% to developer and 80% to equity partner) Developer Funds Available for TDRs Developer Funds Available for TDRs Developer Funds Available for TDRs Total Value of TDR's (from above) 74,317,210 Total Value of TDR's (from above) 61,372,858 Total Value of TDR's (from above) 48,428,506 Less Pre-Development Agreement Land Payment (12) 5% 13,652,700 Less Pre-Development Agreement Land Payment (12) 5% 12,134,841 Less Pre-Development Agreement Land Payment (12) 5% 10,616,982 Developers' Total Willingness to Pay for TDRs 60,664,510 Developers' Total Willingness to Pay for TDRs 49,238,017 Developers' Total Willingness to Pay for TDRs 37,811,524 Per unit Willingness to PAY for TDR 283,267 Per unit Willingness to PAY for TDR 229,912 Per unit Willingness to PAY for TDR 176,557 (1) Assumes 40% two parcels; this equates to 50% and 20% of sites 'a' and 'b' respectively (1) Assumes 40% two parcels; this equates to 50% and 20% of sites 'a' and 'b' respectively (1) Assumes 40% two parcels; this equates to 50% and 20% of sites 'a' and 'b' respectively (2) Estimated allowed up-zoning based on surrounding landuses and densities (2) Estimated allowed up-zoning based on surrounding landuses and densities (2) Estimated allowed up-zoning based on surrounding landuses and densities (3) Average size for a single family detached unit at 3.3 units/acre (3) Average size for a single family detached unit at 3.3 units/acre (3) Average size for a single family detached unit at 3.3 units/acre (4) Based on surrounding like sales from dataquick, MLS, County Assessor (4) Based on surrounding like sales from dataquick, MLS, County Assessor (4) Based on surrounding like sales from dataquick, MLS, County Assessor (5) Determined from sales of property with like zoning (Ag land outside UGB assumed to sell at $22K/acre) (5) Determined from sales of property with like zoning (Ag land outside UGB assumed to sell at $22K/acre) (5) Determined from sales of property with like zoning (Ag land outside UGB assumed to sell at $22K/acre) (6) Added value to the land with TDR up-zone; determined by a fixed net profit of 15% (6) Added value to the land with TDR up-zone; determined by a fixed net profit of 15% (6) Added value to the land with TDR up-zone; determined by a fixed net profit of 15% (7) % construction costs for grading, sewer, water, and roads (more constrained sites face greater site costs) (7) % construction costs for grading, sewer, water, and roads (more constrained sites face greater site costs) (7) % construction costs for grading, sewer, water, and roads (more constrained sites face greater site costs) (8) % of direct costs that includes permitting costs, impact fees, legal, insurance and design costs (8) % of direct costs that includes permitting costs, impact fees, legal, insurance and design costs (8) % of direct costs that includes permitting costs, impact fees, legal, insurance and design costs (9) % of revenue developers charge to cover project overhead (9) % of revenue developers charge to cover project overhead (9) % of revenue developers charge to cover project overhead (10) Assumes bank loans 75% of total project costs, with a linear draw; interest payment 7% on 60% of this amount for 2 years (10) Assumes bank loans 75% of total project costs, with a linear draw; interest payment 7% on 60% of this amount for 2 years (10) Assumes bank loans 75% of total project costs, with a linear draw; interest payment 7% on 60% of this a (11) Private equity investors expect 80% split of net profit with no 'preferred return' payments during development period (11) Private equity investors expect 80% split of net profit with no 'preferred return' payments during development period (11) Private equity investors expect 80% split of net profit with no 'preferred return' payments during develop (12) % of total revenue landowner receives as payment above baseline land costs in a pre-development agreement; (12) % of total revenue landowner receives as payment above baseline land costs in a pre-development agreement; (12) % of total revenue landowner receives as payment above baseline land costs in a pre-development agre this amount compensates receiving site land owner for capitalized land value with a TDR up-zone this amount compensates receiving site land owner for capitalized land value with a TDR up-zone this amount compensates receiving site land owner for capitalized land value with a TDR up-zone 21
57 Appendix D: Secondary Screening - Developer Willingness to Pay for TDRs Appendix D: Secondary Screening - Developer Willingness to Pay for TDRs Appendix D: Secondary Screening - Developer Willingness to Pay for TDRs Unincorporated South Coast: Winchester Canyon - Cavalletto's Property (R1 c) Unincorporated South Coast: Winchester Canyon - Cavalletto's Property (R1 c) Unincorporated South Coast: Winchester Canyon - Cavalletto's Property (R1 c) 100% residential market rate single family units Mixed Income ( 85% market rate, 15% affordable workforce units) single family units Mixed Income ( 85% market rate, 15% affordable workforce units) single family units Site Characteristics Site Characteristics Site Characteristics Parcel(s) Size 100 Parcel(s) Size 100 Parcel(s) Size 100 Buildable Area (1) 20% 20 Buildable Area (1) 20% 20 Buildable Area (1) 20% 20 Existing Zoning AG Existing Zoning AG Existing Zoning AG TDR Re-zone / Up-zone (2) 1.8 units/ac TDR Re-zone / Up-zone (2) 1.8 units/ac TDR Re-zone / Up-zone (2) 1.8 units/ac Development Program Development Program Development Program Residential Residential Residential # of units w/ existing zoning 1 # of units w/ existing zoning 1 # of units w/ existing zoning 1 # of units w/ TDR up-zone (based on buildable area) 35 # of units w/ TDR up-zone (based on buildable area) 35 # of units w/ TDR up-zone (based on buildable area) 35 # of Total Units 36 # of Total Units 36 # of Total Units 36 Average Market Rate Unit Size (3) 3,000 Average Market Rate Unit Size (3) 3,000 Average Market Rate Unit Size (3) 3,000 Average Affordable Rate Unit Size (3) 1,500 Average Affordable Rate Unit Size (3) 1,500 Average Affordable Rate Unit Size (3) 1,500 Building Revenue Assumption Total Building Revenue Assumption Total Building Revenue Assumption Total Residential Residential Residential Market Rate Units 100% 35 Market Rate Units 85% 30 Market Rate Units 70% 25 Average Sale Price / sqft (4) $560 Average Sale Price / sqft (4) $560 Average Sale Price / sqft (4) $560 Average Unit Sale Price (4) $1,680,000 Average Unit Sale Price (4) $1,680,000 Average Unit Sale Price (4) $1,680,000 Affordable Units 0% 0 Affordable Units 15% 5 Affordable Units 30% 11 Area Median Income (4-person HH) Area Median Income (4-person HH) $64,700 Area Median Income (4-person HH) $64,700 Income Category (% of AMI) Income Category (% of AMI) % Income Category (% of AMI) % Sales Price Sales Price $330,000 Sales Price $330,000 Total Project Revenue 58,800,000 Total Project Revenue 51,712,500 Total Project Revenue 44,625,000 Land (per acre and total, see note 5) $22,000 2,200,000 Land (per acre and total, see note 5) $22,000 2,200,000 Land (per acre and total, see note 5) $22,000 2,200,000 Value of TDR's (6) 18,647,309 Value of TDR's (6) 15,135,825 Value of TDR's (6) 11,624,342 Total Land Value 20,847,309 Total Land Value 17,335,825 Total Land Value 13,824,342 Building Construction Building Construction Building Construction Res. Construction Costs per sqft $120 12,600,000 Res. Construction Costs per sqft $120 11,655,000 Res. Construction Costs per sqft $120 10,710,000 Site Development Costs (7) 30% 3,780,000 Site Development Costs (7) 30% 3,496,500 Site Development Costs (7) 30% 3,213,000 Comm. Construction Costs per sqft $80 0 Comm. Construction Costs per sqft $80 0 Comm. Construction Costs per sqft $80 0 (8) 25% 4,645,000 (8) 25% 4,337,875 (8) 25% 4,030,750 Developer Fee (9) 3% 1,764,000 Developer Fee (9) 3% 1,551,375 Developer Fee (9) 3% 1,338,750 Financing Financing Financing Debt Financing (10) 3,403,632 Debt Financing (10) 2,993,373 Debt Financing (10) 2,583,114 Equity Partner Financing (see profit spilt below, note 11) Equity Partner Financing (see profit spilt below, note 11) Equity Partner Financing (see profit spilt below, note 11) Marketing (% of Tot.Rev) 2.5% 1,470,000 Marketing (% of Tot.Rev) 2.5% 1,292,813 Marketing (% of Tot.Rev) 2.5% 1,115,625 Commission & Closing Costs (% of Tot.Rev) 2.5% 1,470,000 Commission & Closing Costs (% of Tot.Rev) 2.5% 1,292,813 Commission & Closing Costs (% of Tot.Rev) 2.5% 1,115,625 Total 49,979,941 Total 43,955,573 Total 37,931,205 Net Profit 8,820,059 Net Profit 7,756,927 Net Profit 6,693,795 Net Profit as a % of Revenues (11) 15.0% Net Profit as a % of Revenues (11) 15.0% Net Profit as a % of Revenues (11) 15.0% (Profit Split: 20% to developer and 80% to equity partner) (Profit Split: 20% to developer and 80% to equity partner) (Profit Split: 20% to developer and 80% to equity partner) Developer Funds Available for TDRs Developer Funds Available for TDRs Developer Funds Available for TDRs Total Value of TDR's (from above) 18,647,309 Total Value of TDR's (from above) 15,135,825 Total Value of TDR's (from above) 11,624,342 Less Pre-Development Agreement Land Payment (12) 5% 2,940,000 Less Pre-Development Agreement Land Payment (12) 5% 2,585,625 Less Pre-Development Agreement Land Payment (12) 5% 2,231,250 Developers' Total Willingness to Pay for TDRs 15,707,309 Developers' Total Willingness to Pay for TDRs 12,550,200 Developers' Total Willingness to Pay for TDRs 9,393,092 Per unit Willingness to PAY for TDR 448,780 Per unit Willingness to PAY for TDR 358,577 Per unit Willingness to PAY for TDR 268,374 (1) 20% of total parcel size due to slope constraints (1) 20% of total parcel size due to slope constraints (1) 20% of total parcel size due to slope constraints (2) Estimated allowed up-zoning based on surrounding landuses and densities (2) Estimated allowed up-zoning based on surrounding landuses and densities (2) Estimated allowed up-zoning based on surrounding landuses and densities (3) Average size for a single family detached unit at 1.8 units/acre (3) Average size for a single family detached unit at 1.8 units/acre (3) Average size for a single family detached unit at 1.8 units/acre (4) Based on surrounding like sales from dataquick, MLS, County Assessor (4) Based on surrounding like sales from dataquick, MLS, County Assessor (4) Based on surrounding like sales from dataquick, MLS, County Assessor (5) Determined from sales of property with like zoning (Ag land outside UGB assumed to sell at $22K/acre) (5) Determined from sales of property with like zoning (Ag land outside UGB assumed to sell at $22K/acre) (5) Determined from sales of property with like zoning (Ag land outside UGB assumed to sell at $22K/acre) (6) Added value to the land with TDR up-zone; determined by a fixed net profit of 15% (6) Added value to the land with TDR up-zone; determined by a fixed net profit of 15% (6) Added value to the land with TDR up-zone; determined by a fixed net profit of 15% (7) % construction costs for grading, sewer, water, and roads (more constrained sites face greater site costs) (7) % construction costs for grading, sewer, water, and roads (more constrained sites face greater site costs) (7) % construction costs for grading, sewer, water, and roads (more constrained sites face greater site costs (8) % of direct costs that includes permitting costs, impact fees, legal, insurance and design costs (8) % of direct costs that includes permitting costs, impact fees, legal, insurance and design costs (8) % of direct costs that includes permitting costs, impact fees, legal, insurance and design costs (9) % of revenue developers charge to cover project overhead (9) % of revenue developers charge to cover project overhead (9) % of revenue developers charge to cover project overhead (10) Assumes bank loans 75% of total project costs, with a linear draw; interest payment 7% on 60% of this amount for 2 years (10) Assumes bank loans 75% of total project costs, with a linear draw; interest payment 7% on 60% of this amount for 2 years (10) Assumes bank loans 75% of total project costs, with a linear draw; interest payment 7% on 60% of this (11) Private equity investors expect 80% split of net profit with no 'preferred return' payments during development period (11) Private equity investors expect 80% split of net profit with no 'preferred return' payments during development period (11) Private equity investors expect 80% split of net profit with no 'preferred return' payments during develop (12) % of total revenue landowner receives as payment above baseline land costs in a pre-development agreement; (12) % of total revenue landowner receives as payment above baseline land costs in a pre-development agreement; (12) % of total revenue landowner receives as payment above baseline land costs in a pre-development agr this amount compensates receiving site land owner for capitalized land value with a TDR up-zone this amount compensates receiving site land owner for capitalized land value with a TDR up-zone this amount compensates receiving site land owner for capitalized land value with a TDR up-zone 22
58 Appendix D: Secondary Screening - Willingness to Pay for TDRs Appendix D: Secondary Screening - Willingness to Pay for TDRs Appendix D: Secondary Screening - Willingness to Pay for TDRs Unincorporated South Coast - Glen Annie Golf Course Rural Area 2 Unincorporated South Coast - Glen Annie Golf Course Rural Area 2 Unincorporated South Coast - Glen Annie Golf Course Rural Area 2 100% residential market rate single family units Mixed Income ( 85% market rate, 15% affordable workforce units) single family units Mixed Income ( 70% market rate, 30% affordable workforce units) single family units Site Characteristics Site Characteristics Site Characteristics Parcel(s) Size 156 Parcel(s) Size 156 Parcel(s) Size 156 Buildable Area (1) 30% 46.8 Buildable Area (1) 46.8 Buildable Area (1) 46.8 Existing Zoning AG Existing Zoning AG Existing Zoning AG TDR Re-zone / Up-zone (2) 1.8 units/ac TDR Re-zone / Up-zone (2) 1.8 units/ac TDR Re-zone / Up-zone (2) 1.8 units/ac Development Program Development Program Development Program Residential Residential Residential # of units w/ existing zoning 1 # of units w/ existing zoning 1 # of units w/ existing zoning 1 # of units w/ TDR up-zone (based on buildable area) 83 # of units w/ TDR up-zone (based on buildable area) 83 # of units w/ TDR up-zone (based on buildable area) 83 # of Total Units 84 # of Total Units 84 # of Total Units 84 Average Market Rate Unit Size (3) 3,000 Average Market Rate Unit Size (3) 3,000 Average Market Rate Unit Size (3) 3,000 Average Affordable Rate Unit Size (3) Average Affordable Rate Unit Size (3) 1,500 Average Affordable Rate Unit Size (3) 1,500 Building Revenue Assumption Total Building Revenue Assumption Total Building Revenue Assumption Total Residential Residential Residential Market Rate Units 100% 83 Market Rate Units 85% 71 Market Rate Units 70% 58 Average Sale Price / sqft (4) $560 Average Sale Price / sqft (4) $560 Average Sale Price / sqft (4) $560 Average Unit Sale Price (4) $1,680,000 Average Unit Sale Price (4) $1,680,000 Average Unit Sale Price (4) $1,680,000 Affordable Units 0% 0 Affordable Units 15% 12 Affordable Units 30% 25 Area Median Income (4-person HH) Area Median Income (4-person HH) $64,700 Area Median Income (4-person HH) $64,700 Income Category (% of AMI) Income Category (% of AMI) % Income Category (% of AMI) % Sales Price Sales Price $330,000 Sales Price $330,000 Total Project Revenue 139,843,200 Total Project Revenue 122,987,100 Total Project Revenue 106,131,000 Land (per acre and total, see note 5) $22,000 3,432,000 Land (per acre and total, see note 5) $22,000 3,432,000 Land (per acre and total, see note 5) $22,000 3,432,000 Value of TDR's (6) 46,599,045 Value of TDR's (6) 38,247,603 Value of TDR's (6) 29,896,425 Total Land Value 50,031,045 Total Land Value 41,679,603 Total Land Value 33,328,425 Building Construction Building Construction Building Construction Res. Construction Costs per sqft $120 29,966,400 Res. Construction Costs per sqft $120 27,718,920 Res. Construction Costs per sqft $120 25,471,440 Site Development Costs (7) 30% 8,989,920 Site Development Costs (7) 30% 8,315,676 Site Development Costs (7) 30% 7,641,432 Comm. Construction Costs per sqft $80 0 Comm. Construction Costs per sqft $80 0 Comm. Construction Costs per sqft $80 0 (8) 25% 10,597,080 (8) 25% 9,866,649 (8) 25% 9,136,218 Developer Fee (9) 3% 4,195,296 Developer Fee (9) 3% 3,689,613 Developer Fee (9) 3% 3,183,930 Financing Financing Financing Debt Financing (10) 8,094,820 Debt Financing (10) 7,119,096 Debt Financing (10) 6,143,393 Equity Partner Financing (see profit spilt below, note 11) Equity Partner Financing (see profit spilt below, note 11) Equity Partner Financing (see profit spilt below, note 11) Marketing (% of Tot.Rev) 2.5% 3,496,080 Marketing (% of Tot.Rev) 2.5% 3,074,678 Marketing (% of Tot.Rev) 2.5% 2,653,275 Commission & Closing Costs (% of Tot.Rev) 2.5% 3,496,080 Commission & Closing Costs (% of Tot.Rev) 2.5% 3,074,678 Commission & Closing Costs (% of Tot.Rev) 2.5% 2,653,275 Total 118,866,720 Total 104,538,912 Total 90,211,388 Net Profit 20,976,480 Net Profit 18,448,188 Net Profit 15,919,612 Net Profit as a % of Revenues (11) 15.0% Net Profit as a % of Revenues (11) 15.0% Net Profit as a % of Revenues (11) 15.0% (Profit Split: 20% to developer and 80% to equity partner) (Profit Split: 20% to developer and 80% to equity partner) (Profit Split: 20% to developer and 80% to equity partner) Developer Funds Available for TDRs Developer Funds Available for TDRs Developer Funds Available for TDRs Total Value of TDR's (from above) 46,599,045 Total Value of TDR's (from above) 38,247,603 Total Value of TDR's (from above) 29,896,425 Less Pre-Development Agreement Land Payment (12) 5% 6,992,160 Less Pre-Development Agreement Land Payment (12) 5% 6,149,355 Less Pre-Development Agreement Land Payment (12) 5% 5,306,550 Developers' Total Willingness to Pay for TDRs 39,606,885 Developers' Total Willingness to Pay for TDRs 32,098,248 Developers' Total Willingness to Pay for TDRs 24,589,875 Per unit Willingness to PAY for TDR 475,816 Per unit Willingness to PAY for TDR 385,611 Per unit Willingness to PAY for TDR 295,409 (1) 30% of total parcel(s) size due to hillside and slope constraints (1) 30% of total parcel(s) size due to hillside and slope constraints (1) 30% of total parcel(s) size due to hillside and slope constraints (2) Estimated allowed up-zoning based on surrounding landuses and densities (2) Estimated allowed up-zoning based on surrounding landuses and densities (2) Estimated allowed up-zoning based on surrounding landuses and densities (3) Average size for a single family detached unit at 1.8 units/acre (3) Average size for a single family detached unit at 1.8 units/acre (3) Average size for a single family detached unit at 1.8 units/acre (4) Based on surrounding like sales from dataquick, MLS, County Assessor (4) Based on surrounding like sales from dataquick, MLS, County Assessor (4) Based on surrounding like sales from dataquick, MLS, County Assessor (5) Determined from sales of property with like zoning (Ag land outside UGB assumed to sell at $22k/acre) (5) Determined from sales of property with like zoning (Ag land outside UGB assumed to sell at $22k/acre) (5) Determined from sales of property with like zoning (Ag land outside UGB assumed to sell at $22k/acre) (6) Added value to the land with TDR up-zone; determined by a fixed net profit of 15% (6) Added value to the land with TDR up-zone; determined by a fixed net profit of 15% (6) Added value to the land with TDR up-zone; determined by a fixed net profit of 15% (7) % construction costs for grading, sewer, water, and roads (more constrained sites face greater site costs) (7) % construction costs for grading, sewer, water, and roads (more constrained sites face greater site costs) (7) % construction costs for grading, sewer, water, and roads (more constrained sites face greater site costs) (8) % of direct costs that includes permitting costs, impact fees, legal, insurance and design costs (8) % of direct costs that includes permitting costs, impact fees, legal, insurance and design costs (8) % of direct costs that includes permitting costs, impact fees, legal, insurance and design costs (9) % of revenue developers charge to cover project overhead (9) % of revenue developers charge to cover project overhead (9) % of revenue developers charge to cover project overhead (10) Assumes bank loans 75% of total project costs, with a linear draw; interest payment 7% on 60% of this amount for 2 years (10) Assumes bank loans 75% of total project costs, with a linear draw; interest payment 7% on 60% of this amount for 2 years (10) Assumes bank loans 75% of total project costs, with a linear draw; interest payment 7% on 60% of this am (11) Private equity investors expect 80% split of net profit with no 'preferred return' payments during development period (11) Private equity investors expect 80% split of net profit with no 'preferred return' payments during development period (11) Private equity investors expect 80% split of net profit with no 'preferred return' payments during developme (12) % of total revenue landowner receives as payment above baseline land costs in a pre-development agreement; (12) % of total revenue landowner receives as payment above baseline land costs in a pre-development agreement; (12) % of total revenue landowner receives as payment above baseline land costs in a pre-development agreem this amount compensates receiving site land owner for capitalized land value with a TDR up-zone this amount compensates receiving site land owner for capitalized land value with a TDR up-zone this amount compensates receiving site land owner for capitalized land value with a TDR up-zone 23
59 Appendix D: Secondary Screening - Developer Willingness to Pay for TDRs Appendix D: Secondary Screening - Developer Willingness to Pay for TDRs Appendix D: Secondary Screening - Developer Willingness to Pay for TDRs Unincorporated Urban South Coast - Area 3 Unincorporated Urban South Coast - Area 3 Unincorporated Urban South Coast - Area 3 100% residential market rate single family units Mixed Income ( 85% market rate, 15% affordable workforce units) single family units Mixed Income ( 70% market rate, 30% affordable workforce units) single family units Site Characteristics Site Characteristics Site Characteristics Parcel(s) Size 189 Parcel(s) Size 189 Parcel(s) Size 189 Buildable Area (1) 30% 56.7 Buildable Area (1) 30% 56.7 Buildable Area (1) 30% 56.7 Existing Zoning Ag - 20 Existing Zoning Ag - 20 Existing Zoning Ag - 20 TDR Re-zone / Up-zone (2) 1.8 units/ac TDR Re-zone / Up-zone (2) 1.8 units/ac TDR Re-zone / Up-zone (2) 1.8 units/ac Development Program Development Program Development Program Residential Residential Residential # of units w/ existing zoning 6 # of units w/ existing zoning 6 # of units w/ existing zoning 6 # of units w/ TDR up-zone (based on buildable area) 96 # of units w/ TDR up-zone (based on buildable area) 96 # of units w/ TDR up-zone (based on buildable area) 96 # of Total Units 102 # of Total Units 102 # of Total Units 102 Average Market Rate Unit Size (3) 3,000 Average Market Rate Unit Size (3) 3,000 Average Market Rate Unit Size (3) 3,000 Average Affordable Rate Unit Size (3) Average Affordable Rate Unit Size (3) 1,500 Average Affordable Rate Unit Size (3) 1,500 Building Revenue Assumption Total Building Revenue Assumption Total Building Revenue Assumption Total Residential Residential Residential Market Rate Units 100% 96 Market Rate Units 85% 82 Market Rate Units 70% 67 Average Sale Price / sqft (4) $560 Average Sale Price / sqft (4) $560 Average Sale Price / sqft (4) $560 Average Unit Sale Price (4) $1,680,000 Average Unit Sale Price (4) $1,680,000 Average Unit Sale Price (4) $1,680,000 Affordable Units 0% 0 Affordable Units 15% 14 Affordable Units 30% 29 Area Median Income (4-person HH) Area Median Income (4-person HH) $64,700 Area Median Income (4-person HH) $64,700 Income Category (% of AMI) Income Category (% of AMI) % Income Category (% of AMI) % Sales Price Sales Price $330,000 Sales Price $330,000 Total Project Revenue 161,380,800 Total Project Revenue 141,928,650 Total Project Revenue 122,476,500 Land (per acre and total, see note 5) $22,000 4,158,000 Land (per acre and total, see note 5) $22,000 4,158,000 Land (per acre and total, see note 5) $22,000 4,158,000 Value of TDR's (6) 53,528,954 Value of TDR's (6) 43,891,689 Value of TDR's (6) 34,254,135 Total Land Value 57,686,954 Total Land Value 48,049,689 Total Land Value 38,412,135 Building Construction Building Construction Building Construction Res. Construction Costs per sqft $120 34,581,600 Res. Construction Costs per sqft $120 31,987,980 Res. Construction Costs per sqft $120 29,394,360 Site Development Costs (7) 30% 10,374,480 Site Development Costs (7) 30% 9,596,394 Site Development Costs (7) 30% 8,818,308 Comm. Construction Costs per sqft $80 0 Comm. Construction Costs per sqft $80 0 Comm. Construction Costs per sqft $80 0 (8) 25% 12,278,520 (8) 25% 11,435,594 (8) 25% 10,592,667 Developer Fee (9) 3% 4,841,424 Developer Fee (9) 3% 4,257,860 Developer Fee (9) 3% 3,674,295 Financing Financing Financing Debt Financing (10) 9,341,512 Debt Financing (10) 8,215,546 Debt Financing (10) 7,089,558 Equity Partner Financing (see profit spilt below, note 11) Equity Partner Financing (see profit spilt below, note 11) Equity Partner Financing (see profit spilt below, note 11) Marketing (% of Tot.Rev) 2.5% 4,034,520 Marketing (% of Tot.Rev) 2.5% 3,548,216 Marketing (% of Tot.Rev) 2.5% 3,061,913 Commission & Closing Costs (% of Tot.Rev) 2.5% 4,034,520 Commission & Closing Costs (% of Tot.Rev) 2.5% 3,548,216 Commission & Closing Costs (% of Tot.Rev) 2.5% 3,061,913 Total 137,173,530 Total 120,639,494 Total 104,105,147 Net Profit 24,207,270 Net Profit 21,289,156 Net Profit 18,371,353 Net Profit as a % of Revenues (11) 15.0% Net Profit as a % of Revenues (11) 15.0% Net Profit as a % of Revenues (11) 15.0% (Profit Split: 20% to developer and 80% to equity partner) (Profit Split: 20% to developer and 80% to equity partner) (Profit Split: 20% to developer and 80% to equity partner) Developer Funds Available for TDRs Developer Funds Available for TDRs Developer Funds Available for TDRs Total Value of TDR's (from above) 53,528,954 Total Value of TDR's (from above) 43,891,689 Total Value of TDR's (from above) 34,254,135 Less Pre-Development Agreement Land Payment (12) 5% 8,069,040 Less Pre-Development Agreement Land Payment (12) 5% 7,096,433 Less Pre-Development Agreement Land Payment (12) 5% 6,123,825 Developers' Total Willingness to Pay for TDRs 45,459,914 Developers' Total Willingness to Pay for TDRs 36,795,256 Developers' Total Willingness to Pay for TDRs 28,130,310 Per unit Willingness to PAY for TDR 473,245 Per unit Willingness to PAY for TDR 383,045 Per unit Willingness to PAY for TDR 292,841 (1) 30% of total parcel(s) size, due to site slope constraints (1) 30% of total parcel(s) size, due to site slope constraints (1) 30% of total parcel(s) size, due to site slope constraints (2) Estimated allowed up-zoning based on surrounding landuses and densities (2) Estimated allowed up-zoning based on surrounding landuses and densities (2) Estimated allowed up-zoning based on surrounding landuses and densities (3) Average size for a single family detached unit at 1.8 units/acre (3) Average size for a single family detached unit at 1.8 units/acre (3) Average size for a single family detached unit at 1.8 units/acre (4) Based on surrounding like sales from dataquick, MLS, County Assessor (4) Based on surrounding like sales from dataquick, MLS, County Assessor (4) Based on surrounding like sales from dataquick, MLS, County Assessor (5) Determined from sales of property with like zoning (Ag land outside UGB assumed to sell at $22k/acre) (5) Determined from sales of property with like zoning (Ag land outside UGB assumed to sell at $22k/acre) (5) Determined from sales of property with like zoning (Ag land outside UGB assumed to sell at $22k/acre) (6) Added value to the land with TDR up-zone; determined by a fixed net profit of 15% (6) Added value to the land with TDR up-zone; determined by a fixed net profit of 15% (6) Added value to the land with TDR up-zone; determined by a fixed net profit of 15% (7) % construction costs for grading, sewer, water, and roads (more constrained sites face greater site costs) (7) % construction costs for grading, sewer, water, and roads (more constrained sites face greater site costs) (7) % construction costs for grading, sewer, water, and roads (more constrained sites face greater site costs) (8) % of direct costs that includes permitting costs, impact fees, legal, insurance and design costs (8) % of direct costs that includes permitting costs, impact fees, legal, insurance and design costs (8) % of direct costs that includes permitting costs, impact fees, legal, insurance and design costs (9) % of revenue developers charge to cover project overhead (9) % of revenue developers charge to cover project overhead (9) % of revenue developers charge to cover project overhead (10) Assumes bank loans 75% of total project costs, with a linear draw; interest payment 7% on 60% of this amount for 2 years (10) Assumes bank loans 75% of total project costs, with a linear draw; interest payment 7% on 60% of this amount for 2 years (10) Assumes bank loans 75% of total project costs, with a linear draw; interest payment 7% on 60% of this am (11) Private equity investors expect 80% split of net profit with no 'preferred return' payments during development period (11) Private equity investors expect 80% split of net profit with no 'preferred return' payments during development period (11) Private equity investors expect 80% split of net profit with no 'preferred return' payments during developme (12) % of total revenue landowner receives as payment above baseline land costs in a pre-development agreement; (12) % of total revenue landowner receives as payment above baseline land costs in a pre-development agreement; (12) % of total revenue landowner receives as payment above baseline land costs in a pre-development agreem this amount compensates receiving site land owner for capitalized land value with a TDR up-zone this amount compensates receiving site land owner for capitalized land value with a TDR up-zone this amount compensates receiving site land owner for capitalized land value with a TDR up-zone 24
60 Appendix D: Secondary Screening - Willingness to Pay for TDRs Appendix D: Secondary Screening - Willingness to Pay for TDRs Appendix D: Secondary Screening - Willingness to Pay for TDRs Unincorporated South Coast - Rural area 4 Unincorporated South Coast - Rural area 4 Unincorporated South Coast - Rural area 4 100% residential market rate single family units Mixed Income ( 85% market rate, 15% affordable workforce units) single family units Mixed Income ( 70% market rate, 30% affordable workforce units) single family units Site Characteristics Site Characteristics Site Characteristics Parcel(s) Size 166 Parcel(s) Size 166 Parcel(s) Size 166 Buildable Area (1) 49.8 Buildable Area (1) 49.8 Buildable Area (1) 49.8 Existing Zoning Ag - 40 Existing Zoning Ag - 40 Existing Zoning Ag - 40 TDR Re-zone / Up-zone (2) 1.8 units/ac TDR Re-zone / Up-zone (2) 1.8 units/ac TDR Re-zone / Up-zone (2) 1.8 units/ac Development Program Development Program Development Program Residential Residential Residential # of units w/ existing zoning 3 # of units w/ existing zoning 3 # of units w/ existing zoning 3 # of units w/ TDR up-zone (based on buildable area) 87 # of units w/ TDR up-zone 87 # of units w/ TDR up-zone 87 # of Total Units 90 # of Total Units 90 # of Total Units 90 Average Market Rate Unit Size (3) 3,000 Average Net Market Rate Unit Size (3) 3,000 Average Net Market Rate Unit Size (3) 3,000 Average Affordable Rate Unit Size (3) Average Net Affordable Rate Unit Size (3) 1,500 Average Net Affordable Rate Unit Size (3) 1,500 Building Revenue Assumption Total Building Revenue Assumption Total Building Revenue Assumption Total Residential Residential Residential Market Rate Units 100% 87 Market Rate Units 85% 74 Market Rate Units 70% 61 Average Sale Price / sqft (4) $560 Average Sale Price / sqft (4) $560 Average Sale Price / sqft (4) $560 Average Unit Sale Price (4) $1,680,000 Average Unit Sale Price (4) $1,680,000 Average Unit Sale Price (4) $1,680,000 Affordable Units 0% 0 Affordable Units 15% 13 Affordable Units 30% 26 Area Median Income (4-person HH) Area Median Income (4-person HH) $64,700 Area Median Income (4-person HH) $64,700 Income Category (% of AMI) Income Category (% of AMI) % Income Category (% of AMI) % Sales Price Sales Price $330,000 Sales Price $330,000 Total Project Revenue 145,555,200 Total Project Revenue 128,010,600 Total Project Revenue 110,466,000 Land (per acre and total, see note 5) $22,000 3,652,000 Land (per acre and total, see note 5) $22,000 3,652,000 Land (per acre and total, see note 5) $22,000 3,652,000 Value of TDR's (6) 48,402,568 Value of TDR's (6) 39,710,321 Value of TDR's (6) 31,017,751 Total Land Value 52,054,568 Total Land Value 43,362,321 Total Land Value 34,669,751 Building Construction Building Construction Building Construction Res. Construction Costs per sqft $120 31,190,400 Res. Construction Costs per sqft $120 28,851,120 Res. Construction Costs per sqft $120 26,511,840 Site Development Costs (7) 30% 9,357,120 Site Development Costs (7) 30% 8,655,336 Site Development Costs (7) 30% 7,953,552 Comm. Construction Costs per sqft $80 0 Comm. Construction Costs per sqft $80 0 Comm. Construction Costs per sqft $80 0 (8) 25% 11,049,880 (8) 25% 10,289,614 (8) 25% 9,529,348 Developer Fee (9) 3% 4,366,656 Developer Fee (9) 3% 3,840,318 Developer Fee (9) 3% 3,313,980 Financing Financing Financing Debt Financing (10) 8,425,453 Debt Financing (10) 7,409,899 Debt Financing (10) 6,394,321 Equity Partner Financing (see profit spilt below, note 11) Equity Partner Financing (see profit spilt below, note 11) Equity Partner Financing (see profit spilt below, note 11) Marketing (% of Tot.Rev) 2.5% 3,638,880 Marketing (% of Tot.Rev) 2.5% 3,200,265 Marketing (% of Tot.Rev) 2.5% 2,761,650 Commission & Closing Costs (% of Tot.Rev) 2.5% 3,638,880 Commission & Closing Costs (% of Tot.Rev) 2.5% 3,200,265 Commission & Closing Costs (% of Tot.Rev) 2.5% 2,761,650 Total 123,721,837 Total 108,809,138 Total 93,896,091 Net Profit 21,833,363 Net Profit 19,201,462 Net Profit 16,569,909 Net Profit as a % of Revenues (11) 15.0% Net Profit as a % of Revenues (11) 15.0% Net Profit as a % of Revenues (11) 15.0% (Profit Split: 20% to developer and 80% to equity partner) (50% to developer and 50% to investor) (50% to developer and 50% to investor) Developer Funds Available for TDRs Developer Funds Available for TDRs Developer Funds Available for TDRs Total Value of TDR's (from above) 48,402,568 Total Value of TDR's (from above) 39,710,321 Total Value of TDR's (from above) 31,017,751 Less Pre-Development Agreement Land Payment (12) 5% 7,277,760 Less Pre-Development Agreement Land Payment (12) 5% 6,400,530 Less Pre-Development Agreement Land Payment (12) 5% 5,523,300 Developers' Total Willingness to Pay for TDRs 41,124,808 Developers' Total Willingness to Pay for TDRs 33,309,791 Developers' Total Willingness to Pay for TDRs 25,494,451 Per unit Willingness to PAY for TDR 474,663 Per unit Willingness to PAY for TDR 384,462 Per unit Willingness to PAY for TDR 294,257 (1) 30% of total parcel(s) size due to site slope constraints (1) 30% of total parcel(s) size due to site slope constraints (1) 30% of total parcel(s) size due to site slope constraints (2) Estimated allowed up-zoning based on surrounding landuses and densities (2) Estimated allowed up-zoning based on surrounding landuses and densities (2) Estimated allowed up-zoning based on surrounding landuses and densities (3) Average size for a single family detached unit at 1.8 units/acre (3) Average size for a single family detached unit at 1.8 units/acre (3) Average size for a single family detached unit at 1.8 units/acre (4) Based on surrounding like sales from dataquick, MLS, County Assessor (4) Based on surrounding like sales from dataquick, MLS, County Assessor (4) Based on surrounding like sales from dataquick, MLS, County Assessor (5) Determined from sales of property with like zoning (Ag land outside UGB assumed to sell at $22k/acre) (5) Determined from sales of property with like zoning (Ag land outside UGB assumed to sell at $22k/acre) (5) Determined from sales of property with like zoning (Ag land outside UGB assumed to sell at $22k/acre) (6) Added value to the land with TDR up-zone; determined by a fixed net profit of 15% (6) Added value to the land with TDR up-zone; determined by a fixed net profit of 15% (6) Added value to the land with TDR up-zone; determined by a fixed net profit of 15% (7) % construction costs for grading, sewer, water, and roads (more constrained sites face greater site costs) (7) % construction costs for grading, sewer, water, and roads (more constrained sites face greater site costs) (7) % construction costs for grading, sewer, water, and roads (more constrained sites face greater site costs) (8) % of direct costs that includes permitting costs, impact fees, legal, insurance and design costs (8) % of direct costs that includes permitting costs, impact fees, legal, insurance and design costs (8) % of direct costs that includes permitting costs, impact fees, legal, insurance and design costs (9) % of revenue developers charge to cover project overhead (9) % of revenue developers charge to cover project overhead (9) % of revenue developers charge to cover project overhead (10) Assumes bank loans 75% of total project costs, with a linear draw; interest payment 7% on 60% of this amount for 2 years (10) Assumes bank loans 75% of total project costs, with a linear draw; interest payment 7% on 60% of this amount for 2 years (10) Assumes bank loans 75% of total project costs, with a linear draw; interest payment 7% on 60% of this am (11) Private equity investors expect 80% split of net profit with no 'preferred return' payments during development period (11) Private equity investors expect 80% split of net profit with no 'preferred return' payments during development period (11) Private equity investors expect 80% split of net profit with no 'preferred return' payments during developme (12) % of total revenue landowner receives as payment above baseline land costs in a pre-development agreement; (12) % of total revenue landowner receives as payment above baseline land costs in a pre-development agreement; (12) % of total revenue landowner receives as payment above baseline land costs in a pre-development agreem this amount compensates receiving site land owner for capitalized land value with a TDR up-zone this amount compensates receiving site land owner for capitalized land value with a TDR up-zone this amount compensates receiving site land owner for capitalized land value with a TDR up-zone 25
61 Appendix D: Secondary Screening - Developer Willingness to Pay for TDRs Appendix D: Secondary Screening - Developer Willingness to Pay for TDRs Appendix D: Secondary Screening - Developer Willingness to Pay for TDRs Unincorporated South Coast: Summerland Bluffs - area 6 Unincorporated South Coast: Summerland Bluffs - area 6 Unincorporated South Coast: Summerland Bluffs - area 6 100% residential market rate single family units Mixed Income ( 85% market rate, 15% affordable workforce units) single family units Mixed Income ( 70% market rate, 30% affordable workforce units) single family units Site Characteristics Site Characteristics Site Characteristics Parcel(s) Size 29 Parcel(s) Size 29 Parcel(s) Size 29 Buildable Area (1) 14.5 Buildable Area (1) 14.5 Buildable Area (1) 14.5 Existing Zoning 3-E-1 Existing Zoning 3-E-1 Existing Zoning 3-E-1 TDR Re-zone / Up-zone (2) 1 units/ac TDR Re-zone / Up-zone (2) 1 units/ac TDR Re-zone / Up-zone (2) 1 units/ac Development Program Development Program Development Program Residential Residential Residential # of units w/ existing zoning 5 # of units w/ existing zoning 5 # of units w/ existing zoning 5 # of units w/ TDR up-zone (based on buildable area) 10 # of units w/ TDR up-zone (based on buildable area) 10 # of units w/ TDR up-zone (based on buildable area) 10 # of Total Units 15 # of Total Units 15 # of Total Units 15 Average Market Rate Unit Size (3) 4,000 Average Market Rate Unit Size (3) 4,000 Average Market Rate Unit Size (3) 4,000 Average Affordable Rate Unit Size (3) Average Affordable Rate Unit Size (3) Average Affordable Rate Unit Size (3) Building Revenue Assumption Total Building Revenue Assumption Total Building Revenue Assumption Total Residential Residential Residential Market Rate Units 100% 15 Market Rate Units 85% 12 Market Rate Units 70% 10 Average Sale Price / sqft (4) $750 Average Sale Price / sqft (4) $750 Average Sale Price / sqft (4) $750 Average Unit Sale Price (4) ######### Average Unit Sale Price (4) $3,000,000 Average Unit Sale Price (4) $3,000,000 Affordable Units 0% 0 Affordable Units 15% 2 Affordable Units 30% 4 Area Median Income (4-person HH) Area Median Income (4-person HH) $64,700 Area Median Income (4-person HH) $64,700 Income Category (% of AMI) Income Category (% of AMI) % Income Category (% of AMI) % Sales Price Sales Price $330,000 Sales Price $330,000 Sub Total Project Revenue 43,500,000 Sub Total Project Revenue 37,692,750 Sub Total Project Revenue 31,885,500 less revenue at exsitng zoning 15,000,000 less revenue at exsitng zoning 15,000,000 less revenue at exsitng zoning 15,000,000 Total TDR Project Revenue 28,500,000 Total TDR Project Revenue 22,692,750 Total TDR Project Revenue 16,885,500 Land (per acre and total, see note 5) $200,000 5,800,000 Land (per acre and total, see note 5) $200,000 5,800,000 Land (per acre and total, see note 5) $200,000 5,800,000 Value of TDR's (6) 8,528,575 Value of TDR's (6) 6,637,354 Value of TDR's (6) 4,746,159 Total Land Value 14,328,575 Total Land Value 12,437,354 Total Land Value 10,546,159 Building Construction Building Construction Building Construction Res. Construction Costs per sqft $175 10,150,000 Res. Construction Costs per sqft $175 8,627,500 Res. Construction Costs per sqft $175 7,105,000 Site Development Costs (7) 25% 2,537,500 Site Development Costs (7) 25% 2,156,875 Site Development Costs (7) 25% 1,776,250 Comm. Construction Costs per sqft $80 0 Comm. Construction Costs per sqft $80 0 Comm. Construction Costs per sqft $80 0 (8) 25% 4,621,875 (8) 25% 4,146,094 (8) 25% 3,670,313 Developer Fee (9) 3% 1,305,000 Developer Fee (9) 3% 1,130,783 Developer Fee (9) 3% 956,565 Financing Financing Financing Debt Financing (10) 2,569,550 Debt Financing (10) 2,222,891 Debt Financing (10) 1,876,234 Equity Partner Financing (see profit spilt below, note 11) Equity Partner Financing (see profit spilt below, note 11) Equity Partner Financing (see profit spilt below, note 11) Marketing (% of Tot.Rev) 2.5% 1,087,500 Marketing (% of Tot.Rev) 2.5% 942,319 Marketing (% of Tot.Rev) 2.5% 797,138 Commission,& Closing Costs (% of Tot.Rev) 2.5% 375,000 Commission,& Closing Costs (% of Tot.Rev) 2.5% 375,000 Commission,& Closing Costs (% of Tot.Rev) 2.5% 375,000 Sub Total 36,975,000 Sub Total 32,038,815 Sub Total 27,102,658 less costs at exsitng zoning 12,750,000 less costs at exsitng zoning 12,750,000 less costs at exsitng zoning 12,750,000 Total TDR 24,225,000 Total TDR 19,288,815 Total TDR 14,352,658 Net Profit (additional w/ TDR) 4,275,000 Net Profit (additional w/ TDR) 3,403,935 Net Profit (additional w/ TDR) 2,532,842 Net TDR Profit as a % of Revenues (11) 15.0% Net TDR Profit as a % of Revenues (11) 15.0% Net TDR Profit as a % of Revenues (11) 15.0% (Profit Split: 20% to developer and 80% to equity partner) (Profit Split: 20% to developer and 80% to equity partner) (Profit Split: 20% to developer and 80% to equity partner) Developer Funds Available for TDRs Developer Funds Available for TDRs Developer Funds Available for TDRs Total Value of TDR's (from above) 8,528,575 Total Value of TDR's (from above) 6,637,354 Total Value of TDR's (from above) 4,746,159 Less Pre-Development Agreement Land Payment (12) 5% 1,425,000 Less Pre-Development Agreement Land Payment (12) 5% 1,134,638 Less Pre-Development Agreement Land Payment (12) 5% 844,275 Developers' Total Willingness to Pay for TDRs 7,103,575 Developers' Total Willingness to Pay for TDRs 5,502,716 Developers' Total Willingness to Pay for TDRs 3,901,884 Per unit Willingness to PAY for TDR 747,745 Per unit Willingness to PAY for TDR 579,233 Per unit Willingness to PAY for TDR 410,725 (1) 50% of total parcel(s) size due to site geologic constraints (1) 50% of total parcel(s) size due to site geologic constraints (1) 50% of total parcel(s) size due to site geologic constraints (2) Estimated allowed up-zoning based on surrounding landuses and densities (2) Estimated allowed up-zoning based on surrounding landuses and densities (2) Estimated allowed up-zoning based on surrounding landuses and densities (3) Average size for a single family detached unit at 1 unit/acre (3) Average size for a single family detached unit at 1 unit/acre (3) Average size for a single family detached unit at 1 unit/acre (4) Based on surrounding like sales from dataquick, MLS, County Assessor (4) Based on surrounding like sales from dataquick, MLS, County Assessor (4) Based on surrounding like sales from dataquick, MLS, County Assessor (5) Determined by setting TDR value to zero with net profit of 15% at existing zoning; sites have higher land prices with residential (5) Determined by setting TDR value to zero with net profit of 15% at existing zoning; sites have higher land prices with reside (5) Determined by setting TDR value to zero with net profit of 15% at existing zoning; sites have higher land pric (6) Added value to the land with TDR up-zone; determined by a fixed net profit of 15% (6) Added value to the land with TDR up-zone; determined by a fixed net profit of 15% (6) Added value to the land with TDR up-zone; determined by a fixed net profit of 15% (7) % construction costs for grading, sewer, water, and roads (more constrained sites face greater site costs) (7) % construction costs for grading, sewer, water, and roads (more constrained sites face greater site costs) (7) % construction costs for grading, sewer, water, and roads (more constrained sites face greater site costs) (8) % of direct costs that includes permitting costs, impact fees, legal, insurance and design costs (8) % of direct costs that includes permitting costs, impact fees, legal, insurance and design costs (8) % of direct costs that includes permitting costs, impact fees, legal, insurance and design costs (9) % of revenue developers charge to cover project overhead (9) % of revenue developers charge to cover project overhead (9) % of revenue developers charge to cover project overhead (10) Assumes bank loans 75% of total project costs, with a linear draw; interest payment 7% on 60% of this amount for 2 years (10) Assumes bank loans 75% of total project costs, with a linear draw; interest payment 7% on 60% of this amount for 2 years(10) Assumes bank loans 75% of total project costs, with a linear draw; interest payment 7% on 60% of this amo (11) Private equity investors expect 80% split of net profit with no 'preferred return' payments during development period (11) Private equity investors expect 80% split of net profit with no 'preferred return' payments during development period (11) Private equity investors expect 80% split of net profit with no 'preferred return' payments during developme (12) % of total revenue landowner receives as payment above baseline land costs in a pre-development agreement; (12) % of total revenue landowner receives as payment above baseline land costs in a pre-development agreement; (12) % of total revenue landowner receives as payment above baseline land costs in a pre-development agreem this amount compensates receiving site land owner for capitalized land value with a TDR up-zone this amount compensates receiving site land owner for capitalized land value with a TDR up-zone this amount compensates receiving site land owner for capitalized land value with a TDR up-zone 26
62 Unincorporated Santa Ynez Receiving Sites - WTP 1. Inner rural parcels (total of all parcels) 2. Housing summit Group Site #1 27
63 Appendix D: Secondary Screening - Developer Willingness to Pay for TDRs Uincorporated Santa Ynez - Inner Rural (WTP for lot split to 10 ac X total # lot splits in inner rural area) 100% single familiy residential market rate units - lot sidivided from 1/40 ac zoning to 1/10 ac zoning Site Characteristics Parcel(s) Size 10 Buildable Area (1) 2 Existing Zoning AG - 40 TDR Re-zone / Up-zone (2) 1 unit/ 10 ac Development Program Residential # of units w/ existing zoning 0 # of units w/ TDR up-zone (based on buildable area) 1 # of Total Units 1 Average Market Rate Unit Size (3) 5,000 Average Affordable Rate Unit Size (3) Building Revenue Assumption Total Residential Market Rate Units 100% 1 Average Sale Price / sqft (4) $500 Average Unit Sale Price (4) $2,500,000 Affordable Units 0% 0 Area Median Income (4-person HH) Income Category (% of AMI) Sales Price Total Project Revenue 2,500,000 Land (per acre and total, see note 5) $50, ,000 Value of TDR's (6) 292,785 Total Land Value 792,785 Building Construction Res. Construction Costs per sqft $ ,000 Site Development Costs (7) 15% 90,000 Comm. Construction Costs per sqft $80 0 (8) 25% 297,500 Developer Fee (9) 3% 75,000 Financing Debt Financing (10) 144,712 Equity Partner Financing (see profit spilt below, note 11) Marketing (% of Tot.Rev) 2.5% 62,500 Commission & Closing Costs (% of Tot.Rev) 2.5% 62,500 Total 2,124,998 Net Profit 375,002 Net Profit as a % of Revenues (11) 15.0% (Profit Split: 20% to developer and 80% to equity partner) Developer Funds Available for TDRs Total Value of TDR's (from above) 292,785 Less Pre-Development Agreement Land Payment (12) 5% 125,000 Developers' Total Willingness to Pay for TDRs 167,785 Aggregate of Inner Rural parcel's WTP for TDRs 13,590,605 (81 potential lot 1 unit/10acres) (1) 20% of total parcel(s) size (2) Estimated allowed up-zoning based on surrounding landuses and densities (3) Average size for a single family detached unit at.1 units/acre (4) Based on surrounding like sales from dataquick, MLS, County Assessor (5) Determined from sales of property with like zoning (Ag land around Santa Ynez assumed to sell for $50k/acre) (6) Added value to the land with TDR up-zone; determined by a fixed net profit of 15% (7) % construction costs for grading, sewer, water, and roads (more constrained sites face greater site costs) (8) % of direct costs that includes permitting costs, impact fees, legal, insurance and design costs (9) % of revenue developers charge to cover project overhead (10) Assumes bank loans 75% of total project costs, with a linear draw; interest payment 7% on 60% of this amount for 2 y (11) Private equity investors expect 80% split of net profit with no 'preferred return' payments during development period (12) % of total revenue landowner receives as payment above baseline land costs in a pre-development agreement; this amount compensates receiving site land owner for capitalized land value with a TDR up-zone 28
64 Appendix D: Secondary Screening - Developer Willingness to Pay for TDRs Appendix D: Secondary Screening - Developer Willingness to Pay for TDRs Appendix D: Secondary Screening - Developer Willingness to Pay for TDRs Unincorporated Santa Ynez - Housing Summit Group Site #1 Unincorporated Santa Ynez - Housing Summit Group Site #1 Unincorporated Santa Ynez - Housing Summit Group Site #1 100% residential market rate single family units Mixed Income ( 85% market rate, 15% affordable workforce units) single family units Mixed Income ( 85% market rate, 15% affordable workforce units) single family units Site Characteristics Site Characteristics Site Characteristics Parcel(s) Size Parcel(s) Size Parcel(s) Size Buildable Area (1) 60% 9.7 Buildable Area (1) 60% 9.7 Buildable Area (1) 60% 9.7 Existing Zoning AG - 10 Existing Zoning AG - 10 Existing Zoning AG - 10 TDR Re-zone / Up-zone (2) 4.6 units/ac TDR Re-zone / Up-zone (2) 4.6 units/ac TDR Re-zone / Up-zone (2) 4.6 units/ac Development Program Development Program Development Program Residential Residential Residential # of units w/ existing zoning 1 # of units w/ existing zoning 1 # of units w/ existing zoning 1 # of units w/ TDR up-zone (based on buildable area) 44 # of units w/ TDR up-zone (based on buildable area) 44 # of units w/ TDR up-zone (based on buildable area) 44 # of Total Units 45 # of Total Units 45 # of Total Units 45 Average Market Rate Unit Size (3) 2,500 Average Market Rate Unit Size (3) 2,500 Average Market Rate Unit Size (3) 2,500 Average Affordable Rate Unit Size (3) 1,500 Average Affordable Rate Unit Size (3) 1,500 Average Affordable Rate Unit Size (3) 1,500 Building Revenue Assumption Total Building Revenue Assumption Total Building Revenue Assumption Total Residential Residential Residential Market Rate Units 100% 44 Market Rate Units 85% 37 Market Rate Units 70% 31 Average Sale Price / sqft (4) $353 Average Sale Price / sqft (4) $353 Average Sale Price / sqft (4) $353 Average Unit Sale Price (4) $882,600 Average Unit Sale Price (4) $882,600 Average Unit Sale Price (4) $882,600 Affordable Units 0% 0 Affordable Units 15% 7 Affordable Units 30% 13 Area Median Income (4-person HH) Area Median Income (4-person HH) $64,700 Area Median Income (4-person HH) $64,700 Income Category (% of AMI) Income Category (% of AMI) % Income Category (% of AMI) % Sales Price Sales Price $330,000 Sales Price $330,000 Total Project Revenue 38,499,012 Total Project Revenue 34,883,350 Total Project Revenue 31,267,688 Land (per acre and total, see note 5) $50, ,000 Land (per acre and total, see note 5) $50, ,000 Land (per acre and total, see note 5) $50, ,000 Value of TDR's (6) 7,589,636 Value of TDR's (6) 6,143,533 Value of TDR's (6) 4,697,401 Total Land Value 8,401,636 Total Land Value 6,955,533 Total Land Value 5,509,401 Building Construction Building Construction Building Construction Res. Construction Costs per sqft $120 13,086,000 Res. Construction Costs per sqft $120 12,300,840 Res. Construction Costs per sqft $120 11,515,680 Site Development Costs (7) 15% 1,962,900 Site Development Costs (7) 15% 1,845,126 Site Development Costs (7) 15% 1,727,352 Comm. Construction Costs per sqft $80 0 Comm. Construction Costs per sqft $80 0 Comm. Construction Costs per sqft $80 0 (8) 25% 3,965,225 (8) 25% 3,739,492 (8) 25% 3,513,758 Developer Fee (9) 3% 1,154,970 Developer Fee (9) 3% 1,046,501 Developer Fee (9) 3% 938,031 Financing Financing Financing Debt Financing (10) 2,228,517 Debt Financing (10) 2,019,224 Debt Financing (10) 1,809,929 Equity Partner Financing (see profit spilt below, note 11) Equity Partner Financing (see profit spilt below, note 11) Equity Partner Financing (see profit spilt below, note 11) Marketing (% of Tot.Rev) 2.5% 962,475 Marketing (% of Tot.Rev) 2.5% 872,084 Marketing (% of Tot.Rev) 2.5% 781,692 Commission & Closing Costs (% of Tot.Rev) 2.5% 962,475 Commission & Closing Costs (% of Tot.Rev) 2.5% 872,084 Commission & Closing Costs (% of Tot.Rev) 2.5% 781,692 Total 32,724,199 Total 29,650,883 Total 26,577,535 Net Profit 5,774,813 Net Profit 5,232,468 Net Profit 4,690,153 Net Profit as a % of Revenues (11) 15.0% Net Profit as a % of Revenues (11) 15.0% Net Profit as a % of Revenues (11) 15.0% (Profit Split: 20% to developer and 80% to equity partner) (Profit Split: 20% to developer and 80% to equity partner) (Profit Split: 20% to developer and 80% to equity partner) Developer Funds Available for TDRs Developer Funds Available for TDRs Developer Funds Available for TDRs Total Value of TDR's (from above) 7,589,636 Total Value of TDR's (from above) 6,143,533 Total Value of TDR's (from above) 4,697,401 Less Pre-Development Agreement Land Payment (12) 5% 1,924,951 Less Pre-Development Agreement Land Payment (12) 5% 1,744,168 Less Pre-Development Agreement Land Payment (12) 5% 1,563,384 Developers' Total Willingness to Pay for TDRs 5,664,685 Developers' Total Willingness to Pay for TDRs 4,399,365 Developers' Total Willingness to Pay for TDRs 3,134,016 Per unit Willingness to PAY for TDR 129,864 Per unit Willingness to PAY for TDR 100,857 Per unit Willingness to PAY for TDR 71,848 (1) 60% of total parcel(s) size, because of minimal sight constraints (1) 60% of total parcel(s) size, because of minimal sight constraints (1) 60% of total parcel(s) size, because of minimal sight constraints (2) Estimated allowed up-zoning based on surrounding landuses and densities (2) Estimated allowed up-zoning based on surrounding landuses and densities (2) Estimated allowed up-zoning based on surrounding landuses and densities (3) Average size for a single family detached unit at 4.6 units/acre (3) Average size for a single family detached unit at 4.6 units/acre (3) Average size for a single family detached unit at 4.6 units/acre (4) Based on surrounding like sales from dataquick, MLS, County Assessor (4) Based on surrounding like sales from dataquick, MLS, County Assessor (4) Based on surrounding like sales from dataquick, MLS, County Assessor (5) Determined from sales of property with like zoning (Ag land around Santa Ynez assumed to sell for $50k/acre) (5) Determined from sales of property with like zoning (Ag land around Santa Ynez assumed to sell for $50k/acre) (5) Determined from sales of property with like zoning (Ag land around Santa Ynez assumed to sell for $ (6) Added value to the land with TDR up-zone; determined by a fixed net profit of 15% (6) Added value to the land with TDR up-zone; determined by a fixed net profit of 15% (6) Added value to the land with TDR up-zone; determined by a fixed net profit of 15% (7) % construction costs for grading, sewer, water, and roads (more constrained sites face greater site costs) (7) % construction costs for grading, sewer, water, and roads (more constrained sites face greater site costs) (7) % construction costs for grading, sewer, water, and roads (more constrained sites face greater site c (8) % of direct costs that includes permitting costs, impact fees, legal, insurance and design costs (8) % of direct costs that includes permitting costs, impact fees, legal, insurance and design costs (8) % of direct costs that includes permitting costs, impact fees, legal, insurance and design costs (9) % of revenue developers charge to cover project overhead (9) % of revenue developers charge to cover project overhead (9) % of revenue developers charge to cover project overhead (10) Assumes bank loans 75% of total project costs, with a linear draw; interest payment 7% on 60% of this amount for 2 yea (10) Assumes bank loans 75% of total project costs, with a linear draw; interest payment 7% on 60% of this amount for 2 year(10) Assumes bank loans 75% of total project costs, with a linear draw; interest payment 7% on 60% of (11) Private equity investors expect 80% split of net profit with no 'preferred return' payments during development period (11) Private equity investors expect 80% split of net profit with no 'preferred return' payments during development period (11) Private equity investors expect 80% split of net profit with no 'preferred return' payments during dev (12) % of total revenue landowner receives as payment above baseline land costs in a pre-development agreement; (12) % of total revenue landowner receives as payment above baseline land costs in a pre-development agreement; (12) % of total revenue landowner receives as payment above baseline land costs in a pre-developmen this amount compensates receiving site land owner for capitalized land value with a TDR up-zone this amount compensates receiving site land owner for capitalized land value with a TDR up-zone this amount compensates receiving site land owner for capitalized land value with a TDR up-zone 29
65 City of Carpinteria Receiving Sites - WTP 1. Bluffs 1 30
66 Appendix D: Secondary Screening - Developer Willingness to Pay for TDRs Appendix D: Secondary Screening - Developer Willingness to Pay for TDRs Appendix D: Secondary Screening - Developer Willingness to Pay for TDRs City of Carpinteria: Bluffs - 1 City of Carpinteria: Bluffs - 1 City of Carpinteria: Bluffs % residential market rate single family units Mixed Income (85% market rate, 15% affordable workforce units) single family units Mixed Income ( 70% market rate, 30% affordable workforce units) single family units Site Characteristics Site Characteristics Site Characteristics Parcel(s) Size 23 Parcel(s) Size 23 Parcel(s) Size 23 Buildable Area (1) 13.8 Buildable Area (1) 13.8 Buildable Area (1) 13.8 Existing Zoning PUD 1.8 u/ac Existing Zoning PUD 1.8 u/ac Existing Zoning PUD 1.8 u/ac TDR Re-zone / Up-zone (2) 3.3 units/ac TDR Re-zone / Up-zone (2) 3.3 units/ac TDR Re-zone / Up-zone (2) 3.3 units/ac Development Program Development Program Development Program Residential Residential Residential # of units w/ existing zoning 25 # of units w/ existing zoning 25 # of units w/ existing zoning 25 # of units w/ TDR up-zone (based on buildable area) 21 # of units w/ TDR up-zone (based on buildable area) 21 # of units w/ TDR up-zone (based on buildable area) 21 # of Total Units 46 # of Total Units 46 # of Total Units 46 Average Market Rate Unit Size (3) 3,000 Average Market Rate Unit Size (3) 3,000 Average Market Rate Unit Size (3) 3,000 Average Affordable Rate Unit Size (3) 2,000 Average Affordable Rate Unit Size (3) 2,000 Average Affordable Rate Unit Size (3) 2,000 Building Revenue Assumption Total Building Revenue Assumption Total Building Revenue Assumption Total Residential Residential Residential Market Rate Units 100% 46 Market Rate Units 85% 39 Market Rate Units 70% 32 Average Sale Price / sqft (4) $750 Average Sale Price / sqft (4) $750 Average Sale Price / sqft (4) $750 Average Unit Sale Price (4) $2,250,000 Average Unit Sale Price (4) $2,250,000 Average Unit Sale Price (4) $2,250,000 Affordable Units 0% 0 Affordable Units 15% 7 Affordable Units 30% 14 Area Median Income (4-person HH) $64,700 Area Median Income (4-person HH) $64,700 Area Median Income (4-person HH) $64,700 Income Category (% of AMI) % Income Category (% of AMI) % Income Category (% of AMI) % Sales Price $330,000 Sales Price $330,000 Sales Price $330,000 Sub Total Project Revenue 102,465,000 Sub Total Project Revenue 89,349,480 Sub Total Project Revenue 76,233,960 less revenue at exsitng zoning 55,890,000 less revenue at exsitng zoning 55,890,000 less revenue at exsitng zoning 55,890,000 Total TDR Project Revenue 46,575,000 Total TDR Project Revenue 33,459,480 Total TDR Project Revenue 20,343,960 Land (per acre and total, see note 5) $1,000,000 23,000,000 Land (per acre and total, see note 5) $1,000,000 23,000,000 Land (per acre and total, see note 5) $1,000,000 23,000,000 Value of TDR's (6) 15,970,307 Value of TDR's (6) 8,194,193 Value of TDR's (6) 418,122 Total Land Value 38,970,307 Total Land Value 31,194,193 Total Land Value 23,418,122 Building Construction Building Construction Building Construction Res. Construction Costs per sqft $175 23,908,500 Res. Construction Costs per sqft $175 22,713,075 Res. Construction Costs per sqft $175 21,517,650 Site Development Costs (7) 25% 5,977,125 Site Development Costs (7) 25% 5,678,269 Site Development Costs (7) 25% 5,379,413 Comm. Construction Costs per sqft $80 0 Comm. Construction Costs per sqft $80 0 Comm. Construction Costs per sqft $80 0 (8) 25% 13,221,406 (8) 25% 12,847,836 (8) 25% 12,474,266 Developer Fee (9) 3% 3,073,950 Developer Fee (9) 3% 2,680,484 Developer Fee (9) 3% 2,287,019 Financing Financing Financing Debt Financing (10) 6,641,800 Debt Financing (10) 5,858,881 Debt Financing (10) 5,075,965 Equity Partner Financing (see profit spilt below, note 11) Equity Partner Financing (see profit spilt below, note 11) Equity Partner Financing (see profit spilt below, note 11) Marketing (% of Tot.Rev) 2.5% 2,561,625 Marketing (% of Tot.Rev) 2.5% 2,233,737 Marketing (% of Tot.Rev) 2.5% 1,905,849 Commission,& Closing Costs (% of Tot.Rev) 2.5% 1,397,250 Commission,& Closing Costs (% of Tot.Rev) 2.5% 1,397,250 Commission,& Closing Costs (% of Tot.Rev) 2.5% 1,397,250 Sub Total 95,751,964 Sub Total 84,603,725 Sub Total 73,455,533 less costs at exsitng zoning 56,163,167 less costs at exsitng zoning 56,163,167 less costs at exsitng zoning 56,163,167 Total TDR 39,588,797 Total TDR 28,440,558 Total TDR 17,292,366 Net Profit (additional w/ TDR) 6,986,203 Net Profit (additional w/ TDR) 5,018,922 Net Profit (additional w/ TDR) 3,051,594 Net TDR Profit as a % of Revenues (11) 15.0% Net TDR Profit as a % of Revenues (11) 15.0% Net TDR Profit as a % of Revenues (11) 15.0% (Profit Split: 20% to developer and 80% to equity partner) (Profit Split: 20% to developer and 80% to equity partner) (Profit Split: 20% to developer and 80% to equity partner) Developer Funds Available for TDRs Developer Funds Available for TDRs Developer Funds Available for TDRs Total Value of TDR's (from above) 15,970,307 Total Value of TDR's (from above) 8,194,193 Total Value of TDR's (from above) 418,122 Less Pre-Development Agreement Land Payment (12) 5% 2,328,750 Less Pre-Development Agreement Land Payment (12) 5% 1,672,974 Less Pre-Development Agreement Land Payment (12) 5% 1,017,198 Developers' Total Willingness to Pay for TDRs 13,641, Developers' Total Willingness to Pay for TDRs 6,521,219 Developers' Total Willingness to Pay for TDRs -599,076 Per unit Willingness to PAY for TDR 659, Per unit Willingness to PAY for TDR 315,035 Per unit Willingness to PAY for TDR -28,941 (1) 60% of total parcel(s) size (1) 60% of total parcel(s) size (1) 60% of total parcel(s) size (2) Estimated allowed up-zoning based on surrounding landuses and densities (2) Estimated allowed up-zoning based on surrounding landuses and densities (2) Estimated allowed up-zoning based on surrounding landuses and densities (3) Average size for a single family detached unit at 1 unit/acre (3) Average size for a single family detached unit at 1 unit/acre (3) Average size for a single family detached unit at 1 unit/acre (4) Based on surrounding like sales from dataquick, MLS, County Assessor (4) Based on surrounding like sales from dataquick, MLS, County Assessor (4) Based on surrounding like sales from dataquick, MLS, County Assessor (5) Determined by setting TDR value to zero with net profit of 15% at existing zoning; sites have higher land prices with resid(5) Determined by setting TDR value to zero with net profit of 15% at existing zoning; sites have higher land prices with reside (5) Determined by setting TDR value to zero with net profit of 15% at existing zoning; sites have higher land pr (6) Added value to the land with TDR up-zone; determined by a fixed net profit of 15% (6) Added value to the land with TDR up-zone; determined by a fixed net profit of 15% (6) Added value to the land with TDR up-zone; determined by a fixed net profit of 15% (7) % construction costs for grading, sewer, water, and roads (more constrained sites face greater site costs) (7) % construction costs for grading, sewer, water, and roads (more constrained sites face greater site costs) (7) % construction costs for grading, sewer, water, and roads (more constrained sites face greater site costs) (8) % of direct costs that includes permitting costs, impact fees, legal, insurance and design costs (8) % of direct costs that includes permitting costs, impact fees, legal, insurance and design costs (8) % of direct costs that includes permitting costs, impact fees, legal, insurance and design costs (9) % of revenue developers charge to cover project overhead (9) % of revenue developers charge to cover project overhead (9) % of revenue developers charge to cover project overhead (10) Assumes bank loans 75% of total project costs, with a linear draw; interest payment 7% on 60% of this amount for 2 yea(10) Assumes bank loans 75% of total project costs, with a linear draw; interest payment 7% on 60% of this amount for 2 years(10) Assumes bank loans 75% of total project costs, with a linear draw; interest payment 7% on 60% of this am (11) Private equity investors expect 80% split of net profit with no 'preferred return' payments during development period (11) Private equity investors expect 80% split of net profit with no 'preferred return' payments during development period (11) Private equity investors expect 80% split of net profit with no 'preferred return' payments during developm (12) % of total revenue landowner receives as payment above baseline land costs in a pre-development agreement; (12) % of total revenue landowner receives as payment above baseline land costs in a pre-development agreement; (12) % of total revenue landowner receives as payment above baseline land costs in a pre-development agree this amount compensates receiving site land owner for capitalized land value with a TDR up-zone this amount compensates receiving site land owner for capitalized land value with a TDR up-zone this amount compensates receiving site land owner for capitalized land value with a TDR up-zone 31
67 City of Goleta Receiving Sites - WTP 1. Ellwood Canyon (1) 2. Couvillion (2) 3. Bishop Ranch (4) 4. Across Camino Real (10) 32
68 Appendix D: Secondary Screening - Developer Willingness to Pay for TDRs Appendix D: Secondary Screening - Developer Willingness to Pay for TDRs Appendix D: Secondary Screening - Developer Willingness to Pay for TDRs City of Goleta - Ellwood Ag City of Goleta - Ellwood Ag City of Goleta - Ellwood Ag 100% residential market rate single family units Mixed Income ( 85% market rate, 15% affordable workforce units) single family units Mixed Income ( 70% market rate, 30% affordable workforce units) single family units Site Characteristics Site Characteristics Site Characteristics Parcel(s) Size 33 Parcel(s) Size 33 Parcel(s) Size 33 Buildable Area (1) 60% 19.8 Buildable Area (1) 60% 19.8 Buildable Area (1) 60% 19.8 Existing Zoning AG - 10 Existing Zoning AG - 10 Existing Zoning AG - 10 TDR Re-zone / Up-zone (2) 4.6 units/ac TDR Re-zone / Up-zone (2) 4.6 units/ac TDR Re-zone / Up-zone (2) 4.6 units/ac Development Program Development Program Development Program Residential Residential Residential # of units w/ existing zoning 2 # of units w/ existing zoning 2 # of units w/ existing zoning 2 # of units w/ TDR up-zone (based on buildable area) 89 # of units w/ TDR up-zone (based on buildable area) 89 # of units w/ TDR up-zone (based on buildable area) 89 # of Total Units 91 # of Total Units 91 # of Total Units 91 Average Market Rate Unit Size (3) 2,500 Average Market Rate Unit Size (3) 2,500 Average Market Rate Unit Size (3) 2,500 Average Affordable Rate Unit Size (3) 1,500 Average Affordable Rate Unit Size (3) 1,500 Average Affordable Rate Unit Size (3) 1,500 Building Revenue Assumption Total Building Revenue Assumption Total Building Revenue Assumption Total Residential Residential Residential Market Rate Units 100% 89 Market Rate Units 85% 76 Market Rate Units 70% 62 Average Sale Price / sqft (4) $400 Average Sale Price / sqft (4) $400 Average Sale Price / sqft (4) $400 Average Unit Sale Price (4) $1,000,000 Average Unit Sale Price (4) $1,000,000 Average Unit Sale Price (4) $1,000,000 Affordable Units 0% 0 Affordable Units 15% 13 Affordable Units 30% 27 Area Median Income (4-person HH) $64,700 Area Median Income (4-person HH) $64,700 Area Median Income (4-person HH) $64,700 Income Category (% of AMI) % Income Category (% of AMI) % Income Category (% of AMI) % Sales Price $330,000 Sales Price $330,000 Sales Price $330,000 Total Project Revenue 89,080,000 Total Project Revenue 80,127,460 Total Project Revenue 71,174,920 Land (per acre and total, see note 5) $100,000 3,300,000 Land (per acre and total, see note 5) $100,000 3,300,000 Land (per acre and total, see note 5) $100,000 3,300,000 Value of TDR's (6) 20,894,539 Value of TDR's (6) 16,824,089 Value of TDR's (6) 12,753,804 Total Land Value 24,194,539 Total Land Value 20,124,089 Total Land Value 16,053,804 Building Construction Building Construction Building Construction Res. Construction Costs per sqft $120 26,724,000 Res. Construction Costs per sqft $120 25,120,560 Res. Construction Costs per sqft $120 23,517,120 Site Development Costs (7) 15% 4,008,600 Site Development Costs (7) 15% 3,768,084 Site Development Costs (7) 15% 3,527,568 Comm. Construction Costs per sqft $80 0 Comm. Construction Costs per sqft $80 0 Comm. Construction Costs per sqft $80 0 (8) 25% 8,508,150 (8) 25% 8,047,161 (8) 25% 7,586,172 Developer Fee (9) 3% 2,672,400 Developer Fee (9) 3% 2,403,824 Developer Fee (9) 3% 2,135,248 Financing Financing Financing Debt Financing (10) 5,156,400 Debt Financing (10) 4,638,170 Debt Financing (10) 4,119,953 Equity Partner Financing (see profit spilt below, note 11) Equity Partner Financing (see profit spilt below, note 11) Equity Partner Financing (see profit spilt below, note 11) Marketing (% of Tot.Rev) 2.5% 2,227,000 Marketing (% of Tot.Rev) 2.5% 2,003,187 Marketing (% of Tot.Rev) 2.5% 1,779,373 Commission & Closing Costs (% of Tot.Rev) 2.5% 2,227,000 Commission & Closing Costs (% of Tot.Rev) 2.5% 2,003,187 Commission & Closing Costs (% of Tot.Rev) 2.5% 1,779,373 Total 75,718,089 Total 68,108,261 Total 60,498,611 Net Profit 13,361,911 Net Profit 12,019,199 Net Profit 10,676,309 Net Profit as a % of Revenues (11) 15.0% Net Profit as a % of Revenues (11) 15.0% Net Profit as a % of Revenues (11) 15.0% (Profit Split: 20% to developer and 80% to equity partner) (Profit Split: 20% to developer and 80% to equity partner) (Profit Split: 20% to developer and 80% to equity partner) Developer Funds Available for TDRs Developer Funds Available for TDRs Developer Funds Available for TDRs Total Value of TDR's (from above) 20,894,539 Total Value of TDR's (from above) 16,824,089 Total Value of TDR's (from above) 12,753,804 Less Pre-Development Agreement Land Payment (12) 5% 4,454,000 Less Pre-Development Agreement Land Payment (12) 5% 4,006,373 Less Pre-Development Agreement Land Payment (12) 5% 3,558,746 Developers' Total Willingness to Pay for TDRs 16,440,539 Developers' Total Willingness to Pay for TDRs 12,817,716 Developers' Total Willingness to Pay for TDRs 9,195,058 Per unit Willingness to PAY for TDR 184,559 Per unit Willingness to PAY for TDR 143,890 Per unit Willingness to PAY for TDR 103,222 (1) 60% of total parcel(s) size, because of minimal sight constraints (1) 60% of total parcel(s) size, because of minimal sight constraints (1) 60% of total parcel(s) size, because of minimal sight constraints (2) Estimated allowed up-zoning based on surrounding landuses and densities (2) Estimated allowed up-zoning based on surrounding landuses and densities (2) Estimated allowed up-zoning based on surrounding landuses and densities (3) Average size for a single family detached unit at 4.6 units/acre (3) Average size for a single family detached unit at 4.6 units/acre (3) Average size for a single family detached unit at 4.6 units/acre (4) Based on surrounding like sales from dataquick, MLS, County Assessor (4) Based on surrounding like sales from dataquick, MLS, County Assessor (4) Based on surrounding like sales from dataquick, MLS, County Assessor (5) Determined from sales of property with like zoning (Ag land inside UGB assumed to sell at $100k/acre) (5) Determined from sales of property with like zoning (Ag land inside UGB assumed to sell at $100k/acre) (5) Determined from sales of property with like zoning (Ag land inside UGB assumed to sell at $100k/acre) (6) Added value to the land with TDR up-zone; determined by a fixed net profit of 15% (6) Added value to the land with TDR up-zone; determined by a fixed net profit of 15% (6) Added value to the land with TDR up-zone; determined by a fixed net profit of 15% (7) % construction costs for grading, sewer, water, and roads (more constrained sites face greater site costs) (7) % construction costs for grading, sewer, water, and roads (more constrained sites face greater site costs) (7) % construction costs for grading, sewer, water, and roads (more constrained sites face greater site costs) (8) % of direct costs that includes permitting costs, impact fees, legal, insurance and design costs (8) % of direct costs that includes permitting costs, impact fees, legal, insurance and design costs (8) % of direct costs that includes permitting costs, impact fees, legal, insurance and design costs (9) % of revenue developers charge to cover project overhead (9) % of revenue developers charge to cover project overhead (9) % of revenue developers charge to cover project overhead (10) Assumes bank loans 75% of total project costs, with a linear draw; interest payment 7% on 60% of this amount for 2 year(10) Assumes bank loans 75% of total project costs, with a linear draw; interest payment 7% on 60% of this amount for 2 years(10) Assumes bank loans 75% of total project costs, with a linear draw; interest payment 7% on 60% of this a (11) Private equity investors expect 80% split of net profit with no 'preferred return' payments during development period (11) Private equity investors expect 80% split of net profit with no 'preferred return' payments during development period (11) Private equity investors expect 80% split of net profit with no 'preferred return' payments during developm (12) % of total revenue landowner receives as payment above baseline land costs in a pre-development agreement; (12) % of total revenue landowner receives as payment above baseline land costs in a pre-development agreement; (12) % of total revenue landowner receives as payment above baseline land costs in a pre-development agre this amount compensates receiving site land owner for capitalized land value with a TDR up-zone this amount compensates receiving site land owner for capitalized land value with a TDR up-zone this amount compensates receiving site land owner for capitalized land value with a TDR up-zone 33
69 Appendix D: Secondary Screening - Developer Willingness to Pay for TDRs Appendix D: Secondary Screening - Developer Willingness to Pay for TDRs Appendix D: Secondary Screening - Developer Willingness to Pay for TDRs Goleta - Couvillion Goleta - Couvillion Goleta - Couvillion 100% single familiy residential market rate units Mixed Income ( 85% market rate, 15% affordable workforce units) single family units Mixed Income ( 70% market rate, 30% affordable workforce units) single family units Site Characteristics Site Characteristics Site Characteristics Parcel(s) Size 14 Parcel(s) Size 14 Parcel(s) Size 14 Buildable Area (1) 60% 8.4 Buildable Area (1) 8.4 Buildable Area (1) 8.4 Existing Zoning AG - 40 Existing Zoning AG - 40 Existing Zoning AG - 40 TDR Re-zone / Up-zone (2) 4.6 units/ac TDR Re-zone / Up-zone (2) 4.6 units/ac TDR Re-zone / Up-zone (2) 4.6 units/ac Development Program Development Program Development Program Residential Residential Residential # of units w/ existing zoning 1 # of units w/ existing zoning 1 # of units w/ existing zoning 1 # of units w/ TDR up-zone (based on buildable area) 38 # of units w/ TDR up-zone (based on buildable area) 38 # of units w/ TDR up-zone (based on buildable area) 38 # of Total Units 39 # of Total Units 39 # of Total Units 39 Average Market Rate Unit Size (3) 2,500 Average Market Rate Unit Size (3) 2,500 Average Market Rate Unit Size (3) 2,500 Average Affordable Rate Unit Size (3) 1,500 Average Affordable Rate Unit Size (3) 1,500 Average Affordable Rate Unit Size (3) 1,500 Building Revenue Assumption Total Building Revenue Assumption Total Building Revenue Assumption Total Residential Residential Residential Market Rate Units 100% 38 Market Rate Units 85% 32 Market Rate Units 70% 26 Average Sale Price / sqft (4) $400 Average Sale Price / sqft (4) $400 Average Sale Price / sqft (4) $400 Average Unit Sale Price (4) $1,000,000 Average Unit Sale Price (4) $1,000,000 Average Unit Sale Price (4) $1,000,000 Affordable Units 0% 0 Affordable Units 15% 6 Affordable Units 30% 11 Area Median Income (4-person HH) $64,700 Area Median Income (4-person HH) $64,700 Area Median Income (4-person HH) $64,700 Income Category (% of AMI) % Income Category (% of AMI) % Income Category (% of AMI) % Sales Price $330,000 Sales Price $330,000 Sales Price $330,000 Total Project Revenue 37,640,000 Total Project Revenue 33,857,180 Total Project Revenue 30,074,360 Land (per acre and total, see note 5) $100,000 1,400,000 Land (per acre and total, see note 5) $100,000 1,400,000 Land (per acre and total, see note 5) $100,000 1,400,000 Value of TDR's (6) 8,821,725 Value of TDR's (6) 7,101,892 Value of TDR's (6) 5,381,996 Total Land Value 10,221,725 Total Land Value 8,501,892 Total Land Value 6,781,996 Building Construction Building Construction Building Construction Res. Construction Costs per sqft $120 11,292,000 Res. Construction Costs per sqft $120 10,614,480 Res. Construction Costs per sqft $120 9,936,960 Site Development Costs (7) 15% 1,693,800 Site Development Costs (7) 15% 1,592,172 Site Development Costs (7) 15% 1,490,544 Comm. Construction Costs per sqft $80 0 Comm. Construction Costs per sqft $80 0 Comm. Construction Costs per sqft $80 0 (8) 25% 3,596,450 (8) 25% 3,401,663 (8) 25% 3,206,876 Developer Fee (9) 3% 1,129,200 Developer Fee (9) 3% 1,015,715 Developer Fee (9) 3% 902,231 Financing Financing Financing Debt Financing (10) 2,178,788 Debt Financing (10) 1,959,822 Debt Financing (10) 1,740,851 Equity Partner Financing (see profit spilt below, note 11) Equity Partner Financing (see profit spilt below, note 11) Equity Partner Financing (see profit spilt below, note 11) Marketing (% of Tot.Rev) 2.5% 941,000 Marketing (% of Tot.Rev) 2.5% 846,430 Marketing (% of Tot.Rev) 2.5% 751,859 Commission & Closing Costs (% of Tot.Rev) 2.5% 941,000 Commission & Closing Costs (% of Tot.Rev) 2.5% 846,430 Commission & Closing Costs (% of Tot.Rev) 2.5% 751,859 Total 31,993,962 Total 28,778,603 Total 25,563,176 Net Profit 5,646,038 Net Profit 5,078,577 Net Profit 4,511,184 Net Profit as a % of Revenues (11) 15.0% Net Profit as a % of Revenues (11) 15.0% Net Profit as a % of Revenues (11) 15.0% (Profit Split: 20% to developer and 80% to equity partner) (Profit Split: 20% to developer and 80% to equity partner) (Profit Split: 20% to developer and 80% to equity partner) Developer Funds Available for TDRs Developer Funds Available for TDRs Developer Funds Available for TDRs Total Value of TDR's (from above) 8,821,725 Total Value of TDR's (from above) 7,101,892 Total Value of TDR's (from above) 5,381,996 Less Pre-Development Agreement Land Payment (12) 5% 1,882,000 Less Pre-Development Agreement Land Payment (12) 5% 1,692,859 Less Pre-Development Agreement Land Payment (12) 5% 1,503,718 Developers' Total Willingness to Pay for TDRs 6,939,725 Developers' Total Willingness to Pay for TDRs 5,409,033 Developers' Total Willingness to Pay for TDRs 3,878,278 Per unit Willingness to PAY for TDR 184,371 Per unit Willingness to PAY for TDR 143,704 Per unit Willingness to PAY for TDR 103,036 (1) 60% of total parcel(s) size, because of minimal sight constraints (1) 60% of total parcel(s) size, because of minimal sight constraints (1) 60% of total parcel(s) size, because of minimal sight constraints (2) Estimated allowed up-zoning based on surrounding landuses and densities (2) Estimated allowed up-zoning based on surrounding landuses and densities (2) Estimated allowed up-zoning based on surrounding landuses and densities (3) Average size for a single family detached unit at 4.6 units/acre (3) Average size for a single family detached unit at 4.6 units/acre (3) Average size for a single family detached unit at 4.6 units/acre (4) Based on surrounding like sales from dataquick, MLS, County Assessor (4) Based on surrounding like sales from dataquick, MLS, County Assessor (4) Based on surrounding like sales from dataquick, MLS, County Assessor (5) Determined from sales of property with like zoning (Ag land inside UGB assumed to sell at $100k/acre) (5) Determined from sales of property with like zoning (Ag land inside UGB assumed to sell at $100k/acre) (5) Determined from sales of property with like zoning (Ag land inside UGB assumed to sell at $100k/acre) (6) Added value to the land with TDR up-zone; determined by a fixed net profit of 15% (6) Added value to the land with TDR up-zone; determined by a fixed net profit of 15% (6) Added value to the land with TDR up-zone; determined by a fixed net profit of 15% (7) % construction costs for grading, sewer, water, and roads (more constrained sites face greater site costs) (7) % construction costs for grading, sewer, water, and roads (more constrained sites face greater site costs) (7) % construction costs for grading, sewer, water, and roads (more constrained sites face greater site costs) (8) % of direct costs that includes permitting costs, impact fees, legal, insurance and design costs (8) % of direct costs that includes permitting costs, impact fees, legal, insurance and design costs (8) % of direct costs that includes permitting costs, impact fees, legal, insurance and design costs (9) % of revenue developers charge to cover project overhead (9) % of revenue developers charge to cover project overhead (9) % of revenue developers charge to cover project overhead (10) Assumes bank loans 75% of total project costs, with a linear draw; interest payment 7% on 60% of this amount for 2 year(10) Assumes bank loans 75% of total project costs, with a linear draw; interest payment 7% on 60% of this amount for 2 years (10) Assumes bank loans 75% of total project costs, with a linear draw; interest payment 7% on 60% of this a (11) Private equity investors expect 80% split of net profit with no 'preferred return' payments during development period (11) Private equity investors expect 80% split of net profit with no 'preferred return' payments during development period (11) Private equity investors expect 80% split of net profit with no 'preferred return' payments during developm (12) % of total revenue landowner receives as payment above baseline land costs in a pre-development agreement; (12) % of total revenue landowner receives as payment above baseline land costs in a pre-development agreement; (12) % of total revenue landowner receives as payment above baseline land costs in a pre-development agre this amount compensates receiving site land owner for capitalized land value with a TDR up-zone this amount compensates receiving site land owner for capitalized land value with a TDR up-zone this amount compensates receiving site land owner for capitalized land value with a TDR up-zone 34
70 Appendix D: Secondary Screening - Developer Willingness to Pay for TDRs Appendix D: Secondary Screening - Developer Willingness to Pay for TDRs Appendix D: Secondary Screening - Developer Willingness to Pay for TDRs City of Goleta - Bishop Ranch City of Goleta - Bishop Ranch City of Goleta - Bishop Ranch 100% residential market rate single family units Mixed Income ( 85% market rate, 15% affordable workforce units) single family units Mixed Income ( 70% market rate, 30% affordable workforce units) single family units Site Characteristics Site Characteristics Site Characteristics Parcel(s) Size 287 Parcel(s) Size 287 Parcel(s) Size 287 Buildable Area (1) 60% 174 Buildable Area (1) 60% 174 Buildable Area (1) 60% 174 Existing Zoning AG - 40 Existing Zoning AG - 40 Existing Zoning AG - 40 TDR Re-zone / Up-zone (2) 4.6 units/ac TDR Re-zone / Up-zone (2) 4.6 units/ac TDR Re-zone / Up-zone (2) 4.6 units/ac Development Program Development Program Development Program Residential Residential Residential # of units w/ existing zoning 4 # of units w/ existing zoning 4 # of units w/ existing zoning 4 # of units w/ TDR up-zone (based on buildable area) 796 # of units w/ TDR up-zone (based on buildable area) 796 # of units w/ TDR up-zone (based on buildable area) 796 # of Total Units 800 # of Total Units 800 # of Total Units 800 Average Market Rate Unit Size (3) 2,500 Average Market Rate Unit Size (3) 2,500 Average Market Rate Unit Size (3) 2,500 Average Affordable Rate Unit Size (3) 1,500 Average Affordable Rate Unit Size (3) 1,500 Average Affordable Rate Unit Size (3) 1,500 Building Revenue Assumption Total Building Revenue Assumption Total Building Revenue Assumption Total Residential Residential Residential Market Rate Units 100% 796 Market Rate Units 85% 677 Market Rate Units 70% 557 Average Sale Price / sqft (4) $400 Average Sale Price / sqft (4) $400 Average Sale Price / sqft (4) $400 Average Unit Sale Price (4) $1,000,000 Average Unit Sale Price (4) $1,000,000 Average Unit Sale Price (4) $1,000,000 Affordable Units 0% 0 Affordable Units 15% 119 Affordable Units 30% 239 Area Median Income (4-person HH) $64,700 Area Median Income (4-person HH) $64,700 Area Median Income (4-person HH) $64,700 Income Category (% of AMI) % Income Category (% of AMI) % Income Category (% of AMI) % Sales Price $330,000 Sales Price $330,000 Sales Price $330,000 Total Project Revenue 796,400,000 Total Project Revenue 716,361,800 Total Project Revenue 636,323,600 Land (per acre and total, see note 5) $100,000 28,700,000 Land (per acre and total, see note 5) $100,000 28,700,000 Land (per acre and total, see note 5) $100,000 28,700,000 Value of TDR's (6) 187,806,647 Value of TDR's (6) 151,417,018 Value of TDR's (6) 115,027,388 Total Land Value 216,506,647 Total Land Value 180,117,018 Total Land Value 143,727,388 Building Construction Building Construction Building Construction Res. Construction Costs per sqft $ ,920,000 Res. Construction Costs per sqft $ ,584,800 Res. Construction Costs per sqft $ ,249,600 Site Development Costs (7) 15% 35,838,000 Site Development Costs (7) 15% 33,687,720 Site Development Costs (7) 15% 31,537,440 Comm. Construction Costs per sqft $80 0 Comm. Construction Costs per sqft $80 0 Comm. Construction Costs per sqft $80 0 (8) 25% 75,864,500 (8) 25% 71,743,130 (8) 25% 67,621,760 Developer Fee (9) 3% 23,892,000 Developer Fee (9) 3% 21,490,854 Developer Fee (9) 3% 19,089,708 Financing Financing Financing Debt Financing (10) 46,099,649 Debt Financing (10) 41,466,635 Debt Financing (10) 36,833,620 Equity Partner Financing (see profit spilt below, note 11) Equity Partner Financing (see profit spilt below, note 11) Equity Partner Financing (see profit spilt below, note 11) Marketing (% of Tot.Rev) 2.5% 19,910,000 Marketing (% of Tot.Rev) 2.5% 17,909,045 Marketing (% of Tot.Rev) 2.5% 15,908,090 Commission & Closing Costs (% of Tot.Rev) 2.5% 19,910,000 Commission & Closing Costs (% of Tot.Rev) 2.5% 17,909,045 Commission & Closing Costs (% of Tot.Rev) 2.5% 15,908,090 Total 676,940,796 Total 608,908,246 Total 540,875,696 Net Profit 119,459,204 Net Profit 107,453,554 Net Profit 95,447,904 Net Profit as a % of Revenues (11) 15.0% Net Profit as a % of Revenues (11) 15.0% Net Profit as a % of Revenues (11) 15.0% (Profit Split: 20% to developer and 80% to equity partner) (Profit Split: 20% to developer and 80% to equity partner) (Profit Split: 20% to developer and 80% to equity partner) Developer Funds Available for TDRs Developer Funds Available for TDRs Developer Funds Available for TDRs Total Value of TDR's (from above) 187,806,647 Total Value of TDR's (from above) 151,417,018 Total Value of TDR's (from above) 115,027,388 Less Pre-Development Agreement Land Payment (12) 5% 39,820,000 Less Pre-Development Agreement Land Payment (12) 5% 35,818,090 Less Pre-Development Agreement Land Payment (12) 5% 31,816,180 Developers' Total Willingness to Pay for TDRs 147,986,647 Developers' Total Willingness to Pay for TDRs 115,598,928 Developers' Total Willingness to Pay for TDRs 83,211,208 Per unit Willingness to PAY for TDR 185,819 Per unit Willingness to PAY for TDR 145,152 Per unit Willingness to PAY for TDR 104,484 (1) 60% of total parcel(s) size, because of minimal sight constraints (1) 60% of total parcel(s) size, because of minimal sight constraints (1) 60% of total parcel(s) size, because of minimal sight constraints (2) Estimated allowed up-zoning based on surrounding landuses and densities (2) Estimated allowed up-zoning based on surrounding landuses and densities (2) Estimated allowed up-zoning based on surrounding landuses and densities (3) Average size for a single family detached unit at 4.6 units/acre (3) Average size for a single family detached unit at 4.6 units/acre (3) Average size for a single family detached unit at 4.6 units/acre (4) Based on surrounding like sales from dataquick, MLS, County Assessor (4) Based on surrounding like sales from dataquick, MLS, County Assessor (4) Based on surrounding like sales from dataquick, MLS, County Assessor (5) Determined from sales of property with like zoning (Ag land inside UGB assumed to sell at $100k/acre) (5) Determined from sales of property with like zoning (Ag land inside UGB assumed to sell at $100k/acre) (5) Determined from sales of property with like zoning (Ag land inside UGB assumed to sell at $100k/acre) (6) Added value to the land with TDR up-zone; determined by a fixed net profit of 15% (6) Added value to the land with TDR up-zone; determined by a fixed net profit of 15% (6) Added value to the land with TDR up-zone; determined by a fixed net profit of 15% (7) % construction costs for grading, sewer, water, and roads (more constrained sites face greater site costs) (7) % construction costs for grading, sewer, water, and roads (more constrained sites face greater site costs) (7) % construction costs for grading, sewer, water, and roads (more constrained sites face greater site costs) (8) % of direct costs that includes permitting costs, impact fees, legal, insurance and design costs (8) % of direct costs that includes permitting costs, impact fees, legal, insurance and design costs (8) % of direct costs that includes permitting costs, impact fees, legal, insurance and design costs (9) % of revenue developers charge to cover project overhead (9) % of revenue developers charge to cover project overhead (9) % of revenue developers charge to cover project overhead (10) Assumes bank loans 75% of total project costs, with a linear draw; interest payment 7% on 60% of this amount for 2 years (10) Assumes bank loans 75% of total project costs, with a linear draw; interest payment 7% on 60% of this amount for 2 years (10) Assumes bank loans 75% of total project costs, with a linear draw; interest payment 7% on 60% of this a (11) Private equity investors expect 80% split of net profit with no 'preferred return' payments during development period (11) Private equity investors expect 80% split of net profit with no 'preferred return' payments during development period (11) Private equity investors expect 80% split of net profit with no 'preferred return' payments during developm (12) % of total revenue landowner receives as payment above baseline land costs in a pre-development agreement; (12) % of total revenue landowner receives as payment above baseline land costs in a pre-development agreement; (12) % of total revenue landowner receives as payment above baseline land costs in a pre-development agre this amount compensates receiving site land owner for capitalized land value with a TDR up-zone this amount compensates receiving site land owner for capitalized land value with a TDR up-zone this amount compensates receiving site land owner for capitalized land value with a TDR up-zone 35
71 Appendix D: Secondary Screening - Developer Willingness to Pay for TDRs Appendix D: Secondary Screening - Developer Willingness to Pay for TDRs Appendix D: Secondary Screening - Developer Willingness to Pay for TDRs City of Goleta - Camino Real Areas 10 City of Goleta - Camino Real Areas 10 City of Goleta - Camino Real Areas % residential market rate townhomes (no commercial) - 20 units/acre Mixed Income townhomes - 15% workforce (no commercial) - 20 units/acre Mixed Income townhomes - 30% workforce (no commercial) - 20 units/acre Site Characteristics Site Characteristics Site Characteristics Parcel(s) Size 22 Parcel(s) Size 22 Parcel(s) Size 22 Buildable Area (1) 60% 13.2 Buildable Area (1) 60% 13.2 Buildable Area (1) 60% 13.2 Existing Zoning Industrial Existing Zoning Industrial Existing Zoning Industrial TDR Re-zone / Up-zone (2) 20 units/ac TDR Re-zone / Up-zone (2) 20 units/ac TDR Re-zone / Up-zone (2) 20 units/ac Development Program Development Program Development Program Residential Residential Residential # of units w/ existing zoning 0 # of units w/ existing zoning 0 # of units w/ existing zoning 0 # of units w/ TDR up-zone 264 # of units w/ TDR up-zone 264 # of units w/ TDR up-zone 264 # of Total Units 264 # of Total Units 264 # of Total Units 264 Average Market Rate Unit Size (3) 1,150 Average Market Rate Unit Size (3) 1,150 Average Market Rate Unit Size (3) 1,150 Average Affordable Rate Unit Size (3) 850 Average Affordable Rate Unit Size (3) 850 Average Affordable Rate Unit Size (3) 850 Commercial Commercial Commercial Allowed square footage 0 Allowed square footage 0 Allowed square footage 0 Additional Up-zone square footage 0 Additional Up-zone square footage 0 Additional Up-zone square footage 0 Parking Parking Parking Residential Spaces (4) 594 Residential Spaces (4) 554 Residential Spaces (4) 515 Commercial Spaces (4) 0 Commercial Spaces (4) 0 Commercial Spaces (4) 0 Building Revenue Assumption Total Building Revenue Assumption Total Building Revenue Assumption Total Residential Residential Residential Market Rate Units 100% 264 Market Rate Units 85% 224 Market Rate Units 70% 185 Average Sale Price / sqft (5) $490 Average Sale Price / sqft (5) $490 Average Sale Price / sqft (5) $490 Average Unit Sale Price (5) $563, ,764,000 Average Unit Sale Price (5) $563, ,449,400 Average Unit Sale Price (5) $563, ,134,800 Affordable Units 0% 0 Affordable Units 15% 40 Affordable Units 30% 79 Area Median Income (4-person HH) $64,700 Area Median Income (4-person HH) $64,700 Area Median Income (4-person HH) $64,700 Income Category (% of AMI) % Income Category (% of AMI) % Income Category (% of AMI) % Sales Price $330,000 0 Sales Price $330,000 13,068,000 Sales Price $330,000 26,136,000 Commercial 0 0 Commercial 0 0 Commercial 0 0 Lease Rate Lease Rate Lease Rate Revenue Periods/year Revenue Periods/year Revenue Periods/year Gross Annual Income Gross Annual Income Gross Annual Income Less Vacancy Less Vacancy Less Vacancy Less Operating Expenses Less Operating Expenses Less Operating Expenses Net Operating Income Net Operating Income Net Operating Income Capitalized Value 0 Capitalized Value 0 Capitalized Value 0 Total Project Revenue 148,764,000 Total Project Revenue 139,517,400 Total Project Revenue 130,270,800 Land (per acre and total, see note 6) $150,000 3,300,000 Land (per acre and total, see note 6) $150,000 3,300,000 Land (per acre and total, see note 6) $150,000 3,300,000 Value of TDR's (7) 33,144,456 Value of TDR's (7) 29,578,245 Value of TDR's (7) 26,012,298 Total Land Value 36,444,456 Total Land Value 32,878,245 Total Land Value 29,312,298 Building Construction Building Construction Building Construction Res. Construction Costs per sqft $130 39,468,000 Res. Construction Costs per sqft $130 37,923,600 Res. Construction Costs per sqft $130 36,379,200 Site Development Costs (8) 15% 5,920,200 Site Development Costs (8) 15% 5,688,540 Site Development Costs (8) 15% 5,456,880 Comm. Construction Costs per sqft $80 0 Comm. Construction Costs per sqft $80 0 Comm. Construction Costs per sqft $80 0 Parking (podium) Construction (per space see note $17,000 10,098,000 Parking (podium) Construction (per space see note $17,000 9,424,800 Parking (podium) Construction (per space see note $17,000 8,751,600 (10) 25% 14,696,550 (10) 25% 14,084,235 (10) 25% 13,471,920 Developer Fee (11) 3% 4,462,920 Developer Fee (11) 3% 4,185,522 Developer Fee (11) 3% 3,908,124 Financing Financing Financing Debt Financing (12) 8,665,030 Debt Financing (12) 8,126,425 Debt Financing (12) 7,587,842 Equity Partner Financing (see profit spilt below, note 13) Equity Partner Financing (see profit spilt below, note 13) Equity Partner Financing (see profit spilt below, note 13) Marketing & Commission (% of Tot.Rev) 4.5% 6,694,380 Marketing & Commission (% of Tot.Rev) 4.5% 6,278,283 Marketing & Commission (% of Tot.Rev) 4.5% 5,862,186 Total 126,449,536 Total 118,589,650 Total 110,730,050 Net Profit 22,314,464 Net Profit 20,927,750 Net Profit 19,540,750 Net Profit as a % of Revenues (expected to be 15%) 15.0% Net Profit as a % of Revenues (expected to be 15%) 15.0% Net Profit as a % of Revenues (expected to be 15%) 15.0% (Profit Split: 20% to developer and 80% to equity partner) (Profit Split: 20% to developer and 80% to equity partner) (Profit Split: 20% to developer and 80% to equity partner) Developer Funds Available for TDRs Developer Funds Available for TDRs Developer Funds Available for TDRs Total Value of TDR's (from above) 33,144,456 Total Value of TDR's (from above) 29,578,245 Total Value of TDR's (from above) 26,012,298 Less Pre-Development Agreement Land Payment (14) 5% 7,438,200 Less Pre-Development Agreement Land Payment (14) 5% 6,975,870 Less Pre-Development Agreement Land Payment (14) 5% 6,513,540 Developers' Total Willingness to Pay for TDRs 25,706,256 Developers' Total Willingness to Pay for TDRs 22,602,375 Developers' Total Willingness to Pay for TDRs 19,498,758 Per unit Willingness to PAY for TDR 97,372 Per unit Willingness to PAY for TDR 85,615 Per unit Willingness to PAY for TDR 73,859 (1) 90% of total parcel(s) size (1) 90% of total parcel(s) size (1) 90% of total parcel(s) size (2) Estimated allowed up-zoning based on surrounding landuses and densities; (2) Estimated allowed up-zoning based on surrounding landuses and densities; (2) Estimated allowed up-zoning based on surrounding landuses and densities; three stories- two residential above one level of above street level parking three stories- two residential above one level of above street level parking three stories- two residential above one level of above street level parking (3) Average size for a luxury 2-bedroom townhome at 20 units/acre (3) Average size for a luxury 2-bedroom townhome at 20 units/acre (3) Average size for a luxury 2-bedroom townhome at 20 units/acre (4) 2 for every market rate unit, 1 for workforce and 1 for every 4 units; # comm lots = 1/500sqft comm (4) 2 for every market rate unit, 1 for workforce and 1 for every 4 units; # comm lots = 1/500sqft comm (4) 2 for every market rate unit, 1 for workforce and 1 for every 4 units; # comm lots = 1/500sqft comm (5) Based on surrounding like sales from dataquick, MLS, County Assessor (5) Based on surrounding like sales from dataquick, MLS, County Assessor (5) Based on surrounding like sales from dataquick, MLS, County Assessor (6) Determined from sales of property with like zoning and/or County Assessor appraised Land value (6) Determined from sales of property with like zoning and/or County Assessor appraised Land value (6) Determined from sales of property with like zoning and/or County Assessor appraised Land value (7) Added value to the land with TDR up-zone; determined by a fixed net profit of 15% (7) Added value to the land with TDR up-zone; determined by a fixed net profit of 15% (7) Added value to the land with TDR up-zone; determined by a fixed net profit of 15% (8)% construction costs for grading, sewer, water, and roads (8)% construction costs for grading, sewer, water, and roads (8)% construction costs for grading, sewer, water, and roads (9) Assumes podium style parking with each space 380 sf at a cost of $45/sf for a total of $17,000/space (9) Assumes podium style parking with each space 380 sf at a cost of $45/sf for a total of $17,000/space (9) Assumes podium style parking with each space 380 sf at a cost of $45/sf for a total of $17,000/space (10) % of direct costs that includes permitting costs, impact fees, legal, insurance and design costs (10) % of direct costs that includes permitting costs, impact fees, legal, insurance and design costs (10) % of direct costs that includes permitting costs, impact fees, legal, insurance and design costs (12) Assumes bank loans 75% of total project costs, with a linear draw; interest payment 7% on 60% of this amount for 2 year(12) Assumes bank loans 75% of total project costs, with a linear draw; interest payment 7% on 60% of this amount for 2 years(12) Assumes bank loans 75% of total project costs, with a linear draw; interest payment 7% on 60% of this a (13) Private equity investors expect 80% split of net profit with no 'preferred return' payments during development period (13) Private equity investors expect 80% split of net profit with no 'preferred return' payments during development period (13) Private equity investors expect 80% split of net profit with no 'preferred return' payments during develop (14) % of total revenue landowner receives as payment above baseline land costs in a pre-development agreement; (14) % of total revenue landowner receives as payment above baseline land costs in a pre-development agreement; (14) % of total revenue landowner receives as payment above baseline land costs in a pre-development agre this amount compensates receiving site land owner for capitalized land value with a TDR up-zone this amount compensates receiving site land owner for capitalized land value with a TDR up-zone this amount compensates receiving site land owner for capitalized land value with a TDR up-zone 36
72 37
73 Santa Barbara Ranch TDR Feasibility Analysis TECHNICAL APPENDIX E Development Right Valuation
74 Appendix E: MOU & ALT 1 DEVELOPMENT RIGHT VALUATIONS 1. Hedonic Valuation Model Study Design In order to determine the underlying value of residential property when certain locational and improvement characteristics are taken into consideration, a hedonic model was used. This analysis entails regressing measures of certain attributes against sale price information. The model is described in detail below. Given the location and nature of the Naples property, it was decided to limit analysis to single-family residential properties located within the ZIP Code zones that abut the coast in the region of Malibu in Los Angeles County and in Ventura, Santa Barbara and San Luis Obispo Counties. Sales of vacant property were also considered, but there were too few sales during the time period in covered by the study to permit any meaningful statistical analysis. Data Collection Data on sales of single family residential properties taking place between January 1, 2000, and March 31, 2004, were purchased from DataQuick Corporation. The quality of data provided by DataQuick varied by county since some county assessor s offices provide DataQuick with more complete information than others. San Luis Obispo posed a particular challenge, as the DataQuick data for this county had very few records that included structure attributes, such as parcel or structure square footage. Consequently, additional data from Assessor books maintained by the San Luis Obispo County Assessor s Office were purchased. The books purchased provided detailed information including information on construction quality and views -- on properties in Pismo Beach, Shell Beach, Los Osos, Morro Bay and Cambria. Due to budgetary constraints, we were not able to purchase data for all areas within the San Luis coastal ZIP Code area. Rather, Assessor books were purchased based on how many DataQuick records they would complete. The DataQuick and San Luis Obispo County data were augmented with neighborhood characteristic information at the census tract level from Census 2000, and with distance variables generated by ArcView, a GIS software package. The completed dataset included 8,170 observations.
75 Since the sales spanned several years, prices were converted to current dollars (2005) using quarterly home price appreciation figures based on data for California published by the FDIC. 1 After considering several specifications, we chose a log-linear model of the following form: ln(y) = (ln x 1 ) + 2 (ln x 2 ) + + n (ln x n ) + e where 0 represents a constant term, n represents the number of regressors in the model, and 1 through n represent the coefficients associated with the natural logs (ln) of independent variables x 1 through x n. The benefits of this model are 1) that it facilitates a least squares regression analysis by smoothing non-linear relationships and 2) in this form the log coefficients can be interpreted as elasticities of demand for the various attributes given a relative change in price since the change in log x approximates the relative change in the variable x itself. The equation estimated by the model can also be translated back to its exponential form by using specific quantities for each variable so that property prices can be estimated. The empirical model attempted to decompose the aggregate value of a property into the value associated with its component parts, including the land, housing structure(s) on the parcel, parcel amenities and disamenities, and neighborhood or regional amenities and disamenities. The dependent variable was sale price (valuation) and the independent variables included the following: Lot square footage Structure square footage Age of the structure Number of bedrooms Number of bathrooms Dummy variable indicating the presence (1) or absence (0) of a pool Distance to the ocean in meters (ArcView) Distance in meters to nearest airport with scheduled commercial flights (ArcView) Distance in meters to the closest major thoroughfare (ArcView) Distance in meters to the nearest railroad line (ArcView) Percentage of residents of the census tract identifying themselves as white (Census 2000) Average journey to work in minutes reported for the census tract (Census 2000) Percent of unemployment reported for the census tract (Census 2000) Average annual household income reported for census tract (Census 2000) Percent of census tract residents below poverty line (Census 2000) 1 2
76 Percent of vacant households in census tract (Census 2000) Median year of construction for houses in census tract (Census 2000) Dummy variables for Los Angeles, Santa Barbara, and San Luis Obispo Counties Dummy variable indicating whether the property lies on the seaward or inland side of either US101 or Rte. 1 (Pacific Coast Highway), whichever is relevant for the particular property. The seaward/inland dummy variable was included as a variable in the regression on the complete dataset and was used to partition the dataset so that the seaward and inland properties could be studied separately to see if certain variables were relatively more or less important in these two areas. For these estimates, a parcel was defined as seaward (inland) if it was located closer to (further from) the ocean than the nearest major auto thoroughfare. A separate set of regressions was run on the San Luis Obispo properties to determine the influence of views and construction quality on housing price. In many instances sales price information was not reported. In these cases the assessor s valuation was used as a proxy. In other cases the reported sale price was either much lower or much higher than the assessor s valuation. To correct for this, we calculated the ratio of sales price to assessed valuation. Where the ratio was between 0.8 and 1.2, the sale price was used; in the other cases, the assessed valuation was used since in California this is based on sale price. Slightly less than 10% of the observations in the original dataset were deemed as extreme outliers based on the amounts they contributed to residuals and leverage in early runs of the model. These observations were dropped, leaving 7,456 observations that were used in the analysis. The Results The results of the regression analysis are displayed in Exhibit X1, X2 and X3 below. The first set of coefficients (Exhibit 1) relates to the regression in which all properties were considered and the dummy variable for seaward and inland side of the relevant highway (US 101 or Rte. 1) was included in the equation. This model provides an extremely good fit for the data, as the specification explains nearly 80% of the variation in home prices. The remaining 20% is attributable to other characteristics not in the model because of a lack of readily available data (e.g. quality of construction), heterogeneous preferences (e.g. preference for particular floor plans or architectural details), or other factors. The coefficients generated by this model specification largely conformed to expectations. The model estimates suggest that price is negatively related to distance from the ocean (i.e., 3
77 price falls as distance rises), the time required to journey to work, the age of the structure, the median age of homes in the census tract, and the distance from a commercial airport. Location on the seaward side of the highway was also negatively associated with price, but the coefficient is small ( ) and is not statistically significant (-1.45) at the 95% confidence level. Relative to Ventura County (the county for which a dummy variable was not included), properties located in Santa Barbara County (0.259) and Malibu (0.404) were priced at a premium, while prices for parcels in San Luis Obispo County are relatively lower (-0.090) holding other factors constant. Distance to major thoroughfare and railroad lines have positive coefficients as expected; as distance from these increases so does house price. The main exception to standard expectations involved the number of bedrooms, which showed a a negative coefficient. Other hedonic studies have found a similar negative relationship between value and the number of bedrooms, though. 2 The second regression included only those properties on the seaward side of either US 101 or Rte. 1(PCH), and explained about 81% of the variation in prices. In this specification, the sign of a few variables changed from those generated in the first run. Specifically, the coefficient for bathrooms was negative, but it was also statistically insignificant. The coefficient for percent white in the census tract also changed sign, which may reflect the influence of the higher-priced and more heterogeneous Los Angeles and Santa Barbara census tracts relative to the highly homogenous census tracts in San Luis Obispo County. The other variable to change sign was distance to railroad. This may relate to the location of the railroad relative to the ocean in many areas of the study area where being closer to the railroad also means being closer to the beach. The coefficient for distance to highway remained positive, but was statistically insignificant in this specification. The coefficient for the San Luis Obispo dummy variable also changed sign, indicating that properties on the seaward side of US 101 there are relatively more expensive than those observations that are seaward in Ventura County. The third regression considered those properties on the inland side of US 101 and/or Rte. 1. This specification also explains about 80% of variation in price. The coefficients in this regression were substantially like those in the first. The only one to change sign was that for the percent unemployed. The sign for the San Luis Obispo dummy variable was again negative. A second set of regressions was run using only the data from San Luis Obispo. This dataset contains information on the presence of a view and on quality of construction that was not readily available for the other counties. The specification which contains all 2 Sirmans, G. Stacy, David Macpherson and Emily Zietz, The Composition of Hedonic Pricing Models, Journal of Real Estate Literature, 1/1/
78 properties, regardless of whether they are inland or seaward relative to US 101 or Rte. 1 explains about 67% of the variation in house prices, and all census tract variables were statistically insignificant. The specification which considers only those properties on the seaward side of the highway does a better job of explaining the variation in house price (71%). And as would be expected the one which used data only from the inland side properties did worse (57%). The latter was based on a very small dataset (287 observations). The San Luis Obispo specifications for all properties and inland properties indicate that the presence of a view contributes about 8% to the valuation. View appears to be slightly less important on the seaward side (7.4%) than on the inland side of the major highway. 5


79 Exhibit 1 All Properties, All Counties (Seaward/Inland Dummy) Exhibit 2 Seaward Properties, All Counties 6


80 Exhibit 3 Inland Properties, All Counties Exhibit 4 All Properties, San Luis Obispo County (Seaward/Inland Dummy) 7
SANTA BARBARA COUNTY ZONING ADMINISTRATOR STAFF REPORT February 15, 2013
 SANTA BARBARA COUNTY ZONING ADMINISTRATOR STAFF REPORT February 15, 2013 PROJECT: Galbraith Lot Line Adjustment HEARING DATE: March 4, 2013 STAFF/PHONE: J. Ritterbeck, (805) 568-3509 GENERAL INFORMATION
Dr af t Sant a Bar b ar a Count y Housing Elem ent
 6. LAND INVENTORY AND QUANTIFIED OBJECTIVE I n t r o d u c t i o n This chapter includes two important components of the Housing Element: (1) the land inventory and analysis, and (2) the quantified objective
2030 General Plan. December 6, 7 pm
 2030 General Plan GPAC Meeting #9 GPAC Meeting #9 December 6, 7 pm City Council Input on Working Draft Land Use Map Council discussed GPAC & PC versions of the working draft land use map 11/28 Council
4.2 LAND USE INTRODUCTION
 4.2 LAND USE INTRODUCTION This section of the EIR addresses potential impacts from the Fresno County General Plan Update on land use in two general areas: land use compatibility and plan consistency. Under
DRAFT 3 City of Goleta, California March 3, 2004 BACKGROUND REPORT NO. 15 CITY S CURRENT STATUS ON MEETING HCD REQUIREMENTS, INCLUDING RHNA GOALS
 DRAFT 3 City of Goleta, California March 3, 2004 BACKGROUND REPORT NO. 15 CITY S CURRENT STATUS ON MEETING HCD REQUIREMENTS, INCLUDING RHNA GOALS INTRODUCTION The State of California requires that all
A TDR Program for Naples. May 11, 2007
 ATTACHMENT G A TDR Program for Naples May 11, 2007 Introduction This paper is intended to supplement and expand upon the Draft TDR Program Framework authored by Solimar in February 2007. 1 The Framework
Santa Barbara Ranch Transferable Development Rights (TDR) Feasibility Analysis
 Feasibility Analysis") ATTACHMENT B Santa Barbara Ranch Transferable Development Rights (TDR) Feasibility Analysis 3/8/2006 Authors: Bill Fulton Darren Greve Susan Weaver 973 EAST MAIN STREET VENTURA, CALIFORNIA 93001-3025 PHONE:
ATTACHMENT B Santa Barbara Ranch Transferable Development Rights (TDR) Feasibility Analysis 3/8/2006 Authors: Bill Fulton Darren Greve Susan Weaver 973 EAST MAIN STREET VENTURA, CALIFORNIA 93001-3025 PHONE:
SANTA BARBARA COUNTY PLANNING COMMISSION 1.0 REQUEST
 SANTA BARBARA COUNTY PLANNING COMMISSION Staff Report 2015-2023 Housing Element Implementation: Hearing Date: June 1, 2016 Staff Report Date: May 12, 2016 Case Nos.: 16ORD-00000-00006 and 16ORD-00000-00008
SANTA BARBARA RANCH PROJECT DETAILED SUMMARY
 SANTA BARBARA RANCH PROJECT DETAILED SUMMARY Setting and Context. The Naples Townsite encompasses an 800-acre area on the Gaviota coast, located two miles west of the City of Goleta. The Townsite has a
COUNTY OF SANTA BARBARA
 COUNTY OF SANTA BARBARA PLANNING COMMISSION MARKED AGENDA 9:00 a.m. C. MICHAEL COONEY 1st District Santa Barbara County CECILIA BROWN 2nd District, Vice Chair Engineering Building, Room 17 MARELL BROOKS
Project Location 1806 & 1812 San Marcos Pass Road
 SANTA BABARA COUNTY PLANNING COMMISSION Staff Report for Staal Lot Line Adjustment and Rezone Deputy Director: Dave Ward Staff Report Date: June 19, 2009 Division: Development Review - South Case Nos.:
Residential Capacity Estimate
 Residential Capacity Estimate Montgomery County Department of Park & Planning Research & Technology Center January 2005 Current plans allow 75,000 more housing units. by Matthew Greene, Research Planner
PROPOSED FINDINGS OF FACT BENDER URBAN GROWTH BOUNDARY EXPANSION AND ANNEXATION REQUEST April 3, Background
 PROPOSED FINDINGS OF FACT BENDER URBAN GROWTH BOUNDARY EXPANSION AND ANNEXATION REQUEST April 3, 2016 Background The owners of TL300, 301, 302, 303, and 304, 3N1027BD - properties abutting the City Limits
Comprehensive Plan /24/01
 IV The is a central component of the Comprehensive Plan. It is an extension of the general goals and policies of the community, as well as a reflection of previous development decisions and the physical
Plan Santa Paula Workshop III: Evaluating the Proposed Housing Plans. Summary of Participant Comments
 Plan Santa Paula Workshop III: Evaluating the Proposed Housing Plans Summary of Participant Comments Following a presentation and panel discussion regarding potential impacts to water, fiscal resources,
Barbara County Housing Element. Table 5.1 Proposed Draft Housing Element Goals, Policies and Programs
 Table 5.1 Proposed Draft Housing Element Goals, Policies and Programs Goal 1: Enhance the Diversity, Quantity, and Quality of the Housing Supply Policy 1.1: Promote new housing opportunities adjacent to
SANTA BARBARA COUNTY ZONING ADMINISTRATOR Staff Report for Coleman SFD Addition Coastal Development Permit with Hearing
 SANTA BARBARA COUNTY ZONING ADMINISTRATOR Staff Report for Coleman SFD Addition Coastal Development Permit with Hearing Supervisorial District: First Staff Report Date: August 10, 2005 Staff: Lisa Hosale
COUNTY OF SANTA BARBARA PLANNING AND DEVELOPMENT MEMORANDUM. Dianne Meester, Assistant Director On Behalf of Bob Meghreblian and Jack Boysen
 COUNTY OF SANTA BARBARA PLANNING AND DEVELOPMENT MEMORANDUM TO: FROM: County Planning Commission Dianne Meester, Assistant Director On Behalf of Bob Meghreblian and Jack Boysen DATE: April 19, 2006 RE:
CHAPTER 4. MANAGER Single-Family Multi-Family Total. CHAPTER 4: AREA OF IMPACT AND BUILDOUT ANALYSIS Housing Needs Analysis
 The Area of Impact, the areas that Blueprint Boise identifies as potential annexation areas, have come up in several conversations with city officials in the context of the housing analysis. The Area of
Santa Barbara County In-Lieu Fee Update Report. Submitted to: The County of Santa Barbara. Submitted by: Bay Area Economics (BAE)
") Santa Barbara County In-Lieu Fee Update Report Submitted to: The County of Santa Barbara Submitted by: Bay Area Economics (BAE) June 2004 Table of Contents 1 Executive Summary...i 2 Introduction...1 2.1
Santa Barbara County In-Lieu Fee Update Report Submitted to: The County of Santa Barbara Submitted by: Bay Area Economics (BAE) June 2004 Table of Contents 1 Executive Summary...i 2 Introduction...1 2.1
COUNTY OF SANTA BARBARA
 COUNTY OF SANTA BARBARA PLANNING COMMISSION MARKED AGENDA 9:00 a.m. C. MICHAEL COONEY 1st District Santa Barbara County CECILIA BROWN 2nd District Engineering Building, Room 17 C.J. JACKSON 3rd District,
Evaluating the Potential of a Market-Based Transfer of Developments Program to Preserve Open Space in Santa Barbara County
 Evaluating the Potential of a Market-Based Transfer of Developments Program to Preserve Open Space in Santa Barbara County A Group Project submitted in partial satisfaction of the requirements for the
Naples TDR Program Framework
 ATTACHMENT F Naples TDR Program Framework Solimar Research Group August 24, 2007 William Fulton Darren Greve 35 S. VENTURA AVENUE VENTURA, CALIFORNIA 93001 PHONE: 805/643-7700 FAX: 643-7782 WEB: WWW.SOLIMAR.ORG
COUNTY OF SANTA BARBARA
 COUNTY OF SANTA BARBARA PLANNING COMMISSION MARKED AGENDA 9: a.m. C. MICHAEL COONEY 1st District, Vice Chair County of Santa Barbara CECILIA BROWN 2nd District Betteravia Government Center PARKER MONTGOMERY
TRANSFER OF DEVELOPMENT RIGHTS
 STEPS IN ESTABLISHING A TDR PROGRAM Adopting TDR legislation is but one small piece of the effort required to put an effective TDR program in place. The success of a TDR program depends ultimately on the
Bylaw No , being "Official Community Plan Bylaw, 2016" Schedule "A" DRAFT
 Bylaw No. 2600-2016, being "Official Community Plan Bylaw, 2016" Schedule "A" Urban Structure + Growth Plan Urban Structure Land use and growth management are among the most powerful policy tools at the
County and related Memorandum of Understanding MOU
 July 12 2016 TO Mayor and Town Council FROM Joseph Calabrigo Town Manager SUBJECT DEIR for Tassajara Parks project in unincorporated Contra Costa County and related Memorandum of Understanding MOU The
PAPRlamird5-Four Seasons
 PAPRlamird5-Four Seasons Lamird Report This report provides the written record of local circumstances that explains how the 4 Seasons LAMIRD ( this lamird ) fits within the rural element goals of the Growth
Mohave County General Plan
 63 64 65 66 67 68 69 70 71 The Land Use Diagram is not the County's zoning map. 13 It is a guide to future land use patterns. Zoning and area plan designations may be more restrictive than the land use
Santa Ynez Valley Community Plan. Planning Commission Solvang Veteran s Memorial Hall May 13, 2009
 Santa Ynez Valley Community Plan Planning Commission Solvang Veteran s Memorial Hall May 13, 2009 1 May 4, 2009 Planning Commission Hearing A Planning Commission Hearing received an overview of the Draft
Transfer of Development Rights (TDR) in Practice
 in Practice") Transfer of Development Rights (TDR) in Practice Transfer of Development Rights (TDR) programs use market forces to simultaneously promote conservation in high value natural, agricultural, and open space
Transfer of Development Rights (TDR) in Practice Transfer of Development Rights (TDR) programs use market forces to simultaneously promote conservation in high value natural, agricultural, and open space
PROVO CITY MUNICIPAL ANNEXATION GUIDE
 COMMUNITY DEVELOPMENT PROVO CITY MUNICIPAL ANNEXATION GUIDE This guide has been prepared to outline the procedures and requirements of annexing unincorporated territory into Provo City. Annexations are
SANTA BARBARA COUNTY PLANNING COMMISSION Staff Report for Ranch Monte Alegre Lot Line Adjustment
 SANTA BARBARA COUNTY PLANNING COMMISSION Staff Report for Ranch Monte Alegre Lot Line Adjustment Hearing Date: August 2, 2006 Deputy Director: Steve Chase Staff Report Date: July 21, 2006 Division: Development
Our Focus: Your Future 2007 YEAR END HOUSING MONITORING AND SUBDIVISION STATUS REPORTS
 Town of Fort Erie Community & Development Services Our Focus: Your Future Prepared for Council-in-Committee Report No. CDS-011-08 Agenda Date February 4,2008 File No. 350204/350308 Subject 2007 YEAR END
COUNTY OF SANTA BARBARA PLANNING AND DEVELOPMENT MEMORANDUM. Santa Barbara County Planning Commission
 COUNTY OF SANTA BARBARA PLANNING AND DEVELOPMENT MEMORANDUM TO: FROM: HEARING DATE: RE: Santa Barbara County Planning Commission Florence Trotter-Cadena, Planner III North County Development Review October
CITY OF PISMO BEACH PLANNING COMMISSION AGENDA REPORT
 CITY OF PISMO BEACH PLANNING COMMISSION AGENDA REPORT DATE: October 27, 2015 TO: FROM: HONORABLE CHAIR AND MEMBERS OF THE PLANNING COMMISSION Jan Di Leo, Planner (805) 773-7088 jdileo@pismobeach.org APPLICATION:
STANDARDS FOR EVALUATING PROPOSALS
 STANDARDS FOR EVALUATING PROPOSALS Amended by Resolution No. 2011-1; February 2, 2011 Pursuant to Government Code Section 56375, Santa Cruz LAFCO has established standards for the evaluation of proposals.
Provide a diversity of housing types, responsive to household size, income and age needs.
 8 The City of San Mateo is a highly desirable place to live. Housing costs are comparably high. For these reasons, there is a strong and growing need for affordable housing. This chapter addresses the
2006 YEAR END HOUSING MONITORING AND SUBDIVISION STATUS REPORTS
 Town of Fort Erie Community & Development Services Our Focus: Your Future Prepared for: Council-in-Committee Report No.: CDS-022-07 Agenda Date: March 5, 2007 File No.: 350204/350308 Subject: 2006 YEAR
SANTA BARBARA COUNTY PLANNING COMMISSION Staff Report for County Sale of Cary Place Government Code Consistency Determination
 SANTA BARBARA COUNTY PLANNING COMMISSION Staff Report for County Sale of Cary Place Government Code 65402 Consistency Determination Deputy Director: Steve Chase Staff Report Date: June 22, 2006 Division:
CITY OF COLORADO SPRINGS 2006 ANNEXATION PLAN CHAPTER 4 ENCLAVES
 CITY OF COLORADO SPRINGS 2006 ANNEXATION PLAN CHAPTER 4 ENCLAVES As the City has expanded, enclaves, remnants of land that are surrounded by the City, have remained within the jurisdiction of El Paso County.
SANTA BARBARA COUNTY PLANNING COMMISSION Staff Report For Magali Farms/Sulpizio Tentative Parcel Map/Development Plan/ Conditional Use Permit
 SANTA BARBARA COUNTY PLANNING COMMISSION For Magali Farms/Sulpizio Tentative Parcel Map/Development Plan/ Conditional Use Permit Hearing Date: January 9, 2007 Deputy Director: Zoraida Abresch Date: December
PORTLAND PLAN. Household and Employment Forecasts and Development Capacity
 PORTLAND PLAN Household and Employment Forecasts and Development Capacity Managing Change In recent decades, the Portland Metropolitan region and the City of Portland experienced a steady increase in population.
Burlington Unincorporated Community Plan
 Burlington Unincorporated Community Plan June 30, 2010 Meeting Page 1 of 24 Table of Contents (Page numbers to be inserted) I. Background a. Location and Community Description b. Planning of Unincorporated
Land Use. Land Use Categories. Chart 5.1. Nepeuskun Existing Land Use Inventory. Overview
 Land Use State Comprehensive Planning Requirements for this Chapter A compilation of objectives, policies, goals, maps and programs to guide the future development and redevelopment of public and private
410 Land Use Trends Comprehensive Plan Section 410
 411 410 Comprehensive Plan Section 410 In order to plan future land use, we must know how the land is used today. This section includes the following: Definition of analyzed land-use categories Summary
SANTA BARBARA COUNTY ZONING ADMINISTRATOR STAFF REPORT January 11, 2008
 SANTA BARBARA COUNTY ZONING ADMINISTRATOR STAFF REPORT January 11, 2008 PROJECT: Gerrity Parking in Side Setback and Gerrity Student Housing Addition HEARINGDATE: January 28, 2008 STAFF/PHONE: J. Ritterbeck,
CITY OF SANTA ROSA COMMUNITY DEVELOPMENT DEPARTMENT STAFF REPORT FOR PLANNING COMMISSION SEPTEMBER 10, 2015 APPLICANT FILE NUMBER MJP
 ITEM NO. 9 CITY OF SANTA ROSA COMMUNITY DEVELOPMENT DEPARTMENT STAFF REPORT FOR PLANNING COMMISSION SEPTEMBER 10, 2015 PROJECT TITLE Yogurt Time Center ADDRESS/LOCATION 3093 Marlow Road ASSESSOR S PARCEL
Whither the Wilderness County?
 Whither the Wilderness County Lane Kendig Kendig Keast Collaborative Scott Clark Director, Kootenai County Community Development Wilderness City Wilderness City is an oxymoron. Urban City cannot be a wilderness.
PLANNING COMMISSION STAFF REPORT February 19, 2015
 Community Development Department Planning Division 1600 First Street + P.O. Box 660 Napa, CA 94559-0660 (707) 257-9530 PLANNING COMMISSION STAFF REPORT February 19, 2015 AGENDA ITEM #7A PL13-0091 GENERAL
L. LAND USE. Page L-1
 L. LAND USE 1. Purpose This section discusses current and likely future land use patterns in Orland. An understanding of land use trends is very important in determining Orland's ability to absorb future
8Land Use. The Land Use Plan consists of the following elements:
 8Land Use 1. Introduction The Land Use Plan consists of the following elements: 1. Introduction 2. Existing Conditions 3. Opportunities for Redevelopment 4. Land Use Projections 5. Future Land Use Policies
Eastern Corridor Planning Area Workshop No April 2016
 Eastern Corridor Planning Area Workshop No. 3 28 April 2016 Agenda 1. Visual Aids 2. Guiding Principles 3. Preferred Alternative Concept Plan 4. Fiscal Impact Analysis 5. Findings 6. Recommendations 7.
1. an RSF-R, RSF-1, RSF-2, RSF-4, RMF-5, or RMF-8 zoning district; or
 Chapter 9 INCENTIVES 9.1 General 9.1.1 Review and Approval Procedure Projects requesting bonuses under this chapter for land that has not been platted, or for land that is being voluntarily replatted,
Cover Letter with Narrative Statement
 Cover Letter with Narrative Statement March 31, 2017 rev July 27, 2017 RE: Rushton Pointe Residential Planned Unit Development Application for Public Hearing for RPUD Rezone PL2015 000 0306 Mr. Eric Johnson,
Appendix B: Housing Element Sites Inventory and Detailed Analysis
 Appendix B: 2015-2023 Housing Element Sites Inventory and Detailed Analysis Redwood City General This page intentionally left blank. Redwood City General Site Identifier Assessor Parcel Number General
Notice of Intent Supplemental Form for Riverfront Area
 Notice of Intent Supplemental Form for Riverfront Area The Notice of Intent Supplemental Form for Riverfront Area is recommended for use with the Notice of Intent (Form 3) in the wetland regulations (310
Existing Land Use. Typical densities for single-family detached residential development in Cumberland County: 1
 Existing Land Use A description of existing land use in Cumberland County is fundamental to understanding the character of the County and its development related issues. Economic factors, development trends,
COUNTY OF SANTA BARBARA
 COUNTY OF SANTA BARBARA CENTRAL St. Mark s in the Valley BOARD OF ARCHITECTURAL REVIEW Episcopal Church APPROVED MINUTES 2905 Nojoqui Street Los Olivos, CA 93441 Meeting Date: June 20, 2008 (805) 934-6250
Santa Susana Field Laboratory (SSFL) area Open Space Land Use Designation (General Plan) and Rural Agriculture (RA) Zone
 area Open Space Land Use Designation (General Plan) and Rural Agriculture (RA) Zone") Santa Susana Field Laboratory (SSFL) area Open Space Land Use Designation (General Plan) and Rural Agriculture (RA) Zone A] Inconsistent Zoning Summary: The entire area constituting of the Santa Susana
Santa Susana Field Laboratory (SSFL) area Open Space Land Use Designation (General Plan) and Rural Agriculture (RA) Zone A] Inconsistent Zoning Summary: The entire area constituting of the Santa Susana
P o p u l a t i o n, L a n d U s e, a n d Z o n i n g
 P o p u l a t i o n, L a n d U s e, a n d Z o n i n g The Town of Upper Marlboro is located only 15 miles southeast of the District of Columbia, in the central portion of Prince George s County in the
BUILD YOUR OWN CUSTOM ESTATE HOME DEVELOPMENT OPPORTUNITY UNTOUCHED AND PRISTINE
 O F F E R I N G M E M O R A N D U M BUILD YOUR OWN CUSTOM ESTATE HOME DEVELOPMENT OPPORTUNITY UNTOUCHED AND PRISTINE Santa Barbara Wine Country WORLDBID AUCTION BIDS DUE BY AUGUST 2, 2017 143 Acres. Seven
Agenda Item No. 6B May 9, Honorable Mayor and City Council Attention: Jeremy Craig, Interim City Manager
 Agenda Item No. 6B May 9, 2017 TO: FROM: SUBJECT: Honorable Mayor and City Council Attention: Jeremy Craig, Interim City Manager Barton Brierley, AICP, Community Development Director (Staff Contact: Barton
THE MARIN COUNTY HOUSING ELEMENT AND TAM VALLEY
 THE MARIN COUNTY HOUSING ELEMENT AND TAM VALLEY The Marin County Community Development Agency is currently working toward completion of the Housing Element of the County s general plan (the Marin Countywide
COUNTY OF SANTA BARBARA
 COUNTY OF SANTA BARBARA AGRICULTURAL PRESERVE ADVISORY COMMITTEE APPROVED MINUTES MEETING OF FEBRUARY 5, 2016 9:00 A.M. The regular meeting of the Agricultural Preserve Advisory Committee was called to
Town of Waxhaw Board of Commissioners. Waxhaw Police Department Community Meeting Room Tuesday January 12, 2016
 Town of Waxhaw Board of Commissioners Waxhaw Police Department Community Meeting Room Tuesday January 12, 2016 Petition RZ-003994-2015 A request by the Town of Waxhaw Planning & Community Development Department,
DRAFT Subject to Modifications
 TREASURE COAST REGIONAL PLANNING COUNCIL M E M O R A N D U M DRAFT Subject to Modifications To: Council Members AGENDA ITEM 5L From: Date: Subject: Staff September 17, 2010 Council Meeting Local Government
SANjOSE CAPITAL OF SILICON VALLEY
 COUNCIL AGENDA: 06/14/16 ITEM: 11.1(a) CITY OF ffr -3 SANjOSE CAPITAL OF SILICON VALLEY CITY COUNCIL STAFF REPORT File No. C16-015 Applicant: Owens Mortgage Investment Fund Location 455 Piercy Road Existing
APPENDIX B RESIDENTIAL DENSITY
 APPENDIX B RESIDENTIAL DENSITY RESIDENTIAL DENSITY - SPECIFIC AREAS OF THE CITY Policy Issue Examine specific areas of the City to determine appropriate residential densities. Public comments have expressed
07/16/2014 Item #10E Page 1
 MEETING DATE: July 16, 2014 PREPARED BY: Jeff Murphy DEPT. DIRECTOR: Jeff Murphy DEPARTMENT: Planning & Building CITY MANAGER: Gus Vina SUBJECT: City Council consideration and possible action and/or staff
Napa County Planning Commission Board Agenda Letter
 Agenda Date: 3/18/2009 Agenda Placement: 9A Napa County Planning Commission Board Agenda Letter TO: FROM: Napa County Planning Commission John McDowell for Hillary Gitelman - Director Conservation, Development
Analysis of Infill Development Potential Under the Green Line TOD Ordinance
 Analysis of Infill Development Potential Under the Green Line TOD Ordinance Prepared for the Los Angeles County Second Supervisorial District Office and the Department of Regional Planning Solimar Research
COASTAL CONSERVANCY. Staff Recommendation January 18, Carmel River Parkway Acquisitions. File No Project Manager: Trish Chapman
 COASTAL CONSERVANCY Staff Recommendation January 18, 2006 Carmel River Parkway Acquisitions File No. 06-104 Project Manager: Trish Chapman RECOMMENDED ACTION: Authorization to disburse up to $3,500,000
A Unique Opportunity to Own the Premier Destination Retail Development of Santa Barbara Wine Country
 A Unique Opportunity to Own the Premier Destination Development of Santa Barbara Wine Country COAST DEVELOPMENT PARTNERS, INC. 2928 SAN MARCOS AVE, STE. 202 LOS OLIVOS, CALIFORNIA 93441 T: 805.691.3048
Butte County Board of Supervisors
 Butte County Board of Supervisors PUBLIC HEARING January 12, 2016 Amendments to the General Plan and Zoning Ordinance AG-P5.3 (Agricultural Buffer) and Interim Agricultural Uses Butte County Department
3.1 Land Use and Agriculture
 3.1 Land Use and Agriculture This section presents the environmental setting and evaluates the potential impacts on land use and agricultural resources in the Lemoore Planning Area from implementation
RARE APARTMENT DEVELOPMENT OPPORTUNITY
 RARE APARTMENT DEVELOPMENT OPPORTUNITY FOR SALE 222 E. Carrillo Street, Suite 101, Santa Barbara, California 93101 HayesCommercial.com Property Overview Excellent opportunity for an investor or developer
COUNTY OF SANTA BARBARA
 COUNTY OF SANTA BARBARA SOUTH BOARD OF ARCHITECTURAL REVIEW AGENDA Santa Barbara County Planning Commission Hearing Room Engineering Building, Room 17 123 East Anapamu Street Meeting Date: December 1,
INDIAN RIVER COUNTY, FLORIDA. The Honorable Members of the Planning and Zoning Commission DEPARTMENT HEAD CONCURRENCE
 Public Hearing Legislative INDIAN RIVER COUNTY, FLORIDA M E M O R A N D U M TO: The Honorable Members of the Planning and Zoning Commission DEPARTMENT HEAD CONCURRENCE Robert M. Keating, AICP; Community
1.0 INTRODUCTION 1.1 OVERVIEW
 .0 INTRODUCTION 0 0 0. OVERVIEW The County of Santa Barbara prepared a Draft Environmental Impact Report (EIR) for the Paradiso del Mare Ocean Estates and Inland Estates Project and circulated the Draft
LEGAL NOTICE PLANNING COMMISSION PUBLIC HEARING
 LEGAL NOTICE PLANNING COMMISSION PUBLIC HEARING NOTICE IS HEREBY GIVEN that the Planning Commission of the City of Oceanside, California, will on Monday, August 27, 2018, at 6:00 p.m. in the Council Chambers
ORDINANCE NO. Applicable Code Chapter. Zone Symbol. Name of Zone. Agricultural Zones. Resource Protection Zones. Residential Zones.
 ORDINANCE NO. AN ORDINANCE AMENDING SECTION 35-1, THE SANTA BARBARA COUNTY LAND USE AND DEVELOPMENT CODE, OF CHAPTER 35, ZONING, OF THE COUNTY CODE, BY AMENDING ARTICLE 35-1 (DEVELOPMENT CODE APPLICABILITY),
1 dwelling unit/existing parcel with provisions for a guest house and additional quarters
 TABLE 1.3 Land Use Designations and Permissible Densities Land Use Density Additional Detail Maximum Land Coverage Land Use Residential Uses Density Additional Detail Maximum Land Coverage Single Family
Marion County Board of County Commissioners
 Marion County Board of County Commissioners Date: 12/29/2015 P&Z: 12/28/2015 BCC: 1/12/2016 Item Number 160113Z Type of Application Rezoning Request From: A-1 (General Agriculture) To: PUD (Planned Unit
CHAPTER 2 VACANT AND REDEVELOPABLE LAND INVENTORY
 CHAPTER 2 VACANT AND REDEVELOPABLE LAND INVENTORY CHAPTER 2: VACANT AND REDEVELOPABLE LAND INVENTORY INTRODUCTION One of the initial tasks of the Regional Land Use Study was to evaluate whether there is
Letter of Intent May 2017 (Revised November 2017)
") THE BEACH AT WOODMOOR LETTER OF INTENT MAY 2017 (REVISED NOVEMBER 2017) OWNER/APPLICANT: CONSULTANT: Lake Woodmoor Holdings LLC N.E.S. Inc. 1755 Telstar Drive, Suite 211 619 North Cascade Avenue Colorado
THE BEACH AT WOODMOOR LETTER OF INTENT MAY 2017 (REVISED NOVEMBER 2017) OWNER/APPLICANT: CONSULTANT: Lake Woodmoor Holdings LLC N.E.S. Inc. 1755 Telstar Drive, Suite 211 619 North Cascade Avenue Colorado
Santa Barbara County Article II Coastal Zoning Ordinance
 Santa Barbara County Article II Coastal Zoning Ordinance Published January 2014 Updated February 2018 123 East Anapamu Street Santa Barbara, CA 93101 805.568.2000 624 West Foster Road, Suite C Santa Maria,
TOWN OF ORO VALLEY PLANNING & ZONING COMMISSION MEETING DATE: December 6, 2011
 PLANNING & ZONING COMMISSION MEETING DATE: December 6, 2011 TO: FROM: SUBJECT: PLANNING & ZONING COMMISSION Matt Michels, Senior Planner mmichels@orovalleyaz.gov; tel. 229-4822 Public Hearing: Rancho de
Walworth County Farmland Preservation Plan Update, Chapter 1 Plan Summary (Cover Document)
") Background Walworth County Farmland Preservation Plan Update, 2012 Chapter 1 Plan Summary (Cover Document) For over 30-years, the Wisconsin Farmland Preservation Program has served to preserve Walworth
Background Walworth County Farmland Preservation Plan Update, 2012 Chapter 1 Plan Summary (Cover Document) For over 30-years, the Wisconsin Farmland Preservation Program has served to preserve Walworth
Napa County Planning Commission Board Agenda Letter
 Agenda Date: 2/7/2018 Agenda Placement: 8C Napa County Planning Commission Board Agenda Letter TO: FROM: Napa County Planning Commission Charlene Gallina for David Morrison - Director Planning, Building
COUNTY OF SANTA BARBARA PLANNING AND DEVELOPMENT Consent Agenda. Doug Anthony, Deputy Director, Development Review - North
 COUNTY OF SANTA BARBARA PLANNING AND DEVELOPMENT Consent Agenda TO: FROM: County Planning Commission Doug Anthony, Deputy Director, Development Review - North HEARING DATE: December 5, 2011 RE: Hearing
California Office 2001 N Street Suite 110 Sacramento, CA VIA
 California Office 2001 N Street Suite 110 Sacramento, CA 95811 VIA EMAIL June 20, 2016 Mary Piepho, Chair, Contra Costa County LAFCO 651 Pine Street, 6th Floor Martinez, California 94553 Re: Comments to
MONTGOMERY COUNTY RENTAL HOUSING STUDY. NEIGHBORHOOD ASSESSMENT June 2016
 MONTGOMERY COUNTY RENTAL HOUSING STUDY NEIGHBORHOOD ASSESSMENT June 2016 AGENDA Model Neighborhood Presentation Neighborhood Discussion Timeline Discussion Next Steps 2 WORK COMPLETED Socioeconomic Analysis
United States Post Office and Multi-Family Residential; and, Single- Family Residence with an Apartment
 Planning Commission File No.: AME2013 0009 January 9, 2014 Page 2 of 9 Existing Land Use: United States Post Office and Multi-Family Residential; and, Single- Family Residence with an Apartment Surrounding
Attachment A First Submittal JAZB Safety Zones A and B
 Attachment A First Submittal JAZB Safety Zones A and B Attachment B Second Submittal JAZB Safety Zones A and B Attachment C Flying Cloud Airport (FCM) Draft Airport Zoning Ordinance Social and Economic
After taking public testimony, staff recommends the City Council take the following course of action:
 City Council Agenda May 5, 2015 Public Hearings Agenda Item No. B.04 Reviewed by City Mgr s office: /KLM Memo to: From: Manteca City Council Erika E. Durrer, Senior Planner Date: April 22, 2015 Subject:
Article 6 Development Permits. Division 5: Site Development Permit Procedures (Added by O N.S.; effective
 Article 6 Development Permits Division 5: Site Development Permit Procedures (Added 12-9-1997 by O-18451 N.S.; effective 1-1-2000.) 126.0501 Purpose of the Site Development Permit Procedures The purpose
4.13 Population and Housing
 Environmental Impact Analysis Population and Housing 4.13 Population and Housing 4.13.1 Setting This section evaluates the impacts to the regional housing supply and population growth associated with implementation
March 26, Sutter County Planning Commission
 March 26, 2003 To: Re: Sutter County Planning Commission Agenda Item #12: Public hearing on Rezoning #03-04 to change the zoning classification of two parcels totaling 324+ acres from the AG (General Agricultural)
4. If any perennial surface water passes through or along the property lines of the acreage, a minimum of 200 feet or frontage should be required.
 b. Provide adequate acreage for appropriate productive use of rural residential land, such as small numbers of livestock, large gardens, etc. 3. Minimum of 200 feet of frontage on an improved county or