CHAPTER 2 VACANT AND REDEVELOPABLE LAND INVENTORY
|
|
|
- Lora Carter
- 6 years ago
- Views:
Transcription
1 CHAPTER 2 VACANT AND REDEVELOPABLE LAND INVENTORY
2 CHAPTER 2: VACANT AND REDEVELOPABLE LAND INVENTORY INTRODUCTION One of the initial tasks of the Regional Land Use Study was to evaluate whether there is sufficient vacant and redevelopable land within the urban service area to accommodate projected population and employment growth. The Martin County and St. Lucie Metropolitan Planning Organizations (MPOs) have projected that study area population will climb to more than 360,000 persons by the year 2025 and employment will reach nearly 125,000. The MPOs socioeconomic data projections have been used to determine whether or not the urban service area should be expanded and to identify the criteria for evaluating future requests to expand the urban service area. This chapter summarizes the methodology for categorizing vacant and redevelopable land as well as assessing future development potential. Data development, review methods, findings and development potential methodologies are described in detail below. DATA DEVELOPMENT AND REVIEW The land inventory involved the identification of vacant lands, environmentally sensitive lands and properties that were considered to be redevelopable within the study area. The starting point for the vacant and redevelopable land inventory was parcel level data and maps. A geographic information system (GIS) software platform was used to efficiently identify vacant, environmentally sensitive and redevelopable land. Vacant land was defined as any property without a principal structure (building, foundation, parking area, trailer, etc.). Environmentally sensitive lands were identified as conservation lands, wetlands, and other sensitive areas. Identifying redevelopable lands was more complex and the methodology for assessing the redevelopment potential is detailed below. Ultimately, it was determined that there are approximately 48,000 acres of developable vacant land and 9,000 acres of redevelopable land in the study area. As outlined below, it was concluded that, if future land development patterns are clustered consistent with the recommended Community Centers vision, the capacity of vacant and redevelopable land meets or exceeds the 2025 total projected population and employment estimates of the two MPOs. Page 2-1
3 Such clustering may require the purchase and assembly of parcels in certain areas, and subsequent sale of such land to be developed in this manner. Community support and political will and direction is vital to such an effort. If this is not possible, then community center locations may, in part, need to be located in more western, undeveloped locations. VACANT LAND INVENTORY The project team contacted various local government agencies with land use authority in the study area. The availability of geographic information, land use maps and electronic data varied significantly by feature and between agencies. Datasets ranged from highly sophisticated geographically based property appraiser databases and rectified aerial photographs to hard copy maps of existing development patterns. Ultimately, the two counties Property Appraisers tax rolls and GIS layers were determined to be the best starting point for creating a base GIS coverage for the entire study area. Land Use Data The land inventory involved the aggregation of land use information from the Martin and St. Lucie County property appraisers offices. The analysis began with property boundary or parcel level maps. The property appraiser databases included Department of Revenue (DOR) land use codes, information on buildings and other structures, land area statistics and property ownership details. DOR land use codes classify land by existing use for tax reporting purposes and various codes are included for types of vacant land including vacant residential, vacant commercial, vacant industrial, vacant agricultural, conservation, submerged lands, rights-of-way and other miscellaneous government reservations. The study team loaded all available property appraiser data for the study area into a GIS software computer application for analysis. GIS applications allow efficient analysis of large geographically specific data sets. The vacant land inventory used parcel level property details, but the final analysis was aggregated and conducted at the traffic analysis zone (TAZ) level. Martin County s parcel coverage has not been updated in four years, so some parcels were missing data and some records were not associated with a polygon in the GIS layer. For the Page 2-2
4 properties that were missing land use data, the project team created an overlay with the South Florida Water Management District s (SFWMD) 1988 land use layer. Vacant Land Vacant land was identified as those parcels without physical improvements such as buildings, foundations, parking areas or trailers. Unimproved land was identified by examining the property appraisers improvement codes and the DOR existing land use codes. Property appraisers track the value of improvements made to land and categorize these taxable values separately from land values. Martin County maintains a property group field in its features database. Parcels that were identified with an L (meaning land only) in all associated records in the features database were assumed to have no improvement. The DOR land use codes categorize useable versus unusable vacant land based on the state tax reporting requirements. In addition, Martin County s Growth Management Division also provided a vacant land inventory coverage for land with commercial or industrial future land use. There was also considerable input from the project Steering Committee. Visual checks of aerial photos determined whether parcels selected from the above methods were actually vacant. Environmental Constraints In addition to the DOR land use codes that classify lands as submerged lands, high recharge areas and conservation lands, the study team used GIS coverages from various agencies to identify wetlands, conservation lands, environmentally sensitive lands and soils with development limitations. GIS coverages used to identify environmental lands included: (1) the U.S. Fish and Wildlife s National Wetlands Inventory (NWI); (2) the Florida Department of Environmental Protection (DEP) Conservation Lands Inventory; (3) the St. Lucie County Environmentally Sensitive Lands Database; (4) the Martin County Conservation and Recreation Areas Coverage; (5) the South Florida Water Management District (SFWMD) Land Use and Land Coverage; and (6) United States Department of Agriculture (USDA) Natural Resources Conservation Service Hydric Soils Coverage. For the wetlands coverages, a conservation buffer of 25 feet was added to all polygons as a proxy for an uplands buffer. The USDA Hydric Soils Page 2-3
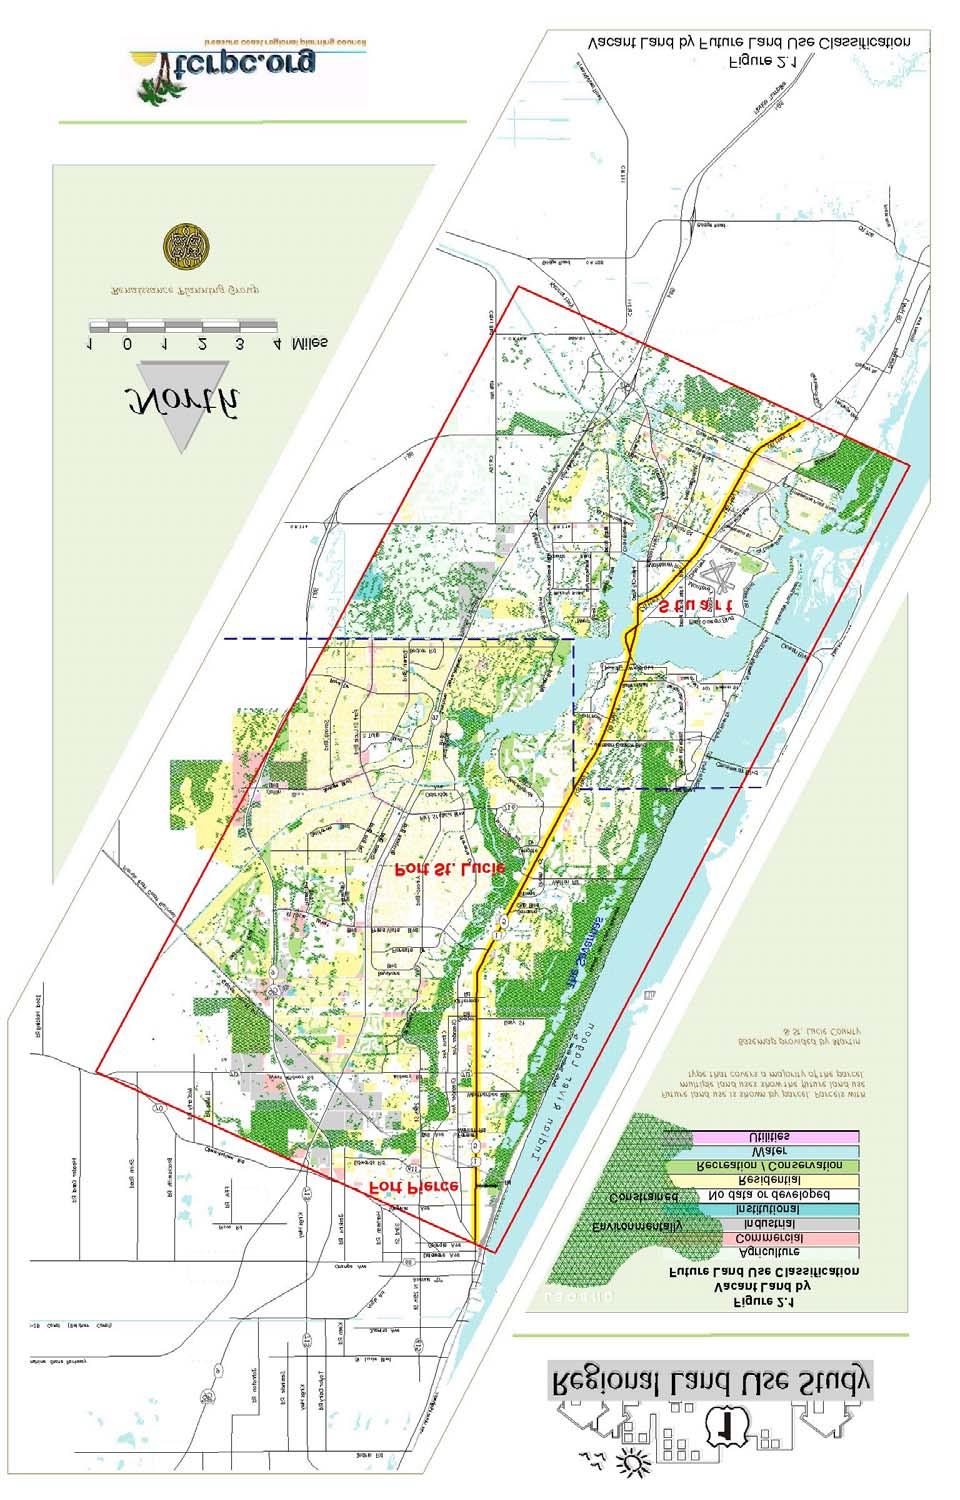
5 coverage was determined to be too restrictive because an overly high percentage of platted subdivisions were identified as being located on restricted soils. Ultimately, it was determined that there were 18,530 acres of conservation lands (including conserved recreation areas) and 777 acres of submerged parcels located within the project study area. Additionally, a policy assessment of various environmental regulations impacting development potential was undertaken for all agencies having environmental jurisdiction within the study area. Agencies analyzed include Martin County, St. Lucie County, the Water Management Districts, the Florida Department of Environmental Protection and the Florida Fish and Wildlife Conservation Commission. The results of this policy assessment are included in Appendix B. Future Land Use The project team selected the best data sources for electronically identifying and categorizing vacant land by future land use designation. Initially, the team considered using future land use coverages from the two counties. However, it was discovered that the planning departments do not have suitable electronic land use data for the cities. The project team obtained the planning department future land use coverages for both counties as well as the cities of Port St Lucie and Stuart. The following agencies indicated that they did not have GIS layers available: Fort Pierce, St. Lucie Village, Ocean Breeze Park, Town of Seawall s Point and the Treasure Coast Regional Planning Council. Based on the information assembled from the various sources, a map of the study area was created depicting environmentally sensitive land and vacant land by future land use category. (Figure 2.1) shows this map, which was used to analyze the amount of vacant land in the study area relative to projected population and employment growth through ASSESS LAND AVAILABILITY Once all of the above data was compiled within a relational GIS platform, the project team used a two-step approach to assessing development potential. The first step identified vacant parcels with development potential and eliminated those with little or no potential due to Page 2-4
6
7 relative size, environmental constraints or future land use designation as conservation. For example, large vacant tracts of land already zoned commercial without environmental constraints would have a good development potential and were retained within the database. The second step identified the development potential (or capacity) of the vacant land using different assumptions regarding development patterns and urban design. Developable Vacant Land As depicted in Table 2.1, it was determined that there are roughly 48,000 acres of developable land in the study area. This number represents about 70 percent of the total land area in the study area. Much of the vacant land in the study area is classified as agricultural, residential or conservation. Table 2.1 Vacant Acreage Summary for Martin and St. Lucie Counties Future Land Use Category St. Lucie County Percent Martin County Percent Total Developable (1) Agricultural % 9, % 9, ,703.4 Residential (Single & Multi) 23, % 6, % 29, ,413.9 Commercial 3, % % 4, ,085.6 Industrial 2, % 1, % 4, ,151.9 Institutional % % Utilities % - 0.0% Recreation/Conservation 14, % 3, % 18,529.2 Water Bodies % % Other % % No Data Provided % % Totals 45, % 22, % 68, ,206.2 Developable (1) 30, % 18, % 48, % (1) Includes agricultural, residential, commercial, industrial, and institutional categories. Development Potential Once the total number of vacant acres was categorized by land use designation, the study team projected the development potential of two possible scenarios. This was done using unique community elements for each type of area (rural, suburban and urban) and electronically describing the development character for each element (low density residential, commercial, Page 2-6
8 public institution, et cetera). Each community element reflects the development potential within a circle having a quarter mile diameter (or an area of about 31.7 acres). The study team also created new enhanced elements that are not specifically urban, suburban, or rural in character. Rather, these enhanced areas assume clustered, mixed-use development patterns where buildings are located close to the street, close to one another and development is balanced between residential and non-residential uses. The details of the community elements and the model used to assign the elements are described in further detail in Chapter 3. Development potential was evaluated using two types of development patterns: suburban and enhanced. Future development potential for the available and suitable vacant land in the study area was estimated by multiplying the number of residential units, amount of building area of non-residential buildings, developed land, parking, infrastructure and other development characteristics associated with suburban or enhanced community elements. Ratios of persons per dwelling unit and employees per non-residential square feet were used to determine the population and employment potential. Tables 2.2 and 2.3 include the community element assignments and illustrate the projected land carrying capacity for each scenario. The development units in Tables 2.2 and 2.3 are equal to the total available acres (from Table 3-1) divided by the area in each community element (31.7 acres). The CEM column in the tables reflects the assumed community element type for each land use category. The inventory for each element includes, among other characteristics, an estimate of the total population and Table 2.2 Suburban Estimate of Vacant Land Carrying Capacity Community Available Acres Devt Units Element Type Population Employment Agricultural 9, Sub. Res. Low Density 21, ,756.6 Residential 29, Sub. Res. Med. Density 111, ,561.8 Commercial 4, Sub. Commercial 3, ,954.7 Industrial 4, Sub. Industrial 1, ,615.7 Institutional Sub. Public Institution 1, Recr/Cons - - Sub. Public Institution - - Other - - Sub. Res. Low Density - - No Data - - Sub. Res. Low Density - - Totals 48, , , ,654.7 Page 2-7
9 Table 2.3 Enhanced Estimate of Vacant Land Carrying Capacity Community Available Acres Devt Units Element Type Population Employment Agricultural 9, Rural Ag./Forest ,072.0 Residential 29, Enhanced Mixed Res. 296, ,776.7 Commercial 4, Enhanced Mixed Use 19, ,723.2 Industrial 4, Sub. Industrial 1, ,615.7 Institutional Urban Pub. Institutional 1, ,708.9 Recr/Cons - - Sub. Conservation Area - - Other - - Coastal/Conservation - - No Data - - Coastal/Conservation - - Totals 48, , , ,896.5 employment within the 31.7-acre community element area. The total population and employment in Tables 2.2 and 2.3 equal the development units multiplied by the population and employment totals for the assumed element type. For example, the estimated population for the suburban residential low-density (SRL) community element is 69. The population potential for vacant agricultural land, which is assumed to develop as a SRL type community, is equal to the development units for agricultural land (306.3) times the population potential for the SRL element (69), or 21,135 people. Assuming development continues to be predominately suburban in character, the available vacant land in the study area (around 48,000 acres) will accommodate almost 140,000 additional people and slightly more than 60,000 employees (Table 2.2). Assuming development patterns are more clustered and mixed, as reflected in the enhanced community elements, vacant land in the study area can accommodate over 300,000 people and over 130,000 employees (Table 2.3). The development potential of enhanced community elements is more than two times that of the suburban elements. The current study area population is around 190,000. According to forecasts by the University of Florida s Bureau of Economic and Business Research (BEBR), the study area s population will grow to around 360,000 by the year 2025, an increase of 170,000 people. Using current ratios of population to employment, the number of employees in the study area will increase from 60,000 currently to around 125,000 by 2025, an increase of 65,000 employees. If current suburban development patterns continue, the vacant land analysis indicates there will not be enough land within the urban service boundary to accommodate the anticipated Page 2-8
10 growth over the next 25 years. The capacity of 140,000 people and 60,000 jobs is not enough for the anticipated increase of 170,000 people and 65,000 jobs. However, if development is focused into enhanced community types, there will be much more than enough land for the anticipated growth (population capacity of 400,000 and employment capacity of 140,000). Redevelopment Potential In addition to evaluating the development potential of vacant land, the study team also completed an inventory of redevelopable land located within the study area. Redevelopable land is defined as property that is suitable for: Infill development - includes parcels that are typically too small to be picked up by a vacant land inventory or include relatively small principal structures that could easily be reused, such as parking lots or foundations. Redevelopment - involves a wholesale reuse and reconstruction of a potential development site. Typically, land that has a high potential for redevelopment is currently underutilized or undervalued compared to surrounding properties that are similarly situated. There are also a number of independent factors that represent obstacles to redevelopment, including the number of property owners, size of a parcel, relative cost of existing improvements and the value of continuing improvements to maintain a property. In order to assess all of these factors simultaneously, the study team created and applied a set of weighted measures to assess the property appraiser s parcel databases at the Traffic Analysis Zone (TAZ) level. Redevelopment Criteria This analysis identified parcels that could be targeted for infill development and redevelopment. Infill development could occur where the local development patterns include vacant tracts surrounded by relatively high intensity development. Redevelopment could be encouraged in areas where property values are relatively low, vacancy rates are increasing or where properties may be characterized as under-utilized. These areas may be more suited to a higher use if market conditions and local development regulations change. Page 2-9
11 Based upon the project team s assessment of available GIS data, the characteristics presented in Table 2.4 were given a weighted score to create an index rating of high, medium or low development potential within the study area based on the variables in the table. Some of the evaluation variables described below were calculated by aggregating property appraiser data to the TAZ level and comparing by acreage. The variables used were: Median year built per acre, Number of parcels per acre, Median parcel size by TAZ, Number of site improvements per acre, Assessed value as compared to study area average, Number of owners per acre, and Parcels with high intensity future land use designations and less intense existing uses (DOR use code). Evaluation measures determining the availability of water, sewer and stormwater facilities were included in the methodology based on availability of GIS layers. Once the project team assembled and reviewed all of the available data, the individual land features were assigned a weighted score as described in Table 2.4. Page 2-10
12 Table 2.4: Redevelopment Potential Framework Land Feature Variable: Analytical Assumption: Variable High Medium Low Parcel Size Parcel Size Proportion of vacant land Platted parcel Located within designated redevelopment areas (CRA's and downtowns) Environmental constraints Assessed value of property per acre Development hot spots Median structure age Few improvements per acre Few owners per acre Future Land Use compared to Zoning/Existing Land Use Adequate Infrastructure Parcels exceeding 20 acres generally have high redevelopment potential. Parcels exceeding 20 acres generally have high redevelopment potential. It is easier to attract infill development on vacant parcels. Redevelopment of existing properties may also be encouraged when adjacent parcels are vacant. Developers prefer to invest in infill development when the development potential is quantified, particularly subdivided parcels with consistent zoning and FLU. Parcels already identified by local gov t. for redevelopment or new development (in-fill). Development should be directed away from parcels that are substantially restricted by environmental constraints. Small area property value trends may be identified when median assessed values are compared to countywide and study area-wide values. Lower assessed values may indicate redevelopment potential. Through discussions with local realtors/developers/local gov t. staff, known development hot spots will be depicted for analysis purposes. Areas with a high concentration of older structures may have a significant redevelopment potential. Some structure may be too costly to redevelop due to changing construction standards or useful life of structure Areas with very few improvements per acre (principal buildings, storage buildings, signs, garages, fences, and pools) tend to reflect potential for redevelopment. Few improvements may indicate a high ratio of leased parcels, declining property values, lack of property owner maintenance and poor neighborhood image. An area with fewer land owners is generally easier for redevelopment. This ratio also indicates where smaller tracts may be assembled into larger parcels. Properties that are under-utilized or under-zoned create the potential for redevelopment based upon FLU designation. Redevelopment potential is increased when water, sewer, and stormwater utilities are readily available to a site. largest parcel in TAZ 20 acres 10 acres 2 acres average parcel size in TAZ 20 acres 10 acres 2 acres avg of vacant AGR, RES, COM, IND acres Platted parcels without improvements Identify existing CRA's & map downtown areas Percent of TAZ acreage that is constrained? Compare average TAZ parcel value to median Study Area parcel value (by County) Map "hot spots" and identify proximate properties Vacant acres exceeds 100 per TAZ Platted parcels exceed 100 parcels per TAZ Inside identified areas Vacant acres exceeds 75 per TAZ Platted parcels exceed 50 parcels per TAZ n/a Vacant acres exceeds 30 per TAZ Fewer than 25 platted parcels per TAZ Outside identified areas LT 25% 26-50% GT 50% TAZ average values between % of study area median Average Year Built by TAZ Average number of improvement features per parcel TAZ average values of 60-80% and % of study area median TAZ average values of 0-59% and GT 131% of study area median within 1/4 mile within 1/2 mile GT 1/2 mile and Number of owners per acre of land LT 0.3 LT 0.7 GT 1.5 Percent of FLU to DOR code matches by TAZ older than 1950 GT 95% GT 75% LT 50% In or out of the uban service area In n/a Out The analysis also categorized each potentially developable parcel into the following classes based on DOR codes: Agricultural; Commercial (mixed use, office, retail and service); Government/institutional; Page 2-11
13 Public recreation; Industrial; Education; Miscellaneous (ROW and utilities), and Residential (single-family and multi-family). The team was able to maintain future land use (FLU) overlays with the parcel layer throughout the analysis. Future development potential was restricted when a parcel was impacted by environmental and wetlands restrictions. The analytical tests aggregated parcels at the TAZ level to efficiently sort vacant and redevelopable land included in the inventory according to its potential. Large vacant parcels without environmental constraints were identified using the property appraiser s database, parcel size and considering whether the parcel is part of an approved DRI. These tests selected vacant developable land not already included within a DRI and without development constraints. Other tests identified large parcels with high intensity future land use designations and less intense existing uses and less intense zoning. It was assumed that underutilized land indicates a high potential for redevelopment. Within a TAZ, the average assessed value, average parcel size, common ownerships and average number of improvement records were compared to the study area-wide averages. The project team determined that areas with few owners, large tracts, low assessed values and few improvements were ripe for redevelopment efforts. The availability of existing or proposed infrastructure to serve potentially developable land was also examined. Redevelopable Land Applying the redevelopment criteria in the study area resulted in about 8,760 acres of redevelopable land. Using the same overall suburban development intensities applied to the vacant land, the redevelopable land has a population capacity of 25,300 and an employment capacity of 11,200. The population capacity increases to 58,200 and the employment capacity to 24,000 assuming enhanced development patterns. Page 2-12

14 The total population capacity for the vacant acreage (48,000) and redevelopment acreage (8,760), assuming a suburban development pattern, is approximately 164,500, which is still not enough to accommodate the projected population of 170,000. The total carrying capacity for employment, assuming a suburban development pattern, is 72,800, which is slightly more than the anticipated employment of 65,000. DEVELOPMENT POTENTIAL SUMMARY The analysis of vacant and redevelopable land indicates that if the suburban development trends continue and the growth rates forecast by the BEBR occur as expected, the area will build out within the next 25 years unless areas redevelop. Even with redevelopment, the study area will be very close to a built-out condition. A compact development pattern, as envisioned with the enhanced community Figure 2.2 elements, provides more Development Potential than adequate carrying capacity over the next 25 years. The analysis also indicated those areas in High the county where development can be Medium expected over the next Low 25 years (Figure 2.2). This information is used in the land use modeling described in Chapter 3. Page 2-13

15 Martin and St. Lucie Counties Regional Land Use Study US 1 MARKET ANALYSIS One important task of the regional land use study was to conduct a market feasibility assessment for selected properties within the US 1 corridor (Figure 2.3). The purpose of this analysis was to determine the feasibility of market-based policies to implement the recommended land use scenario. Market listings were obtained for the defined segment of US 1 in both counties and tracked throughout the course of the study. Items assessed included appraised value, market listings, and other factors. The results of this analysis are included in Appendix C. Figure 2.3 US 1 Market Analysis Study Area Page 2-14
POPULATION FORECASTS
 POPULATION FORECASTS Between 2015 and 2045, the total population is projected to increase by 373,125 residents to reach 2.2 million. Some areas will see major increases, while other areas will see very
2006 EVALUATION AND APPRAISAL REPORT
 1.3 EXTENT OF VACANT AND DEVELOPABLE LAND [163.3191(2)(b)] PURPOSE The intent of this section is to determine if there is enough land currently designated with urban/transitional land uses on the County
Urban Fringe Development Area Project Update And Staff Recommendation
 Urban Fringe Development Area Project Update And Staff Recommendation July 30, 2008 July 30, 2008 Urban Fringe Development Area Project Table of Contents Introduction, Background, and Next Steps 3 Constraints:
TASK 2 INITIAL REVIEW AND ANALYSIS U.S. 301/GALL BOULEVARD CORRIDOR FORM-BASED CODE
 TASK 2 INITIAL REVIEW AND ANALYSIS U.S. 301/GALL BOULEVARD CORRIDOR FORM-BASED CODE INTRODUCTION Using the framework established by the U.S. 301/Gall Boulevard Corridor Regulating Plan (Regulating Plan),
TOWN OF PELHAM, NEW HAMPSHIRE
 TOWN OF PELHAM, NEW HAMPSHIRE BUILDOUT ANALYSIS Prepared for the PELHAM CONSERVATION COMMISSION with the assistance of the NASHUA REGIONAL PLANNING COMMISSION TABLE OF CONTENTS I. INTRODUCTION...1 II.
Dr af t Sant a Bar b ar a Count y Housing Elem ent
 6. LAND INVENTORY AND QUANTIFIED OBJECTIVE I n t r o d u c t i o n This chapter includes two important components of the Housing Element: (1) the land inventory and analysis, and (2) the quantified objective
Town of. River Falls. Land Use Element Vierbicher Associates, Inc
 Town of River Falls 2005 Vierbicher Associates, Inc Contents Contents s. 66.1001(2)(h) Wis. Stats................................................. ii Introduction................................................................
8Land Use. The Land Use Plan consists of the following elements:
 8Land Use 1. Introduction The Land Use Plan consists of the following elements: 1. Introduction 2. Existing Conditions 3. Opportunities for Redevelopment 4. Land Use Projections 5. Future Land Use Policies
TOWN OF BROOKLINE, NEW HAMPSHIRE
 TOWN OF BROOKLINE, NEW HAMPSHIRE BUILDOUT ANALYSIS DECEMBER, 2003 Prepared by the Nashua Regional Planning Commission TABLE OF CONTENTS Introduction... 1 I. Methodology... 1 A. PARCEL REVIEW... 1 B. DEVELOPMENT
Burlington Unincorporated Community Plan
 Burlington Unincorporated Community Plan June 30, 2010 Meeting Page 1 of 24 Table of Contents (Page numbers to be inserted) I. Background a. Location and Community Description b. Planning of Unincorporated
Future Land Use Allocation Model (FLUAM) Methodology
 Methodology") Future Land Use Allocation Model (FLUAM) Methodology For: Lake/Sumter MPO By: Data Transfer Solutions (DTS) 3680 Avalon Park Blvd E, Suite 200 Orlando, FL 32828 Phone: 407-382 382-5222 Fax: 407-382 382-5420
Future Land Use Allocation Model (FLUAM) Methodology For: Lake/Sumter MPO By: Data Transfer Solutions (DTS) 3680 Avalon Park Blvd E, Suite 200 Orlando, FL 32828 Phone: 407-382 382-5222 Fax: 407-382 382-5420
What s Next for Commercial Real Estate Leveraging Technology and Local Analytics to Grow Your Commercial Real Estate Business
 What s Next for Commercial Real Estate Leveraging Technology and Local Analytics to Grow Your Commercial Real Estate Business - A PUBLICATION OF GROWTH MAPS- TABLE OF CONTENTS Intro 1 2 What Does Local
Housing Characteristics
 CHAPTER 7 HOUSING The housing component of the comprehensive plan is intended to provide an analysis of housing conditions and need. This component contains a discussion of McCall s 1990 housing inventory
Table of Contents. Appendix...22
 Table Contents 1. Background 3 1.1 Purpose.3 1.2 Data Sources 3 1.3 Data Aggregation...4 1.4 Principles Methodology.. 5 2. Existing Population, Dwelling Units and Employment 6 2.1 Population.6 2.1.1 Distribution
2018 RESIDENTIAL CAPACITY AND VACANT LAND ANALYSIS. Martin County Board of County Commissioners
 2018 RESIDENTIAL CAPACITY AND VACANT LAND ANALYSIS Martin County Board of County Commissioners Approved February 13, 2018 INTRODUCTION Objective 4.1D of the Martin County Comprehensive Growth Management
Comprehensive Plan /24/01
 IV The is a central component of the Comprehensive Plan. It is an extension of the general goals and policies of the community, as well as a reflection of previous development decisions and the physical
RESOLUTION NO ( R)
") RESOLUTION NO. 2013-06- 088 ( R) A RESOLUTION OF THE CITY COUNCIL OF THE CITY OF McKINNEY, TEXAS, APPROVING THE LAND USE ASSUMPTIONS FOR THE 2012-2013 ROADWAY IMPACT FEE UPDATE WHEREAS, per Texas Local
RESOLUTION NO. 2013-06- 088 ( R) A RESOLUTION OF THE CITY COUNCIL OF THE CITY OF McKINNEY, TEXAS, APPROVING THE LAND USE ASSUMPTIONS FOR THE 2012-2013 ROADWAY IMPACT FEE UPDATE WHEREAS, per Texas Local
Place Type Descriptions Vision 2037 Comprehensive Plan
 Place Type Descriptions Vision 2037 Comprehensive Plan The Vision 2037 Comprehensive Plan establishes a range of place types for Oxford, ranging from low intensity (limited development) Rural and Natural
2014 Plan of Conservation and Development
 The Town of Hebron Section 1 2014 Plan of Conservation and Development Community Profile Introduction (Final: 8/29/13) The Community Profile section of the Plan of Conservation and Development is intended
Chapter 5: Testing the Vision. Where is residential growth most likely to occur in the District? Chapter 5: Testing the Vision
 Chapter 5: Testing the Vision The East Anchorage Vision, and the subsequent strategies and actions set forth by the Plan are not merely conceptual. They are based on critical analyses that considered how
Town of North Topsail Beach
 Town of North Topsail Beach Build-Out and Non-Conforming Lot Study In Coordination with The Eastern Carolina Council of Governments February 2010 Introduction The Town of North Topsail Beach has conducted
2014 Plan of Conservation and Development. Development Plan & Policies
 The Town of Hebron Section 3 2014 Plan of Conservation and Development Development Plan & Policies C. Residential Districts I. Residential Land Analysis This section of the plan uses the land use and vacant
A. Land Use Relationships
 Chapter 9 Land Use Plan A. Land Use Relationships Development patterns in Colleyville have evolved from basic agricultural and residential land uses, predominate during the early stages of Colleyville
Procedures For Collecting and Monitoring Data
 DRAFT Kitsap County Buildable Lands Program Procedures For Collecting and Monitoring Data Page 1 12/1/05 Introduction This procedures report is intended to provide guidelines for Kitsap County and its
CHAPTER 4. MANAGER Single-Family Multi-Family Total. CHAPTER 4: AREA OF IMPACT AND BUILDOUT ANALYSIS Housing Needs Analysis
 The Area of Impact, the areas that Blueprint Boise identifies as potential annexation areas, have come up in several conversations with city officials in the context of the housing analysis. The Area of
Build-Out Analysis. Methodology
 Build-Out Analysis Methodology PRINCE WILLIAM COUNTY PLANNING OFFICE 5 County Complex Court Prince William, Virginia 22192-9201 (703) 792-7615 www.pwcgov.org/planning Christopher M. Price, AICP Director
CITY OF MEDFORD COMPREHENSIVE PLAN BUILDABLE LAND INVENTORY
 CITY OF MEDFORD COMPREHENSIVE PLAN PREPARED BY CITY OF MEDFORD PLANNING DEPARTMENT 200 SOUTH IVY STREET MEDFORD, OREGON 97501 BIANCA PETROU, A.I.C.P., ACTING PLANNING DIRECTOR LONG RANGE PLANNING SECTION
Existing Land Use. Typical densities for single-family detached residential development in Cumberland County: 1
 Existing Land Use A description of existing land use in Cumberland County is fundamental to understanding the character of the County and its development related issues. Economic factors, development trends,
Analysis of Infill Development Potential Under the Green Line TOD Ordinance
 Analysis of Infill Development Potential Under the Green Line TOD Ordinance Prepared for the Los Angeles County Second Supervisorial District Office and the Department of Regional Planning Solimar Research
4.13 Population and Housing
 Environmental Impact Analysis Population and Housing 4.13 Population and Housing 4.13.1 Setting This section evaluates the impacts to the regional housing supply and population growth associated with implementation
Gold Beach Buildable Lands Analysis
 Gold Beach Buildable Lands Analysis Final Report Submitted to: City of Gold Beach Prepared by: Community Planning Workshop Community Service Center 1209 University of Oregon Eugene, OR 97403-1209 http://darkwing.uoregon.edu/~cpw
City of Bellingham Urban Growth Area - Land Supply Analysis Summary
 City of Bellingham Urban Growth Area - Land Supply Analysis Summary Population & Employment Growth Forecasts APPENDIX D, ATTACHMENT 3 The ECONorthwest Whatcom County Population & Economic Forecasts report
Land Capacity Analysis
 Land Capacity Analysis City of Minneapolis Land Capacity Analysis June 2010 Submitted to: City of Minneapolis Community Planning & Economic Development Community Attributes tells data-rich stories about
CHAPTER 2: HOUSING. 2.1 Introduction. 2.2 Existing Housing Characteristics
 CHAPTER 2: HOUSING 2.1 Introduction Housing Characteristics are related to the social and economic conditions of a community s residents and are an important element of a comprehensive plan. Information
Table of Contents. Title Page # Title Page # List of Tables ii 6.7 Rental Market - Townhome and Apart ment Rents
 RESIDENTIAL MONITORING REPORT 2013 Table of Contents Title Page # Title Page # List of Tables ii 6.7 Rental Market - Townhome and Apart ment Rents 21 List of Figures iii 7.0 Other Housing Demands and Trends
Kitsap County Department of Community Development
 Kitsap County Department of Community Development Staff Report and Recommendation Annual Comprehensive Plan Amendment Process for 2018 George s Corner LAMIRD Boundary Adjustment Report Date 7/16/2018 Hearing
MONTGOMERY COUNTY RENTAL HOUSING STUDY. NEIGHBORHOOD ASSESSMENT June 2016
 MONTGOMERY COUNTY RENTAL HOUSING STUDY NEIGHBORHOOD ASSESSMENT June 2016 AGENDA Model Neighborhood Presentation Neighborhood Discussion Timeline Discussion Next Steps 2 WORK COMPLETED Socioeconomic Analysis
PEACHTREE INDUSTRIAL BOULEVARD small area study
 PEACHTREE INDUSTRIAL BOULEVARD small area study EXECUTIVE SUMMARY: MARKET RESEARCH FINDINGS DUNWOODY CITY COUNCIL RETREAT JUNE 4, 2018 STUDY SCOPE AND GOALS Bleakly Advisory Group (BAG) was retained to
Buildable Lands Analysis within the Overall UGB Expansion Process
 CHAPTER 3. BUILDABLE LANDS ANALYSIS The buildable lands inventory is intended to identify lands that are available for development within the UGB. The inventory is sometimes characterized as supply of
METROPOLITAN COUNCIL S FORECASTS METHODOLOGY
 METROPOLITAN COUNCIL S FORECASTS METHODOLOGY FEBRUARY 28, 2014 Metropolitan Council s Forecasts Methodology Long-range forecasts at Metropolitan Council are updated at least once per decade. Population,
Implementation Guidance for The Sustainable Growth and Agricultural Preservation Act of 2012 Senate Bill 236
 Implementation Guidance for The Sustainable Growth and Agricultural Preservation Act of 2012 Senate Bill 236 May 22, 2012 Version 1.0 Table of Contents 1. Executive Summary... 1 1.1 Bill Highlights...
Build-out Analysis. City of Cape Coral CITY OF CAPE CORAL Department of Community Development
 Build-out Analysis City of Cape Coral 2011 CITY OF CAPE CORAL Department of Community Development Division of Planning and Growth Management Cape Coral, Florida Derek C.S. Burr, AICP, MS, MPA, Division
STAFF REPORT. Permit Number: Porter. Kitsap County Board of Commissioners; Kitsap County Planning Commission
 STAFF REPORT Permit Number: 15 00461 Porter DATE: November 9, 2015 TO: FROM: Kitsap County Board of Commissioners; Kitsap County Planning Commission Katrina Knutson, AICP, Senior Planner, DCD and Jeff
Pueblo Regional Development Plan, Addendum
 Pueblo Regional Development Plan, Addendum August 2014 Table of Contents Factual Foundation.1 Land Demand Analysis....1 Population Trends 2 Housing Trends..3 Employment Trends 4 Future Land Demand Summary.5
L. LAND USE. Page L-1
 L. LAND USE 1. Purpose This section discusses current and likely future land use patterns in Orland. An understanding of land use trends is very important in determining Orland's ability to absorb future
Residential Capacity Estimate
 Residential Capacity Estimate Montgomery County Department of Park & Planning Research & Technology Center January 2005 Current plans allow 75,000 more housing units. by Matthew Greene, Research Planner
BUILD-OUT ANALYSIS GRANTHAM, NEW HAMPSHIRE
 BUILD-OUT ANALYSIS GRANTHAM, NEW HAMPSHIRE A Determination of the Maximum Amount of Future Residential Development Possible Under Current Land Use Regulations Prepared for the Town of Grantham by Upper
Hennepin County Economic Analysis Executive Summary
 Hennepin County Economic Analysis Executive Summary Embrace Open Space commissioned an economic study of home values in Hennepin County to quantify the financial impact of proximity to open spaces on the
METROPOLITAN COUNCIL S FORECASTS METHODOLOGY JUNE 14, 2017
 METROPOLITAN COUNCIL S FORECASTS METHODOLOGY JUNE 14, 2017 Metropolitan Council s Forecasts Methodology Long-range forecasts at Metropolitan Council are updated at least once per decade. Population, households
City of Creswell DRAFT Residential Buildable Lands Inventory
 City of Creswell DRAFT Residential Buildable Lands Inventory REVISED DRAFT - AUGUST 2007 Creswell Residential Buildable Land Inventory Page 1 Creswell Residential Buildable Land Inventory Page 2 Table
Land Use. Land Use Categories. Chart 5.1. Nepeuskun Existing Land Use Inventory. Overview
 Land Use State Comprehensive Planning Requirements for this Chapter A compilation of objectives, policies, goals, maps and programs to guide the future development and redevelopment of public and private
3. FISCAL IMPACT ANALYSIS FISCAL IMPACT ANALYSIS 29
 3. FISCAL IMPACT ANALYSIS FISCAL IMPACT ANALYSIS 29 The purpose of fiscal impact analysis is to estimate the impact of a development or a land use change on the budgets of governmental units serving the
Land Use Survey Summer 2014
 Land Use Survey Summer 2014 North Ogden City, Utah Robert Scott, City Planner Travis Lund, Planning Intern Contents General Information... 1 Land Use Groups... 1 Urbanized Land Uses... 1 Residential...
Recommendations for COD Standards. Robert J. Gloudemans Almy, Gloudemans, Jacobs & Denne. for. New York State Office of Real Property Services
 Recommendations for COD Standards Robert J. Gloudemans Almy, Gloudemans, Jacobs & Denne for New York State Office of Real Property Services March 12, 2009 Recommendations for COD Standards Robert J. Gloudemans
PORTLAND PLAN. Household and Employment Forecasts and Development Capacity
 PORTLAND PLAN Household and Employment Forecasts and Development Capacity Managing Change In recent decades, the Portland Metropolitan region and the City of Portland experienced a steady increase in population.
Shaping Our Future. Return-on-Investment Study. June 2017
 Shaping Our Future Return-on-Investment Study A June 2017 PURPOSE AND CONTEXT The 10-county Upstate Region is growing, and is projected to welcome more than 300,000 new residents by 2040 to reach a total
Portland Streetcar Development Impacts
 Portland Streetcar Development Impacts Review Draft Prepared for: Portland Streetcar Inc. October 2005 Prepared by: E.D. Hovee & Company, LLC P.O. Box 225 2408 Main Street Vancouver, Washington 98666 (360)
Housing & Residential Intensification Study Discussion Paper Township of King
 Housing & Residential Intensification Study Discussion Paper Prepared by Planning Department January 2011 1.0 Background 1.1 Provincial Policies (Greenbelt and Growth Plan) Since 2001, the Province of
PURPOSE OF STUDY. physical and social environments, as well as our political and economic institutions. As a commodity,
 PURPOSE OF STUDY Housing is one of the most important elements in our lives and our communities. Providing shelter and links to neighborhoods and larger communities, housing plays an essential part in
2.2 Future Demand Projection Methodology
 SECTION 2 Water Demands Water demands were developed for existing and future conditions based on parcel-level land use information and water meter billing data. CH2M HILL worked extensively with Town of
INDIAN RIVER COUNTY, FLORIDA. The Honorable Members of the Planning and Zoning Commission DEPARTMENT HEAD CONCURRENCE
 Public Hearing Legislative INDIAN RIVER COUNTY, FLORIDA M E M O R A N D U M TO: The Honorable Members of the Planning and Zoning Commission DEPARTMENT HEAD CONCURRENCE Robert M. Keating, AICP; Community
STAFF REPORT. Permit Number: Unlimited. Kitsap County Board of Commissioners; Kitsap County Planning Commission
 STAFF REPORT Permit Number: 15 00550 Unlimited DATE: March 2, 2016 TO: FROM: Kitsap County Board of Commissioners; Kitsap County Planning Commission Katrina Knutson, AICP, Senior Planner, DCD and Jeff
Community Revitalization Efforts 2016 Thresholds and Scoring Criteria
 s 2016 Thresholds and Scoring Criteria Definitions: a deliberate, concerted, and locally approved plan or documented interconnected series of local approvals and events intended to improve and enhance
CHAPTER Committee Substitute for Committee Substitute for Senate Bill No. 2188
 CHAPTER 2004-372 Committee Substitute for Committee Substitute for Senate Bill No. 2188 An act relating to land development; amending s. 197.502, F.S.; providing for the issuance of an escheatment tax
Appendix A: Guide to Zoning Categories Prince George's County, Maryland
 Appendix A: Guide to Zoning Categories Prince George's County, Maryland RESIDENTIAL ZONES 1 Updated November 2010 R-O-S: Reserved Open Space - Provides for permanent maintenance of certain areas of land
2016 Census Bulletin Changing Composition of the Housing Stock
 Metro Vancouver s Role Every five years, the Census of Canada provides benchmark data that is instrumental in analyzing and evaluating local government planning policies and services. Representing member
PROPERTY TAX IS A PRINCIPAL REVENUE SOURCE
 TAXABLE PROPERTY VALUES: EXPLORING THE FEASIBILITY OF DATA COLLECTION METHODS Brian Zamperini, Jennifer Charles, and Peter Schilling U.S. Census Bureau* INTRODUCTION PROPERTY TAX IS A PRINCIPAL REVENUE
Student Generation Rate and School Impact Fee Study Update
 Student Generation Rate and School Impact Fee Study Update DRAFT REPORT October 3, 2017 Prepared for: 600 SE 3 rd Avenue Ft. Lauderdale, FL 33301 ph (754) 321-0000 Prepared by: 1000 N. Ashley Dr., #400
Details of the Revised Business Improvement District Regulations
 Details of the Revised Business Improvement District Regulations Businesses located within the boundary of the Downtown Overland Park Business Improvement District (BID) pay an annual BID fee. A volunteer
TREASURE COAST REGIONAL PLANNING COUNCIL M E M O R A N D U M. To: Council Members AGENDA ITEM 10A
 TREASURE COAST REGIONAL PLANNING COUNCIL M E M O R A N D U M To: Council Members AGENDA ITEM 10A From: Date: Subject: Staff April 20, 2007 Council Meeting Local Government Comprehensive Plan Review Draft
Final. Chapter Four: Land Use
 Chapter Four: Land Use Purpose and Intent Goals and Policies Existing Land Use Patterns AICUZ Airport Overlay Zone Zoning Existing Land Use Land Use Designations Land Use Demand and Forecast Existing Population
Detroit Neighborhood Housing Markets
 Detroit Neighborhood Housing Markets Market Study 2016 In 2016, Capital Impact s Detroit Program worked with local and national experts to determine the residential market demand across income levels for
1. Future Land Use FLU6.6.8 Land uses within the Rural Service Area portion of the Wekiva Study Area shall be limited to very low and low intensity
 1. Future Land Use FLU6.6.8 Land uses within the Rural Service Area portion of the Wekiva Study Area shall be limited to very low and low intensity uses to the greatest extent possible. Existing land uses
City Center Market-Rate Housing Study
 City Center Market-Rate Housing Study OVERVIEW The City of Bellingham, with the assistance of students from Western Washington University, conducted a study of market-rate rental housing during April and
TOWN OF HOLLIS, NEW HAMPSHIRE
 TOWN OF HOLLIS, NEW HAMPSHIRE BUILDOUT ANALYSIS NOVEMBER 20, 2001 Prepared by the NASHUA REGIONAL PLANNING COMMISSION TABLE OF CONTENTS I. INTRODUCTION...1 II. GOAL OF THE BUILDOUT ANALYSIS...1 III. METHODOLOGY...1
Land Use. Existing Land Use
 8 Land Use 8.1 Land Use Chapter Purpose and Contents This element includes a brief summary of existing land use conditions and trends followed by a series of goals, objectives, and recommendations to guide
Rule 80. Preservation of Primary Agricultural Soils Revised and approved by the Land Use Panel during its public meeting on January 31, 2006.
 Rule 80. Preservation of Primary Agricultural Soils Revised and approved by the Land Use Panel during its public meeting on January 31, 2006. (A) Purpose. In accordance with 10 V.S.A. Sections 6025(b)
CITRUS COUNTY COMPREHENSIVE PLAN
 CITRUS COUNTY COMPREHENSIVE PLAN APPENDIX F METHODOLOGIES USED IN THE FUTURE LAND USE ELEMENT REFERENCED IN CHAPTER 10 FUTURE LAND USE Updated: December 2, 1997, Ord. No. 1997-A29 This page left intentionally
LAND USE Inventory and Analysis
 LAND USE Inventory and Analysis The land use section is one of the most important components of the comprehensive plan as it identifies the location and amount of land available and suitable for particular
Cover Letter with Narrative Statement
 Cover Letter with Narrative Statement March 31, 2017 rev July 27, 2017 RE: Rushton Pointe Residential Planned Unit Development Application for Public Hearing for RPUD Rezone PL2015 000 0306 Mr. Eric Johnson,
Implementation Guidance. for. The Sustainable Growth and Agricultural Preservation Act of Senate Bill 236
 Implementation Guidance for The Sustainable Growth and Agricultural Preservation Act of 2012 Senate Bill 236 August 1, 2012 Version 2.0 Table of Contents 1. Executive Summary... 1 1.1 Bill Highlights...
Chapter 12 Changes Since This is just a brief and cursory comparison. More analysis will be done at a later date.
 Chapter 12 Changes Since 1986 This approach to Fiscal Analysis was first done in 1986 for the City of Anoka. It was the first of its kind and was recognized by the National Science Foundation (NSF). Geographic
Census Tract Data Analysis
 Data Analysis Study Area: s within the City of Evansville, Indiana Prepared For Mr. Kelley Coures City of Evansville Department of Metropolitan Development 1 NW MLK Jr. Boulevard Evansville, Indiana 47708
VACANT URBAN RESIDENTIAL LAND SURVEY 2010 UPDATE
 1. INTRODUCTION VACANT URBAN RESIDENTIAL LAND SURVEY 2010 UPDATE The Vacant Urban Residential Land Survey (VURLS) has, since 1982, monitored the supply of vacant land in Ottawa s urban area to assess whether
City of Lonsdale Section Table of Contents
 City of Lonsdale City of Lonsdale Section Table of Contents Page Introduction Demographic Data Overview Population Estimates and Trends Population Projections Population by Age Household Estimates and
Return on Investment Model
 THOMAS JEFFERSON PLANNING DISTRICT COMMISSION Return on Investment Model Last Updated 7/11/2013 The Thomas Jefferson Planning District Commission developed a Return on Investment model that calculates
STAFF REPORT. Permit Number: Lee. Kitsap County Board of Commissioners; Kitsap County Planning Commission
 STAFF REPORT Permit Number: 15 00689 Lee DATE: March 2, 2016 TO: FROM: Kitsap County Board of Commissioners; Kitsap County Planning Commission Katrina Knutson, AICP, Senior Planner, DCD and Jeff Arango,
Assessment-To-Sales Ratio Study for Division III Equalization Funding: 1999 Project Summary. State of Delaware Office of the Budget
 Assessment-To-Sales Ratio Study for Division III Equalization Funding: 1999 Project Summary prepared for the State of Delaware Office of the Budget by Edward C. Ratledge Center for Applied Demography and
Understanding the Cost to Provide Community Services in the Town of Holland, La Crosse County, Wisconsin
 Understanding the Cost to Provide Community Services in the Town of Holland, La Crosse County, Wisconsin Rebecca Roberts Land Use Specialist Center for Land Use Education and Karl Green Community Development
ANNUAL LOCAL GOVERNMENT REVENUE ANALYSIS OF THE 13 th FLOOR INVESTMENTS RESIDENTIAL DEVELOPMENT IN TAMARAC, FLORIDA
 ANNUAL LOCAL GOVERNMENT REVENUE ANALYSIS OF THE 13 th FLOOR INVESTMENTS RESIDENTIAL DEVELOPMENT IN TAMARAC, FLORIDA Wednesday, January 9, 2019 Report Commission 13th Floor Investments commissioned this
Generic Environmental Impact Statement. Build-Out Analysis. City of Buffalo, New York. Prepared by:
 Generic Environmental Impact Statement Build-Out Analysis City of Buffalo, New York 2015 Prepared by: TABLE OF CONTENTS 1.0 INTRODUCTION 1 2.0 METHODOLOGY 2 3.0 EXISTING LAND USE 3 4.0 EXISTING ZONING
4. Parks and Recreation Fee Facility Needs and Cost Estimates Fee Calculation Nexus Findings 24
 TABLE OF CONTENTS CHAPTER PAGE 1. Introduction and Summary of Calculated Fees 1 1.1 Background and Study Objectives 1 1.2 Organization of the Report 2 1.3 Calculated Development Impact Fees 2 2. Fee Methodology
Report (Vacant Land - Growth Analysis)
") Report (Vacant Land - Growth Analysis) July 2011 Prepared For: e Corporation of the Municipality of Red Lake h Street Balmertown, Ontario P0V 1CO Report (Vacant Land - Growth Analysis) July 2011 Prepared
Report (Vacant Land - Growth Analysis) July 2011 Prepared For: e Corporation of the Municipality of Red Lake h Street Balmertown, Ontario P0V 1CO Report (Vacant Land - Growth Analysis) July 2011 Prepared
Zoning Analysis. 2.0 Residential Use. 1.0 Introduction
 Zoning Analysis 1.0 Introduction For zoning to be an effective community development tool, it must recognize the unique land use characteristics of the various portions of the community. The Lawrence Zoning
Introduction to INRMP Implementation Options
 El Dorado County Integrated Natural Resources Management Plan Introduction to INRMP Implementation Options 1 Our approach to the options evaluation is based on the INRMP components as they are currently
ARLINGTON COUNTY, VIRGINIA. County Board Agenda Item Meeting of June 17, 2017
 ARLINGTON COUNTY, VIRGINIA County Board Agenda Item Meeting of June 17, 2017 DATE: June 9, 2017 SUBJECT: Request to authorize advertisement of public hearings by the Planning Commission and County Board
A project of Neighborhood Projects for Community Revitalization At the Center for Urban and Regional Affairs (CURA) University of Minnesota
 University of Minnesota") Affordable Housing Siting Opportunities in Minneapolis October 2008 Rachel C. Robinson, Author With assistance from Joel Larson A project of Neighborhood Projects for Community Revitalization At the Center
Affordable Housing Siting Opportunities in Minneapolis October 2008 Rachel C. Robinson, Author With assistance from Joel Larson A project of Neighborhood Projects for Community Revitalization At the Center
Following is an example of an income and expense benchmark worksheet:
 After analyzing income and expense information and establishing typical rents and expenses, apply benchmarks and base standards to the reappraisal area. Following is an example of an income and expense
Central Corridor Forecasting Methodology
 Central Corridor Forecasting Methodology Overview: Demographics will be developed for a base year, 2010, and two forecast years, 2020 and 2030. A straight line interpolation of the adopted CAMPO 2035 Plan
5. PROPERTY VALUES. In this section, we focus on the economic impact that AMDimpaired
 5. PROPERTY VALUES In this section, we focus on the economic impact that AMDimpaired streams have on residential property prices. AMD lends itself particularly well to property value analysis because its