Santa Barbara Ranch Transferable Development Rights (TDR) Feasibility Analysis
|
|
|
- Randolph Claude Haynes
- 5 years ago
- Views:
Transcription
1 ATTACHMENT B
2 Santa Barbara Ranch Transferable Development Rights (TDR) Feasibility Analysis 3/8/2006 Authors: Bill Fulton Darren Greve Susan Weaver 973 EAST MAIN STREET VENTURA, CALIFORNIA PHONE: 805/ FAX: WEB:
3 Table of Contents PREFACE...II EXECUTIVE SUMMARY... 1 VOLUME 1: BACKGROUND ON TDR PROGRAMS OVERVIEW PROJECT BACKGROUND AND STUDY SCOPE STUDY STRUCTURE TRANSFERABLE DEVELOPMENT RIGHTS: WHAT THEY ARE AND HOW THEY WORK TDR AS A MARKET-BASED MECHANISM Figure 2.1 Conceptual TDR Diagram WHO BENEFITS AND WHO BEARS THE COST? POLICY GOALS PURSUED THROUGH TDR MECHANISMS ADVANTAGES AND DRAWBACKS OF TDR PROGRAMS Advantages of A TDR Program Drawbacks of a TDR Program KEY COMPONENTS OF SUCCESSFUL TDR PROGRAMS Clear TDR Program Goals Inter-jurisdictional Cooperation and TDR Service Area Size Suitable Receiving & Sending Areas Adequate Incentives for Sending- and Receiving-Area Landowners Figure 2.5 Conceptual Transfer Ratio Diagram Using Banks and Other Market-Making Mechanisms TDR PROGRAMS IN SIMILAR COMMUNITIES OXNARD PACIFICA MALIBU PISMO BEACH, CALIFORNIA SAN LUIS OBISPO COUNTY PALM BEACH COUNTY, FLORIDA BOULDER COUNTY, COLORADO KING COUNTY, WASHINGTON DADE COUNTY, FLORIDA ISLAND COUNTY, WASHINGTON VOLUME II: TDR FEASIBILITY ANALYSIS FOR SANTA BARBARA RANCH CRITICAL ISSUES RAISED BY A TDR PROGRAM FOR SANTA BARBARA RANCH TDR PROGRAM GOALS FOR SANTA BARBARA RANCH PROSPECTS FOR INTER-JURISDICTIONAL COOPERATION RANGE OF SUITABLE RECEIVING AREAS ADEQUATE INCENTIVES FOR SANTA BARBARA RANCH LANDOWNER(S) AND RECEIVING AREA DEVELOPERS USE OF A BANK OR OTHER MARKET-MAKING MECHANISM ANALYSIS OF RECEIVING SITES Figure 5.1 Receiving Site Screening Diagram ECONOMIC FEASIBILITY POLITICAL FEASIBILITY... 45
4 5.3 PRELIMINARY LIST OF POTENTIAL RECEIVING SITES PRIMARY SCREENING Table Sites Passing 1st Screen SECOND SCREENING OF RECEIVING SITES : WILLINGNESS TO PAY FOR TDRS Table Receiving Site WTP Summary Results DISCUSSION OF REALISTIC ASSUMPTIONS AND LIKELY RECEIVING SITE SCENARIOS Receiving Site Analysis Conclusion VALUATION OF SANTA BARBARA RANCH DEVELOPMENT RIGHTS Table 6.1 ALT 1 Range of Lot Values Table 6.2 MOU Range of Lot Values Table 6.3 ALT 1 Development Right Values Table 6.4 MOU Development Right Values ASSESSMENT OF TDR TRANSFER MECHANISMS AND VIABILITY OF A TDR BANK UP-FRONT TRANSACTIONS/TDR BANK V. A TRADITIONAL TDR MARKET APPROACH TO TRANSFER RATIOS CAPITALIZATION OF TDR BANK DEVELOPMENT TRANSFER SCENARIOS Table 7.4 Example Transfer Scenarios (ALT 1) CONCLUSION VOLUME III: APPENDICES APPENDIX A: RECEIVING SITE MAPS Map A : Unincorporated Urban South Coast Map B : City of Santa Barbara Map C : Montecito & Summerland Map D : City of Goleta Map E : Unincorporated Rural Gaviota Coast Map F : City of Carpinteria Map G : Santa Ynez Map H : Orcutt Map I : Santa Maria APPENDIX B: PRELIMINARY RECEIVING SITE IDENTIFICATION APPENDIX C: PRIMARY RECEIVING SITE SCREENING APPENDIX D: SECONDARY RECEIVING SITE SCREENING WILLINGNESS TO PAY FOR TDRS Urban Unincorporated Santa Barbara County WTP Calculations on Optimal Receiving Sites City of Santa Barbara WTP Calculations on Optimal Receiving Sites APPENDIX E: MOU & ALT 1 DEVELOPMENT RIGHT VALUATION ii

5 Preface The Naples Townsite encompasses an 800-acre area on the Gaviota Coast, located two miles west of the City of Goleta (Figure 1.1). Existing land use and zoning designations for this particular area consist primarily of commercial agriculture, with a minimum lot size of 100 acres. In contrast, the 1995 Official Map of Naples recognizes 274 legal lots within 806 acres (Figure 1.2). Therefore, existing agricultural land use designations and implementing zoning ordinances do not accommodate residential development of lots already present at the Townsite. Figure 1.1 Naples Overview Map Naples Townsite On December 3, 2002, the County of Santa Barbara and two of the four principal owners of Naples (the Morehart and Santa Barbara Ranch related interests), together representing 80% of the Official Map lots, entered into a Memorandum of Understanding ( MOU ). The MOU sets forth a protocol for processing land use applications to globally resolve development and conservation issues arising from conflict between the density of legal parcels within the Townsite and the rural, agricultural purpose and intent of the current underlying zone district and land use designation. In particular, the parties to the MOU sought to implement LCP policy 2-13 which provides: The existing townsite of Naples is within a designated rural area and is remote from urban services. The County shall discourage residential development of existing lots. The County shall encourage and assist the property owner(s) in transferring development rights from the Naples townsite to an appropriate site within a designated urban area which is suitable for residential development. If the County determines that ii

6 transferring development rights is not feasible, the land use designation of AG-II-100 should be re-evaluated. Figure 1.2 Official Santa Barbara County Naples Townsite Map The MOU provides a protocol for the County to entertain applications for development and conservation at Naples. Pursuant to the MOU, two alternative development proposals have been presented by the landowners for consideration. These alternatives are collectively referred to as the Santa Barbara Ranch Project and are individually referred as the MOU Project and the Alternative 1 ( ALT 1 ) Project: o MOU Project. The MOU Project consists of a large lot residential development and associated land use changes on Santa Barbara Ranch ( SBR ) totaling 485 acres and encompassing 80% of the lots comprising the Official Map of Naples. The MOU Project would result in 54 new rural estate residences and includes an equestrian center, agricultural support facilities, a worker duplex, public amenities (including access road, parking and restroom, hiking, biking, equestrian trails near the coastal bluff, an educational kiosk and a coastal access stair structure), and creation of conservation easements permanently protecting 137 acres for agricultural uses and 188 acres for open space. o ALT 1 Project. The ALT 1 Project, proposed for review by the landowners at a project-level of detail for purposes of evaluating alternatives under the California Environmental Quality Act ( CEQA ). As proposed the ALT 1 Project comprises the 485-acre SBR plus the adjacent 2,769-acre Dos Pueblos Ranch ii
7 ( DPR ) property, together encompassing 86% of the lots comprising the Official Map of Naples The ALT 1 Project would include development of 72 new rural estate residences, one employee duplex, one agricultural support facility, public amenities (including access road, parking and restroom, hiking, biking, equestrian trails near the coastal bluff, an educational kiosk and a coastal access stair structure), and creation of conservation easements permanently protecting 2,629 acres for agricultural uses and 372 acres for open space. Figure 1.3 Santa Barbara Ranch Project Overview iii

8 Figure 1.4 MOU Project Figure 1.5 ALT 1 Project ALT 1 Project iv
9 Transfer of Development Rights. CLUP Policy 2-13 requires that the County Board of Supervisors determine that the transfer of development rights at Naples is not feasible before changing the land use designation and zoning for the Naples Townsite. In compliance with this policy, the study which follows has been completed to assess TDR potential for both the MOU and ALT 1 Projects. v
10 Executive Summary Conclusion We conclude that it is potentially feasible, both economically and politically, to transfer some development from the Santa Barbara Ranch Project to selected receiver sites in unincorporated South Coast areas and in the City of Santa Barbara. As a threshold matter, feasibility depends upon the County and/or the City of Santa Barbara to up-zone candidate receiving sites to modest residential densities. If so, the amount of development transferred depends on what the County deems most important reducing the overall development intensity, preserving the public viewshed from Highway 101, or eliminating development from the coastal blufftops. If the County were to place highest priority on preserving Highway 101 views, then we believe it is feasibly to create a market-based Transferable Development Rights (TDR) program that would permit construction of about 4 additional housing units in selected receiver sites in unincorporated areas and in the City of Santa Barbara for every 1 view-impacting house that is removed from the Santa Barbara Ranch Project. Assuming County and City officials are likely to place affordable housing requirements on receiver sites - this conclusion of feasibility assumes an affordability component built into our estimation 1. Ultimately, TDR feasibility rests on the ability to raise enough money to execute the transfers up-front. We estimate that a minimum of $20 million is needed, but we believe this is not unrealistic given potential funding sources and the history of the Ellwood Mesa transaction 2. Under the assumption that raising $20 million maybe realistic, we show for example, that it is potentially feasible to transfer 16 of the most visible lots from Highway 101 in a manner that affirms the property rights of all the involved stakeholders. It must be stressed that unlike typical land conservation initiatives, the initial contributors of the $20 million can be repaid once the TDR program starts selling density credits. Alternatively, the money could be used as a revolving fund for continued preservation in the area. Finally, we show that is feasible to transfer some, but not all, the development from the Santa Barbara Ranch Project. The feasibility scenarios we identify do not appear to reduce densities enough to permit development under current 1 The analysis uses 15% and 30% affordable workforce unit count criteria on the candidate receiving sites. These are targeted to a 4 person HH with 121%-200% of Area Median Income of $64, As recent as 2003 the Trust for Public Land raised $19.7 million for the successful preservation of Ellwood Mesa. TPL paid Comstock Homes to relocate the proposed development of 130 homes to a 12 acre site with 62 units further inland resulting in the permanent preservation of the Ellwood Mesa. 1
11 agricultural zoning, apparently justifying a new land use and zoning designation as indicated under policy 2-13 of the County s Local Coastal Plan. Transferable Development Rights and Components of Success Simply put, a transferable development rights (TDR) program creates a market for willing buyers and sellers of development rights. The mechanism allows landowners to voluntarily sever the right of development associated with land ownership from the land itself and converts it into a marketable commodity. Willing buyers of the development rights are granted incremental density increases on designated receiving sites. The success of the TDR program hinges on stimulating developers to purchase development rights as a means of obtaining increased density. Figure ES 1 Drawing on the experience of more than 140 TDR programs nationwide, the literature suggests most successful programs share many components in common. A TDR program should be considered only in a region possessing a strong demand for density with an active real estate market (i.e., where land is at a premium and developers desire to build at greater densities). Furthermore, communities interested in implementing a TDR program must be willing to face the trade-offs of greater density in the receiving areas in exchange for greater preservation in the sending areas. They should not be devised with the hope of reducing overall development Research indicates the five components of utmost importance to a TDR program s success are: 1. Clear program goal(s) 2
12 2. Inter jurisdictional cooperation 3. Suitable receiving and sending sites 4. Suitable Incentives for receiving site developers and sending area landowners 5. Use of Banks and Other Market-Making Mechanisms We analyzed the potential for a TDR program involving both the Santa Barbara Ranch MOU proposal (54 units) and ALT 1 (72 units) pursuant to the County s Local Coastal Plan Policy 2-13, which requires the County to examine the possibility of transferring development off of Naples Townsite before approving development there. We concluded that the main program goal under Policy 2-13 appears to be moving urban development from the Santa Barbara Ranch Project to a location inside the existing urban boundary line. This analysis examines several options. First, we examine the feasibility of transferring the maximum number of building envelopes off the site, no matter where on the site they are located. Secondly, we examine the feasibility of transferring only those building envelopes within the public viewshed of Highway 101. Thirdly, we examine the feasibility of eliminating lots from the coastal bluff. We conclude that if some, but not all, the development can be transferred, the main program goal would appear to be transfers of the development envelopes that are the most visible from Highway 101. TDR Feasibility We conducted an extensive screening based on both political and economic factors to judge the feasibility of transferring development from the Santa Barbara Ranch Project to an urban location. In so doing, we : A. Identified candidate receiver areas using a three step screening process. B. Calculated receiving-area developers willingness to pay for TDRs that would provide them with increased densities. C. Calculated the value of the development rights on Santa Barbara Ranch Project if either the MOU project or ALT 1 is approved. D. Examined different options for how such a transfer program might work. E. Examined how a TDR Bank might be capitalized and what the outcome of the transfers might be. A. POTENTIAL RECEIVER AREAS 3
13 We scanned all urban areas in Santa Barbara County and compiled an initial list of almost 80 sites that could serve as potential receiving areas. Based on significant political criteria including proximity to the Santa Barbara Ranch Project and the receptiveness of both Santa Barbara County and other jurisdictions to rezoning land to serve as receiving areas, we came up with a final list of eight prospective receiving areas four in the unincorporated South Coast and four in the City of Santa Barbara. These are: Santa Barbara County 1. The County Campus - North (22 acres) 2. The St. Vincent s - West site (33 acres) 3. The Montecito Orchard site (30 acres) 4. The Montecito Area 3 site (21 acres) City of Santa Barbara 1. Wright property east of Garden Street (13 acres adjacent to funk zone ) 2. City-owned Cota/Santa Barbara Street parking lot (1.46 acres) 3. City-owned Haley/Anacapa Street parking lot (1.74 acres) 4. City-owned Redevelopment site at Cabrillo & Ceasar Chavez (2.3 acres) B. DEVELOPERS WILLINGNESS TO PAY Based on pro-forma calculations, we came to the conclusion that receiving-area developers would be willing to pay up to 25% of the market price of an additional housing unit for each unit of increased density. This figure declined somewhat when factoring in likely affordable/workforce housing requirements on the receiving sites. Based on these calculations and discussions with City and County officials, we show that a likely receiving area scenario would be: 1. An additional 100 units above current zoning on the County Campus North and St. Vincents sites combined (these are adjacent). The total developers willingness to pay for this additional density, once affordable housing requirements are factored in, is approximately $32.8 million. 2. An addition of 73 units at the Cota Street parking lot, with a total developer willingness to pay of $16.39 million; or an addition of 156 units on the Wright Property - East, with a total developer willingness to pay of $40.4 million. 4
14 Overall, we believe the maximum feasible land use scenario would be the addition of 256 units in two receiving areas, creating a developer willingness to pay of $73.2 million. Although this represents our estimate of the demand for development rights, the limiting factor affecting transfers from the Santa Barbara Ranch Project is ultimately determined by the money that could be raised to execute up-front development right purchases from the Santa Barbara Ranch Project. We explore this is E below. C. VALUE OF DEVELOPMENT RIGHTS IN SENDING AREA We also constructed a hedonic economic model to assess the likely market selling prices of the houses proposed in both the 54-unit MOU project and the 72-unit ALT 1project. We then sought to derive a development right value based on industry expected profits by removing construction costs, site preparation costs, land costs, and the array of other costs developers incur. Due to the uncertainty associated with the entitlement process we adjusted the value based on two assumptions - that the eventual project as approved will contain house sizes that are 70% of those contained in the proposal, and that the lots would not be entitled until at the soonest 2008 for Coastal Zone lots and 2007 for inland County lots. Based on this analysis, we concluded that the total value of the potential development rights 3 in the sending area is approximately $165,726,476 under the MOU project proposal and $198,941,801 under the ALT 1 proposal. However, the value of each individual lot created on Santa Barbara Ranch Project would vary greatly. The development rights of the nine bluff-top lots would be worth more than $8-14 million each and together would carry some 60% of the property s value. Some inland lands possess development right values worth less than $1 million. D. FEASIBLE METHODS OF CONSTRUCTING THE TRANSFER PROGRAM The typical TDR program unfolds over time that is, a voluntary program is created that allows sending-site landowners to sell development rights to receivingsite developers. Because of the unusual nature of the proposed project including the possibility that lot-buyers would not be motivated by economic incentives because of the amenity value of the property we believe that a typical program is 3 It must be stressed that the lots in the Santa Barbara Ranch Project have not yet been entitled. For the purposes of this study we assume entitlement of the lots for residential development in order to estimate development right values. 5
15 not feasible and therefore an up-front transaction involving a TDR Bank would be required to make even a partial transfer feasible. Under this scenario, a TDR Bank would be chartered, as either a government agency or a nonprofit, and given the power to buy development rights from Santa Barbara Ranch and sell density credits to developers in the receiving area. Because an up-front transaction would be required, the TDR Bank would have to be capitalized from public and/or private sources. The TDR Bank would use its capital to purchase development rights in bulk from Santa Barbara Ranch. The County and/or the City would then endow the Bank with density credits in the receiving areas, based on the willingness to pay calculations, that would total the capitalization amount. The TDR Bank would then be free to sell those density credits to developers in the receiving area for whatever price the market will bear at the time. E. CAPITALIZATION AND OPERATION OF TDR BANK We stated above that the total estimated value of the potential development rights on Santa Barbara Ranch ALT project is nearly $200 million, and the maximum feasible developers willingness to pay for density credits in the receiving areas is approximately $73 million. Hence, it will likely not be feasible for the TDR program to transfer all development However, it is possible for the TDR Bank to transfer a significant portion of the development if it is well capitalized. We believe a realistic goal is capitalization of $20 million. This is based on: 1. The fact that the Ellwood Bluffs transaction (a form of TDR) involved raising $19.7 million as recently as The fact that a similar TDR Bank in New Jersey was capitalized to $50 million. 3. Our belief that once the bank is established, it will attract capital not only from local government agencies such as the City and County of Santa Barbara but also state, national, and philanthropic sources identified in this report. However, once the bank is capitalized, policymakers will have to make a difficult decision about which lots on Santa Barbara Ranch to remove. We see three possible scenarios, all of which yield dramatically different results. 6
16 1. The Bank could choose to expend its capital to remove bluff-top lots. A capitalization of $20 million would hold the potential to remove a maximum of two such lots. 2. The Bank could choose to expend its capital to remove the maximum number of lots possible. A capitalization of $20 million would hold the potential to remove 29 of the 72 lots in the ALT 1, but the resulting pattern might be random, based on the fact that the Bank had bought the development rights for the cheapest lots. 3. The Bank could choose to expend its capital to remove the lots that are the most visible from Highway 101. Under the $20 million scenario, the Bank could remove 16 such lots north of the Highway. The Bank could sell the density credits into the receiving areas in different combinations, increasing density in any or all of the potential receiving areas described above. In addition, if the value of the density credits increases in value while the Bank is holding them, the Bank could create a revolving fund for land preservation on the Gaviota Coast, the prospect of which might enhance its chances at obtaining initial capital from land conservation sources. 7
17 Volume 1: Background on TDR Programs 8
18 1. Overview 1.1 Project Background and Study Scope The proposed Santa Barbara Ranch Project is an outgrowth of a Memorandum of Understanding (MOU) executed by the County and by the project applicant in 2002, as a step in resolving litigation that originated in the 1980s after adoption of the Local Coastal Program. An Official Map of the Naples Townsite recorded in October 1995 recognized 274 existing legal parcels (Preface Figure 1.1.2). Of these, 219 are within the boundaries of Santa Barbara Ranch. The proposal pursuant to the MOU consists of a large-lot residential development of 54 new rural residences and associated land use changes on 485 acres, including a major portion of an area known as the Naples Townsite (Figure 1.1.4). The applicant has also proposed an alternative project, which includes the Santa Barbara Ranch and the adjacent Dos Pueblos Ranch (2,760 acres), which is referenced as ALT 1. This project would develop a total of 72 new rural residences and associated improvements (Figure 1.1.5). The MOU and ALT 1 proposals are referred to collectively as the Santa Barbara Ranch Project. In either case, the development as proposed may not conform to current agricultural zoning and hence the County is considering the creation of a new zoning district, the Naples Planning District (NPD) for this area. When the Local Coastal Program was adopted by Santa Barbara County and approved by the California Coastal Commission, it included a policy Policy 2-13 calling on the county to discourage residential development in Naples and consider transferring development off the site. Policy 2-13 states: The existing townsite of Naples is within a designated rural area and is remote from urban services. The County shall discourage residential development of existing lots. The County shall encourage and assist the property owners in transferring development rights from the Naples site to an appropriate site within a designated urban area which is suitable for development. If the County determines the transferring development rights is not feasible, the land designation of Ag II 100 should be reevaluated. This study is designed to help the County assess whether it is feasible to comply with Policy 2-13 within the context of the LCP. In addition, this study will help to determine whether it is feasible to reduce densities to the level where the County can retain agricultural zoning and does not need to create the NPD zone. This analysis does not examine the feasibility of creating a TDR program for the 219 existing parcels. As the applicant has stated in application materials, the MOU 9
19 proposed consolidation of lots from 219 to 56 (235 consolidated to 77 for ALT 1) effectively extinguishes development rights on the other 165 parcels (162 for ALT 1). Rather, this analysis examines the feasibility of transferring the development rights contained in the 54 residential development envelopes called for in the applicant s proposal. We also examine the feasibility of transferring the development rights that would be created by the 72 rural estates proposed under ALT 1. ALT 1 would reconfigure the project compared to the original proposal, adding a net increase of 2 additional lots on Santa Barbara Ranch and 16 on the adjacent Dos Pueblos Ranch. This study does not examine the possibility of transferring development within the site or onto the adjacent Dos Pueblos Ranch property, as that is the purview of an Environmental, Impact Report that is currently under preparation for the Santa Barbara Ranch Project. However, the study does briefly examine the possibility of transferring development to other rural areas on the Gaviota Coast. Such a transfer would extend beyond the literal reach of Policy 2-13, but briefly examining the possibility gives the County the benefit of a full range of options. Furthermore, this study examines not only the feasibility of transferring all remaining development rights but also the feasibility of transferring some of the remaining development rights. This analysis examines several options. First, we examine the feasibility of transferring the maximum number of building envelopes off the site, no matter where on the site they are located. Secondly, we examine the feasibility of transferring only those building envelopes within the public viewshed of Highway 101. Thirdly, we examine the feasibility of eliminating lots from the coastal bluff. 1.2 Study Structure The Conceptual Framework described below indicates this study is designed to provide a systematic analysis of the feasibility of transferring development rights from the Santa Barbara Ranch Project to other urbanized areas in the County, including some urbanized areas located inside the boundaries of specific cities. Volume 1: Sections 2 provides background on the history and theory of transferable development rights mechanisms and related concepts such as mitigation banking, as well as a detailed discussion of what makes TDR programs successful. Section 3 identifies several examples of TDR programs that have been successful in comparable situations, including other areas along the California coast. This is based on an extensive literature review as well as the authors primary research and interviews with officials and other participants in these programs. 10
20 Volume 2: (Sections 4-7) applies the TDR mechanism directly to the Santa Barbara Ranch Project. Section 4 provides a brief overview of the critical issues pertaining to TDR in relation to the Santa Barbara Ranch Project we have identified during this study. Section 5 conducts a three-step screening process on a variety of potential receiving sites throughout the County. These sites range considerably in location, value, development potential, comparability to the sending area. Optimal sites are identified based on evaluation of threshold economic (developers willingness to pay analysis) and political criteria. Section 6 seeks to estimate the value of the development rights contained on the 54 residential building envelopes included in the Santa Barbara Ranch application and the 72 new rural estates contained in ALT 1. We created these market value estimates using a hedonic model, which identifies the value of individual attributes that are likely to be valued by the marketplace and are present somewhere in the site (for example, the presence or absence of a view) and then bundles those attributes together to determine an overall value for each parcel. Section 7 combines the findings in Sections 5 and 6 to determine what a successful TDR program might look like. In this way we help to provide guidance as to the feasibility of each of the receiving areas. We also examine the feasibility of creating a bank or banking mechanism. Section 8 summarizes our findings about the feasibility of a TDR program associated with the Santa Barbara Ranch Project and provides a series of options with pros and cons. 11
21 2. Transferable Development Rights: What They Are and How They Work 2.1 TDR as a Market-Based Mechanism One of the more difficult challenges facing decision-makers in land-use planning is reconciling the inevitable differences between land use policy goals contained in land use plans and pre-existing patterns of land ownership and property rights. Landowners assert the right to build on or to sell legal parcels of land, whereas public policy may designate that land for open space, agriculture, or a use that is at odds with the landowners assertion of the property rights. The Naples Townsite is an excellent example of this conflict. In 1982, the County adopted its Local Coastal Program, which discourages urban growth beyond the urban-rural service boundary in Goleta. The landowners of the Naples Townsite have consistently asserted property rights that are conflict with this concept. Over time, many so-called market-based mechanisms have evolved to try to reconcile conflicting land use interests. These include creating markets for specific regulated commodities that the regulated parties may buy and sell, rather than requiring the regulated parties to act according to the explicit directives of command and control methods. Market-based models for land preservation directly address the conflict between developing land for revenue purposes, which might be a private landowner s priority, and preserving land, often a public policy objective. Market-based policies for land include TDR programs and mitigation banking. Under a standard TDR program, the right to develop land is severed from the land itself and treated as a separate right. Landowners in sending areas (areas designated for preservation) are permitted to sell their development rights to landowners or developers in designated receiving areas, who are permitted to build at higher densities if they purchase development rights. Once the development rights are sold from the property, the land is protected from future development in perpetuity with a conservation easement. Conversely, mitigation banking takes the obligations that developers incur as a condition of development approval and severs those from the land. Mitigation banking, discussed briefly in this report, creates a market for willing buyers and sellers of mitigation requirements often imposed on developers as a result of environmental regulations requiring protection of such resources as endangered species habitats and wetlands. In the case of a TDR, Figure 2.1 illustrates a typical situation. A sending-site landowner is entitled to three development rights and obtains compensation for those rights by selling them to a receiving-site developer. The receiving-site 12
22 developer is then permitted to build three more units above the baseline zoning in the receiving area. The voluntary nature of TDR programs allows private landowners to make decisions that are in their best interest, which can lead to economic efficiency advantages. Figure 2.1 Conceptual TDR Diagram TDR programs are best used to relocate development away from areas considered valuable by the community, such as farmland or important ecological land, toward areas with infrastructure and services to handle additional development. A TDR program is not well suited to reduce the total amount of development in an area. At the very least, it will permit the same amount of development but in a different configuration. In some instances the policy may actually increase in the overall number of dwelling units allowed if conditions warrant (see transfer ratio below). 2.2 Who Benefits and Who Bears the Cost? With any public policy, some individuals bear the costs of the policy and others capture the benefits. Effective TDR policy seeks to minimize the inequities between these two parties. Receiving-area landowners benefit from the increased density, which is capitalized into the value of their land. The increase in land value must be greater than the cost of the TDR required for additional development; otherwise the receiving-area landowners would have no motivation to acquire development rights. Sending-area landowners experience a decrease in the value of their land due to subsequent loss of development potential, but are able to retrieve this loss by selling development rights. If the decrease in the value of the land is greater than the revenue received through the sale of the development right, sending-area landowners would have no motivation to sell them otherwise. Community residents benefit when they experience preserved open space with minimal increased impact upon their neighborhood and minimized expenditures of public money. Receiving-area residents may experience a disproportionate share of the impact from increased density, including increased traffic and congestion. 13
23 This can quickly result in residential not in my backyard (NIMBY) attitudes towards increased density. These local attitudes can be very powerful and can serve to derail a TDR program in its initial stages of development. Ultimately, the public benefit realized from the preservation of the sending parcels must outweigh the impacts incurred with developing the receiving area at higher density. 2.3 Policy Goals Pursued Through TDR Mechanisms TDR programs are used in both urban and rural settings to achieve a wide variety of community goals. But the overwhelming majority of TDR programs in the United States are used for either environmental protection or farmland preservation or a combination of the two. TDR programs have been organized into eight broad categories 4 : 1. General Environmental 2. Specific Environmental 3. Farmland 4. Environmental and Farmland 5. Rural Character 6. Historic Preservation 7. Urban Design and Revitalization 8. Infrastructure Capacity Most TDR programs are located in three parts of the country California, Florida, and the Mid-Atlantic states of Pennsylvania and Maryland. Policy goals differ by region. In the Mid-Atlantic states, farmland preservation is most prevalent. In California and Florida, TDR programs are most frequently used to achieve specific environmental goals. TDR programs vary in the geography of their transfers and their regulatory framework, and therefore are implemented by a broad range of jurisdictions and through degrees of regulatory requirements. For example, programs oversee small geographic areas with clearly identified receiving areas and require developers to purchase TDRs to be eligible to build in the receiving area. On the other end of the spectrum, programs can be loosely structured with parcels in areas allowed to act either as sending or receiving sites. The most effective TDR programs balance the degree of regulatory requirements with the ability to create incentives for a healthy TDR market. If a program is too costly to administer or too costly for a developer to use, the program will certainly fail. From a government regulation perspective, a succinct and straightforward regulatory framework guided by a single goal can reduce administration costs. 4 TDRs and Other Market-Based Mechanisms Fulton, Mazurek, Pruetz, Williamson. Washington D.C.: The Brookings Institution,
24 2.4 Advantages and Drawbacks of TDR Programs Advantages of A TDR Program Protection of Private Property Rights & Multiple Stakeholder Interests: The voluntary nature of a TDR program does not restrict development as command-and-control regulatory tools can. Rather, its flexible structure starts with the premise that growth will occur and finds common ground where developers, landowners, public officials, and the local community can to accommodate growth in an acceptable way. The policy is equitable in that it respects private property rights by appropriately compensating landowners for lost development potential. Double Incentive to Sending-Area Landowners: Property owners selling a TDR receive the market price for their development right and also receive a property tax reduction from the state and local government by a permanent deed restriction their land with a conservation easement. This provides a double monetary incentive for landowners to reduce development on their land. Decreased Infrastructure Costs: The net benefit of a TDR program should be the creation of more densely populated areas, which would result in reduced infrastructure costs. TDR programs are often used to prevent sprawl and development in sparsely developed areas, resulting in increased infrastructure costs and higher public expenditures. Politically Feasible: A TDR program is potentially politically acceptable because of its voluntary and flexible structure, accounting for landowner property rights and developer interest. The policy should face minimal opposition from rural landowners and attract support from developers because it allows for increased building opportunities. Political feasibility in receiving-site areas can sometimes be more difficult because of resistance from nearby residents. Less Expensive Method of Land Preservation: Many land preservation programs require public agencies to purchase and maintain sensitive land. In a TDR program, the speculative value of the land is removed and the land remains in private ownership producing revenue for the landowner, often through farming. In other cases, a public agency acquires the open space in order to achieve a public policy goal, but the agency need pay only the residual underlying land value, not the speculative value, which has already been sold off. 15
25 2.4.2 Drawbacks of a TDR Program Potentially High Administrative Costs: The administrative costs of implementing a TDR program can sometime outweigh the potential benefits of efficiency that the market may provide because of the need for transfer record-keeping and information maintenance. TDR systems can have complicated and extensive requirements placed upon TDR buyers and sellers, making it more difficult for markets to operate efficiently. This argues for designing the TDR mechanisms to be as simple as possible. Broad-based benefits and Concentrated Burdens: Neighborhoods receiving increased density may disproportionately bear the burden of increased density within the urban area while the benefit of preserved open space is enjoyed by all. Demand/Supply Imbalance: A major difficulty is the potential imbalance between the demand and supply of development rights. This thin market scenario can result from too little participation from the developers on the demand side or landowners on the supply side. Often there are only a few landowners in the sending area and sometimes in the receiving area as well. If the rules are complicated, developers in the receiving area may not be well informed about how the system works; and the incentive provided may not be properly calibrated to motivate them. Inter-Jurisdictional Political Barriers: Often TDR sites involve sending and receiving areas that are in different jurisdictions. Difficulties can arise when asking city and county governments to work together to relocate development and provide density up-zoning. Often, cities do not want to absorb the development from county lands. Price Disparity: Where there is a large disparity in land values between the sending area and the receiving area, the number of allowable units on the receiving sites will need to increase in order to equitably compensate the sending area landowner in the receiving area. This can create difficulty in creating a sufficient supply of receiving sites, especially if sending areas are much more valuable than receiving areas. Increased Amount of Development: Transfer ratios greater than 1:1 will lead to an increase in the total amount of development above the current zoning allotments which can create community opposition. Residents may consider current neighborhood zoning as a permanent cap on density and may not understand that density zoning is subject to continual change (through local land use policy), especially in regards to a TDR program. 16
26 Conflict With Other Policy Goals: The program may not be successful or it may conflict with other policy goals if there are alternative methods of obtaining increased density. For example, a local government may provide increased density simply through easing regulations without requiring purchase of development rights in return. Alternatively, local governments may conclude that the money generated by buying higher densities should be used for a different purpose affordable housing, for example. In California, there considerable pressure to follow this route, rather than use TDRs, in order to meet the requirements of the Regional Housing Needs Assessment. Patchwork Or Leapfrog Development: Without adequate regulatory constraints, a TDR program s voluntary nature may result in a patchwork of development with preserved and developed land in the sending area with no distinct contiguous area of preservation. Additionally, preserved areas may not be the most ecologically significant if clear eligibility constraints are not outlined for sending sites. 17
27 2.5 Key Components of Successful TDR Programs Drawing on the experience of more than 140 TDR programs nationwide, the literature suggests most successful programs share many components in common. A TDR program should be considered only in a region possessing a strong demand for density with an active real estate market (i.e., where land is at a premium and developers desire to build at greater densities). In real estate markets where this is not the case, developers may be unwilling to buy development rights and the TDR program will struggle. Furthermore, communities interested in implementing a TDR program must be willing to face the trade-offs of greater density in the receiving areas in exchange for greater preservation in the sending areas. They should not be devised with the hope of reducing overall development If these conditions strong demand, receptivity to tradeoffs do exist, policymakers still must successfully address the key issues in actual program design. Research indicates the five components of utmost importance to a TDR program s success are: 1. Clear program goal(s) 2. Inter jurisdictional cooperation 3. Suitable receiving and sending sites 4. Suitable Incentives for receiving site developers and sending area landowners 5. Use of Banks and Other Market-Making Mechanisms Clear TDR Program Goals A TDR program is not a policy in and of itself. Rather, it is an implementation tool used to implement a planning policy goal, usually community preservation of agricultural or open space land. A TDR policy is flexible; it can be written with multiple goals in mind or possess a single focus. But research shows that a more simple and focused TDR program is more likely to succeed. For example, the goal of a TDR program could be the protection of the maximum quantity of valuable farmland regardless of whether the preserved parcels are contiguous. Alternatively, a TDR program could be used to implement a vastly different goal for example, discouraging development on a small and distinct grouping of parcels that are valued by the community because of ecological or historical importance. Whatever the goals are, it is important clearly and succinctly define them for properly address remaining TDR components 18
28 2.5.2 Inter-jurisdictional Cooperation and TDR Service Area Size Inter-jurisdictional transfer agreements are the exception, not the norm, in other TDR programs. Nationwide, only a few programs include inter-jurisdictional agreements. 5 Different jurisdictions may have different goals, and the receiving jurisdiction may fear that it will be a disproportionate cost or burden of the transferred development. In California, the transfer of housing development rights in particular has significant consequences because it is difficult under state law to transfer low- and moderate-income housing obligations from one jurisdiction to another in a way that conforms with the Regional Housing Needs Assessment (RNHA) process. Inter-jurisdictional TDR agreements can work, but only when each jurisdiction achieves its goals through the program more effectively than without participation. Transfers located within a single jurisdiction, and preferably within the same real estate market area, may face less opposition and may be politically and administratively easier to establish and maintain. A large jurisdiction that undertakes a TDR, such as a large county, might want to consider limiting the scope of the TDR program geographically so the community can readily see the relationship between the sending and receiving sites and better understand the tradeoffs involved Suitable Receiving & Sending Areas It is not usually difficult to identify sending areas; indeed, a TDR program often emerges from a strong political consensus to preserve a certain set of properties by removing development potential from them. Not all undeveloped lands represent suitable sending areas. Nor is it realistic to assume that all land can be preserved by transferring development rights elsewhere. The best sending areas are areas where the value of the development right closely matches the value received by the developer in the receiving areas from the increased zoning density. On the other hand, it can be extremely difficult to identify politically acceptable receiving areas because local resistance to increased density is so common. As we have said, a TDR program does not decrease the overall amount of development but, rather, represents a political consensus on a tradeoff. The ultimate question a community must ask itself when identifying the receiving and sending areas is: where does it wish to discourage development and where does it wish to accommodate development? Obviously, the receiving-area land should be suitable for development and not unduly restricted by severe topography, wetlands and other sensitive features, or 5 TDR programs with inter-jurisdictional agreements include King County, Washington; Boulder County, Colorado; and The Pinelands development credit program in New Jersey. 6 Kami Griffin, San Luis Obispo County TDR program director, 1/
29 infrastructure service constraints. The receiving areas should include parcels near existing transportation corridors, water, sewer, and other pre-existing urban amenities, and parcels for which there is ample market demand. Proximity to infrastructure will minimize site development costs, making development more attractive to developers who wish to build with the use of TDR. TDR programs tend to work better economically, and gain more political acceptance, when the sending and receiving areas are close to one another and have some similarity. As stated above, when development density is increased in an area at a great distance from the area being preserved, the residents near the receiving site bear an unequal share of the burden without any of the benefits. Research indicates TDR programs work most equitably when the external benefits are relatively local, meaning when sending and receiving sites are close to one another. 7 In these situations, the receiving-area residents recognize that they are sharing in the benefit of the land preservation in the sending areas. It is important to note that, if receiving sites consist of similar parcels in fairly close proximity to the sending area, they are likely to be high-value lands perceived to have considerable community benefit in an undeveloped state. On the other hand, if the goal is to transfer development to a different context for example, to lowervalue areas this may require high transfer ratios that could greatly increase the overall amount of development and thus potential neighborhood concerns Adequate Incentives for Sending- and Receiving-Area Landowners For both sending- and receiving-area landowners, a TDR program is a voluntary alternative to the conventional development approval process. Therefore, both sets of landowners must view the TDR route as a more attractive alternative. For sending-area landowners, selling development rights must be equally profitable and more feasible than pursuing development of their property. For receiving-area landowners, building at higher densities must be more profitable and feasible than building at regular densities and obtaining permission to build at higher densities by buying TDRs must be more attractive than seeking such permission by any other means. If both developers and landowners are not simultaneously motivated to participate in a TDR market, the program is unlikely to succeed. Creating a successful program requires three things: 1. A balance of sending area supply and receiving area demand for TDRs. 2. Creating a viable transfer ratio between sending and receiving areas. 3. Maintaining strict control of the currency that is, extra density in the receiving areas and surrounding vicinity. 7 Thorsnes et al, pg
30 Supply and Demand in Receiving Areas A TDR program creates a development right, or TDR, as a marketable commodity that provides the owner of the TDR with a right to some increment of development (usually one housing unit). For a TDR program to work effectively, it must adequately address both the supply of development rights and the demand for TDRs in receiving areas. One common mistake of TDR programs is to designate too little land or land owned by only a few landowners as a receiving area, thus damaging the chances for a balanced market. If too many TDRs are chasing too few receiving sites, the price of TDRs will go down to the point where sending-area landowners have no motivation to sell. Receiving areas must contain more than enough parcels to accommodate the additional density that would be shifted into the area as the result of a successful TDR market. To understand how to create a balanced market, it is important to conduct a market analysis to assess the developers demand for increased density on the receiving parcels. The market analysis should ultimately reveal the value to the developer of purchasing an increased increment of development a TDR. This value we call the Willingness To Pay or WTP the willingness of a developer to pay money to obtain increased density. This information will also inform the decision regarding the size of the receiving area and subsequent appropriate density bonus. A market analysis leads to important discoveries about the relationship between existing zoned densities and the density desired by developers. For example, if the market analysis shows that optimal developer density is roughly equivalent to the existing zoned density on the receiving site(s), then developers will not be motivated to buy TDRs. In this scenario, developers already have the optimal density even without buying TDRs. On the other hand, if sufficient developer demand exists on particular receiving sites, it may be possible to require a mandatory TDR purchase to develop the site 8. This can prove effective for agricultural parcels being re-zoned for residential development. The market analysis will also identify what the allowable increased density should be in the receiving areas. Generally, density bonuses have ranged from 50% to 100% for residentially zoned areas, and up to 500% to 700% for some agriculturally zoned receiving areas 9. This might mean, for example, that in a highdensity urban district, the underlying zoning permits 30 units per acre, but with TDR purchases, a developer could move up to as many as 45 units per acre (a 50% increase). In an agricultural area, a 500% density bonus might permit a developer 8 Both the Chesterfield TDR program in New Jersey and the Chatahochee TDR program in Atlanta, Georgia use a mandatory TDR mechanism for the development of receiving sites. 9 As seen in many TDR programs: Burlington Co. NJ, San Luis Co. CA, Pinelands NJ, King Co., WA 21
31 to move up from 1 unit for every 40 acre to 1 unit for every five acres once a sufficient number of TDRs are purchased from sending-area landowners. 22
32 The density bonus can be identified on a parcel-by-parcel basis or, more commonly, by using existing zoning classifications with assigned density bonuses. Alternatively, the density bonus for receiving parcels can be based on a distance from a central urban area, with closer sites receiving a greater bonus than more distant sites. The density bonus should be based not only on market demand but also on infrastructure capacity. Transfer Ratios A transfer ratio seeks to balance supply of development rights with demand for development rights. The ratio is the number of development rights available in the receiving area as compared with the number of development rights available in the sending area. For example, a sending-area landowner may be able to build one house in the sending area; but may also have the ability to sell one TDR, which would permit a receiving-area landowner to build one house as well. This would be a 1:1 transfer ratio. Alternatively, a sending-area landowner may have the right to build one house on site, but be granted two TDRs, meaning the receiving-area landowner would have the right to build two houses. This would be a 2:1 transfer ratio. Transfer ratios are often used to equalize differing land values between sending and receiving sites; and also to provide both sending-area landowners and receiving-area developers sufficient incentive to participate in the program. Figure 2 illustrates the concepts of increasing the number of allowed housing units via transfer ratios. A 10-acre sending parcel in a highly valued area has a zoning of 0.3 units per acre, allowing for a maximum of 3 houses on the parcel. A 1:1 transfer would create 3 new houses at the Receiving Site A; a 5:1 ratio would create 15 new houses at Receiving Site B. 23
33 Figure 2.5 Conceptual Transfer Ratio Diagram Transfer ratios are determined several ways. 1. Working from the supply side of the TDR market, programs can use a 1:1 transfer ratio to keep the total amount of development in the region consistent with preexisting zoning allowances, as in Receiving Site A above. The number of dwelling units allowed by zoning on the sending sites is directly transferred to the receiving areas. This has the advantage of holding the amount of development in the entire area constant, but the disadvantage of not being attuned to the market. In many cases, such a transfer ratio may not be sufficient motivation for either sending-area landowners or receiving-area developers to participate in the market. Because sending-area landowners receive the same number of development rights no matter what, they may choose simply to develop their property rather than sell TDRs. At the same time, receiving-area developers may not receive enough additional value from a 1:1 ratio to motivate them to buy TDRs. 2. Approaching transfer ratios from the demand side of the market, TDR programs can work backwards from the estimated developers willingness to pay on receiving 24
34 sites to balance supply with demand. This converts the currency from increments of development to dollars. For example, a sending site is appraised for value in its undeveloped and developed states. The difference represents the value of the development right to the sending site landowner. The receiving site developer s willingness to pay for increased density is assessed and the sending site appraised value is divided by the developer value. Recall the situation in Figure 2, where for example, development right value on the sending parcel is determined to be $500,000. Now the market price of a development right (of which there are three) is estimated to be $50,000. Therefore, the number of TDRs allocated to the sending parcel would be (500,000/50,000) x 3 = 30 TDRs. Many variations are available. Under another approach, programs can opt to have a tiered transfer ratio where sending parcels in closer proximity to the receiving area are given higher ratios than those further away. Or, transfer ratios can be calibrated by the relative value of land in different receiving areas. Another possible way to calibrate the transfer relationship is to value the TDR differently in the sending and receiving areas with a differential transfer rate. The simplest and most common value used is 1 TDR in the sending area = 1 extra unit in the receiving area. There are some situations where different types of units would require slightly different amounts of TDRs to be equitable due to the difference in value of the additional unit. For example, a high-density townhouse may require 0.75 TDR while a medium density detached unit may require 1 TDR, and a larger low-density house may require 1.25 TDRs. Alternatively, certain receiving sites will be in more demand by developers than others. If a developer desiring to build on the less-valued receiving parcels must pay the same amount for additional development as a developer wishing to build on the more valued receiving parcel an inequity exists due to a transfer ratio that was set to balance total market demand and supply. If a higher transfer rate is required (i.e. 1.5 TDR = 1 additional dwelling unit) for the highly valued receiving area site, then inequities in the market place will be minimized. Currency Control Even the most sophisticated calibration of sending and receiving areas cannot make a TDR market work if the currency created by the TDR program does not retain its value. Receiving-area landowners will not participate in the market that is, they will not buy development rights from sending-area landowners unless a TDR purchase represents the most profitable and feasible way for them to obtain a density bonus. 25
35 This means the receiving-area jurisdiction must constrain the supply of additional density that landowners can obtain by other means. Many jurisdictions undermine their own TDR programs by routinely permitting up-zoning through the normal regulatory process in effect, giving the commodity away for free even though they are asking developers to pay for it in the TDR market. In other cases, the jurisdiction may provide density bonuses for other purposes affordable housing, for example and may send a signal to landowners that this competing goal is more important than the TDR program. Either course of action can devalue the currency by providing receiving-area landowners with alternative ways to obtain a density bonus. These actions will greatly harm the chances of the TDR program s success Using Banks and Other Market-Making Mechanisms TDR markets do not work seamlessly in all situations. When a policy attempts to use market forces to regulate, it is important for the individuals and firms engaged in the market to have adequate information. If market players are misinformed or unaware, they will not participate in the market in an effective manner. In addition, land markets frequently do not function in the same way as other markets. Often there are only a few market players, especially in undeveloped areas, and frequently those market players do not respond to normal economic signals. They purchase land for reasons unrelated to economic return; or they are longtime landowners with little debt and low taxes who are realizing a steady revenue stream and are not motivated by the prospect of a large economic return. In other words, even if a TDR market is well designed, it may not function well because the right buyers and sellers may not be in the marketplace at the right time. A TDR bank seeks to facilitate transfers with purchases and sales of development rights. Assuming it is well capitalized that is, staked with a significant amount of money -- a TDR bank can buy, hold, sell, and even retire development rights in order to stimulate a slow market or bring balance to an uneven market. The bank can also provide administrative assistance related to the transfer of development rights. While TDR banks are not required, their presence can serve as an important psychological support for landowners, developers, and government officials. This is especially true for TDR programs just starting, where confidence in the program s long-term viability needs time to develop, and desirability of development rights in the receiving areas remains unproven. In this case a TDR bank can make front- purchases of development rights and help to ensure program success during initial stages. 26
36 TDR banks can exist at any level of government; state, county, municipal, or through non-profit organizations. A TDR bank s responsibilities can range from passive administrative roles to more active participation through careful timing of development right purchases and sales. For example, TDR banks can act to stimulate the market when market activity is low, and provide stability when the market is volatile. TDR banks can be funded through public bond referenda, dedicated taxes for open space purposes, or state and federal grants. Another potential role of TDR banks is funding through grants and low-interest loans, and the construction of receiving area infrastructure. This acts to reduce developer costs and stimulate greater demand to build in the receiving area. Alternatively, the planning agency may use regularly scheduled auctions for development rights as a forum to bring willing buyers and willing sellers together 10. This serves several beneficial purposes. Auctions can directly establish the market price for TDRs and quickly inform market players as to probable supply and demand. Auctions can expedite sales and increase overall market activity. If these auctions are held on a yearly or bi-yearly interval, market players will be well informed and the overseeing agency will have updated information to assess the TDR program s effectiveness. Auctions also serve as a forum to educate the public about the local TDR program. These auctions have been known to not only stimulate and educate local landowners about the use of TDR but also attract developers from a larger geographical area. A similar banking mechanism worth considering in some TDR-type situations is a variation on the mitigation bank. Generally speaking, TDR-type mechanisms are programs that deal with the trading of rights that is, the ability of a landowner to develop property as determined by a government regulatory agency with the power to issue development permits. However, in many cases, regulatory agencies also confer obligations on landowners as well that is, requirements that the landowner must fulfill in order to obtain the right to develop. Such obligations are usually referred to as mitigations. Just as rights can be banked and traded, so too can mitigations. Perhaps the best definition of mitigation banking (provided in the wetlands context) comes from Cylinder (1995): A mitigation banking program uses a credit system to enable the purchase of compensation credits, with each credit representing a unit of restored or created wetlands which can be withdrawn to offset impacts incurred at a development site. In most cases, wetlands are created at a mitigation bank site prior to the removal of wetlands at a project site. 10 Chesterfield Township in New Jersey, one of the more active and successful TDR programs in the Country, holds annual development right auctions. 27
37 Mitigation banks have often been established in the context of mitigating the impact of new development projects on wetlands. In California, such banking has often been used in the context of mitigating the impact on endangered species. Endangered species mitigation banking has often occurred under California s conservation bank law. 11 One significant aspect of mitigation banking that could be borrowed in a TDR context is the idea that the bank is staked up-front and credits are sold off subsequently. This is different from a traditional TDR system in which there is an ongoing market in which buyers and sellers must find each other. As an alternative, a TDR system could follow the mitigation banking model, so that the land would be preserved up-front by a bank, and then the bank would sell off the TDRs to buyers in receiving areas over time according to market demand. 11 Cylinder, Paul D., Kenneth M. Bogdan, Ellyn M. Davis, and Albert I. Herson Wetlands regulation: A complete guide to federal and California programs. Solano Press, Point Arena, California. 363 p 28
38 3. TDR Programs in Similar Communities The discussion below outlines TDR programs with similar characteristics to those found in the Santa Barbara Ranch Project. These characteristics are primarily: Highly valued coastal sending areas with correspondingly large transfer ratios (i.e. greater than 3:1 or 4:1), Sending areas with view-shed concerns, Cross-jurisdictional transfers, and Transfers that are from rural areas into urban areas. Location of sending areas respective to receiving areas Affordable Housing Much of this research was gathered through conversations with Planning Agency staff from the various jurisdictions shown below with TDR programs in place and Beyond Takings and Givings a compilation of nation-wide TDR programs by Rick Pruetz. 3.1 Oxnard In 1984, Oxnard adopted a TDR ordinance to resolve litigation disputes arising from a partly developed beachfront subdivision. The situation is similar to Santa Barbara Ranch Project in the sense that it sought to move development rights from an expensive beachfront area to a less expensive inland area. For each beachfront lot preserved for open space, as many as six dwelling units could be transferred to inland receiving sites. Receiving site developers also qualified for exemptions from certain permitting and impact fees. The 6:1 transfer ratio was the result of an economic study which concluded that it could take as many as 6 additional dwelling units at the inland receiving sites to equal the profit potential of one beach front home. Although some transfers occurred in the mid 80s, the owners of most the beachfront lots wanted to build their personal homes on site and were not interested in the economic benefits of transferring their rights. This is an important lesson for the Santa Barbara Ranch situation in that many future individual lot owners may be less likely to engage in a TDR transaction than dealing with a single entity (i.e. the current owner/developer). 3.2 Pacifica Pacifica, with a population of 38,000, stretches along 15 miles of coastline south of San Francisco. In 1989 the city adopted a TDR ordinance to preserve coastal bluffs. In particular the city wanted to save a 20-acre bluff-top, which was zoned for low 29
39 density residential development. Receiving site developments are encouraged to use TDR by exemptions from certain development standards (setbacks etc) as well as certain impact fees. The receiving sites are multiple family residential zones. Transfers were allowed by discretionary approval of Pacifica s Planning Commission. During the 90s the program was able to preserve the 20-acre bluff using TDRs. However, similar areas are not protected by TDRs, partly because of the difficulty in achieving increased density in potential receiving areas. Receiving areas that are similar to the sending areas are also constrained by topography and environmental considerations, and obtaining even the density permitted under the base zoning can be difficult. Pacifica s successful program is relevant to the Santa Barbara Ranch TDR discussion in that the primary concern was the preservation of coastal bluffs. 3.3 Malibu The Malibu coastal zone stretches along 27 miles of shoreline between the city of Los Angeles and Ventura County. The mountains in this area are laced with thousands of small lots created prior to the advent of modern subdivision regulations. These lots were originally designed as sites for weekend cabins and averaged between 4,000 and 7,000 square feet. Many of these lots are on steep hillsides and are not suitable for septic systems. Despite these hazards, because of the areas natural beauty and proximity to L.A people continued to build houses in the Malibu hills. The Coastal Act states that new subdivisions can only be permitted where 50% of the existing lots were already developed. Malibu did not meet this requirement. The solution was a TDR program that was voluntary for sending area landowners but mandatory for receiving-area developers. In order to win permission to build a new home, receiving-area developers also had to retire an existing lot essentially by buying out another property owner s development rights. Developers were highly motivated to buy TDRs because the huge increases in land value that was gained by subdivision. Splitting a 10-acre lot into four 2.5-acre lots can produce % increase in value. The program retired a total of 924 lots. But there is one important lesson for Santa Barbara Ranch, and that is the role that the California Coastal Conservancy played as a banker. By investing $2.6 million in purchasing 213 development rights, the Coastal Conservancy essentially created and stabilized the market. 3.4 Pismo Beach, California This program was designed to reduce development impacts upon coastal bluff-- tops. Transfers can occur within and between four zones on a 1:1 ratio. One of these zones occupies a relatively flat coastal bluff-top between the shoreline and U.S. 30
40 Highway 101. The other three zones include hillside land in the coastal mountains inland from U.S Within any of these zones, any lots can theoretically be sending or receiving sites for density transfers. However, the sending sites must be considered feasible for development and TDR proposals can be denied for inconsistency with the Local Coastal Plan in terms of density and scale. The program experienced some transfers in the mid 80s and only one transfer was submitted in the 90s, primarily because there are relatively few undeveloped parcels remaining which could serve as receiving sites. 3.5 San Luis Obispo County San Luis Obispo County has two TDR programs: a community-based program of Cambria developed in the 1980s, and the county-wide program adopted in The goal in Cambria s TDR program was the preservation of coastal pine habitat in an area targeted by the Local Coastal Plan by reducing the number and size of units in an antiquated subdivision. Cambria s successful program was initiated as a collaborative effort between the California Coastal Commission, California Coastal Conservancy, San Luis Obispo County, and the Land Conservancy of San Luis Obispo. Seed money for the program was provided by the Coastal Conservancy. As of February 2003, 85,000 sf of floor area development credits had been purchased with 230 lots preserved. The Land Conservancy acts as the banking institution that buys, holds and sells transferable development credits; on average the bank sells 5,000 credits per year. Lots in 2000 were reported to sell for $6,000. The County TDR program was designed to retire thousands of legal lots scattered throughout the rural regions of the County. There are three sending area designations: Agricultural, Natural Resource, and Antiquated Subdivision. The Antiquated Subdivision sending sites are assigned development rights either by an existing lot method (the number of existing lots) or exchange rate method. Under the exchange method, the number of credits assigned to the sending parcel is calculated by determining the value of the lost development potential on the sending parcel and then dividing that by the willingness of a developer to pay (in the receiving by area) For example, if the development value of a sending parcel is $600,000 and it was determined that developers are willing to pay $20,000, the sending parcel would receive 30 credits (60/2), no matter what the underlying zoning would permit. Given the county s current exchange rate (willingness to pay) of $20,000, this would permit more development than would otherwise be allowed. Receiving sites are constrained to parcels that: 1. Have no significant environmental amenities, 31
41 2. Are not located in an Agricultural Reserve, and 3. Are located within 5 miles of an urban limit line. The density bonuses also vary depending on the receiving parcel s location. If the site is within an incorporated city s boundary line, the density bonus must be consistent with that city s policies. In county territory, the density bonus goes down if the property is located further away from an urban area, to the point where no density bonus is granted at distances greater than 5 miles from an urban area. In addition the county grants an extra 25% bonus to base density receiving area developers who provide special amenities such as trails, coastal access, and public parks. The County program has approved four receiving areas and seven sending sites with a combined acreage of 8,300 acres. While the county-wide program has approved four receiving sites and seven sending sites with combined acreage of 8,300 acres, it has seen little activity. This is predominantly due to issues of local control. More specifically, rural communities surrounding sending and receiving areas wanted to create local community-based TDR programs - not a county-wide transfer system. Indeed, the County was sued by the Coalition for Rural Preservation in 2001 over this issue, and a Grand Jury Inquiry recommended the TDR ordinance allow the option for community-based programs. These issues bear weight concerning a TDR mechanism for Santa Barbara Ranch because of the antiquated subdivision and proximity issues. Receiving areas that are not proximal to the Santa Barbara Ranch Project are not likely to carry the requisite political support to create a successful transfer of development. 3.6 Palm Beach County, Florida Palm Beach County is located 60 miles north of Miami on the Atlantic Coast and has one of the fastest growing populations in the country (114,000 in 1950 to 1.1 million in 2000). The rapid pace of development has resulted in significant losses in environmentally sensitive lands (in the western part of the county along the Everglades) and created intense development pressure on urban fringe parcels (in the eastern part of the county, adjacent to the old beach towns). Sending sites consist mostly of rural environmentally sensitive lands and agricultural land with low density zoning of RR-20. Receiving sites are focused in the eastern areas and are given density bonuses ranging from 3 to 4 extra units/acre. In addition the program offers an extra density bonus of 1 unit/acre for receiving sites nearby commuting services. To facilitate transfers, the county created a TDR bank to purchase and hold development rights. As of April 2002 the County had approved ten receiving area projects using 944 TDRs. The developers purchased all of these TDRs from the TDR bank. TDR is increasingly becoming an attractive option for developers as the 32
42 amount of vacant land dwindles. The Palm Beach TDR program carries relevance to a TDR mechanism for the Santa Barbara Ranch Project in that it shows the importance a Bank plays in a functioning TDR system. 3.7 Boulder County, Colorado Boulder County lies 15 miles northwest of downtown Denver. Booulder s interjurisdictional TDR program allows transfers from sending areas in the County to receiving areas in or near the City of Boulder and seven other incorporated communities. The inter-jurisdictional program has produced 15 transfers between cities and the County preserving 4,700 acres at average TDR prices of $50,000. The program is implemented through an inter-governmental agreement between the City of Boulder and Boulder County, which was adopted in Since then, seven other cities have entered the agreement. Sending area landowners have a 2:1 transfer ratio and if deliverable agricultural water is attached to the site a 3:1 ratio is used. Sending areas are separated into several categories: Rural Preservation, Accelerated Open Space Acquisition, Private enclaves and Northern Tier Lands. Receiving sites include land within the boundaries of the cities or lands which are being annexed that comply with the specific city-county IGA. In some cases, the city and county buy the underlying property for open space after the development rights have been sold; the TDR program obviously reduces the price of the open space land. One problem relevant to the Santa Barbara area is that the City of Boulder has emphasized affordable housing, meaning that in some cases developers have chosen to provide affordable housing, rather than purchase TDRs, in order to obtain increased density. 3.8 King County, Washington King County includes the Seattle metropolitan area in the west and the Wenatchee National Forest in the east. In 1998 King County adopted a TDR pilot program which allowed for transfers from rural portions of King County to the incorporated cities. The program offered incentives for the cities to participate in the form of amenities such as transit enhancement and pocket parks. In 1999 the County budget included $1.5 million to fund a TDR bank and additional $500,000 for receiving area amenities to offset the impacts of increased densities. In 2000 the City of Seattle and King County entered into an inter-local agreement that put the County s TDR program into effect. Under this agreement the city received $500,000 from the County for amenities on or nearby the receiving area. Development rights cannot be sold for use within incorporated cities unless the city and County have entered into an inter-local agreement and the city has adopted an implementing strategy for the receiving area. The City of Seattle believed that inter-jurisdictional transfers would be appropriate for its Denny Triangle 33
43 neighborhood revitalization project, an area consisting of 25 city blocks adjacent to downtown Seattle. Projections call for a housing increase from 900 to 5,000 homes. The sending sites are located in rural King County and include land zoned for agriculture, forest, listed habitat and land zoned as urban separator zoned R-1. Sending sites of agricultural and forest land can send twice the allotted density, etc. In 1999 a 313-acre forested sending site was preserved with a $313 million TDR transfer of 62 rural residential development rights which allowed for an additional 8,000 square feet of commercial floor area/development right. The Denny project sets a development right to be worth 2000 sq ft of additional residential floor area. Although Seattle was receptive to higher densities in the Denny Triangle area, it is important to note that the city itself got something out of the deal the halfmillion dollar payment from the county. This made the interlocal agreement easier to negotiate. The potential need for a similar kind of inter-jurisdictional agreement between Santa Barbara County and the City regarding development transfers makes King County s program relevant to this TDR discussion. 3.9 Dade County, Florida Dade County occupies the southeastern corner of the Florida peninsula and contains the Miami metropolitan area. Dade is the most populated county in the state, yet over half of the County s land is in the Everglades. In 1982 Dade County adopted a TDR ordinance in which potential sending parcels are in the East Everglades and receiving parcels are located in unincorporated areas within the urban growth boundary. The land in the sending area nearest to urban areas with existing residences was given a transfer ratio of 8:1. Purchased development rights can be used to deviate from density, lot area, frontage, and other development requirements on residential and commercial sites which are designated for urban development in unincorporated Dade County. The density increases which can be attained through transfers vary between the 18 different zoning districts. The Townhouse zoning district is granted a 10% reduction in lot size, 1/3 reduction in setback and 18% increase in density from 8.5 to 10 units/acre. In the commercial and office zoning districts, for every development right purchased a receiving site is granted a.15 FAR per acre. As of 2001, 829 TDRs had been used out of an estimated total of 4,500. There is substantial demand for additional development in Dade County. In the past, developers have found it was often cheaper to acquire TDRs than buy the additional land needed to accommodate additional housing units. To date, incorporated cities in Dade County do not accept TDRs from the unincorporated areas. 34
44 3.10. Island County, Washington In 1984 Island County adopted a TDR program with a 20:1 transfer ratio and a dramatic density bonus on receiving sites. Island County, population 72,000, consists of islands in the Puget Sound thirty miles northwest of Seattle. The County significantly reduced allowable development densities and adopted a TDR program to compensate property owners for the downzoning. The downzoning cut maximum allowable densities from 1 unit/2.5 acres to 1 unit/20 acres. In the original program, potential receiving sites consisted of land classified as Residential, Rural Residential, Agricultural and Forest Management. The RR zoned receiving parcels had a base density of 1/5 and were granted a density bonus of 1 unit/acre and 6 units/acre for 20 and 100 acre receiving parcels respectively. Developers were often not interested in gaining the additional development through the original TDR program and consequently the demand for transferred development rights was low. Over the course of the program 149 rights were transferred and 87 acres preserved. 35
45 Volume II: TDR Feasibility Analysis for Santa Barbara Ranch 36
46 4. Critical Issues Raised by A TDR Program for Santa Barbara Ranch The previous volume described five key components for success in a TDR program. Most TDR programs do not truly succeed unless all five components are handled skillfully. The Santa Barbara Ranch Project presents critical issues associated with all five components meaning a successful TDR program for the Santa Barbara Ranch Project probably cannot be designed unless all five components are effectively addressed. In our view, successfully addressing these five issues is a precondition for feasibility. 4.1 TDR Program Goals for Santa Barbara Ranch The first component of success is the establishment of clear TDR program goals. The County s Comprehensive Plan (general plan) and Local Coastal Program (LCP) both provide broad land use goals and policies. LCP Policy 2-13 of the Coastal Land Use Plan provides some guidance as well; indeed, its very existence suggests that the policy goal is to discourage urban development beyond the urban-rural service line, which would include the Santa Barbara Ranch Project. But there is no conservation or agricultural plan for the Santa Barbara Ranch area or for the Gaviota Coast as a whole. Nor are there County precedents because, although the County has previously examined the possibility of TDR programs, none have been implemented. It is not clear, however, what policy goal should be pursued if our analysis shows that it is feasible for some but not all of the proposed development rights to be transferred. Absent specific goals that identify or prioritize resources on the Santa Barbara Ranch property, analysis is based on the EIR scoping process and public discussion for guidance. Other than maintaining appropriate creek setbacks, biological resource protection does not appear to be a significant issue. The only significant cultural resource is confined to one of the building envelopes. However, the scoping process identified viewsheds, especially from Highway 101, as an issue of significance. Because viewshed impacts differ among different building envelopes, the question of viewshed is well-suited to serve as a program goal for a partial TDR transfer program. Therefore, the EIR s viewshed analysis identified critical viewshed locations were considerations in devising this alternative. 4.2 Prospects for Inter-Jurisdictional Cooperation 37
47 A second component of success is inter-jurisdictional cooperation if it is necessary for sending and receiving sites to be located in different jurisdictions. This is a significant issue in the case of Santa Barbara Ranch Project. LCP Policy 2-13 specifies that the TDR study must analyze the feasibility of transferring development rights into designated urban areas of Santa Barbara County, which could include within incorporated cities. But, as stated in the previous section, inter-jurisdictional agreements are the exception rather than the rule with TDRs. At least some of the incorporated cities of Santa Barbara County are unlikely to accept increased development from the unincorporated areas because they do not see the benefit to their residents or because they would rather provide additional density in exchange for a different goals, such as affordable or workforce housing. A city is likely to be interested in serving as a receiving area for Santa Barbara Ranch if doing so permits that city to obtain something that is otherwise not attainable. This suggests the best chances for success would lie with placing conditions of approval on the actions of other regulatory agencies, such as the California Coastal Commission. And it should go without saying that if interjurisdictional transfers are determined to not be plausible, a feasible alternative may be intra-jurisdictional transfers into urbanized portions of the unincorporated areas. 4.3 Range of Suitable Receiving Areas A third component of TDR success is the identification of suitable receiving and sending sites. For Santa Barbara Ranch, the sending area is identified by LCP Policy 2-13 and the Memorandum of Understanding language. But the question of suitable receiving sites, adequate to accommodate sufficient development that meets with public approval, is a major issue. Many potential receiving sites exist, but they must be assessed against several criteria. In our receiving-area analysis in Section 5, we will lay out these criteria in detail. However, selection of receiving sites must be based primarily on whether they possess sufficient market demand to absorb higher densities. The guiding question is: Will these potential sites motivate developers to purchase TDRs from the Santa Barbara Ranch Project to build additional units? Plausible sites must be large enough to absorb amounts of development with values similar to the aggregate value of the Santa Barbara Ranch property. As stated above, we believe optimal receiving sites typically exist if the sites are located in similar market areas to the sending site and within close proximity to one another. This serves to minimize transfer ratios and allow for equitable distribution of development transfer benefits and burdens. Transferring the development rights into urban receiving areas could violate these principles, because such transfer would require designation of receiving sites that are probably distant from and certainly dissimilar to the Naples Townsite. These 38
48 differences may increase political concerns as benefits and burdens may be distributed among several locations far distant from one another and must also require a very high transfer ratio (discussed below). Partly for this reason, we also briefly examine the possibility of receiving areas in other rural locations, especially along the Gaviota Coast. Such a transfer mechanism would appear to be outside the intent of Policy 2-13, because the policy is meant to deal the urban/rural service boundary line in western Goleta. However, other rural locations in Gaviota are more likely to have comparable land values, thus permitting lower transfer ratios. This analysis is not meant to suggest the rural-to-rural transfers could satisfy Policy 2-13 but, rather, was conducted to provide the County with a range of possible options. Due to timing issues discussed in a later paragraph, multiple small receiving areas are unlikely to prove feasible. Several large and appropriately valued receiving parcels will prove much more economically and administratively viable. In assessing the economic and political feasibility of the receiving areas, we used the three-step process depicted in the figure 5.1. Essentially, this is simply a screening process, using more detailed economic and political screenings in each step. 39
49 4.4 Adequate incentives for Santa Barbara Ranch Landowner(s) and Receiving Area Developers Perhaps the most important rule of success in TDRs is that sending and receiving area landowners must be provided with incentives that make the TDR route more attractive than alternative methods for development for either group. The geography of land values associated with the sending site (Santa Barbara Ranch Project) and the potential receiving sites poses some especially pertinent concerns. One major issue is the potential development value of the Santa Barbara Ranch Project is extremely high probably much higher than anyone could have anticipated at the time that LCP Policy 2-13 was adopted in This disparity creates a situation likely requiring a high transfer ratio between this sending area and any receiving area, unless the receiving area holds the potential of extremely high-value development. Thus, for a moderately priced urbanized area to serve as an effective receiving area, transfer ratios would have to be very high and a large increase in the overall amount of development in the receiving area would have to be contemplated. This may prove politically unacceptable to the receiving neighborhood or jurisdiction, and such a large increase in development may not be feasible under market conditions. This disparity also makes it more important to undertake the task of identifying the feasibility of a partial, rather than complete, transfer of development rights from the Santa Barbara Ranch Project. Importantly, the transfer mechanism will need to be structured such that the administrative process does not increase either the holding cost or the legal property rights -- for either the sending-area landowners or the receiving-area developers. Most TDR programs include many sending-area landowners and assume that they will participate in an ongoing market that unfolds over time. In the case of Santa Barbara Ranch Project, landowners have consolidated into one development proposal currently going through the entitlement process, meaning that a conventional TDR program might lead to a delay in the landowners plans to recoup their investment. Waiting for TDR buyers might discourage the sendingarea landowners from participating in the TDR program, as the landowners may fear that the market will be slow to materialize or undervalue their development rights. 40
50 Meanwhile, willing receiving-area developers need to be given similar reassurances. It must be clear that they can still seek to develop their property under pre-existing land-use regulations, but have the option of seeking higher density through the purchase of TDRs. For this reason, it is especially important to ensure that the increased density in the receiving areas will provide enough financial incentive to encourage developers to use the TDR route rather than traditional project entitlement. 4.5 Use of a Bank or Other Market-Making Mechanism The final component of success is the use of a TDR bank, which is often one of the most important aspects of successful TDR program. Given the unusual nature of the sending area property, a bank might be necessary. Traditional TDR programs function as an ongoing process, as sending and receiving area landowners engage in transfers and trades as market conditions permit. However, the sending area extremely high value suggests many future lot buyers will be making a lifestyle decision or engaging in speculation, rather than participating in a conventional decision associated with land economics. Therefore, it is our view that these potential lot buyers will not be motivated to sell their development rights even if it is in their financial advantage to do so. Thus, we conclude that if the transfer mechanism is to be successful, it will have to be executed up front prior to actual sale of the 54 newly created residential lots (72 in ALT 1) to individual buyers. This is likely to be accomplished in one of two ways. First, another landowner or developer may purchase the rights if they can be translated immediately into economically viable increased density elsewhere a structure much easier to accomplish if the receiving area is in the County rather than another jurisdiction. Second, a TDR bank might be created, seeded with money from multiple sources, to purchase some or all of the rights up front and then sell them off later to other landowners or developers in the receiving area. The up front aspect of this option would be similar to the up-front mitigation banking systems described briefly above. 41
51 5. Analysis of Receiving Sites The preliminary identification and additional screening of receiving sites was based on an evaluation of threshold criteria for both economic and political feasibility. LCP Policy 2-13 specifies that the receiving areas be located in urban areas of incorporated and unincorporated Santa Barbara County. We rely upon the County s Comprehensive Plan and associated community plans policies to clearly delineate rural from urban areas. For the purposes of this study, we identify urban areas as areas possessing two simultaneous qualities - areas lying within the County s current Urban Growth Boundaries (UGBs) and sites clearly depicted in an urban area in the relevant community plan. This section identifies a list of the most economically and politically feasible receiving sites from the above mentioned areas. The screening process is explained below and shown in Figure 5.1. Early public comments in the EIR process were concerned that the TDR study would do only a cursory analysis of a limited number of sites. We therefore took a comprehensive approach, and cast the net wide in our preliminary identification of sites so as to capture all sites with receiving site potential in the areas of study. With this in mind, sites were initially identified using comprehensive plans, land use maps, vacant/underdeveloped land inventories, and conversations with planning staff from the different jurisdictions. Many of these sites subsequently fell out of the analysis through two screening steps based on economic and political criteria. In regards to rural receiving sites, Policy 2-13 calls for an analysis of transferring density into urban receiving areas. However, in this study we also briefly assessed potential receiving sites in areas with rural designations along parts of Santa Barbara s South Coast. It is not our recommendation to execute a TDR program in a way that could be construed as violating Policy 2-13; rather, it is the goal of this report to show the full range of possibilities about how TDR transfers could be most effectively implemented. These sites subsequently fell out through the screening process and were not used in the final analysis of development transfers from Naples. 42
52 Figure 5.1 Receiving Site Screening Diagram 43
53 5.1 Economic Feasibility Our guiding principle regarding the economic feasibility of potential receiving sites is an assessment of whether the potential of prospective receiving-area parcels will motivate developers to purchase TDRs from the Santa Barbara Ranch to build additional units above the densities that are otherwise allowed. Thus, viable sites need to possess significant up-zone potential (i.e. the ability to absorb appreciably higher densities beyond pre-existing zoning). Optimal sites, in aggregate, must have the potential to absorb development values similar to some or all the proposed development envelopes proposed under the original MOU and ALT 1 proposals. In conducting this analysis, we chose to base the analysis on transferring development value, not development types. As we stated in Section 2.5, there are many different methods for creating the transfer mechanism, including a ratio of 1:1 (or more) for each residential unit. In this case, however, we chose to analyze receiving sites using the development value mechanism because most receiving sites are unlikely to be similar to Santa Barbara Ranch in character, value, or development potential. (This can, of course, be translated into a transfer ratio as well.) In other words, this study is not attempting to identify receiving sites that could only support 54 large houses (MOU) or 72 large houses (ALT 1). The currency transferred would not be specific housing types but, rather, development value. Therefore, transferred value may manifest itself in a receiving area in multiple housing types, such as townhomes or smaller single family units, depending on receiving site location and surrounding land uses. The initial economic screening assessed the total development value of the potential up-zone on the identified sites in relation to the total development value of the proposed Santa Barbara Ranch Project as determined in the hedonic analysis in section 6. We used a 10% threshold to screen sites for further analysis meaning that to pass the screen, sites must possess an up-zone development value that is at least 10% of the total development value of the MOU project (i.e. the estimated selling price of the land and improvements). Without this screen, it would be necessary to create too many small and disparate receiving areas for the system to work efficiently and smoothly. The second screening assessed developers willingness to pay for the TDRs, which more accurately reflects potential TDR value. Willingness to pay (WTP) is defined as the added land cost a developer is willing to incur for additional density while still acquiring a net profit that is 15% of total project revenues. In order to pass this second screen the site s total WTP needed to be at least 10% of the total development right value of the proposed MOU project (i.e. only the capitalized land value with entitlement plus developer profit, see section 6). It is important to note that developers will be motivated to buy TDRs not based on the total development value they receive but, rather, on the incremental increase in value the TDR will give them. Thus, the per unit WTP is always some fraction of the house value on the receiving site and realistically reflects the amount of 44
54 development each site could absorb from the Santa Barbara Ranch. The theory and methodology behind this explained in section Political Feasibility Potential receiving sites were simultaneously assessed and screened for their political feasibility, albeit in a more qualitative manner. Increasing the permitted density on targeted parcels will always prove a challenging task for planning agencies as sites face varying degrees of opposition depending upon their jurisdiction and location. In addition, certain planning agencies and city councils are more welcoming to the use of TDR than others. As with economic considerations, political considerations are assessed with a twostep screening process. Preliminary sites were identified using community/city general plans and conversations with the local planning staff based on the constraints of policy Some rural sites were included in the analysis, as we previously stated, but they were screened from ultimate consideration in this report in order to be honest to the true intent of policy Initial political screening assessed the spatial connection or distance between the Santa Barbara Ranch property and the sites identified to receive the development potential. As previously mentioned, one political criterion is that the benefits of preservation must be directly witnessed by those bearing the burdens of increased density in their jurisdiction. Sites in jurisdictions with adequate spatial connection to produce the requisite political support were subjected to a secondary screening for political feasibility. We assessed geo-political issues and cities attitudes towards inter-jurisdictional transfers through discussions with city and county staff. It is important to recall as well that inter-jurisdictional TDR systems typically are much more difficult to implement than transfers within a single jurisdiction. One significant political concern is the interplay between affordable housing and TDR policies, especially regarding sites in unincorporated Santa Barbara County that are being considered for possible density increases in the Housing Element. As some of the case studies indicated, a developer is less likely to seek additional density through a TDR if he or she must surrender some of the resulting profit to subsidize affordable housing. In the secondary screening, we used several affordable/workforce housing scenarios in the receiving areas and attempted to estimate the impact such policies would have on the receiving-area developers willingness to pay for TDRs. Many sites with receiving site potential possess agricultural zoning. The County has existing policies that seek to protect remaining agricultural land from adverse urban influence. However, certain agricultural sites exist inside the urban areas that may be better suited for development rather than productive agriculture especially if this facilitates preservation of Ag land outside the existing urban boundary. It is ultimately up to decision makers to determine whether land zoned 45
55 for agriculture inside the growth boundary could be appropriately used as receiving sites for Santa Barbara Ranch. In addition, we tried to acknowledge the role that non-local agencies, such as the California Coastal Commission and Santa Barbara County Local Agency Formation Commission could play. It may be possible for the Coastal Commission to condition a LCP amendment on the use of TDRs. As a final step in the second screen, for finalist candidate receiving sites, highlevel staff from the County, the relevant cities, and the Coastal Commission met to discuss the promise each candidate site possessed. This formed the basis of the final list of prospective receiver sites. 5.3 Preliminary List of Potential Receiving Sites We initially identified 79 areas throughout Santa Barbara County using broadbased criteria. Appendix A contains a comprehensive list and brief explanation of all 79 areas, while the maps in Appendix C show their geographical location. 5.4 Primary Screening We then evaluated all 79 areas based on an initial screening of both economic and political feasibility. All areas were evaluated for the value of their potential upzone. The total value of the estimated additional density is assessed relative to the total development value of the Santa Barbara Ranch MOU project. It is important to note that development value in this first screen does not directly reflect TDR value, but rather acts as a quick screen to identify sites for further analysis. As stated previously, we used a threshold of economic feasibility for receiving sites to possess a total value of increased density that is at least 10% of the total development value of the MOU project. That is to say the value of the increased density on the receiving site must meet or exceed 10% of $380 million estimated market price of units proposed in the MOU project (see Table 6.4 for MOU market values). The value of the increased density on the receiving sites was calculated by multiplying the estimated number of additional units under a TDR up-zone by the 2005 median selling price of a house in the given location. Median house sales information was obtained from the Economic Outlook for Santa Barbara County The degree of up-zone was estimated based on general site constraints, existing zoning, as well as the surrounding land uses and densities. Sites were concurrently assessed for their political feasibility by considering the distance between the Santa Barbara Ranch and the identified receiving site. The proximity of the sites to the sending area, in conjunction with the economic considerations mentioned above, help to identify sites for further analysis. 46
56 This screening process reduced the number of potential receiving areas from 79 to 26. The results of this initial screening are shown below in Table with the calculations in Appendix C. The sites themselves are shown in the maps in Appendix A. Many of the sites that dropped out were located inside North County cities. It was our judgment that these sites failed to meet two important political criteria: First, they are not in close enough proximity to Santa Barbara Ranch Project for those who feel the impact of increased density to also see obvious benefits. Second, they would require inter-jurisdictional agreements. We did, however, retain promising locations in the Santa Ynez Valley that are located in unincorporated areas. Many other sites dropped out because the up-zone potential had recently been realized for another purpose. The funk zone near downtown Santa Barbara, for example, had just been re-designated as mixed-use with the blessing of the Coastal Commission and we did not believe that another amendment to the Local Coastal Plan was feasible. Some other sites already had development proposals on them. Table Sites Passing 1st Screen (#s correspond to location on maps in Appendix A) Jurisdiction Site Description Unincorporated Urban South Coast. 26 acre Ag I -5 site with a limited Christmas tree farm operation, surrounded by medium density residential. Potential exists for upzone to 4.6 units/ac. Owner has (Map A) Noel Christmas Tree Farm (1) proposed development to the County in the past indicating a willingness to develop. 19 acre site zoned AG I-5 with 17 buildable acres near HWY 101. Site has been identified by County in the (Map A) MTD (7) DRAFT Potential Housing Opportunity A list for re-zone for affordable housing. Potential exists for up-zone to 4.6 units/ac. County owned 37.5 acre parcel zoned REC (0 units/ac) with some County administration buildings. 22 acres of site have been identified buildable in (Map A) County Campus North (9) the Draft Potential Housing Opportunity B list for re-zone. Potential exists for up-zone to 3.3 units/ac 47
57 Table Sites Passsing 1 st Screen (Continued) (Map A) St. Vincent s West (8) (Map A) City of Goleta More Mesa - East parcel (14d) (Map C) Montecito Orchard (2) (Map C) Montecito Area 3 (3) (Map D) Ellwood Canyon (1) (Map D) Couvillion (2) (Map D) Bishop Ranch (4) (Map D) Across from Camino Real Market Place (10) 33.4 acre site with low density DR-1 (1unit/ac) zoning in foothill area alongside HWY 154. The Goleta Community Plan Policy LUDS-GV-6 requires the St Vincent s East parcel to be included in the residential density calculation, but all units located on the western parcel. Site has been identified by County in the DRAFT Potential Housing Opportunity B list for rezone. Development proposals have been submitted to the County indicating a willingness to develop. Potential exists for up zone to 3.3 units/ac. The eastern 40 acre portion of More Mesa is entitled with 70 units of low density residential zoning (DR 1.8, 3.3, and.7). The site has varying degrees of up-zone potential due to habitat designations. We assume up zone to 3.3 units/ac on the inland portion. 30 acre site with AG I-5 zoning adjacent to Hwy 101 in Montecito. Site is surrounded by low to medium density residential housing. Potential exists for up zone to 1.8 units/acre acre parcel of very low density (1unit/3 acre) zoning. Parcel is surrounded by low /medium density residential housing. Potential exists for up-zone to1.8 units/acre. 33 acre parcel with AG I-10 zoning surrounded by medium density residential development. Potential exists for rezone to 4.6 units/acre. 14 acre parcel with AG II-40 zoning surrounded by medium density residential development. Potential exists for rezone to 4.6 units/acre. 287 acre parcel with AG II-40 zoning, not in agricultural production adjacent to Hwy 101. The owner (Larwin Development Co) has submitted a preliminary development proposal for a project with units, but the City insists on maintaining Ag zoning. Potential exists for rezone from Ag to 4.6 units/acre. 22 acre parcel zoned commercial which the City is considering for rezone to medium/high density residential uses. We assume up-zone potential to 20 units/acre. 48
58 Table Sites Passsing 1 st Screen (Continued) City of Santa Barbara (Map B) (Map B) (Map B) (Map B) (Map B) Wright Property East of Garden St. (3) City owned Re-Development site (5) City Parking Lot Louise Lowry (LL) City Parking Lot Cota/Santa Barbara sts. (CS) City Parking Lot Haley/Anacapa (HA) (Map B) Pony Lot (6) City of Carpinteria (Map F) Western Bluffs (1) 13.2 acre site located downtown near funk zone. Site has mixture of industrial and commercial zoning (HRC -2 and M-1). The potential exists to re-zone parts of the site to high density mixed use town homes at 20 units/acre similar to the Yanonali Townhomes on West side of Garden st. Site lies within the coastal zone 2.5 acres M-1 zoning located on the corner of Cabrillo and Caesar Chavez St. Potential for up zone to 20 units/acre. Site is within coastal zone.81 acre parking lot. City conducted a study in 2003 to assess redevelopment of site for affordable housing project that maintains the existing # of public parking lots on site. Potential exists for up zone to 50 units/acre. Site is located within coastal zone 1.46 acre parking lot. City conducted a study in 2003 to assess redevelopment of site for affordable housing project that maintains the existing # of public parking lots on site. Potential exists for up zone to 50 units/acre. Site is located within coastal zone 1.74 acre parking lot. City conducted a study in 2003 to assess redevelopment of site for affordable housing project that maintains the existing # of public parking lots on site. Site is located within coastal zone 1.7 acre City owned Redevelopment Agency parking lot located on ocean side of Cabrillo. Potential exists for upzone to 20 units/acre. Site is located within coastal zone and would require an amendment to the LCP to allow residential development south of the railroad tracks. 23 acre bluff top parcel currently zoned PUD. Under the PUD zoning we assume a baseline density of 1.8 units/acre and up zone potential to 3.3 units/acre. The owner has in the past submitted a development proposal for the site. Site is within coastal zone. 49
59 Table Sites Passsing 1 st Screen (Continued) Santa Ynez (Map G) Inventoried Inner rural parcels (Map G) Housing Summit Group Site #1 Orcutt (Map H) None 21 parcels (940 acres) with Ag I 40 zoning located between Los Olivos, Ballard, and Santa Ynez. The community supports the idea of upzoning parcels to surrounding rural residential densities of 1 unit /10 acres or 1/20 within the inner rural area. Parcel located between Solvang and urban Santa Ynez identified by the Santa Ynez Housing Summit Group for rezone from Ag I-10 to residential uses. Potential exists for up zone to 4.6 units/acre. Identified sites in Orcutt were determined to not possess the requisite spatial connection to the Santa Barbara Ranch to meet political threshold criteria needed to pass the first screen. See Appendix A for preliminary identified sites in Orcutt. City of Santa Maria (Map I) City of Lompoc Unincorporated Rural South Coast Unincorporated Gaviota Coast (Map E) None None Winchester- Ellwood Canyons (Rural 1a, Rural 1b, Rural 1c) 50 Identified sites in Santa Maria were determined to not possess the requisite spatial connection to the Santa Barbara Ranch to meet political threshold criteria needed to pass the first screen. See Appendix A for preliminary identified sites in Santa Maria. Identified sites in Lompoc were determined to not possess the requisite spatial connection to the Santa Barbara Ranch to meet political threshold criteria needed to pass the first screen. See Appendix A for preliminary identified sites in Lompoc. As mentioned, although these areas are beyond the scope of Policy 2-13, we explore them to show the full range of receiving site possibilities. Three potential parcels zoned Ag II- 100 located between the existing rural subdivision Rancho Embarcadero and Goleta s western urban limit line. Location is ideal for contiguous development with existing urban areas along Goleta s western edge. The parcels have potential for up-zone to surrounding area low to medium
60 51 residential densities of 1.8 and 3.3 units/acre. Parcel R1a was recently up for sale. Area is partially within coastal zone.
61 Table Sites Passsing 1 st Screen (Continued) Unincorporated Gaviota Coast (Map D) Unincorporated South Coast (Map A) Unincorporated South Coast (Map A) (Map C) Glen Annie Golf Course (Rural 2) Rural 4 Rural 3 Summerland eastern bluffs (Rural 6) 156 acre cluster of 3 parcels adjacent to the urban growth boundary on Goleta s western edge. The land is currently zoned agriculture but is in use as a golf course. The site has slope constraints suggesting 30% buildability at low to medium densities of 3.3 units/acre. The owner has recently expressed interest in using the land for residential purposes as the golf course is no longer profitable. 166 acre parcel located in foothills north of Cathedral Oaks rd, outside but adjacent to the current UGB with expansive views. Site is zoned AG II- 40. Due to slope constraints we assume up zone potential to low density 1 to 1.8 units/acre. Large 189 acre cluster of parcels with Ag I -20 zoning surrounded by low and medium density neighborhoods. Potential for up-zone to low density residential 1.8 units/acre. 30 acres of 5 bluff top parcels with 3- E-1 zoning (3 acre min). May have potential for up zone to 1 acre min zoning. Area has significant geologic constraints that would indicate only very low allowed densities. 52
62 5.5 Second Screening of Receiving Sites : Willingness To Pay for TDRs The secondary screening included a more rigorous analysis of economic feasibility, as well as a deeper investigation into the political feasibility, accomplished in large part by consulting officials at the relevant jurisdictions, including Santa Barbara County. Too often TDR markets fail because planners have overestimated the developers willingness to pay for increased density on designated receiving sites. We sought to overcome this problem by conducting a rigorous economic analysis to determine the true amount of development value each of the 26 sites in table could absorb. The results of this demand analysis are shown in Tables with the detailed calculations contained in Appendix D. What we sought to estimate was the probable value to a developer of an increased increment of density on a receiving site. From a theoretical standpoint, this is the difference between the land as it would be valued with underlying zoning and the land as it might be up-zoned. This amount is difficult to arrive at directly, but can be backed into by assessing developers costs, revenues and expected profits for different development scenarios given the receiving site characteristics. Developers incur an array of costs associated with a development project. These costs are carefully assessed relative to the aggregate risk inherent in a development project. 12 Given the current development environment in the area one of high land costs and lengthy entitlement processes - Santa Barbara County developers consider a development project to pencil out if the total revenue from sales can provide a net profit that is 15% of project revenues. 13 We measure developer s WTP for TDRs using the following basic formula: Willingness To Pay = Capitalized Land Value with TDR Up-Zone 14 Pre-Development Agreement Land Costs 15 In short, a developer s willingness to pay (WTP) for a TDR is simply the added land cost a developer is willing to incur for additional density while still acquiring a net profit that is 15% of total project revenues. Subtracted from this added land cost or TDR value should be the pre-development agreement land costs, if any, the 12 Development risk is the uncertainty inherent to housing and finance markets as well as construction costs which could act to diminish the revenue received in a project. 13 From conversations with Bermant Development Co, Investec Development Co., Comstock Homes & Towbes Group. 14 Capitalized land value is simply the added value raw land acquires with newly entitled higher density residential development. 15 Pre-development agreements typically involve the landowner acting as an equity partner who profit shares with the developer at the end of the project. This enables the landowner to capture a portion of the capitalized value the land acquires when it is up-zoned as a receiving site. In our model we assume the receiving site landowner captures 5% of project revenues. 53
63 developer pays the receiving site landowner. This definition should hold for any development project regardless of density or type. In our analysis we estimated the most plausible density increase based on land use realities of the site, including the site s urban or rural setting, its topographical constraints, and the development densities on surrounding, comparable properties. The density up-zone assumptions we use are modest and range from 1.8 units/acre to 4.6 units/acre in residential neighborhoods and 20 to 50 units/acre in downtown sites. Needless to say, many of these density increases are not currently contemplated in the local governments General Plans. If they were, the opportunity to increase those densities with the TDR tool would not be available. Our goal here is to estimate a plausible increase in density under a General Plan policy change that would incorporate the TDR alternative. In addition, we are sensitive, as we stated above, to the notion that TDRs are in competition with affordable or workforce housing requirements for the developer s dollar. Every dollar that a developer is required to invest in affordable housing is a dollar unavailable for investment in a TDR. For this reason, we determined developer willingness to pay under a 100% market-rate unit development and two workforce housing scenarios in which 15% and 30% of the units are set aside at a fixed below-market price 16. In all cases, developers are still willing to pay for TDRs; however, the dollar amount of that willingness to pay is less per unit. This is true largely because of Santa Barbara s remarkably strong residential housing market. Tables provides summaries of the maximum per unit and total developer willingness to pay for density increases under three scenarios in the 26 receiving areas that survived the first screen. Sites in possession of a total all market-rate WTP that is at least 10% of the total development right value 17 of the Santa Barbara Ranch MOU project (shown in Table 6.2) passed the second economic screen and were subjected to further political filtering. That is to say receiving site total WTP must roughly meet or exceed 10% of the estimated $165 million development right value of the MOU project to pass the second screen. At first glance, 10% would appear as too small a number for effective screening; however, when the total WTP from two and possibly three sites is aggregated and considered together as a likely receiving site scenario, the potential for transferred development is more significant. In general, we found that developers are generally willing to pay between 20% and 25% of the current selling price of residential units for the right to build additional 16 We base the selling price of these units on the reported values for a 4 person HH earning 120% - 200% of the 2004 area median income of $64,000. In the County controlled areas this equates to a mandatory selling price of $330,000/unit, and in the City of Santa Barbara $450, The development right value on the SBR is not the value of the development but rather the added value the land acquires with residential development plus the developer s expected profit; these values are determined for both the MOU and ALT 1 proposals in section 6. 54
64 units beyond baseline zoning densities. This conclusion was confirmed by developers we interviewed, and indicates that in a high-cost area such as Santa Barbara, purchasing higher density through TDRs is often an attractive and costefficient alternative to purchasing additional land. The total WTP amounts on the right-hand side of Table represent the theoretical maximum amount of money developers would be willing to pay to attain the overall density increase identified in the table. As stated above, some of these density increases are substantial and all are not contemplated in current General Plans. The actual political process might not yield such density increases. However, analysis suggests that they are similar to the densities already in place on adjacent developed parcels. Furthermore, in most cases (the parking lots within the City of Santa Barbara being the only exceptions), we did not assume 100% of the property would be suitable for construction. In most cases, we assumed that only between 15% and 60% of the property was buildable, depending on site constraints 18. In so doing we base our unit count calculations on the reduced buildable area to further reflect land use realities. However, there is little question that the market could support the densities and prices we examined, and that developers would pay such large dollar amounts for TDRs if they could be assured of higher densities in return. 18 We assume 60% of parcel size to be the default buildable area in cases with moderate site constraints. 55
65 Table Receiving Site WTP Summary Results #s in ( ) corresond to location on maps in Appendix A Jurisdiction Unincorporated Santa Barbara County SITE Gross acres Buildable Area Underlying Zoning (Units/Acre) Development Potential Scenario #1 100% Market rate Units) Development Potential w/ Underlying Zoning (# Units) Possible TDR- Based Rezoning (Units/Acre) Increased Development Potential w/ TDR- Based Rezoning (# Units) Maximum Total Development Potential (# Units) WTP Willingness to Pay (per Unit) Total TDR Value (WTP x # TDR units) Scenario #2 15% Workforce rate* Units) WTP Willingness to Pay (per Unit) Total TDR Value (WTP x # TDR units) Scenario #3 30% Workforce rate* Units) WTP Willingness to Pay (per Unit) Total TDR Value (WTP x # TDR units) South Coast Urban Noel Christmas Tree Farm (1) 26 60% $ 182,780 $ 12,567,984 $ 142,237 $ 9,780,212 $ 101,692 $ 6,992,343 MTD (7) 19 90% $ 198,847 $ 15,136,231 $ 158,301 $ 12,049,904 $ 117,756 $ 8,963,574 Map A County Campus (9) % $ 388,136 $ 28,178,706 $ 318,196 $ 23,101,059 $ 248,256 $ 18,023,377 St Vincents - West (8) % (including east) $ 443,136 $ 20,388,351 $ 337,322 $ 15,519,952 $ 231,510 $ 10,651,629 More Mesa (14d) % , 3.3, , 0, $ 825,247 $ 18,980,676 $ 291,297 $ 6,699,836 $ - $ - MAP C Montecito Orchard (2) % $ 582,619 $ 17,443,604 $ 499,350 $ 14,950,537 $ 416,081 $ 12,457,457 Montecito Area 3 (3) % $ 565,289 $ 10,816,243 $ 443,207 $ 8,480,341 $ 6,144,464 $ 321,128 City of Santa Barbara Wright Property - East (3) 13 60% $ 312,440 $ 48,703,164 $ 259,331 $ 40,424,584 $ 206,223 $ 32,146,005 Cota St City Parking Lot % $ 277,441 $ 20,253,216 $ 224,519 $ 16,389,886 $ 171,599 $ 12,526,710 Haley / Anacapa City Parking Lot % $ 278,088 $ 24,193,643 $ 225,165 $ 19,589,397 $ 172,244 $ 14,985,256 Map B Chapala / Carillo City Parking Lot % $ 67,255 $ 3,416,564 $ 14,334 $ 728,158 $ - $ - Lousie Lowry City Parking Lot % $ 294,801 $ 11,939,449 $ 241,880 $ 9,796,142 $ 188,959 $ 7,652,834 City Redevelopment Site (5) % $ 378,915 $ 15,156,606 $ 325,806 $ 13,032,239 $ 272,697 $ 10,907,892 Pony Lot Redevelopment Site (7) % $ 334,763 $ 9,373,352 $ 281,653 $ 7,886,280 $ 228,544 $ 6,399,237 South Coast Rural MAP E Winchester Canyon Vincent's Property (R1 a & b) % $ 283,267 $ 60,664,510 $ 229,912 $ 49,238,017 $ 176,557 $ 37,811,524 Cavalletto Property (R1 c) % $ 448,780 $ 15,707,309 $ 358,577 $ 12,550,200 $ 268,374 $ 9,393,092 MAP A Rural Area % $ 473,245 $ 45,459,914 $ 383,045 $ 36,795,256 $ 292,841 $ 28,130,310 Rural Area % $ 474,663 $ 41,124,808 $ 384,462 $ 33,309,791 $ 294,257 $ 25,494,451 MAP D Glen Annie Golf Course (rural 2) % $ 475,816 $ 39,606,884 $ 385,610 $ 32,098,248 $ 295,409 $ 24,589,875 MAP C Summerland-eastern bluffs (rural 6) % $ 747,745 $ 7,103,575 $ 579,233 $ 5,502,716 $ 410,725 $ 3,901,884 Santa Ynez Inner Rural Inner Rural Inventory - 21 parcels $ 167,785 $ 13,590,605 $ - $ - $ - $ - Map G (81 potential lot 1unit/10 ac) Housing Summit Group Site # % $ 129,864 $ 5,664,685 $ 100,857 $ 4,399,365 $ 71,848 $ 3,134,016 City of Carpinteria Map F Bluffs % $ 659,012 $ 13,641,557 $ 315,035 $ 6,521, City of Goleta Map D Ellwood Canyon (1) 33 60% $ 184,559 $ 16,440,539 $ 143,890 $ 12,817,716 $ 103,222 $ 9,195,058 Couvillion (2) 14 60% $ 184,371 $ 6,939,725 $ 143,704 $ 5,409,033 $ 103,036 $ 3,878,278 Bishop Ranch (4) % $ 185,819 $ 147,986,647 $ 145,152 $ 115,598,928 $ 104,484 $ 83,211,208 Across Camino Real (10) % $ 184,559 $ 16,440,539 $ 143,890 $ 12,817,716 $ 103,222 $ 9,195,058 * workforce indicates affordable unit selling price targeted to a 4 person HH household that is % of the Area Median Income (AMI) of $64,700. This translates to be $450,000 in the City of Santa Barbara and $330,000 in the County. 56
66 Unincorporated Urban South Coast (See Maps A and C, Appendix A) The potential receiving sites in the urban unincorporated South Coast include extremely valuable pieces of real estate that yield very high developers willingness to pay. The per unit TDR values on parcels around Goleta are in the vicinity of $180,000 to $400,000 for market rate units, while in the Montecito-Summerland area the TDR figure is as high as $582,000 and $747,000 respectively. Total WTP values for each site range from $7 million to $28 million. All sites in the urban areas of the unincorporated South Coast, as shown in table 5.5.1, except the Christmas Tree Farm and MTD sites, meet the 10% WTP threshold, and were further screened for political feasibility. County officials met to discuss the feasibility of the candidate sites in Table to provide a final truth check. The results of this final political screen winnowed the list down to four optimal sites for the purposes of this TDR study - they are: (1) County Campus - North, (2) St. Vincent s, (3) Montecito Orchard, (4) Montecito Area 3. The More Mesa site failed to pass the final political screen because of the sensitive resource values found on the property; this would lead the County to maintain the existing density not increase it. The MTD site fell out not only for economic reasons but also because of its priority for affordable housing. The Christmas Tree Farm was also screened out due to the history of previous development proposals. The County Campus has two definite benefits as a candidate TDR receiving site. First, it is controlled by the County. And second, it is situated in an area that has especially strong demand. In addition a second candidate site, the St Vincent s property, is adjacent and together those two properties could absorb appreciable amounts of development from the Santa Barbara Ranch Project. We assume a modest TDR up-zone to 3.3 units/acre on these sites, similar to surrounding neighborhood densities. See Appendix D for calculations of TDR demand for these sites. When considering the County Campus and St Vincent s sites, it is imperative to recognize the County s current effort to identify parcels for rezone to higher density affordable housing in its ongoing Housing Element update. More specifically, a visioning process and Community Plan update is soon to commence for the Goleta Planning Area the area in which these sites are located. It is important to point out that in identifying these sites as potential receiver sites, we are not advocating that they be rezoned for higher densities as part of the eventual TDR program. Those decisions are reserved onto the County Board of Supervisors with citizen input through such means as the Goleta Planning Area s Community Plan process. Our intent is simply to show that transfers of development is feasible onto these sites if the political will to rezone them exists. 57
67 The two sites passing final screening in Montecito the Orchard and Area 3 are surrounded by residential uses, and like the Christmas Tree farm offer infill opportunities as receiver sites. We estimated TDR demand on these sites under the assumption they would be rezoned to low density residential of 1.8 units/acre, similar to the surrounding parcels. Santa Ynez (see Map G, Appendix A) In the inner rural area of Santa Ynez converting the 21 identified parcels totaling 942 acres from 1 unit per 40 acre zoning to 1 units per 10 acre zoning could create up to $13.5 million in TDR demand; the Housing Summit Group site could create $5.6 million in TDR value if rezoned. However, because of their rural designation and their remoteness from the Gaviota Coast, we screened them from further consideration. City of Goleta (See Map D, Appendix A) Goleta contains significant development potential that could yield considerable developer TDR demand, generally in the vicinity of $180,000 per additional unit in the receiving areas. Most significantly, development of Bishop Ranch at 4.6 units per acre, a density comparable to surrounding areas, we estimate would yield up to $148 million in TDR value. In addition, sites for high density mixed-use development along the Holliser corridor something the Goleta City Council is strongly trying to promote, could fetch TDR values as high as $16 million. However, the new City of Goleta has explicitly rejected a policy that would have permitted the creation of receiving areas for the Gaviota Coast and has yet to adopt a General Plan. Therefore, all sites within the City limits of Goleta, despite their economic promise as receiving areas, were not considered politically feasible during the time of this study and are subsequently screened from further consideration. City of Santa Barbara (See Map B, Appendix A) Seven sites were identified in central Santa Barbara, including several city parking lots and other city owned parcels. Generally speaking, the value of each additional unit of density appears to be in the range of $200,000 to $300,000 depending on the workforce affordability component. The City owned parking lots offer unique benefits and challenges as receiving sites. Total TDR values range from $12 to $24 million. However, the City wishes to retain the current number of public parking spaces on these sites and also provide 58
68 workforce housing 19. These two forces would act to increase costs and thereby decrease developer WTP. Despite this, these costs are offset with the benefit of the parking lots being City owned, which essentially brings to zero any land costs developers may incur contingent upon replacement of the public parking. The City of Santa Barbara has shown some receptivity to the idea of creating receiver sites. Further screening with City officials winnowed sites in Table down to four candidate sites, these are: (1) Wright Property East, (2) Cota /Santa Barbara St Public Parking Lot, (3) Haley /Anacapa St Public Parking Lot, (4) City Redevelopment Site. The Louise Lowry lot was screened out because the City wishes to encourage higher-density redevelopment in its downtown core, not in the transition zone to lower-density residential neighborhoods that is, the area surrounding the Louise Lowry lot. The Coastal Commission staff has expressed receptivity to the idea of working with the City of Santa Barbara to require developers to acquire Santa Barbara Ranch TDRs in order to build at higher densities in those parcels in the City of Santa Barbara that are also in the coastal zone. Such a regulatory mechanism would require an amendment to the city s Local Coastal Plan. The Wright property East is surrounded by recent and pending development proposals similar to the scenario we use in this study. The western portion of the Wright Property has a development proposal pending for upwards of 150 units and the nearby Yanonali townhome project was built with a density of 18 units/acre. This would indicate that the property - currently zoned for industrial and light manufacturing purposes - is a prime candidate as a TDR receiving site as it will face intense future pressure to rezone for residential uses. For these reasons we assume in our calculations a TDR up-zone to 20 units/acre. The public parking lots have previously been identified for redevelopment by the City and therefore are likely receiving site candidates. One important point to make regarding the City lots is that in order to make such a project economically feasible and create a sufficient WTP, the density would have to increase to 50 units/acre. This would subsequently increase the building to a four- or five-story project and push the height up to but likely not above the 60 maximum allowed under current 19 The City of Santa Barbara completed a study in 2003 which assessed the feasibility of converting the downtown parking lots to affordable housing & public parking. This study served as the basis for our WTP analysis for the City owned parking lots. In so doing we assume the 15% and 30% workforce component we model is targeted to the household earning 121%-200% AMI equating to below market selling price of $450,
69 zoning. Because of this the height restriction would have to be relaxed in order to accommodate maximum potential of TDRs. For these public parking lots - which have been targeted for workforce housing as well as all the other identified sites, the political tradeoff remains between workforce housing and Santa Barbara Ranch Project TDRs. The more workforce housing that is required, the less developers will be willing to pay for the TDRs. City of Carpinteria (see Map F, Appendix A) The Carpinteria Bluffs 1 property is currently zoned for residential development under a PUD designation. A realistic base density assumption under the PUD designation is 1.8 units/acre. A modest TDR density bonus to 3.3 units/acre produces a TDR demand of $13.6 million and $6.5 million under 100% market rate and 15% workforce development scenarios respectively. Despite this, the City of Carpinteria shows minimal interest in pursuing such a transfer. For these reasons the site was screened from further analysis. Rural Unincorporated South Coast (see map E, Appendix A) The identified rural sites along the South Coast conducted as part of a separate analysis outside the bounds of Policy 2-13 would fetch significant developer TDR demand due to their commanding views and relatively large sizes. Total WTP values for each site range from $15 to $88 million with per unit values in the vicinity of $400,000. This reflects a significant potential for these areas as receiving sites under a TDR program not constrained by LCP policy Despite their promise as potential as receiving sites, however, they do not pass the second political screen. Their rural designation precludes them from being consistent with the legal goal of LCP policy If a TDR program were to be established wherein relocating development onto more appropriate rural lands was acceptable, these sites should be further considered. Of notable importance is the possibility of permitting low to medium-density subdivisions similar to adjacent subdivisions outside the urban growth boundary and within one mile of Santa Barbara Ranch on land that is currently zoned for agriculture. The two areas in Winchester Canyon - the Vincent properties and the Cavalletto property, we estimate could absorb up to $60 million and $15 million of development respectively. While outside the UGB, these sites are adjacent to it and in fill an area between the current urban limit line and the existing rural Rancho Embarcadero subdivision This eastern portion of the Gaviota Coast currently faces intense development pressure with several development proposals pending County/City of Goleta review: The Wallover property, Bacara Resort Expansion, Makar property, and the Eagle Canyon property. The Vincent property Rural 1a in map E was recently up for sale at $6 million. 60
70 In addition, rural sites with significant receiving site potential exist along the northern edge of the urban limit line. Sites Rural 3 and Rural 4 are clearly outside the current UGB. 5.6 Discussion of Realistic Assumptions and Likely Receiving Site Scenarios The economic and political considerations used in the secondary screening filtered the list of candidate sites down from 26 to a final list of eight optimal receiving sites four in the unincorporated urban south coast and four in the City of Santa Barbara. Our theoretical maximum density increases would produce vast potential among developers to purchase TDRs from Santa Barbara Ranch, but would also require a vast increase in residential development in the receiving areas. Here is a summary of those theoretical maximums taken from data on Table Unincorporated South Coast The four potential receiver sites are among the most desirable on the South Coast, and developers willingness to pay ranges from $318,000 to $499,000 per additional unit. On total acres in these four areas, an increase in allowable residential development from 27 to 195 units would create developers total willingness to pay of approximately $77 million. With a 15% workforce requirement that figure drops to $62 million and with a 30% workforce requirement, it drops further to $41 million. City of Santa Barbara The Wright Property - East, Cota Street City Parking Lot, Haley/Anacapa Parking Lot, and City Redevelopment Lot represent the potential to create 356 units on acres of land, creating a total developers willingness to pay of up to $108.3 million. Under 15% and 30% workforce housing scenarios this figure would drop to $89 million and $70 million respectively. Overall, therefore, our theoretical maximum scenario would involve rezoning some 141 acres in 8 different receiving areas, to increase residential development potential in those areas from 27 to 551 units, creating a developers total willingness to pay of slightly more than $185 million dollars (less under the workforce housing scenarios). It is important to note that we are not recommending such re-zonings. We are simply stating that, in those areas that passed both our economic and political feasibility screens, such potential exists. The actual feasibility of these receiving sites depends on the political willingness of both the City of Santa Barbara and Santa Barbara County to allow re-zonings. It is our judgment that the County could accommodate one, perhaps two, receiving areas in the South Coast accommodating 100 units. A likely scenario is some combination of the County Campus and St. Vincent s sites absorbing these
71 units with a 15% workforce requirement. A willingness to pay of between $318,196 and $337,322 per unit respectively, and assuming 50 units on each site, would create a realistic demand for Santa Barbara Ranch Project TDRs of $32.78 million. The City of Santa Barbara has indicated an interest only if other jurisdictions are willing to share the burden and accept additional units to protect the Naples property. Acting jointly with the County, the City may be willing to rezone to create at least the 73 units estimated on the Cota St. parking lot. Assuming a 15% workforce housing requirement, at a density of 50 units per acre, this would produce an overall willingness to pay of approximately $16.39 million. At most, the City may be willing to accept the 156 units associated with rezoning the Wright property- East to absorb Naples development. With a 15% workforce requirement, this would create a demand totaling $40.42 million. Receiving Site Analysis Conclusion Thus, it is our best estimate that the most economically and politically feasible scenario would be increasing densities by 100 units in unincorporated South Coast receiving areas and 156 units in City of Santa Barbara receiving areas, creating a total developers willingness to pay of up to $73.2 million. In other words, we believe that a conventional TDR program could create a pool of funds totaling $73.2 million that would be available to purchase development rights from Santa Barbara Ranch. However, as previously mentioned, the limiting factor affecting development transfers from the Santa Barbara Ranch Project is not the $73 million, but rather the amount of money that could be generated to purchase development rights up-front. We examine this amount in section 7 to provide plausible transfer scenarios and transfer ratios given the results of our developer WTP analysis. 62
72 6. Valuation of Santa Barbara Ranch Development Rights Evaluating the development potential of the receiving sites is only part of the equation in determining the feasibility of a transferring development rights off of the Santa Barbara Ranch site. In order to determine whether transfers are feasible, we must also estimate the value of the development rights themselves, and then compare the value of those development rights with the willingness to pay in economically and politically feasible receiving areas. A conventional sending-site analysis would begin with the existing parcels in the area in this case, the 219 parcels described in the Memorandum of Understanding. However, in the MOU development application, the applicant is proposing to merge those 219 parcels into 56 parcels. Of those 56 parcels, one is already developed and the applicant proposes no residential development on another. Therefore, we assume that the applicant has consolidated all development potential onto the remaining 54 lots, and it is the right to create residential building envelopes on these 54 lots in the MOU project that we must be concerned with (see Figure 1.4 in Preface). In addition we have conducted a valuation analysis on the 72 proposed rural estates under the ALT 1 proposal. The ALT 1 proposal removes 14 lots from the North side of Highway of which are in the coastal zone, and proposes creation of 32 additional lots - 16 of these units on the Dos Pueblos Ranch and 16 units on the northern portions of the Santa Barbara Ranch option property (see Figure 1.5 in Preface). We determined that the value of development rights equates to the capitalized land value plus the developer s expected profit. Capitalized land value is simply the added value the land acquires with newly entitled residential development. In simple form the value of the development right is calculated as follows: Development Right Value 21 = Capitalized Land Value + Developer s Expected Profit In other words, the value of development rights includes only the speculative value of the property given the possibility that it might be developed, and the additional value that the actual entitlements would endow on the property. Thus, our starting point was to estimate the final value of each lot. Because both applications included specifications for each lot and each house, we were able to estimate the final market value of each building envelope once the proposed house had been constructed. 21 See Appendix E part 2 for discussion of Development Right Valuation 63
73 We created these initial estimates via a hedonic model, which uses statistical regressions to determine the contribution various site and house attributes make in setting the sales prices of residential properties. In seeking comparable properties, we used sales of single-family residential properties located within the ZIP Code zones that abut the coast in the region of Malibu in Los Angeles County and in Ventura, Santa Barbara and San Luis Obispo Counties. Sales of vacant property were also considered, but there were too few sales during the time period in covered by the study to permit any meaningful statistical analysis. We used sales in the period between January 2000 and March 2005, but adjusted the prices based on indexes of California home price appreciation. The final dataset included 7,456 transactions. The precise methodology, along with a more detailed description of data sources and the statistical equation used to create the valuation model, is contained in Appendix D. Briefly, however, the empirical model attempted to break the aggregate value of a property into the values associated with its component parts, including the land, housing structure(s) on the parcel, parcel amenities and disamenities, and neighborhood or regional amenities and disamenities. The dependent variable was sale price (valuation) and the independent variables included the following: Lot square footage Structure square footage Age of the structure Number of bedrooms Number of bathrooms Dummy variable indicating the presence (1) or absence (0) of a pool Distance to the ocean in meters (ArcView) Distance in meters to nearest airport with scheduled commercial flights (ArcView) Distance in meters to the closest major thoroughfare (ArcView) Distance in meters to the nearest railroad line (ArcView) Percentage of residents of the census tract identifying themselves as white (Census 2000) Average journey to work in minutes reported for the census tract (Census 2000) Percent of unemployment reported for the census tract (Census 2000) Average annual household income reported for census tract (Census 2000) Percent of census tract residents below poverty line (Census 2000) Percent of vacant households in census tract (Census 2000) Median year of construction for houses in census tract (Census 2000) Dummy variables for Los Angeles, Santa Barbara, and San Luis Obispo Counties 64
74 Dummy variable indicating whether the property lies on the seaward or inland side of either US101 or Rte. 1 (Pacific Coast Highway), whichever is relevant for the particular property. A dummy variable is simply a binary variable that is coded in the database as either 0 or 1. The seaward/inland dummy variable was included as a variable in the regression on the complete dataset and was used to partition the dataset so that the seaward and inland properties could be studied separately to see if certain variables were relatively more or less important in these two areas. For these estimates, a parcel was defined as seaward (inland) if it was located closer to (further from) the ocean than the nearest major auto thoroughfare. In calculating the value estimates for each proposed parcel and house, we used two methods. One included the dummy variable to indicate whether they were seaward or inland relative to the 101. A second used the models specific to seaward and inland properties. These two methods reached similar conclusions. The seaward/inland model created a total valuation range of between $433 - $466 million, while the dummy variable model created a value of about $406 $498 million for the ALT 1 project with 70% and 100% project approval. After carefully assessing these two methods, we concluded that it was a tossup as to which one to choose, so we took the average of the two for each parcel. As Table 6.1 shows, this yielded a total development value of $485 million for the ALT 1 project at 100% and $417 million at 70%. The equivalent figures for the original proposal in Table 6.2 are $382 million at 100% and $326 million at 70%. It is important to note, however, that nearly half of this development value is contained in the nine proposed bluff-top lots. This model only estimated the market value of each lot as developed. We took additional steps to try to determine the actual development rights value. These other steps reduced the overall market value of the ALT 1 project to approximately $200 million and the MOU project to $166 million. As we will explain below, we altered the market value of each lot to account for: (1) the likelihood that the project will not be built for 2-4 years (2) the possibility that the project will not be approved as proposed Regarding the first factor we adjusted the initial market values (as determined in 2005) assuming 2008 and 2007 project approvals for Coastal Zone and inland lots respectively. This was accomplished by appreciating the 2005 values we estimated in the hedonic analysis using a forecast of annual median home price inflation (range of 9 8%). This was followed by discounting back to 2005 dollars with a forecasted % annual change in the CPI (range of %). A quick look at this would indicate that the longer the County waits, the more it will cost to transfer development from Naples. 65
75 In terms of the second factor, this project must be approved by both Santa Barbara County and the California Coastal Commission. The uncertainty inherent to the approval process makes it possible that the final project will be smaller than either the proposed MOU or ALT 1 projects. Although this is a moving target, it is often the case in Santa Barbara County for projects are approved well below their proposed unit counts. Because the unit count is contained in the MOU and ALT 1, we chose not to calculate a project with a decreased unit count, which would require us to speculate on which houses would be approved as part of the final project and which would not. In lieu of this, we chose to evaluate a scenario in which all houses were approved, but at 70% of their proposed size. This involved re-estimating values with smaller house sizes and subsequent lower bed and bathroom counts. Tables 6.1 and 6.2 on pages 65 and 66 illustrate the range of total values under these assumptions for the ALT 1 and MOU projects respectively. 66
76 Table 6.1 ALT 1 Range of Lot Values Table 6.1 ALT 1 Range of Lot Values Coastal Zone Lots Inland Lots Bluffs South 101 / North Railroad North 101 SBR Lots Option Property Lots Dos Pueblos Lots ALT 1 Range of Current Market Values Lot # Lot size (ac) House size (sf) Total Value - 100% project Total Value - 70% project per project plan per project plan (av. 2 methods, in 2005) (av. 2 methods, in 2005) ,564 $ 20,647,991 $ 18,554, ,069 $ 19,068,168 $ 16,893, ,707 $ 21,212,579 $ 18,293, ,461 $ 19,729,136 $ 12,712, ,909 $ 22,136,863 $ 18,076, ,119 $ 25,245,239 $ 18,867, ,274 $ 16,269,528 $ 14,380, ,084 $ 23,614,140 $ 20,124, ,400 $ 19,998,460 $ 17,823, ,992 $ 5,540,909 $ 4,956, ,676 $ 7,333,316 $ 6,458, ,847 $ 5,531,695 $ 4,859, ,035 $ 5,538,176 $ 4,772, ,144 $ 6,234,880 $ 5,364, ,112 $ 6,079,912 $ 5,230, ,524 $ 10,584,670 $ 9,540, $ - $ - DP ,104 $ 6,929,158 $ 6,110,346 DP-14 Existing unit $ - $ - DP ,990 $ 5,233,935 $ 4,541,823 DP ,852 $ 7,912,204 $ 7,095,975 DP ,035 $ 6,680,163 $ 5,789, ,467 $ 5,089,721 $ 3,908, ,792 $ 6,029,478 $ 3,828, ,223 $ 4,971,153 $ 4,751, ,919 $ 3,500,241 $ 3,094, ,948 $ 3,327,087 $ 3,949, ,832 $ 3,773,686 $ 2,935, ,944 $ 3,322,327 $ 2,932, ,346 $ 3,629,006 $ 3,213, ,607 $ 4,038,655 $ 3,519, ,010 $ 3,395,703 $ 3,020, ,129 $ 7,483,668 $ 6,605, ,757 $ 4,026,102 $ 4,089, ,363 $ 3,876,547 $ 3,379, Existing unit $ - $ - 52A ,512 $ 3,567,646 $ 3,130, ,097 $ 5,123,763 $ 4,524, ,160 $ 4,461,903 $ 3,981, ,256 $ 3,819,865 $ 3,384, ,938 $ 4,400,562 $ 3,896, ,700 $ 3,160,177 $ 2,755, ,980 $ 3,484,342 $ 3,037, B ,990 $ 1,296,433 $ 1,130, A 3.0 3,990 $ 4,356,986 $ 3,806, ,963 $ 3,989,340 $ 3,594, ,104 $ 3,440,930 $ 3,038, ,102 $ 3,640,372 $ 3,181, ,512 $ 4,280,714 $ 3,752, ,757 $ 4,298,524 $ 3,765, ,160 $ 3,885,822 $ 3,467, ,521 $ 2,903,129 $ 2,531, ,700 $ 2,989,223 $ 2,600, ,963 $ 3,241,161 $ 2,872, ,104 $ 3,581,595 $ 3,152, ,607 $ 4,814,621 $ 4,172, ,346 $ 4,991,466 $ 4,406, ,990 $ 3,481,209 $ 3,027, ,832 $ 3,822,149 $ 3,368, ,080 $ 3,611,161 $ 3,184, ,607 $ 5,009,081 $ 4,367, ,847 $ 3,414,121 $ 3,018, ,800 $ 3,243,365 $ 2,863,030 DP ,501 $ 4,342,061 $ 3,865,686 DP ,400 $ 4,566,421 $ 4,108,972 DP ,160 $ 4,225,751 $ 3,770,980 DP ,292 $ 4,806,655 $ 4,233,757 DP ,461 $ 5,019,777 $ 4,376,850 DP ,017 $ 4,136,910 $ 3,663,661 DP ,963 $ 4,059,380 $ 3,608,970 DP ,223 $ 4,543,233 $ 4,048,154 DP ,104 $ 4,005,701 $ 3,537,538 DP ,972 $ 4,207,759 $ 3,721,571 DP-11 2, ,223 $ 14,519,119 $ 12,938,159 DP ,112 $ 6,262,536 $ 5,429,001 TOTAL $ 484,989,461 $ 416,994,700 67
77 Table 6.2 MOU Range of Lot Values Table 6.2 MOU Range of Lot Values Coastal Zone Lots Inland Lots Bluffs South 101 / North Railroad North 101 MOU Range of Current Market Values Lot # Lot size (ac) House size (sf) Total Value - 100% project Total Value - 70% project per project plan per project plan (av. 2 methods, in 2005) (av. 2 methods, in 2005) ,564 $ 20,647,991 $ 18,554, ,069 $ 19,068,168 $ 16,893, ,707 $ 21,212,579 $ 18,293, ,461 $ 19,729,136 $ 12,712, ,909 $ 22,136,863 $ 18,076, ,119 $ 25,245,239 $ 18,867, ,274 $ 16,269,528 $ 14,380, ,084 $ 23,614,140 $ 20,124, ,400 $ 19,998,460 $ 17,823, ,992 $ 5,540,909 $ 4,956, ,676 $ 7,333,316 $ 6,458, ,847 $ 5,531,695 $ 4,859, ,035 $ 5,538,176 $ 4,772, ,144 $ 6,234,880 $ 5,364, ,112 $ 6,079,912 $ 5,230, ,524 $ 10,584,670 $ 9,540, $ - $ ,467 $ 5,089,721 $ 3,908, ,792 $ 6,029,478 $ 3,828, ,223 $ 4,971,153 $ 4,751, ,919 $5,408,373 $4,754, ,948 $ 3,327,087 $ 3,949, ,832 $ 3,773,686 $ 2,935, ,944 $ 3,322,327 $ 2,932, ,346 $4,174,588 $3,696, ,607 $3,749,549 $3,269, ,010 $ 3,395,703 $ 3,020, ,129 $5,464,654 $4,823, ,757 $ 4,026,102 $ 4,089, ,363 $1,443,252 $1,258, Existing unit $ - $ ,017 $5,328,641 $4,711, ,292 $4,490,219 $3,913, ,887 $4,415,527 $3,903, ,737 $3,860,217 $3,365, ,972 $3,721,092 $3,290, ,521 $5,678,123 $4,962, ,501 $3,695,858 $3,301, ,115 $3,934,044 $3,472, ,442 $4,119,489 $3,591, ,403 $3,849,066 $3,340, ,800 $3,904,824 $3,440, ,847 $3,638,781 $3,194,164 52B ,080 $3,198,822 $2,829, ,442 $3,118,420 $2,718,908 52A ,512 $3,164,914 $2,774, ,097 $4,072,474 $3,590, ,160 $3,677,247 $3,281, ,256 $3,866,624 $3,426, ,938 $3,705,133 $3,274, ,700 $ 3,160,177 $ 2,755, ,980 $ 3,484,342 $ 3,037, B ,990 $ 1,296,433 $ 1,130, A ,990 $2,143,337 $1,859, ,963 $ 3,989,340 $ 3,594, ,104 $ 3,440,930 $ 3,038,699 TOTAL $ 381,895,406 $ 325,929,778 MOU lots that were removed in ALT 1 68
78 To determine the actual value of the entitlements, we subtracted land costs, construction costs, site development costs, and financing costs developers incur in a project of this size. Similar to estimating WTP on the receiving sites, we assumed a project profit of 15% to back into the added value the land acquires with residential development. See Appendix E for detailed description of development right valuation. The underlying question we are trying to answer is how much money will it take encourage the developer of the Naples property to sell development rights rather than exercise them on the property. In answer to this, we identify the baseline amount for each Lot to be the capitalized land value plus the developer s expected profit not the project profit. In the development industry the common method of financing projects is both with a lending institution and private equity investors. These equity partners expect a higher return on their investments which is captured in a project profit split (usually 80%/20% investor/developer) at the end of the project. Since the money needed for development of certain lots would not be borrowed if development rights are sold, this extra profit should not be considered in the baseline. For this reason we take a modest approach and assume the developers expected profit to be 50% of the project profit. However, it is likely that some extra profit would be needed to encourage the Naples developer to sell and the process would ultimately be a negotiation between the TDR Bank and the developer. The final development right valuation results are contained in the following Table 6.3 for ALT 1 and Table 6.4 for the MOU proposal. Table 6.3 shows that the total development right value of the Santa Barbara Ranch ALT 1 Project is approximately $199 million, given our assumptions - 57% of that value ($113.6 million) is contained in the nine bluff-top parcels. The MOU project s total development right value is $165.7 million. 69
79 Table 6.3 ALT 1 Development Right Values Lot # Lot size (ac) House size (sf) Total Value (av. 2 methods at 70% project size) Development Costs (70% project) Project Profit (70% project) Capitalized land value (70% project) Developer profit (70% project) Development Right Value (70% project) Development Right Value (100% project) per project plan per project plan (adjusted to 2008 and 2007 $ for coastal zone & inland lots respectivel(see Appendix E) (15% total value) (50% project profit) (sum of residual land value & developer profit)(sum of residual land value & developer profit) Coastal Zone Lots Inland Lots Bluffs South 101 / North Railroad North 101 SBR Lots Option Property Lots Dos Pueblos Lots ,564 $ 21,774,919 $ 6,591,686 $ 3,266,260 $ 11,916,974 $ 1,633,130 $ 13,550,104 $ 16,411, ,069 $ 19,824,563 $ 5,773,452 $ 2,973,704 $ 11,077,407 $ 1,486,852 $ 12,564,259 $ 15,509, ,707 $ 21,467,979 $ 6,296,276 $ 3,220,197 $ 11,951,506 $ 1,610,098 $ 13,561,604 $ 17,363, ,461 $ 14,918,230 $ 4,906,736 $ 2,237,735 $ 7,773,759 $ 1,118,867 $ 8,892,626 $ 16,790, ,909 $ 21,213,705 $ 6,450,723 $ 3,182,056 $ 11,580,926 $ 1,591,028 $ 13,171,954 $ 18,153, ,119 $ 22,141,240 $ 8,143,994 $ 3,321,208 $ 10,676,038 $ 1,660,604 $ 12,336,642 $ 19,460, ,274 $ 16,876,407 $ 4,336,478 $ 2,531,461 $ 10,008,468 $ 1,265,731 $ 11,274,198 $ 13,958, ,084 $ 23,616,731 $ 7,105,860 $ 3,542,510 $ 12,968,361 $ 1,771,255 $ 14,739,616 $ 19,180, ,400 $ 20,917,032 $ 5,834,194 $ 3,137,576 $ 11,945,262 $ 1,568,788 $ 13,514,049 $ 16,604, ,992 $ 5,816,830 $ 3,194,924 $ 872,530 $ 1,749,376 $ 436,265 $ 2,185,641 $ 2,675, ,676 $ 7,579,372 $ 4,119,807 $ 1,136,913 $ 2,322,651 $ 568,457 $ 2,891,107 $ 3,662, ,847 $ 5,702,313 $ 3,250,333 $ 855,347 $ 1,596,633 $ 427,673 $ 2,024,306 $ 2,599, ,035 $ 5,601,028 $ 3,191,761 $ 840,154 $ 1,569,113 $ 420,077 $ 1,989,191 $ 2,651, ,144 $ 6,295,084 $ 3,039,336 $ 944,269 $ 2,311,479 $ 472,134 $ 2,783,613 $ 3,695, ,112 $ 6,137,742 $ 4,085,785 $ 920,661 $ 1,131,295 $ 460,331 $ 1,591,626 $ 2,186, ,524 $ 11,195,998 $ 7,582,610 $ 1,679,400 $ 1,933,989 $ 839,700 $ 2,773,689 $ 3,535, $ - $ - $ - $ - $ - $ - $ - DP ,104 $ 7,170,718 $ 4,005,222 $ 1,075,608 $ 2,089,888 $ 537,804 $ 2,627,692 $ 3,458,463 DP-14 Existing unit $ - $ - $ - $ - $ - DP ,990 $ 5,329,998 $ 2,661,843 $ 799,494 $ 1,868,661 $ 399,747 $ 2,268,408 $ 3,027,095 DP ,852 $ 8,327,391 $ 4,031,598 $ 1,249,100 $ 3,046,693 $ 624,550 $ 3,671,243 $ 4,609,987 DP ,035 $ 6,794,745 $ 3,727,854 $ 1,019,212 $ 2,047,679 $ 509,606 $ 2,557,285 $ 3,442, ,467 $ 4,587,331 $ 1,881,865 $ 688,100 $ 2,017,366 $ 344,050 $ 2,361,416 $ 3,564, ,792 $ 4,493,423 $ 2,710,758 $ 674,013 $ 1,108,651 $ 337,007 $ 1,445,658 $ 3,460, ,223 $ 5,576,641 $ 4,156,187 $ 836,502 $ 583,952 $ 418,251 $ 1,002,203 $ 871, ,919 $ 3,631,543 $ 2,074,460 $ 544,732 $ 1,012,351 $ 272,366 $ 1,284,717 $ 1,651, ,948 $ 4,635,459 $ 2,341,094 $ 695,319 $ 1,599,046 $ 347,659 $ 1,946,706 $ 1,202, ,832 $ 3,444,804 $ 2,337,599 $ 516,721 $ 590,485 $ 258,360 $ 848,845 $ 1,584, ,944 $ 3,441,614 $ 2,231,632 $ 516,242 $ 693,740 $ 258,121 $ 951,861 $ 1,199, ,346 $ 3,771,515 $ 3,309,927 $ - $ 461,588 $ - $ 461,588 $ 922, ,607 $ 4,130,650 $ 3,045,117 $ 619,593 $ 465,940 $ 309,797 $ 775,737 $ 1,068, ,010 $ 3,545,232 $ 2,542,067 $ 597,748 $ 405,417 $ 298,874 $ 704,291 $ 752, ,129 $ 7,751,818 $ 3,090,806 $ 1,162,773 $ 3,498,239 $ 581,386 $ 4,079,626 $ 5,110, ,757 $ 4,799,023 $ 3,667,328 $ 719,849 $ 411,846 $ 359,924 $ 771,770 $ 308, ,363 $ 3,966,189 $ 2,297,092 $ 594,924 $ 1,074,173 $ 297,462 $ 1,371,635 $ 1,822, Existing unit $ - $ - $ - $ - 52A ,512 $ 3,493,693 $ 2,776,204 $ 524,054 $ 193,435 $ 262,027 $ 455,462 $ 598, ,097 $ 5,049,279 $ 3,881,917 $ 757,397 $ 409,965 $ 378,698 $ 788,663 $ 1,195, ,160 $ 4,443,515 $ 3,378,008 $ 666,532 $ 398,976 $ 333,266 $ 732,242 $ 934, ,256 $ 3,777,102 $ 2,538,097 $ 566,565 $ 672,440 $ 283,283 $ 955,723 $ 1,226, ,938 $ 4,348,714 $ 3,234,732 $ 652,307 $ 461,675 $ 326,154 $ 787,828 $ 1,026, ,700 $ 3,074,774 $ 2,114,412 $ 461,219 $ 499,143 $ 230,610 $ 729,752 $ 965, ,980 $ 3,390,123 $ 2,583,661 $ 508,522 $ 297,940 $ 254,261 $ 552,201 $ 743, B ,990 $ 1,261,616 $ 1,261,616 $ - $ - $ - $ - $ (445,451) 107A 3.0 3,990 $ 4,247,434 $ 1,939,011 $ 637,115 $ 1,671,308 $ 318,558 $ 1,989,866 $ 2,523, ,963 $ 4,011,156 $ 2,812,571 $ 601,673 $ 596,911 $ 300,837 $ 897,748 $ 1,084, ,104 $ 3,391,027 $ 2,626,436 $ 508,654 $ 255,937 $ 254,327 $ 510,264 $ 645, ,102 $ 3,550,075 $ 2,287,873 $ 532,508 $ 729,694 $ 266,254 $ 995,948 $ 1,287, ,512 $ 4,188,146 $ 2,895,457 $ 628,222 $ 664,468 $ 314,111 $ 978,579 $ 1,266, ,757 $ 4,201,860 $ 3,588,402 $ 613,459 $ - $ 306,729 $ 306,729 $ 398, ,160 $ 3,869,732 $ 2,997,234 $ 580,456 $ 292,041 $ 290,228 $ 582,269 $ 678, ,521 $ 2,824,958 $ 1,929,444 $ 423,741 $ 471,773 $ 211,870 $ 683,643 $ 882, ,700 $ 2,901,624 $ 1,996,301 $ 435,244 $ 470,079 $ 217,622 $ 687,701 $ 894, ,963 $ 3,205,123 $ 2,463,030 $ 480,768 $ 261,324 $ 240,384 $ 501,708 $ 601, ,104 $ 3,518,198 $ 2,574,668 $ 527,726 $ 415,803 $ 263,863 $ 679,666 $ 851, ,607 $ 4,656,768 $ 3,314,334 $ 698,511 $ 643,924 $ 349,255 $ 993,179 $ 1,364, ,346 $ 4,916,914 $ 3,384,830 $ 737,537 $ 794,547 $ 368,769 $ 1,163,315 $ 1,522, ,990 $ 3,379,059 $ 1,908,864 $ 506,855 $ 963,340 $ 253,428 $ 1,216,767 $ 1,585, ,832 $ 3,758,518 $ 2,292,824 $ 563,778 $ 901,916 $ 281,889 $ 1,183,805 $ 1,509, ,080 $ 3,553,179 $ 2,896,984 $ 532,977 $ 123,218 $ 266,488 $ 389,706 $ 478, ,607 $ 4,873,678 $ 3,439,440 $ 731,052 $ 703,187 $ 365,526 $ 1,068,713 $ 1,456, ,847 $ 3,368,809 $ 2,458,222 $ 505,321 $ 405,266 $ 252,661 $ 657,926 $ 807, ,800 $ 3,194,989 $ 2,095,465 $ 479,248 $ 620,276 $ 239,624 $ 859,900 $ 1,071,145 DP ,501 $ 4,313,900 $ 2,980,626 $ 647,081 $ 686,193 $ 323,540 $ 1,009,734 $ 1,255,519 DP ,400 $ 4,585,394 $ 3,617,915 $ 687,809 $ 279,670 $ 343,905 $ 623,575 $ 706,574 DP ,160 $ 4,208,214 $ 3,139,465 $ 631,228 $ 437,521 $ 315,614 $ 753,135 $ 912,175 DP ,292 $ 4,724,648 $ 3,371,086 $ 708,697 $ 644,866 $ 354,349 $ 999,214 $ 1,336,168 DP ,461 $ 4,884,332 $ 3,759,005 $ 732,650 $ 392,678 $ 366,325 $ 759,003 $ 1,067,748 DP ,017 $ 4,088,451 $ 2,729,707 $ 613,264 $ 745,480 $ 306,632 $ 1,052,112 $ 1,319,600 DP ,963 $ 4,027,418 $ 2,702,164 $ 604,113 $ 721,142 $ 302,056 $ 1,023,198 $ 1,267,594 DP ,223 $ 4,517,525 $ 3,524,401 $ 677,629 $ 315,494 $ 338,814 $ 654,309 $ 785,689 DP ,104 $ 3,947,704 $ 2,743,737 $ 592,156 $ 611,811 $ 296,078 $ 907,889 $ 1,152,151 DP ,972 $ 4,153,076 $ 3,061,425 $ 622,957 $ 468,693 $ 311,479 $ 780,172 $ 983,193 DP-11 2, ,223 $ 14,438,298 $ 4,722,542 $ 2,165,745 $ 7,550,012 $ 1,082,872 $ 8,632,884 $ 10,537,678 DP ,112 $ 6,058,476 $ 4,181,728 $ 908,765 $ 967,983 $ 454,383 $ 1,422,366 $ 1,950,663 TOTAL $ 480,874,763 $ 246,220,241 $ 71,425,442 $ 163,229,080 $ 35,712,721 $ 198,941,801 $ 262,928,409 67
80 Table 6.4 MOU Development Right Values Total Value Lot # Lot size (ac) House size (sf) (av. 2 methods at 70% project size) Development Costs (70% project) Project Profit (70% project) Capitalized land value (70% project) Developer profit (70% project) Development Right Value (70% project) Development Right Value (100% project) per project plan per project plan (adjusted to 2008 and 2007 $ for coastal zone & inland lots respectively(see Appendix E) (15% total value) (50% project profit) (sum of residual land value & developer profit) (sum of residual land value & developer profit) Coastal Zone Lots In la n d L o ts Bluffs South 101 / North R ailro a d North ,564 $ 21,774,919 $ 6,591,686 $ 3,266,260 $ 11,916,974 $ 1,633,130 $ 13,550,104 $ 16,411, ,069 $ 19,824,563 $ 5,773,452 $ 2,973,704 $ 11,077,407 $ 1,486,852 $ 12,564,259 $ 15,509, ,707 $ 21,467,979 $ 6,296,276 $ 3,220,197 $ 11,951,506 $ 1,610,098 $ 13,561,604 $ 17,363, ,461 $ 14,918,230 $ 4,906,736 $ 2,237,735 $ 7,773,759 $ 1,118,867 $ 8,892,626 $ 16,790, ,909 $ 21,213,705 $ 6,450,723 $ 3,182,056 $ 11,580,926 $ 1,591,028 $ 13,171,954 $ 18,153, ,119 $ 22,141,240 $ 8,143,994 $ 3,321,208 $ 10,676,038 $ 1,660,604 $ 12,336,642 $ 19,460, ,274 $ 16,876,407 $ 4,336,478 $ 2,531,461 $ 10,008,468 $ 1,265,731 $ 11,274,198 $ 13,958, ,084 $ 23,616,731 $ 7,105,860 $ 3,542,510 $ 12,968,361 $ 1,771,255 $ 14,739,616 $ 19,180, ,400 $ 20,917,032 $ 5,834,194 $ 3,137,576 $ 11,945,262 $ 1,568,788 $ 13,514,049 $ 16,604, ,992 $ 5,816,830 $ 3,194,924 $ 872,530 $ 1,749,376 $ 436,265 $ 2,185,641 $ 2,675, ,676 $ 7,579,372 $ 4,119,807 $ 1,136,913 $ 2,322,651 $ 568,457 $ 2,891,107 $ 3,662, ,847 $ 5,702,313 $ 3,250,333 $ 855,347 $ 1,596,633 $ 427,673 $ 2,024,306 $ 2,599, ,035 $ 5,601,028 $ 3,191,761 $ 840,154 $ 1,569,113 $ 420,077 $ 1,989,191 $ 2,651, ,144 $ 6,295,084 $ 3,039,336 $ 944,269 $ 2,311,479 $ 472,134 $ 2,783,613 $ 3,695, ,112 $ 6,137,742 $ 4,085,785 $ 920,661 $ 1,131,295 $ 460,331 $ 1,591,626 $ 2,186, ,524 $ 11,195,998 $ 7,582,610 $ 1,679,400 $ 1,933,989 $ 839,700 $ 2,773,689 $ 3,535, $ - $ - $ - $ - $ - $ - $ ,467 $ 4,587,331 $ 1,881,865 $ 688,100 $ 2,017,366 $ 344,050 $ 2,361,416 $ 3,564, ,792 $ 4,493,423 $ 2,710,758 $ 674,013 $ 1,108,651 $ 337,007 $ 1,445,658 $ 3,460, ,223 $ 5,576,641 $ 4,156,187 $ 836,502 $ 583,952 $ 418,251 $ 1,002,203 $ 871, ,919 $ 5,579,961 $ 2,072,323 $ 836,989 $ 2,670,649 $ 418,494 $ 3,089,144 $ 3,866, ,948 $ 4,635,459 $ 2,341,094 $ 695,319 $ 1,599,046 $ 347,659 $ 1,946,706 $ 1,202, ,832 $ 3,444,804 $ 2,337,599 $ 516,721 $ 590,485 $ 258,360 $ 848,845 $ 1,584, ,944 $ 3,441,614 $ 2,231,632 $ 516,242 $ 693,740 $ 258,121 $ 951,861 $ 1,199, ,346 $ 4,338,391 $ 2,974,063 $ 650,759 $ 713,569 $ 325,379 $ 1,038,949 $ 1,326, ,607 $ 3,836,635 $ 2,839,960 $ 575,495 $ 421,179 $ 287,748 $ 708,927 $ 938, ,010 $ 3,545,232 $ 2,542,067 $ 597,748 $ 405,417 $ 298,874 $ 704,291 $ 752, ,129 $ 5,660,310 $ 4,077,449 $ 849,047 $ 733,814 $ 424,523 $ 1,158,337 $ 1,779, ,757 $ 4,799,023 $ 3,667,328 $ 719,849 $ 411,846 $ 359,924 $ 771,770 $ 308, ,363 $ 1,476,638 $ 1,679,622 $ (202,984) $ - $ (101,492) $ (101,492) $ (382,226) 132 Existing unit $ - $ - $ - $ - $ ,017 $ 5,528,813 $ 4,261,684 $ 829,327 $ 437,802 $ 414,664 $ 852,465 $ 1,229, ,292 $ 4,592,130 $ 3,290,683 $ 688,819 $ 612,627 $ 344,410 $ 957,037 $ 1,188, ,887 $ 4,581,480 $ 3,259,221 $ 687,217 $ 635,042 $ 343,609 $ 978,651 $ 1,307, ,737 $ 3,949,189 $ 2,404,116 $ 592,378 $ 952,694 $ 296,189 $ 1,248,883 $ 1,664, ,972 $ 3,862,091 $ 2,967,933 $ 579,314 $ 314,844 $ 289,657 $ 604,501 $ 751, ,521 $ 5,823,702 $ 2,301,657 $ 873,550 $ 2,648,496 $ 436,775 $ 3,085,271 $ 3,895, ,501 $ 3,873,958 $ 2,806,844 $ 581,094 $ 486,021 $ 290,547 $ 776,567 $ 927, ,115 $ 4,075,217 $ 2,537,683 $ 611,283 $ 926,251 $ 305,641 $ 1,231,892 $ 1,588, ,442 $ 4,214,606 $ 2,485,383 $ 632,187 $ 1,097,036 $ 316,093 $ 1,413,130 $ 1,909, ,403 $ 3,920,693 $ 2,262,110 $ 588,104 $ 1,070,479 $ 294,052 $ 1,364,531 $ 1,820, ,800 $ 4,038,006 $ 2,652,783 $ 605,705 $ 779,518 $ 302,852 $ 1,082,370 $ 1,423, ,847 $ 3,564,517 $ 2,665,010 $ 487,661 $ 411,846 $ 243,831 $ 655,677 $ 845,981 52B ,080 $ 3,157,259 $ 2,852,037 $ 305,222 $ - $ 152,611 $ 152,611 $ 69, ,442 $ 3,034,157 $ 2,021,906 $ 455,123 $ 557,127 $ 227,562 $ 784,689 $ 1,034,241 52A ,512 $ 3,096,459 $ 2,650,972 $ 445,487 $ - $ 222,744 $ 222,744 $ 279, ,097 $ 4,007,001 $ 3,080,922 $ 601,054 $ 325,025 $ 300,527 $ 625,552 $ 834, ,160 $ 3,661,986 $ 3,014,545 $ 549,302 $ 98,140 $ 274,651 $ 372,790 $ 430, ,256 $ 3,823,348 $ 2,552,150 $ 573,502 $ 697,696 $ 286,751 $ 984,447 $ 1,264, ,938 $ 3,654,698 $ 2,937,451 $ 548,208 $ 169,039 $ 274,104 $ 443,143 $ 554, ,700 $ 3,074,774 $ 2,114,412 $ 461,219 $ 499,143 $ 230,610 $ 729,752 $ 965, ,980 $ 3,390,123 $ 2,583,661 $ 508,522 $ 297,940 $ 254,261 $ 552,201 $ 743, B ,990 $ 1,261,616 $ 1,261,616 $ - $ - $ - $ - $ (445,451) 107A ,990 $ 2,075,263 $ 1,638,050 $ 311,291 $ 125,921 $ 155,646 $ 281,567 $ 380, ,963 $ 4,011,156 $ 4,011,156 $ 2,812,571 $ 601,673 $ 596,911 $ 300,837 $ 1,084, ,104 $ 3,391,027 $ 3,391,027 $ 2,626,436 $ 508,654 $ 255,937 $ 254,327 $ 645,858 TOTAL $ 380,157,901 $ 187,420,915 $ 60,570,355 $ 138,715,966 $ 28,418,522 $ 165,726,476 $ 221,307,164 68
81 7. Assessment of TDR Transfer Mechanisms and Viability of a TDR Bank Based on our assessment of sending-site valuation and receiving-site potential, we conclude that at least a partial transfer of density off of Santa Barbara Ranch is feasible. However, we believe this feasibility depends on the ability to set up the TDR system in the following way: Density would have to be transferred off of Santa Barbara Ranch upfront, rather than over time. This would require the creation of a TDR Bank to buy, hold, and eventually sell the rights. The TDR Bank would have to be well capitalized in order to execute the up-front purchase. The County would have to construct a carefully calibrated system of density credits for the receiver sites and reinforce this system through its regulatory decisions Up-front Transactions/TDR Bank v. A Traditional TDR Market A traditional TDR program creates a market in which trades occur over time. In the case of Santa Barbara Ranch, this would mean that current landowners or future owners of the lots that would be created under the development proposal would have the option of selling their development rights to landowners or developers in the receiving areas at any point in the future. They would also have the option of building instead of selling. In order to provide sending-site landowners with an incentive to sell their development rights, they would have to obtain considerably more value through the sale of development rights than through exercising them. This is why transfer ratios in traditional TDR programs are often 3:1 or even 5:1 because they must account not only for compensating the landowner for extinguishing the rights on the sending site, but also to provide the sending-site landowner with a financial incentive to sell his or her rights rather than exercise them on-site. Let s take an example from the analysis above. Suppose, for example, the Santa Barbara Ranch Project applicant wished to sell the development right to Lot 12 one of the bluff-top lots to a developer of the County Campus receiving site in the unincorporated South Coast. We have calculated the value of development rights on Lot 12 to be approximately $11.27 million. We have calculated the developer s willingness to pay for additional density on the County Campus site to be approximately $318,196 per unit for a 15% workforce project. 69
82 Thus, for the applicant to be fully compensated by a prospective developer of the County Campus site, the transfer ratio between those two properties would have to be 35 to 1 ($11.27 divided by $318,196). That is, the developer of the County Campus would have to be assured of increasing density from 0 units to 35 units in order to justify the payment of $11.27 million to extinguish the right to build one house in Santa Barbara Ranch held by the owner of Lot 12. In contrast, inland Lot 109 with development right valued at $1.445 million, by the same method would only generate a transfer ratio of 4.5 to 1. This is merely the break-even point, however the point at which the owner of Lot 12 is fully compensated for his or her development right. In a classic TDR program, however, the sending-site landowner must also be provided with an additional financial incentive, because TDR program participation is voluntary. While our estimate of the development right includes the expected profit the owner(s) of the Santa Barbara Ranch Project expects, the value of selling the development right must be greater than the value of exercising it. This extra profit may be required to motivate the sending-site landowner to choose selling rather than building. In the example above, providing the sending-site landowner an additional profit would require increasing the transfer ratio. Alternatively, the landowner may simply be willing to avoid the development process if he is fully compensated with the expected profit that he would receive at the end of the development project. A traditional TDR program also provides no guarantee that all development will be moved (because it is optional); and the resulting land pattern can be somewhat patchy, as adjacent property owners make different decisions about whether to sell TDRs or exercise them on-site. A future owner of Parcel 12 might sell his or her development rights; but the lot owners on either side might not. The resulting pattern may or may not create a pattern of development that achieves land conservation goals. For these reasons and others, as we have stated above, most TDR programs do not succeed without the use of some type of bank. Such a bank can stimulate the market for TDRs at the beginning and then help to maintain market equilibrium over time. These goals are accomplished by capitalizing the bank at the beginning so it can purchase development rights up-front; and by holding or selling development rights over time, given the needs of the TDR marketplace at any given time. In the particular case of Santa Barbara Ranch Project, we believe there is one other factor to consider. The attractiveness of coastal lots may be so great to future lot-buyers that they may not respond to economic incentives in a typical TDR marketplace. That is, even if it is more economically attractive to sell development rights if they could reap a 15% or 30% or even 50% profit for selling relative to building -- the lot owners may not do so, because their purchase of the lots was probably driven by lifestyle considerations and not economic considerations. This is certainly the lesson from the unsuccessful Oxnard TDR 70
83 program, which sought to transfer development rights from coastal to inland areas. We also believe that an advantage to an up-front deal is that the current project applicant would be willing to surrender development rights for the value of entitlements as we have identified them here; whereas subsequent lot owners, if they are interested in selling at all, might expect much greater transfer ratios that would be far more expensive in the long run. For these reason, it is our conclusion a TDR program for Santa Barbara Ranch will not be feasible if it must depend on a conventional TDR market that unfolds over time. Rather, it is our conclusion that feasibility rests on: 1. The creation or designation of a TDR Bank 2. The ability of the TDR Bank to purchase all development rights up front. The bank can then hold those rights and sell them to property owners or developers in receiving areas, whether in the County or in the City, in the future. In this sense, the TDR Bank resembles a mitigation bank. In most cases, the TDR Bank is operated by another government agency with a transactional land conservation mission or by a nonprofit organization. In the case of Lake Tahoe, the TDR bank is administered by the California Tahoe Conservancy, which is a land conservation agency. (The regulatory agency is the Tahoe Regional Planning Commission.) In the case of the Cambria TDR program, the TDR bank is administered by a local land conservation organization, the Land Conservancy of San Luis Obispo County, whereas the regulatory agency is the county. In the case of Santa Barbara Ranch, we see no existing government agency that would be an obvious choice to serve as the TDR bank. One might need to be created. However, we believe there are any number of reputable local and national land conservation organizations currently operating in the Santa Barbara area, including The Trust for Public Land, that could serve this function Approach To Transfer Ratios As we have explained in this report, a traditional TDR system creates a set of transfer ratios between sending and receiving sites. Every development right in the sending area equates to a certain number of development rights in the receiving area. This transfer ratio might be anywhere from 1:1 to upwards of 20:1 or 30:1 depending on valuation differences between sending and receiving areas. This ratio is intended to provide fair compensation to the sending-site landowners for their development rights, as well as sufficient financial incentive for them to sell their rights rather than exercise them on-site. 71
84 We do not recommend a traditional transfer ratio approach here. There are several reasons for this: We are not recommending the creation of a classic TDR system in which the market unfolds over time. The disparity between the value of one unit in sending areas and one unit in receiving areas is very large. The disparity in the value among units in the sending area is very large. The disparity in the willingness to pay among prospective receiving sites is also very large. Rather, we recommend a hybrid 3-step approach that works as follows: 1. Purchase: Up front, the TDR Bank would purchase development rights from Santa Barbara Ranch based on the estimations of entitlement value for each parcel calculated in this report. For example, if the Bank had $20 million, it would purchase the development rights on any combination of lots whose development rights value totaled $20 million. The TDR Bank would then have $20 million in credit from Santa Barbara Ranch that could be applied to receiving areas 2. Assign: The County (and, potentially, the City) would create and value density credits in the receiving areas based on the willingness to pay analysis for the additional density in those areas, and then assign those Density Credits to the TDR Bank. For example, if the County were willing to rezone the St Vincent s property to accommodate more units if the developer participates in the TDR program (as our analysis suggests is possible), the County would create 46 Density Credits at a price of $337,322 each. If the City were willing to rezone the Cota parking lot to accommodate residential units, then the City would create 73 Density Credits at a price of approximately $224,500 each. See Table Sell: These density credits would then be sold by the TDR Bank at the assigned value to willing developers in the receiving areas at any time at the market price. The total value of these Density Credits acquired by the bank would be the same as the total value of the Development Rights purchased by the TDR Bank from Santa Barbara Ranch Project. For example, if the TDR Bank had $20 million worth of credit from Santa Barbara Ranch, it could sell all of the available Density Credits to developers of the St. Vincent s property for about $15.5 million (i.e. 46 x $337,322) and have about $4.5 million left over to sell developers willing to build 20 units on the Cota site. It is very important to note that, as the land-use regulators in this scenario, the County and the City would become regulators of the currency (the Density Credits) much as the Federal Reserve Bank is the regulator of the money supply. That is, the County and the City must commit themselves to stabilizing the Density Credits by (1) honoring them when a developer holds them; and (2) not providing additional density to receiving-area developers by other means. 72
85 Obviously, neither the Board of Supervisors nor the City Council can commit their successors to specific regulatory actions in this process, but they can certainly adopt policies that would commit them to the TDR system. 7-3 Capitalization Of TDR Bank A second critical question is how to capitalize the bank with enough funds to purchase TDRs from the project applicant. If the transfer of development rights off of Santa Barbara Ranch is to be executed up-front, then the feasibility of the transfer system is driven not by some theoretical calculation of sending and receiving site value, but on the actual amount of money that can be raised to stake the TDR bank. It must be stressed that unlike typical land conservation initiatives, the money used to seed the bank is not paid and never to be seen again. Rather the initial contributors of funds can be repaid once the TDR Bank starts selling density credits or the money can be used as a revolving fund for continued preservation. The most obvious conventional source of funds for staking a TDR bank would be local and state land conservation bond funds. This was the method used in the Pinelands in New Jersey for the TDR program; over time, a total of $50 million in various state land conservation funds were placed in the hands of the TDR Bank. A somewhat similar method was used in Lake Tahoe, where the California Tahoe Conservancy used state bond funds dedicated to Lake Tahoe both to purchase land and development rights. Since 2000, California state voters have passed more than $2 billion in state bond funds for land conservation through Propositions 12, 13, 40, and 50. These bond funds were the source of most of the funding for the purchase of El Capitan Canyon. Most of these funds are accounted for but it might be possible to obtain some funds to stake the TDR Bank. Land conservation advocates are seeking to place another measure on the ballot in Funds for the TDR Bank could be earmarked in this legislation Private philanthropic resources represent another potential funding source. Many land conservation arrangements in the Santa Barbara have been executed with the assistance of financial donations from philanthropists and philanthropic organizations. The Trust for Public Land (TPL), as recently as 2003 generated $19.7 million for the successful preservation of Ellwood Mesa. In this deal TPL negotiated with the landowner and potential developer to relocate a 130 entitled lots from Ellwood Mesa to a finally settled upon 62 unit project on a 12 acre County park site a short distance away. While not an official TDR, the Ellwood deal, which essentially bought-down and relocated density indicates that the potential to raise money to seed a TDR Bank with $20 million is potentially feasible. 73
86 Furthermore, the American Land Conservancy is actively pursuing fundraising for targeted conservation easement purchases on parcels very near the Naples site. The Santa Barbara Land Trust is also active in land preservation in Santa Barbara County especially along the Gaviota Coast. In addition, foundations throughout California have dedicated an increasing amount of financial resources to land conservation in recent years. The Packard Foundation recently completed a five-year $175 million statewide program of land conservation, although the geographical area targeted by the foundation did not include the South Coast. More recently, the Resources Legacy Fund Foundation, which administered the Packard program, has launched a variety of land and marine conservation efforts on a philanthropic basis. These are provided only as examples. Based on our research and experience in other situations, we believe that in order to attract either governmental or philanthropic resources, the TDR Bank would probably have to meet two conditions. First, these funding sources which would mostly be located outside the region - - would have to see a financial commitment from local sources as well. This is typical of funding requirements in land conservation, especially in an affluent area. There are at least four potential funding sources for the TDR Bank: 1. Local philanthropists. Santa Barbara is blessed with many local philanthropists, some of whom have an interest in land conservation along the Gaviota Coast. These resources should be strongly considered in staking the TDR bank. 2. Local governments. Assuming all the receiving areas are located in both the City of Santa Barbara and Santa Barbara County, these two local government agencies could provide up-front funds. The City of Santa Barbara Redevelopment Agency, although currently limited in its funding capacity, might use the TDR Bank to facilitate higher-density (and, hence, higher-value) development in both downtown Santa Barbara and in industrial areas south of the 101 Freeway. This is similar to the experience in South Lake Tahoe, where the redevelopment agency banked hotel/motel TDRs from around the city and used them to facilitate development of a large new hotel. This is an especially promising possibility if higher density development in the coastal zone requires TDRs. 3. Coastal Resource Enhancement Fund (CREF) Grants. Santa Barbara County established CREF in 1987 to help mitigate significant impacts of offshore oil and gas development to coastal aesthetics, coastal recreation, coastal tourism, and environmentally sensitive coastal resources. Approximately half of these mitigation funds have been used to acquire coastal properties or conservation easements. For example, CREF helped 74
87 purchase key bluff-top properties, such as the Carpinteria Bluffs, the Douglas property in the City of Santa Barbara, Santa Barbara Shores in Ellwood, and Point Sal near Guadalupe. CREF has devoted nearly $8 million directly toward land acquisition since its inception. 4. The Santa Barbara Ranch applicant and the Naples Townsite landowners. The applicant and the landowners could also provide funds to stake the bank and reap the resulting benefit of a tax deduction and/or potential increase in development credit value over time. The second condition that would have to be met to attract both outside interest and local philanthropic interest would be that participating in the TDR Bank would probably have to be an attractive alternative to simply purchasing land for conservation elsewhere on the Gaviota Coast. There is considerable interest among land conservation organizations and philanthropic interests in the Gaviota Coast, and outright purchase or land is often viewed by land conservationists as preferable to investment in a TDR system. However, if it is successful, the TDR Bank could play a larger role in land conservation on the Gaviota Coast. By purchasing development rights from Santa Barbara Ranch Project up-front and then selling density credits to developers in the receiving-site areas over time, the TDR Bank could reap a profit if the value of the density credits in the receiving areas appreciates. This profit could be used to purchase land elsewhere on the Gaviota Coast or development rights on other Gaviota Coast properties if the TDR program were expanded to include other sending sites in the future. Obviously, this possibility involves both risk to the Bank and possible rewards for both the Bank and land conservation efforts. If the value of density credits in the receiving areas appreciates over time, the Bank would turn a profit and could be used as, essentially, a revolving fund for land conservation throughout the Gaviota Coast. This possibility would make the Bank far more attractive to potential public and philanthropic investors. On the other hand, if the value of the density credits decrease, the Bank would lose money. 7-4 Development Transfer Scenarios If a TDR Bank were set up and capitalized, this would permit the Bank to purchase Development Rights from some parcels on Santa Barbara Ranch and, over time, sell some Density Credits to receiving areas in the City of Santa Barbara and unincorporated areas of the South coast. If the TDR system is created, the final configuration of the Santa Barbara Ranch Project will depend on how much financial capital the bank has and what program goals those resources are used to achieve. The final distribution of density in the receiving areas depends, once again, on the value of the Density Credits the Bank has and the City and County priorities for increasing density. 75
88 We explore scenarios 1-3 which illustrate how the TDR system might work for the ALT 1 project proposal. The factors we must consider in creating these scenarios include the following: 1. Which Development Rights to remove from Santa Barbara /Dos Pueblos Ranch 2. How many Development Rights to remove from Santa Barbara Ranch 3. Which receiving areas should receive the bulk of the Density credits 4. How much money the TDR Bank has to invest in Development Rights up front. Scenario #1 Goal: to reduce the overall development intensity regardless of view shed impact. Under this scenario residential lots possessing the lowest development right value would be prioritized for transfer. Scenario #2 Goal: to transfer the most visible developmentss from Highway 101. Scenario #3 Goal: to transfer bluff-top units directly above Naples Beach nearest beach access These represent the most likely set of possible transfer scenarios. In each scenario we calculate the number of units transferred in the ALT 1 project assuming the TDR Bank is capitalized with both $20 and $40 million. We use these scenarios simply as examples. We are not suggesting that $20 million, $40 million, or any other amount is a magic number required to make the system work. However, we feel $20 million is a likely starting point given our analysis of funding opportunities. Also, the number of development rights shown to be transferred in each of the scenarios is based on the conclusions in our receiving site analysis- that is, the candidate sites and their associated WTP values estimated based on a 15% affordable/workforce component in section 5. Table 7.4 shows the number of units potentially transferred as well as the transfer ratios with these scenarios using the ALT 1 proposal of 72 new rural estates. With $20 million bank capitalization, the TDR Bank would have the choice of removing the 29 least expensive lots; 16 of the most visible lots from Highway 101 north of freeway; or two bluff-top lots. Among the density increase options for a jurisdiction working in isolation would be to place 60 units in the County Campus/St. Vincent s area or about 40 units on the County Montecito Orchard site. In the City, 78 units could be placed on the Wright property; or 73 units on the Cota parking lot. It should be pointed out that at 73 units the Cota site is built out at our density assumptions and would only 76
89 create $18.5 worth of density credits resulting in a few less lots transferred as that shown in Table 7.4. An important alternative to consider is as a joint County City arrangement of receiving sites. Option #5 in Table 7.4 shows that if the County Campus accepted 31 units and the City Cota Lot accepted 44 units, $20 million worth of Naples development could be transferred. With $40 million bank capitalization, the TDR bank would have the choice of removing the 47 least expensive lots; 27 highly visible lots north and south of Highway 101; or 4-5 bluff-top lots. Among the density increase options, in a joint County City transfer, option 1 would be to place about 73 units on County Campus and 73 at the Cota Parking lot; or option 2 placing 46 at St. Vincent s and 94 on the Wright Property. The average transfer ratios in Table 7.4 are simply the average development right value of the lots in each of the three scenarios divided by the respective receiving site willingness to pay. The ratios illustrate the significant disparity in value between the bluff-top lots and other lots in the ALT 1 proposal. For example, the average transfer ratio of all four sites, when considering lowest valued lots is generally 2:1; when considering lots with significant Highway 101 view impacts it increases to around 4:1- due to higher value lots. But when trying to transfer bluff-top lots (the highest valued lots) the transfer ratio jumps to between 30 and 40:1. 77
90 Table 7.4 Example Transfer Scenarios (ALT 1) Table 7.4 Example Transfer Scenarios (ALT 1 project) Scenario 1: Maximum amount Development Transfers Scenario 2: Transfer Development to protect HWY 101 viewshed Scenario 3: Transfer Bluff-top Developments Bank Capitilization $20 million $20 million $20 million # Development Rights Transferred ALT 1 Lot #s Transferred Receiving Site Density Credits A 137 DP DP-2 52A DP DP DP DP Total Development Right Value $19,795,583 $20,245,943 $20,166,825 option option 1 2 option 3 option option 2 option 1 option 5 4 County Campus # of units WTP per unit $ 318,196 $ 318,196 $ 318,196 av. transfer ratio 2 : 1 4 : 1 32 : 1 and and and St Vincents # units WTP per unit $ 337,322 $ 337,322 $ 337,322 av. transfer ratio 2 : 1 4 : 1 30 : 1 Montecito Orchard # units WTP per unit $ 499,350 $ 499,350 $ 499,350 av. transfer ratio 1.4 : : 1 20 : 1 Wright Property East # units WTP per unit $ 259,331 $ 259,331 $ 259,331 av. transfer ratio 2.6 : 1 5 : 1 39 : 1 Cota Parking Lot # units WTP per unit $ 224,519 $ 224,519 $ 224,519 av. transfer ratio 3 : : 1 45 : 1 County Campus # of units WTP per unit $ 318,196 $ 318,196 $ 318,196 av. transfer ratio 2.1 : 1 4 : : 1 and and and Cota Parking Lot # units WTP per unit $ 224,519 $ 224,519 $ 224,519 av. transfer ratio 3 : : 1 45 : 1 Bank Capitilization # Development Rights Transferred ALT 1 Lot #s Transferred Receiving Site Density Credits $40 million $40 million $45 million A 137 DP additional lots DP-2 52A DP DP-8 additional lots DP DP additional lots DP-1 70 DP DP-7 69 DP DP DP-12 DP Total Development Right Value $38,962,451 $40,064, $45,067,726 County Campus # of units WTP per unit $ 318,196 $ 318,196 $ 318,196 av. transfer ratio 2.6 : : 1 35 : 1 and and and Cota Parking Lot # units WTP per unit $ 224,519 $ 224,519 $ 224,519 av. transfer ratio 4 : 1 7 : 1 50 : 1 Wright Property East # units WTP per unit $ 259,331 $ 259,331 $ 259,331 av. transfer ratio 3 : 1 6 : 1 43 : 1 and and and St Vincents # units WTP per unit $ 337,322 $ 337,322 $ 337,322 av. transfer ratio 2.5 : : 1 35 : 1 Remaining 5 candidate Receiving Site Statistics per unit WTP City Redevelopment Site $ 325,806 Haley / Anacap Parkign Lot $ 225,165 Montecito Orchard $ 499,350 Monetcito Area 3 $ 443,207 The av transfer ratio is calculated by dividing the average development right value of the lots transferred by the WTP for each receiving site 78
91 8. Conclusion In conclusion, we find that it is potentially feasible, both economically and politically, to transfer some development from the Santa Barbara Ranch to selected receiver sites in unincorporated South Coast areas and in the City of Santa Barbara. As a threshold matter, feasibility depends on whether the County and/or the City of Santa Barbara are willing to up-zone candidate receiving sites to modest residential densities. If so, the amount of development transferred depends on what the County deems most important reducing overall development intensity, preserving the public viewshed from Highway 101, or eliminating development from the coastal bluff-tops. If the County were to place highest priority on preserving the public viewshed, then we believe it is feasibly to create a TDR program that would permit construction of about 4 additional housing units in selected receiver sites in unincorporated areas and in the City of Santa Barbara for every 1 view-impacting house that is removed from the Santa Barbara Ranch project. In order to derive these conclusions, we used a series of screening steps to winnow 80 identified receiving sites down to a list of 8 candidate receiving sites. Theoretically these optimal sites could absorb $185 million worth of development value (less under workforce scenarios) with an increase from 27 to 552 units built. However, given the realities of land use along the south coast and the current political debate over affordable housing, a realistic scenario is for an increase of about 100 units in both jurisdictions with 15% of these additional units targeted to workforce housing. Under this assumption, the dollar amount of development the candidate sites could absorb was reduced to 73.2 million as compared to the $166 million and $199 million necessary to extinguish the potential development rights of the MOU and ALT 1 projects respectively. However, this amount does not determine the number of transfers from the Santa Barbara Ranch Project it simply indicates that a strong demand exists for these development rights. Rather, the amount of money raised to execute up-front purchases of development rights from the Santa Barbara Ranch Project will ultimately determine the extent to which development is transferred. We estimate that a minimum of $20 million is needed to capitalize a TDR Bank for up-front purchases, but we believe this is not unrealistic given potential funding sources and the history of the Ellwood Mesa deal. It must be stressed that unlike typical land conservation initiatives, the initial contributors of the $20 million can be repaid once the TDR program starts selling density credits. Alternatively, the money can be used as a revolving fund for continued preservation in the area. Under the assumption that raising $20 million maybe realistic, we show for example, that it is potentially feasible to transfer 16 of the most visible lots from Highway 101 in a manner that affirms the property rights of all the involved stakeholders. This would indicate that some, but not all, the development from the Santa Barbara Ranch Project could be transferred. The feasibility scenarios 79
92 we identify do not appear to reduce densities enough to permit development under current agricultural zoning, apparently justifying a new land use and zoning designation as indicated under policy 2-13 of the County s Local Coastal Plan. 80
93 Volume III: Appendices Appendix A: Receiving Site Maps Appendix B: Preliminary Receiving Site Identification (see County Planning & Development web site for complete list of sites analyzed) Appendix C: Primary Receiving Site Screening (see County Planning & Development web site for complete technical Appendix) Appendix D: Secondary Receiving Site Screening Willingness To Pay for TDRs (see County Planning & Development web site for complete technical Appendix) Appendix E: MOU & ALT 1 Development Right Valuations (see County Planning & Development web site for complete technical Appendix) 81
94 APPENDIX A: RECEIVING SITE MAPS 82
95 Map A : Unincorporated Urban South Coast 83
96 Map B : City of Santa Barbara 84
97 Map C : Montecito & Summerland 85
98 Map D : City of Goleta 86

99 Map E : Unincorporated Rural Gaviota Coast 87

100 Map F : City of Carpinteria 88

101 Map G : Santa Ynez 89
102 Map H : Orcutt 90
103 Map I : Santa Maria 91
104 Appendix B: PRELIMINARY RECEIVING SITE IDENTIFICATION Potential Receiving Sites in Unincorporated Urban South Coast (see map A) Sites within the existing urban growth boundary of the unincorporated South Coast with receiving site potential are located either north or south of Highway 101. In addition areas exist in Isla Vista as indicated for higher density in the IV Comprehensive Plan, as well sites in and around the Summerland/Montecito areas. All of these potential sites vary significantly in their current zoning, geography and subsequent value. Sites range in location and attributes, ranging from ocean bluffs with prominent ocean views, Santa Ynez mountain foothill sites, agricultural sites, to urban transportation corridor locations. The up-zone potential of these sites varies depending upon surrounding land uses, densities and site topographical constraints. The unincorporated areas of the South Coast have a notorious history of residents unaccepting of infill development, especially at increased densities. Therefore many of these sites, while possessing the economic potential, may have limited political traction as viable receiving sites. Especially noteworthy in this regards in the Patterson Ag block which the community has strongly committed to retaining its agricultural zoning. In addition some of the identified receiving sites are being considered for re-zone for affordable housing. Residents of the areas surrounding these potential affordable sites are averse to the notion of high densities typical of affordable housing and are more amenable to the idea of medium density market rate units that would come with a rezone as a receiving site. This presents a challenging situation for decision makers in this area of the South Coast - weighing the tradeoffs of providing affordable units with preserving open space. Table 1 Potential Receiving Sites in Urban Unincorporated Urban South Coast (#s correspond to locations on Maps A, C) A. Sites north of 101, from HWY 154 to Goleta City limits Noel Christmas Tree Farm (1) 26 acre Ag I -5 site with a limited Christmas tree farm operation, surrounded by medium density residential. Potential exists for up-zone to 4.6 units/ac. Owner has proposed development to the County in the past indicating a willingness to develop. Area 2 (2a,2b) 2 clusters of parcels with low density residential zoning (1-E-1 and DR 1.8) totaling 20 acres; sites have the potential to up-zone to surrounding medium density. Area 4 (4) Clustering of parcels with low density residential zoning (1-E-1). 1 unit per acre Area 5 (5) Clustering of parcels with low density residential zoning (1-E-1); site possesses significant topographical constraints Area 6 (6) Clustering of parcels with very low density residential zoning (3- E-1). 1 unit/3 acres. MTD (7) 19 acre site zoned AG I-5 with 17 buildable acres near HWY 101. Site has been identified by County in the DRAFT Potential Housing Opportunity A list for re-zone for affordable housing. Potential exists for up-zone to 4.6 units/ac. 92
105 St Vincents west (8) San Marcos Foothills (10) County Campus North (9) B. Sites south of HWY 101 South Patterson Ag Block (11a) Public Utilities Parcel (11b) San Marcos Ag Block (12) San Simeon School site (13) Sites Surrounding More Mesa (14 a,b,c,d) Hope Ranch vacant parcels (15 a,b) 33.4 acre site with low density DR-1 (1unit/ac) zoning in foothill area alongside HWY 154. The Goleta Community Plan Policy LUDS-GV-6 requires all units located on the western most parcel. Site has been identified by County in the DRAFT Potential Housing Opportunity B list for re-zone. Development proposals have been submitted to the County indicating a willingness to develop. Potential exists for up zone to 3.3 units/ac. Large cluster of parcels totaling 377acres. The County recently approved a development proposal from Bermant Development Co. for a total of 15 market rate and 5 affordable units on 50 acres of the site. All though after the fact, an interesting question is how much would the developer be willing to pay to add extra units on this site? Because the site has just completed a lengthy approval process we assume limited potential to increase density beyond the 20 units. County owned 37.5 acre parcel zoned REC (0 units/ac) with some County administration buildings. 22 acres of site have been identified buildable in the Draft Potential Housing Opportunity B list for re-zone. Potential exists for up-zone to 3.3 units/ac 313 acre site with Ag zoning; site is currently under intensive agricultural use. Limited political support for re-zone to residential 147 acre bluff parcel located near Goleta beach. Currently used for underground gas storage. Site is currently unavailable for residential uses 51 acre Ag cluster surrounded by residential and commercial uses. Limited political support for re-zone to residential 23 acre low density (DR 3.3) residential site with potential to increase density but limited value due to proximity to HWY 101 and the relatively high baseline zoning Potential sites surround the existing open space bluff of More Mesa to the west, north and east. To the west sites, possess Ag and low density residential zoning. To the north is a County owned parcel with environmental constraints and sites with low density residential zoning. To the East, the owner of More Mesa has building potential on 40 acres at low density residential zoning. All these sites have varying degrees of up-zone potential High value parcels both along the bluffs east of More Mesa and parcels further inland with existing low density zoning (1 unit/2.5, 3.5). Hope Ranch CC&Rs have minimum lot size requirements of 1 unit/1.5 acres. Potential may exist to up-zone these parcels to the 1.5 ac zoning. Las Positas (16) 130 acre cluster with low density RR-20 zoning, but significant hillside constraints. Up-zone potential is significantly limited C. Isla Vista Alternative 6 of the IV Draft Master Plan calls for further density increase beyond the 30 units/acre to 60 units/ac in certain areas along El Collegio rd. Thus moving build out from 1500 to 3000 units. IV represents a unique opportunity as residents are generally not opposed to higher densities 93
106 D. Montecito/Summerland (see Map C) Western bluffs (1) 10 acre site with PRD zoning and no minimum lot size Montecito Orchard (2) 30 acre site with AG I-5 zoning adjacent to Hwy 101 in Montecito. Site is surrounded by low to medium density residential housing. Potential exists for up zone to 1.8 units/acre. Montecito Area 3 (3) acre parcel of very low density (1unit/3 acre) zoning. Parcel is surrounded by low /medium density residential housing. Potential exists for up-zone to1.8 units/acre. Potential Receiving Sites in the City of Santa Barbara (see map B) The City of Santa Barbara possesses scarce amounts of land available for future development; much of the City is built out and the little existing vacant land is highly constrained. A promising option available to the City for increasing its housing stock lies in re-zoning or up-zoning areas with industrial zoning to accommodate higher density mixed use or townhome style development which is currently in high demand in the downtown areas. In addition the City owned public parking lots offer some political traction to serve as receiving sites for development credits from the Gaviota Coast. On these sites the City may consider high density residential developments only if there is complete replacement of all parking lots. Table 2 Potential Receiving Sites in the City of Santa Barbara (#s correspond to location on Map B) Funk Zone (1) A 4 block square area bordered by Garden/ State and Cabrillo /Hwy 101 near the waterfront in downtown Santa Barbara. Area has current zoning of HRC and OC zoning with a 30% commercial requirement. The HRC and OC zoning allows for R-3 densities. Because of this allowed density the Funk Zone possesses limited up-zone potential Wright Property a. west of Garden St. (2) 4.5 acre site located downtown adjacent to funk zone. Site is used for industrial purposes but has R-3 zoning. Site has a current development proposal for 160 units. Subsequently site has limited capacity as viable receiving site. b. east of Garden St. (3) 13.2 acre site located downtown near funk zone. Site has mixture of industrial and commercial zoning (HRC -2 and M-1). The potential exists to re-zone parts of the site to high density mixed use town homes at 20 units/acre similar to the Yanonali Townhomes on West side of Garden st..site lies within the coastal zone City Housing Authority (4) Re-Development Agency site (5) Vacant Lot (6) Vacant 1.8 acre site owned by the City Housing Authority; City is processing a development proposal for 90 affordable units on the site. Because of this we assume minimal potential for increased density These sites total 6.5 acres near the downtown waterfront. Many of the parcels are vacant. The City Re-Development Agency owns 2.5 acres, with the remainder in private ownership. Potential exists to re-zone the sites from the current M-1 industrial zoning to high density mixed use 3 acre vacant parcel across from the Fess Parker Hotel. Lot has M-1 industrial zoning and would require an LCP amendment to 94
107 Ortega industrial (8) Haley Industrial (9) Las Positas School site (10) City Owned Parking Lots City Parking Lot Louise Lowry (LL) City Parking Lot Cota/Santa Barbara St. (CS) Pony Lot (7) City Parking Lot Haley/Anacapa (HA) allow residential development south of the rail road tracks..49 acre parcel with industrial CM zoning. CM zoning allows for high density R-3 residential uses which significantly limits up zone potential..61 acre parcel with industrial CM zoning. CM zoning allows for high density R-3 residential uses which significantly limits up zone potential. 9 acre vacant site owned by the School District with 1 unit/3 ac zoning, but School district is considering selling the parcel for residential development..81 acre parking lot. City conducted a study in 2003 to assess redevelopment of site for affordable housing project that maintains the existing # of public parking lots on site. Potential exists for up zone to 50 units/acre. Site is located within coastal zone 1.46 acre parking lot. City conducted a study in 2003 to assess redevelopment of site for affordable housing project that maintains the existing # of public parking lots on site. Potential exists for up zone to 50 units/acre. Site is located within coastal zone 1.7 acre City owned Redevelopment Agency parking lot located on ocean side of Cabrillo. Potential exists for up-zone to 20 units/acre. Site is located within coastal zone and would require an amendment to the LCP to allow residential development south of the railroad tracks acre parking lot. City conducted a study in 2003 to assess redevelopment of site for affordable housing project that maintains the existing # of public parking lots on site. Site is located within coastal zone Potential Receiving Sites in the City of Goleta (see Map D) The City of Goleta is currently drafting its General Plan which calls for the re-zone of certain parcels to residential uses. The recently incorporated City is very protective of its remaining agriculturally zoned land and has adopted a slow growth attitude with very few development projects permitted; it is unlikely any developments or rezones will proceed until the General Plan is adopted. Furthermore, the current political environment is such that the City is unlikely to support development transfers from County lands to areas within its jurisdiction because of previous development patterns in the Goleta Valley before incorporation. Despite this, there is a strong voice from residents and developers alike for increased development in certain areas. With these thoughts in mind, preliminary identified receiving sites were chosen based upon their consistency with proposed draft General Plan re-zones and current land uses and potentials for development. Sites are located in two general areas, north and south of Highway 101, and are zoned for either Agriculture or industrial/commercial purposes. All of these sites have the potential for significant up-zone to higher density residential uses. Table 3 Potential Receiving Sites in the City of Goleta (#s correspond to location on Map D) 95
108 A. Sites north of 101 Ellwood Canyon (1) Couvillion (2) Roman Catholic Ag Parcel (3) Bishop Ranch (4) Stow Canyon (5) Herold (6) Next to Herold (7) 33 acre parcel with AG I-10 zoning surrounded by medium density residential development. Potential exists for rezone to 4.6 units/acre. 14 acre parcel with AG II-40 zoning surrounded by medium density residential development. Potential exists for rezone to 4.6 units/acre 10 acre parcel with DR 4.6 zoning surrounded by medium density residential development adjacent to Hwy 101. Site is currently in agricultural uses. 287 acre parcel with AG II-40 zoning, not in agricultural production adjacent to Hwy 101. The owner (Larwin Devlopment Co) has submitted a preliminary development proposal for a project with units, but the City insists on maintaining Ag zoning. Potential exists for rezone from Ag to 4.6 units/acre. 6.5 acre parcel with residential 3.3 units/acre zoning currently under Ag uses; potential for up-zone to higher density 10 acre parcel with low density residential zoning 1 unit/acre with potential for up-zone to higher density 4.7 acre parcel with low density residential zoning 1.8 units/acre with limited up-zone to higher density B. Sites south of 101 Vacant western parcel (8) 14 acre parcel with medium density residential zoning (8 units/acre) with limited up-zone potential. Site is located within coastal zone Across Camino Real (9) Cluster of 3 parcels totaling 10.8 acres zoned commercial/office which the City is considering for re-zone to medium/high density mix residential uses Across Camino Real (10) 22 acre parcel zoned commercial which the City is considering for re-zone to medium/high density residential uses. We assume upzone potential to 20 units/acre Mixed-Use (11) A Cluster of many parcels being zoned for a business park with the potential for residential mixed use development of certain portions Commercial (12) Site is zoned for commercial, currently in Ag but is likely to remain zoned for commercial uses in the draft general plan. Site has limited potential as receiving site due to its strictly commercial zoning East of HWY 217 (13) 17 acre site with residential (DR 4.6) and industrial (MHS) zoning being considered for re-zone to medium/high residential density Bacara Resort The Bacara Resort is applying for an expansion onto adjacent property; potential exists to require TDR purchases for this Potential Receiving Sites in the City of Carpinteria (see Map F) The City of Carpinteria has a strong intention to preserve the existing green-belt surrounding the City s urban area. The City s General Plan identifies the City boundary as a rigid line serving both as a City limit and limit to of urbanization. Because of this, much of the agricultural, vacant and/or low density residential parcels in the City s sphere of influence would not act as viable receiving sites for development. However, 96
109 two prominent and high valued bluff top sites could act as receiving sites for rural development. The degree of up-zone potential remains uncertain on these sites. Table 4 Potential Receiving Sites in the City of Carpinteria (#s correspond to location on Map F) Western Bluffs site (1) 23 acre bluff top parcel currently zoned PUD. Under the PUD zoning we assume a baseline density of 1.8 units/acre and up zone potential to 3.3 units/acre. The owner has in the past submitted a development proposal for the site. Site is within coastal zone. Eastern Bluffs site (2) 22 acre bluff top parcel currently zoned commercial- resort. It may be possible to up-zone the site by allowing a mix of residential uses along with the resort zoning and or allow for more allowed rooms in the resort Potential Rural Receiving Sites Located Outside the South Coast UGB (see Maps A, C, D) Policy 2-13 specifies that receiving areas be located inside existing urban areas of the County. However, we feel it is prudent to also assess potential receiving sites along the rural areas of the Gaviota Coast as well as sites adjacent to but outside the South Coast s existing UGB. It is not our recommendation to execute a TDR program in a way that violates Policy 2-13; rather, it is a goal of this report to explore the full range of possibilities about how a TDR transfer could be most effectively implemented. Sites adjacent but north of the current UGB between Goleta and the City of Santa Barbara possess some slope constraints and would likely be developed with relatively low density residential zoning (1 to 1.8 units/acre). These sites lie within the foothills of the Santa Ynez mountains and therefore possess highly valued views which would create strong developer demand in a TDR transfer. Table 5 Potential South Coast Rural Receiving Sites outside UGB : (#s correspond to location on Maps A, C, D ) Glen Annie Golf Course (Rural 2, Map D) Rural 4 (Map A) Rural 3 (Map A) Ag parcels between Summerland & Toro Canyon (Rural 5, Map C) Toro Canyon Parcels Adjacent to Polo 156 acre cluster of 3 parcels adjacent to the urban growth boundary on Goleta s western edge. The land is currently zoned agriculture but is in use as a golf course. The site has slope constraints suggesting 30-50% buildability at low to medium densities of 3.3 units/acre. The owner has recently expressed interest in using the land for residential purposes as the golf course is no longer profitable. 166 acre parcel located in foothills north of Cathedral Oaks rd, outside but adjacent to the current UGB with expansive views. Site is zoned AG II-40. Due to slope constraints site would likely be developed at low density zoning of 1 to 1.8 units/acre. Site is Outside coastal zone, not under Williamson Act Large 189 acre cluster of parcels with Ag I -20 zoning surrounded by low and medium density neighborhoods. Potential to up-zone to low density residential. Not under Williamson Act protection. Site has slope constraints. 10 parcels totaling approximately 145 acres with Ag I -20 zoning. Potential may exist to up-zone to 1 unit/5 ac or 1unit/acre. 4 parcels totaling 45 acres with AG I-10, REC and DR 3.3 zoning. 97
110 fields (Rural 7, Map C) Summerland Eastern Bluffs (Rural 6, Map C) Possible potential to up-zone to 1unit/5 ac zoning. 30 acres of 5 bluff top parcels with 3-E-1 zoning (3 acre min) May have the potential to up-zone to 1 acre min zoning. Area has significant geologic constraints that would indicate only very low allowed densities. Rural Unincorporated Gaviota Coast (see Map E) Sites located within the unincorporated Gaviota Coast, while not within the existing urban/rural boundary, have political and economic benefits that deserve analysis. It is assumed optimal sites are located in and around areas with pre-existing rural residential development or in locations between existing rural subdivisions and the current urban/rural boundary. Three areas within Gaviota meet these general criteria: (1) Rancho Tajiguas subdivision, (2) El Capitan Subdivision, and (3) sites between Rancho Embarcadero and Goleta s western urban boundary that is Winchester and Ellwood Canyons. These areas have predominantly Ag -100 zoning, and/or very low density 5 acre minimum lot size restrictions. The subsequent up-zone potential of these sites would most likely be limited to low density residential for consistency with surrounding land uses. Yet moving from 5 acre minimums or Ag 100 zoning to 1 acre minimum lot sizes, in conjunction with the values associated the lots, has the potential to create strong market demand in this area. Alternatively, the Local Coastal Plan identifies the need for visitor serving lodges within the Gaviota. This suggests that it may even prove feasible to use higher density hotel development in the Winchester/Ellwood area to absorb development from the Santa Barbara Ranch. The benefit of addressing sites along the Gaviota Coast is that they face less political opposition than do sites in the other jurisdictions previously discussed; these sites possess an immediate and direct spatial connection with the Santa Barbara Ranch property allowing residents to witness the social benefit of transferred development. Table 6 Potential Receiving Sites in Unincorporated Gaviota Coast: (#s correspond to location on Map E) Winchester & Ellwood Canyons (Rural Three potential parcels zoned Ag II-100 located between the 1a, 1b, 1c) existing rural subdivision Rancho Embarcadero and Goleta s western urban limit line. Their location is ideal for making development contiguous with existing urban areas along Goleta s western edge. The parcels may have potential for up-zone to surrounding area low to medium residential densities of 1.8 and 3.3 units/acre. Parcel R1a was recently up for sale. Area is partially within coastal zone. El Capitan rural subdivision (2) Private subdivision located east of the El Capitan parcel and contains 20 lots with 10 acre minimum lot sizes. Potential may exist for up-zone to 1 acre minimums. Parcels not under Williamson Act protection. Potential Receiving Sites in Santa Ynez, Los Olivos, Ballard (see Map G) 98
111 The unincorporated Santa Ynez valley including the urban areas of Santa Ynez, Los Olivos, and Ballard is currently re-drafting its community plan. Sites within the unincorporated Santa Ynez Valley have several advantages over other areas. They avoid some of the geo-political obstacles that receiving sites in incorporated areas possess, they are located within the 3 rd Supervisorial District, and have development values similar to those found along the South Coast. Discussions with community planners along with current development trends indicate strong demand for rural residential ranchette developments. Within the inner rural area surrounding Los Olivos, Ballard, and Santa Ynez, 80-90% of the Agricultural land has been subdivided into 5 or 10 acre ranchette parcels which are arguably not viable for agricultural production. The community is strongly opposed to high density development in this inner rural area, but is not opposed to ranchette development. The remaining sites, with predominantly Ag 40 zoning, while technically not within an urban area, are not located within a strictly rural area, yet they possess the greatest potential in the Santa Ynez to receive development from the Santa Barbara Ranch. The current concern is whether or not to allow the few remaining large low density Ag parcels within the inner rural zone to subdivide into 5 or 10 acre parcels similar to the surrounding parcels. Community attitudes seem to be amenable with allowing these parcels to subdivide and instead focus on maintaining the large tracts of Ag land outside the inner rural area. This creates the opportunity to require TDR purchases for the subdivision of these lower density Ag parcels into 20, 10, or 5 acre rural ranchettes. In addition to the inner rural receiving sites, a handful of sites have been identified by the community in its Housing Summit Group for up-zone potential. These urban sites are located throughout the Town of Santa Ynez with sizes ranging from 1 to 5 acres. The densities of these sites have yet to be determined, but could range from units/acre. Table 7 Potential Receiving Sites in Unincorporated Santa Ynez Valley (see map G) A. Inner Rural Receiving Sites 21 parcels (940 acres) with Ag I 40 zoning located between Los Olivos, Ballard, and Santa Ynez. The community has supported upzoning parcels to surrounding rural residential densities of 1 unit /10 acres or 1/20 within the inner rural area. B. Housing Summit Group Sites Multiple small parcels totaling 33 acres of urban Santa Ynez parcels zoned with low residential density 1-E-1. Community has identified these parcels for potential up-zone to higher density (12-20 units/acre). Potential Receiving Sites in Orcutt (see Map H) Potential receiving sites in the unincorporated community of Orcutt are identified from the Orcutt Community Plan and the Clark Avenue re-development plan. The Orcutt Planning Area contains 43 Key Sites and Mini EIR sites, principally vacant and underdeveloped parcels. These undeveloped key sites are identified as having the greatest potential for development which would have community wide influence. We have identified four general areas that could provide potential receiving sites: (A) key sites 99
112 within walking distance of old town (B) key sites with commercial mixed use potential, (C) re-development potential in Old Town Orcutt, and (D) key sites west of the airport. The developable land surrounding Orcutt is severely constrained by threatened and endangered species habitat which acts to restrict and in many cases reduce the number of units allowed despite the existing zoning as spelled out in the key site plans. Therefore, up-zone potential on many of these identified key sites, and their subsequent feasibility as receiving sites is significantly limited. Table 8 Potential Receiving Sites in Orcutt (#s correspond to location on Map H) A. Walking distance to old town Orcutt. Key Site 14 (1) 87 acres with low density 1.5 units/acre residential zoning, could be up-zoned to higher density. Key Site 15 (2) 53 acres with low density 4 units/acre residential zoning, could be up-zoned to higher density Key Site 16 (3) 12 acres zoned for commercial Key Site 17 (4) 20 acres with 8 units/acre residential zoning, limited up-zone potential B. Commercial Sites Key Site 1 and 2 (6) 42 acres with commercial zoning C. Downtown Redevelopment Potential Clark Avenue (5) D. West of Airport Key Site 21 (7) Key Site 22 (8) Many parcels with redevelopment potential to high density mixed use 340 acres with low density residential zoning (maximum 150 units) 1179 acres with rural residential RR-20 zoning; site calls for the potential re-zone to higher density ( units) with the use of TDR. However, the site has significant threatened and endangered habitat constraints Potential Receiving Sites in the City of Santa Maria and Surrounding Area (see Map I) The City of Santa Maria has three general categories of potential receiving sites: (A) rural lands along the City s urban fringe that have been or are likely to be added to the City s sphere of influence for future development, (B) residential parcels within the City s current boundary that could be up-zoned to higher density, and urban in-fill parcels undergoing re-zone to mixed use high density development. These three categories each represent an opportunity for increasing density with a TDR mechanism. In the first case the LAFCO could seek to influence the City in the approval process regarding the use of TDR on parcels the City wishes to add to its sphere of influence. In the second case the City could decide to increase residential zoning contingent upon the developer purchase of TDR. The infill option would allow the City planning department and City Council a decision regarding the use of TDR as a means of increasing vertical development on pre-identified sites the City wishes to re-zone for mixed use. An important consideration regarding the feasibility of receiving sites in the Santa Maria area is the significant distance between the City and the Santa Barbara Ranch. Even 100
113 though total development values of potential receiving sites may be significantly large it is unlikely to outweigh the political difficulties caused by the lack of spatial connection to the Santa Barbara Ranch. Table 9 Potential Receiving Sites in Santa Maria (#s correspond to location on map I) A. Rural lands long urban fringe Bradley Ranch (1) Urban Ag west of 101 (2) Ag sites in north eastern corner (4) Mahoney Ranch (7) Western Ag lands (6) B. Low density residential parcels w/in City Sites north east of 101 (3) Illif property (5) The Bradley Ranch is a large, acre unincorporated parcel located on the eastern urban fringe of the City and east side of highway 101. The parcel is currently under agricultural use (AG 10, 20, but is a future proposed annex to the City. The site is south of the eastern no urban development zone as identified in City Resolution acre Ag I-40 zoned parcel currently within the City s sphere of influence. Site is surrounded by urban development; City is considering re-zone to urban development Parcels totaling 264 acres of Ag II-40 zoning bordering the City boundary north of the City s no urban development zone as written in City resolution The 460 acre site is located along the south-western edge of the City. It is zoned for a planned development with varying densities. The Mahoney Ranch has been approved and recorded by the LAFCO for sphere expansion on November 9, acres of Ag I-10 lands adjacent to City s western boundary; area was identified in County 2030 land inventory as having potential for urban development 32 acres lower density residential (R-1) zoning that could be upzoned to higher residential density 45 acres of lower density residential (R-1) zoning that could be up-zoned to higher residential density Potential Receiving Sites in Lompoc The City of Lompoc is currently constrained in its ability to acquire new land for residential development. The LAFCO is limiting the spread of the city into the surrounding prime agricultural lands. Demand for new development is strong in Lompoc; developable land is limited in relation to a population that has nearly doubled in the last thirty years. The WYE development located north of the City of Lompoc and south of Vandenberg Village between Harris Grade road to the east and Highway 1 to the west has the greatest potential to serve as a receiving site for development transfers in the City of Lompoc and surrounding area. The current development proposal identifies 7 areas of which only areas 2,3, and 4 have potential to increase project density. Table 10 Potential Receiving Sites in Lompoc WYE Development 322 acre site lying within the Lompoc s urban growth boundary, currently County controlled, but the City of Lompoc will be proposing a sphere expansion to the LAFCO within the next three months. Most of the land within the site is zoned under the 101
114 County s zoning guidelines for residential development at lower densities of between Res-3.3 and 4.6 (maximum of 4.6 units/acre), and DR 4.6. Of the 322 acres 149 has development pending with a plan for 476 units (3.1 units/acre). Area 2 Area 3 Area 4 63 acres with low density zoning (3-5units/acre); potential may exist to increase density 26 acres with low density zoning (2-3units/acre); potential may exist to increase density 27 acres with low density zoning (1-2units/acre); potential may exist to increase density Potential Receiving Sites in Buellton Agricultural lands surround the City, and a greenbelt is proposed for the agricultural lands between the Buellton and Solvang. Buellton was the fastest growing city in the County in the 1990 s, growing at an average rate of 2% a year. When Buellton incorporated the LAFCO included agricultural lands west, north and east of the existing urban community within the city boundary. Since that time almost all of this land has been developed. Currently there are proposals for potential urban expansion on large tracts west and north of the current City limit. Table 9 Potential Receiving Sites in Buellton A. Lands to the west of City limits 185 acre area to the west of the City s sphere of influence is bordered by the County s rural boundary line. The site contains 19 individual parcels, mostly rural residential ranchettes and agricultural crops B. Lands to the north of City limits The lands to the north are highly visible from Highways 101 and 246 and contain many steep slopes with significant areas of prime soils, yet the area is currently used for grazing 102
115 Appendix C: PRIMARY RECEIVING SITE SCREENING See County web site for complete technical Appendix C calculations 103
116 Appendix D: SECONDARY RECEIVING SITE SCREENING WILLINGNESS TO PAY FOR TDRS In order to determine a developer s willingness to pay (WTP) for TDRs on receiving sites passing the 1 st screen we developed and applied the theory as described in section 5.5. We measure developer s WTP for TDRs using the following basic formula: Willingness To Pay = Capitalized Land Value with TDR Up-Zone Pre-Development Agreement Land Costs Capitalized land value is simply the added value the land acquires with newly entitled higher density residential development. More specifically, a developer s willingness to pay for a TDR is simply the added land cost a developer is willing to incur for additional density while still acquiring a net profit that is 15% of total project revenues. Subtracted from this added land cost or TDR value should be the pre-development agreement land costs, if any, the developer pays the receiving site landowner. Pre-development agreements typically involve the landowner acting as an equity partner who profit shares with the developer at the end of the project. This enables the landowner to capture a portion of the capitalized value the land acquires when it is up-zoned as a receiving site. In our model we assume the receiving site landowner captures 5% of project revenues 22. This definition of WTP holds for any development project regardless of density or type. Therefore, to estimate WTP, developer revenues and costs were modeled using a pro-forma methodology. The Microsoft excel worksheets below illustrate this approach with worksheets included for each of the receiving sites that passed the first screen. The pro-forma model is organized into two basic categories - revenues and costsso as to arrive at a net profit that is, total revenues less total costs. We use the excel tool solver to calculate the TDR Value cell with a constraint that the net profit be fixed at 15% of total revenue. We assume 15% here based on conversations with local area developers. In essence this generates the total added value to the land with an up-zone to the ascribed density given our assumed fixed costs. To determine revenues, density generated unit counts for a specific site given its size (and constraints) are multiplied by the estimated selling price of a unit. House sales information was obtained from real estate multiple listing (MLS) 22 Research showed receiving site landowners in Burlington County s TDR program, NJ, had engaged in 5% revenue sharing with developer to capture value added to their land with a TDR up-zone. 104
117 data, market surveys, and local area median sales price data from the 2005 Economic Forecast for Santa Barbara County. We also estimate revenues for projects with 15% and 30% of the units set aside for workforce housing. In so doing we base the selling price of these units on the reported values for a 4 person HH that is earning 120% - 200% of the 2004 area median income of $64,000. In the County controlled areas this equates to a mandatory selling price of $330,000/unit, and in the City of Santa Barbara $450,000. Density assumptions for each receiving site were based on surrounding land uses, densities and the site s topographic constraints. The density up-zone assumptions we use are modest and range only from 1.8 units/acre to 4.6 units/acre in residential neighborhoods and 20 to 50 units/acre in downtown sites. In most cases, we also assumed that only between 15% and 60% of the property was buildable, depending on local conditions 23. In so doing we base our unit count calculations on the reduced buildable area to further reflect land use realities. Project fixed costs in the pro-forma were ascertained through conversations with local developers 24 and are organized as follows: 1. Land Costs (with existing zoning & total with capitalized value) 2. Development Costs (building construction & site development costs) 3. Indirect Costs 4. Developer Fee (costs of developer overhead) 5. Marketing Costs 6. Financing Costs 7. Commission & Closing Costs The land costs we assumed ranged from 22,000/acre for rural land with agricultural zoning to $1.5 million/acre for parcels with industrial zoning along the waterfront. Urban parcels with agricultural zoning were assumed to sell between $100,000 and $150,000/acre depending on location. Receiving sites with a significant amount of allowed by right residential development were further analyzed to estimate the market price of the land. Alternatively, for the City owned parking lots we assume land costs of $0. Construction costs were assumed to be $ /sf for residential space. For the higher density condo sites in downtown Santa Barbara (including the City owned parking lots) we assume parking construction costs of $17,000/space for above grade podium parking and $45,000/space for the replacement of the public parking spaces. 23 We assume 60% of parcel size to be the default buildable area in cases with moderate site constraints. 24 Bermant Co., Comstock Homes, Investec, and Tobes Group 105
118 Site development costs that is, the costs associated with grading, sewer, water, and roads, were assumed to be 15% and 30% of total building construction costs for urban and rural sites respectively. Indirect costs the costs associated with permitting, design, impact fees, legal fees, and insurance, were assumed to be 25% of construction costs. Developer fees the costs of the developer s overhead, were assumed to be 3% of project revenues. Financing costs - that is, the interest paid to the banks for lent money, is calculated assuming a linear draw on debt with an interest rate that is 1% above prime rates. This amounts to an 8% interest payment on 60% of 75% of all costs including the land. The remaining 25% of costs are assumed to be financed by equity investors. Marketing costs and Commission & Closing costs are modeled to each be 2.5% of project revenues. Net Profit was determined by subtracting the total project costs from the total project revenue. We use the excel tool solver to calculate a TDR Value with a constraint that the net profit be fixed at 15% of total value, and the assumed fixed costs. Further detailed pro-forma assumptions are indicated in the notes in the excel worksheets. The WTP calculations for each of the receiving sites in Table are shown in the complete technical Appendix D available on the County s web site. To illustrate the methodology we show example WTP calculations only for the final 8 sites that passed all the screening criteria. These sites are organized as follows: 1. Unincorporated Urban South Coast Receiving Sites 2. City of Santa Barbara Receiving Sites Each page has the WTP calculations for each site under 100% market rate, 85% market rate/ 15% workforce, and 70% market rate/ 30% workforce scenarios. 106
119 Urban Unincorporated Santa Barbara County WTP Calculations on Optimal Receiving Sites 1. County Campus North (9) 2. St Vincent s West (8) 3. Montecito Orchard (2) 4. Montecito Area (3) (#s in parentheses indicate location on Maps A & C in Appendix A) 107
120 Appendix D: Secondary Screening - Developer Willingness to Pay for TDRs Appendix D: Secondary Screening - Developer Willingness to Pay for TDRs Appendix D: Secondary Screening - Developer Willingness to Pay for TDRs Unincorporated South Coast Cathedral Oaks County Campus Unincorporated South Coast Cathedral Oaks County Campus Unincorporated South Coast Cathedral Oaks County Campus 100% residential market rate single family units Mixed Income ( 85% market rate, 15% affordable workforce units) single family units Mixed Income ( 70% market rate, 30% affordable workforce units) single family units Santa Barbara County TDR Study Santa Barbara County TDR Study Santa Barbara County TDR Study Site Characteristics Site Characteristics Site Characteristics Parcel(s) Size Parcel(s) Size Parcel(s) Size Buildable Area (1) 22 Buildable Area (1) 22 Buildable Area (1) 22 Existing Zoning REC Existing Zoning REC Existing Zoning REC TDR Re-zone / Up-zone (2) 3.3 units/ac TDR Re-zone / Up-zone (2) 3.3 units/ac TDR Re-zone / Up-zone (2) 3.3 units/ac Development Program Development Program Development Program Residential Residential Residential # of units w/ existing zoning 0 # of units w/ existing zoning 0 # of units w/ existing zoning 0 # of units w/ TDR up-zone (based on buildable area) 73 # of units w/ TDR up-zone (based on buildable area) 73 # of units w/ TDR up-zone (based on buildable area) 73 # of Total Units 73 # of Total Units 73 # of Total Units 73 Average Market Rate Unit Size (3) 3,000 Average Market Rate Unit Size (3) 3,000 Average Market Rate Unit Size (3) 3,000 Average Affordable Rate Unit Size (3) Average Affordable Rate Unit Size (3) 1,500 Average Affordable Rate Unit Size (3) 1,500 Building Revenue Assumption Total Building Revenue Assumption Total Building Revenue Assumption Total Residential Residential Residential Market Rate Units 100% 73 Market Rate Units 85% 62 Market Rate Units 70% 51 Average Sale Price / sqft (4) $475 Average Sale Price / sqft (4) $475 Average Sale Price / sqft (4) $475 Average Unit Sale Price (4) $1,425,000 Average Unit Sale Price (4) $1,425,000 Average Unit Sale Price (4) $1,425,000 Affordable Units 0% 0 Affordable Units 15% 11 Affordable Units 30% 22 Area Median Income (4-person HH) Area Median Income (4-person HH) $64,700 Area Median Income (4-person HH) $64,700 Income Category (% of AMI) Income Category (% of AMI) % Income Category (% of AMI) % Sales Price Sales Price $330,000 Sales Price $330,000 Total Project Revenue 103,455,000 Total Project Revenue 91,530,450 Total Project Revenue 79,605,900 Project Costs Project Costs Project Costs Land (per acre and total, see note 5) $100,000 2,200,000 Land (per acre and total, see note 5) $100,000 2,200,000 Land (per acre and total, see note 5) $100,000 2,200,000 Value of TDR's (6) 33,351,456 Value of TDR's (6) 27,677,581 Value of TDR's (6) 22,003,672 Total Land Value 35,551,456 Total Land Value 29,877,581 Total Land Value 24,203,672 Building Construction Building Construction Building Construction Res. Construction Costs per sqft $120 26,136,000 Res. Construction Costs per sqft $120 24,175,800 Res. Construction Costs per sqft $120 22,215,600 Site Development Costs (7) 15% 3,920,400 Site Development Costs (7) 15% 3,626,370 Site Development Costs (7) 15% 3,332,340 Comm. Construction Costs per sqft $80 0 Comm. Construction Costs per sqft $80 0 Comm. Construction Costs per sqft $80 0 Indirect Costs (8) 25% 8,064,100 Indirect Costs (8) 25% 7,500,543 Indirect Costs (8) 25% 6,936,985 Developer Fee (9) 3% 3,103,650 Developer Fee (9) 3% 2,745,914 Developer Fee (9) 3% 2,388,177 Financing Financing Financing Debt Financing (10) 5,988,497 Debt Financing (10) 5,298,244 Debt Financing (10) 4,607,988 Equity Partner Financing (see profit spilt below, note 11) Equity Partner Financing (see profit spilt below, note 11) Equity Partner Financing (see profit spilt below, note 11) Marketing (% of Tot.Rev) 2.5% 2,586,375 Marketing (% of Tot.Rev) 2.5% 2,288,261 Marketing (% of Tot.Rev) 2.5% 1,990,148 Commission & Closing Costs (% of Tot.Rev) 2.5% 2,586,375 Commission & Closing Costs (% of Tot.Rev) 2.5% 2,288,261 Commission & Closing Costs (% of Tot.Rev) 2.5% 1,990,148 Total Project Costs 87,936,853 Total Project Costs 77,800,974 Total Project Costs 67,665,058 Net Profit 15,518,147 Net Profit 13,729,476 Net Profit 11,940,842 Net Profit as a % of Revenues (11) 15.0% Net Profit as a % of Revenues (11) 15.0% Net Profit as a % of Revenues (11) 15.0% (Profit Split: 20% to developer and 80% to equity partner) (Profit Split: 20% to developer and 80% to equity partner) (Profit Split: 20% to developer and 80% to equity partner) Developer Funds Available for TDRs Developer Funds Available for TDRs Developer Funds Available for TDRs Total Value of TDR's (from above) 33,351,456 Total Value of TDR's (from above) 27,677,581 Total Value of TDR's (from above) 22,003,672 Less Pre-Development Agreement Land Payment (12) 5% 5,172,750 Less Pre-Development Agreement Land Payment (12) 5% 4,576,523 Less Pre-Development Agreement Land Payment (12) 5% 3,980,295 Developers' Total Willingness to Pay for TDRs 28,178,706 Developers' Total Willingness to Pay for TDRs 23,101,059 Developers' Total Willingness to Pay for TDRs 18,023,377 Per unit Willingness to PAY for TDR 388,136 Per unit Willingness to PAY for TDR 318,196 Per unit Willingness to PAY for TDR 248,256 NOTES: NOTES: NOTES: (1) 58% of total parcel(s) size; 22 acres identified in County's inventory List A as potential sites to be Re-zoned for Affordability (1) 58% of total parcel(s) size; 22 acres identified in County's inventory List A as potential sites to be Re-zoned for Affordability (1) 58% of total parcel(s) size; 22 acres identified in County's inventory List A as potential sites to be Re-zoned f (2) Estimated allowed up-zoning based on surrounding landuses and densities (2) Estimated allowed up-zoning based on surrounding landuses and densities (2) Estimated allowed up-zoning based on surrounding landuses and densities (3) Average size for a single family detached unit at 3.3 units/acre (3) Average size for a single family detached unit at 3.3 units/acre (3) Average size for a single family detached unit at 3.3 units/acre (4) Based on surrounding like sales from dataquick, MLS, County Assessor (4) Based on surrounding like sales from dataquick, MLS, County Assessor (4) Based on surrounding like sales from dataquick, MLS, County Assessor (5) Determined from sales of property with like zoning (Ag and REC land inside UGB assumed to sell at $100k/acre) (5) Determined from sales of property with like zoning (Ag and REC land inside UGB assumed to sell at $100k/acre) (5) Determined from sales of property with like zoning (Ag and REC land inside UGB assumed to sell at $100k/a (6) Added value to the land with TDR up-zone; determined by a fixed net profit of 15% (6) Added value to the land with TDR up-zone; determined by a fixed net profit of 15% (6) Added value to the land with TDR up-zone; determined by a fixed net profit of 15% (7) % construction costs for grading, sewer, water, and roads (more constrained sites face greater site costs) (7) % construction costs for grading, sewer, water, and roads (more constrained sites face greater site costs) (7) % construction costs for grading, sewer, water, and roads (more constrained sites face greater site costs) (8) % of direct costs that includes permitting costs, impact fees, legal, insurance and design costs (8) % of direct costs that includes permitting costs, impact fees, legal, insurance and design costs (8) % of direct costs that includes permitting costs, impact fees, legal, insurance and design costs (9) % of revenue developers charge to cover project overhead (9) % of revenue developers charge to cover project overhead (9) % of revenue developers charge to cover project overhead (10) Assumes bank loans 75% of total project costs, with a linear draw; interest payment 7% on 60% of this amount for 2 years (10) Assumes bank loans 75% of total project costs, with a linear draw; interest payment 7% on 60% of this amount for 2 years (10) Assumes bank loans 75% of total project costs, with a linear draw; interest payment 7% on 60% of this amo (11) Private equity investors expect 80% split of net profit with no 'preferred return' payments during development period (11) Private equity investors expect 80% split of net profit with no 'preferred return' payments during development period (11) Private equity investors expect 80% split of net profit with no 'preferred return' payments during developme (12) % of total revenue landowner receives as payment above baseline land costs in a pre-development agreement; (12) % of total revenue landowner receives as payment above baseline land costs in a pre-development agreement; (12) % of total revenue landowner receives as payment above baseline land costs in a pre-development agreem this amount compensates receiving site land owner for capitalized land value with a TDR up-zone this amount compensates receiving site land owner for capitalized land value with a TDR up-zone this amount compensates receiving site land owner for capitalized land value with a TDR up-zone 108
121 Appendix D: Secondary Screening - Willingness to Pay for TDRs Appendix D: Secondary Screening - Willingness to Pay for TDRs Appendix D: Secondary Screening - Willingness to Pay for TDRs Unincorporated South Coast: St Vincents - West Unincorporated South Coast: St Vincents - West Unincorporated South Coast: St Vincents - West 100% residential market rate single family units Mixed Income ( 85% market rate, 15% affordable workforce units) single family units Mixed Income ( 70% market rate, 30% affordable workforce units) single family units Santa Barbara County TDR Study Santa Barbara County TDR Study Santa Barbara County TDR Study Site Characteristics Site Characteristics Site Characteristics Parcel(s) Size Parcel(s) Size Parcel(s) Size Buildable Area (1) 60% 20 Buildable Area (1) 60% 20 Buildable Area (1) 60% 20 Existing Zoning DR - 1 Existing Zoning DR - 1 Existing Zoning DR - 1 TDR Re-zone / Up-zone (2) 3.3 TDR Re-zone / Up-zone (2) 3.3 TDR Re-zone / Up-zone (2) 3.3 Development Program Development Program Development Program Residential Residential Residential # of units w/ existing zoning (including east parcel) 20 # of units w/ existing zoning (including east parcel) 20 # of units w/ existing zoning (including east parcel) 20 # of units w/ TDR up-zone (based on buildable area) 46 # of units w/ TDR up-zone (based on buildable area) 46 # of units w/ TDR up-zone (based on buildable area) 46 # of Total Units 66 # of Total Units 66 # of Total Units 66 Average Market Rate Unit Size (3) 3,000 Average Market Rate Unit Size (3) 3,000 Average Market Rate Unit Size (3) 3,000 Average Affordable Rate Unit Size (3) Average Affordable Rate Unit Size (3) 1,500 Average Affordable Rate Unit Size (3) 1,500 Building Revenue Assumption Total Building Revenue Assumption Total Building Revenue Assumption Total Residential Residential Residential Market Rate Units 100% 66 Market Rate Units 85% 56 Market Rate Units 70% 46 Average Sale Price / sqft (4) $475 Average Sale Price / sqft (4) $475 Average Sale Price / sqft (4) $475 Average Unit Sale Price (4) $1,425,000 Average Unit Sale Price (4) $1,425,000 Average Unit Sale Price (4) $1,425,000 Affordable Units 0% 0 Affordable Units 15% 10 Affordable Units 30% 20 Area Median Income (4-person HH) Area Median Income (4-person HH) $64,700 Area Median Income (4-person HH) $64,700 Income Category (% of AMI) Income Category (% of AMI) % Income Category (% of AMI) % Sales Price Sales Price $330,000 Sales Price $330,000 Sub Total Project Revenue 94,068,810 Sub Total Project Revenue 83,226,142 Sub Total Project Revenue 72,383,474 less revenue at exsitng zoning 28,505,700 less revenue at exsitng zoning 28,505,700 less revenue at exsitng zoning 28,505,700 Total TDR Project Revenue 65,563,110 Total TDR Project Revenue 54,720,442 Total TDR Project Revenue 43,877,774 0 Project Costs Project Costs Project Costs Land (per acre and total, see note 5) $256,266 8,543,916 Land (per acre and total, see note 5) $256,266 8,543,916 Land (per acre and total, see note 5) $256,266 8,543,916 Value of TDR's (6) 23,666,507 Value of TDR's (6) 18,255,974 Value of TDR's (6) 12,845,518 Total Land Value 32,210,423 Total Land Value 26,799,890 Total Land Value 21,389,434 Building Construction Building Construction Building Construction Res. Construction Costs per sqft $120 23,764,752 Res. Construction Costs per sqft $120 21,982,396 Res. Construction Costs per sqft $120 20,200,039 Site Development Costs (7) 15% 3,564,713 Site Development Costs (7) 15% 3,297,359 Site Development Costs (7) 15% 3,030,006 Comm. Construction Costs per sqft $80 0 Comm. Construction Costs per sqft $80 0 Comm. Construction Costs per sqft $80 0 Indirect Costs (8) 25% 8,968,345 Indirect Costs (8) 25% 8,455,918 Indirect Costs (8) 25% 7,943,490 Developer Fee (9) 3% 2,822,064 Developer Fee (9) 3% 2,496,784 Developer Fee (9) 3% 2,171,504 Financing Financing Financing Debt Financing (10) 5,563,763 Debt Financing (10) 4,916,523 Debt Financing (10) 4,269,289 Equity Partner Financing (see profit spilt below, note 11) Equity Partner Financing (see profit spilt below, note 11) Equity Partner Financing (see profit spilt below, note 11) Marketing (% of Tot.Rev) 2.5% 2,351,720 Marketing (% of Tot.Rev) 2.5% 2,080,654 Marketing (% of Tot.Rev) 2.5% 1,809,587 Commission,& Closing Costs (% of Tot.Rev) 2.5% 712,643 Commission,& Closing Costs (% of Tot.Rev) 2.5% 712,643 Commission,& Closing Costs (% of Tot.Rev) 2.5% 712,643 Sub Total Project Costs 79,958,423 Sub Total Project Costs 70,742,166 Sub Total Project Costs 61,525,992 less costs at exsitng zoning 24,229,845 less costs at exsitng zoning 24,229,845 less costs at exsitng zoning 24,229,845 Total TDR Project Costs 55,728,578 Total TDR Project Costs 46,512,321 Total TDR Project Costs 37,296,147 Net Profit (additional w/ TDR) 9,834,532 Net Profit (additional w/ TDR) 8,208,121 Net Profit (additional w/ TDR) 6,581,627 Net TDR Profit as a % of Revenues (11) 15.0% Net TDR Profit as a % of Revenues (11) 15.0% Net TDR Profit as a % of Revenues (11) 15.0% (Profit Split: 20% to developer and 80% to equity partner) (Profit Split: 20% to developer and 80% to equity partner) (Profit Split: 20% to developer and 80% to equity partner) Developer Funds Available for TDRs Developer Funds Available for TDRs Developer Funds Available for TDRs Total Value of TDR's (from above) 23,666,507 Total Value of TDR's (from above) 18,255,974 Total Value of TDR's (from above) 12,845,518 Less Pre-Development Agreement Land Payment (12) 5% 3,278,156 Less Pre-Development Agreement Land Payment (12) 5% 2,736,022 Less Pre-Development Agreement Land Payment (12) 5% 2,193,889 Developers' Total Willingness to Pay for TDRs 20,388,351 Developers' Total Willingness to Pay for TDRs 15,519,952 Developers' Total Willingness to Pay for TDRs 10,651,629 Per unit Willingness to PAY for TDR 443,136 Per unit Willingness to PAY for TDR 337,323 Per unit Willingness to PAY for TDR 231,511 NOTES: NOTES: NOTES: (1) 60% of total parcel size (1) 60% of total parcel size (1) 60% of total parcel size (2) Estimated allowed up-zoning based on surrounding landuses and densities (2) Estimated allowed up-zoning based on surrounding landuses and densities (2) Estimated allowed up-zoning based on surrounding landuses and densities (3) Average size for a single family detached unit at 3.3 units/acre (3) Average size for a single family detached unit at 3.3 units/acre (3) Average size for a single family detached unit at 3.3 units/acre (4) Based on surrounding like sales from dataquick, MLS, County Assessor (4) Based on surrounding like sales from dataquick, MLS, County Assessor (4) Based on surrounding like sales from dataquick, MLS, County Assessor (5) Determined by setting TDR value to zero with net profit of 15% at existing zoning; (5) Determined by setting TDR value to zero with net profit of 15% at existing zoning; (5) Determined by setting TDR value to zero with net profit of 15% at existing zoning; sites have higher land prices with residential zoning sites have higher land prices with residential zoning sites have higher land prices with residential zoning (6) Added value to the land with TDR up-zone; determined by a fixed net profit of 15% (6) Added value to the land with TDR up-zone; determined by a fixed net profit of 15% (6) Added value to the land with TDR up-zone; determined by a fixed net profit of 15% (7) % construction costs for grading, sewer, water, and roads (more constrained sites face greater site costs) (7) % construction costs for grading, sewer, water, and roads (more constrained sites face greater site costs) (7) % construction costs for grading, sewer, water, and roads (more constrained sites face greater site costs) (8) % of direct costs that includes permitting costs, impact fees, legal, insurance and design costs (8) % of direct costs that includes permitting costs, impact fees, legal, insurance and design costs (8) % of direct costs that includes permitting costs, impact fees, legal, insurance and design costs (9) % of revenue developers charge to cover project overhead (9) % of revenue developers charge to cover project overhead (9) % of revenue developers charge to cover project overhead (10) Assumes bank loans 75% of total project costs, with a linear draw; interest payment 7% on 60% of this amount for 2 years (10) Assumes bank loans 75% of total project costs, with a linear draw; interest payment 7% on 60% of this amount for 2 years (10) Assumes bank loans 75% of total project costs, with a linear draw; interest payment 7% on 60% of this am (11) Private equity investors expect 80% split of net profit with no 'preferred return' payments during development period (11) Private equity investors expect 80% split of net profit with no 'preferred return' payments during development period (11) Private equity investors expect 80% split of net profit with no 'preferred return' payments during developm (12) % of total revenue landowner receives as payment above baseline land costs in a pre-development agreement; (12) % of total revenue landowner receives as payment above baseline land costs in a pre-development agreement; (12) % of total revenue landowner receives as payment above baseline land costs in a pre-development agree this amount compensates receiving site land owner for capitalized land value with a TDR up-zone this amount compensates receiving site land owner for capitalized land value with a TDR up-zone this amount compensates receiving site land owner for capitalized land value with a TDR up-zone 109
122 Appendix D: Secondary Screening - Developer Willingness to Pay for TDRs Appendix D: Secondary Screening - Developer Willingness to Pay for TDRs Appendix D: Secondary Screening - Developer Willingness to Pay for TDRs Unincorporated South Coast: Montecito Orchard - area 2 Unincorporated South Coast: Montecito Orchard - area 2 Unincorporated South Coast: Montecito Orchard - area 2 100% residential market rate single family units Mixed Income ( 85% market rate, 15% affordable workforce units) single family units Mixed Income ( 70% market rate, 30% affordable workforce units) single family units Santa Barbara County TDR Study Santa Barbara County TDR Study Santa Barbara County TDR Study Site Characteristics Site Characteristics Site Characteristics Parcel(s) Size 30.5 Parcel(s) Size 30.5 Parcel(s) Size 30.5 Buildable Area (1) 60% 18.3 Buildable Area (1) 60% 18.3 Buildable Area (1) 60% 18.3 Existing Zoning Ag - 5 Existing Zoning Ag - 5 Existing Zoning Ag - 5 TDR Re-zone / Up-zone (2) 1.8 units/ac TDR Re-zone / Up-zone (2) 1.8 units/ac TDR Re-zone / Up-zone (2) 1.8 units/ac Development Program Development Program Development Program Residential Residential Residential # of units w/ existing zoning 3 # of units w/ existing zoning 3 # of units w/ existing zoning 3 # of units w/ TDR up-zone (based on buildable area) 30 # of units w/ TDR up-zone (based on buildable area) 30 # of units w/ TDR up-zone (based on buildable area) 30 # of Total Units 33 # of Total Units 33 # of Total Units 33 Average Market Rate Unit Size (3) 3,000 Average Market Rate Unit Size (3) 3,000 Average Market Rate Unit Size (3) 3,000 Average Affordable Rate Unit Size (3) Average Affordable Rate Unit Size (3) 1,500 Average Affordable Rate Unit Size (3) 1,500 Building Revenue Assumption Total Building Revenue Assumption Total Building Revenue Assumption Total Residential Residential Residential Market Rate Units 100% 30 Market Rate Units 85% 25 Market Rate Units 70% 21 Average Sale Price / sqft (4) $650 Average Sale Price / sqft (4) $650 Average Sale Price / sqft (4) $650 Average Unit Sale Price (4) $1,950,000 Average Unit Sale Price (4) $1,950,000 Average Unit Sale Price (4) $1,950,000 Affordable Units 0% 0 Affordable Units 15% 4 Affordable Units 30% 9 Area Median Income (4-person HH) Area Median Income (4-person HH) $64,700 Area Median Income (4-person HH) $64,700 Income Category (% of AMI) Income Category (% of AMI) % Income Category (% of AMI) % Sales Price Sales Price $330,000 Sales Price $330,000 Total Project Revenue 58,383,000 Total Project Revenue 51,107,580 Total Project Revenue 43,832,160 Project Costs Project Costs Project Costs Land (per acre and total, see note 5) $150,000 4,575,000 Land (per acre and total, see note 5) $150,000 4,575,000 Land (per acre and total, see note 5) $150,000 4,575,000 Value of TDR's (6) 20,362,754 Value of TDR's (6) 17,505,916 Value of TDR's (6) 14,649,065 Total Land Value 24,937,754 Total Land Value 22,080,916 Total Land Value 19,224,065 Building Construction Building Construction Building Construction Res. Construction Costs per sqft $120 10,778,400 Res. Construction Costs per sqft $120 9,161,640 Res. Construction Costs per sqft $120 7,544,880 Site Development Costs (7) 15% 1,616,760 Site Development Costs (7) 15% 1,374,246 Site Development Costs (7) 15% 1,131,732 Comm. Construction Costs per sqft $80 0 Comm. Construction Costs per sqft $80 0 Comm. Construction Costs per sqft $80 0 Indirect Costs (8) 25% 4,242,540 Indirect Costs (8) 25% 3,777,722 Indirect Costs (8) 25% 3,312,903 Developer Fee (9) 3% 1,751,490 Developer Fee (9) 3% 1,533,227 Developer Fee (9) 3% 1,314,965 Financing Financing Financing Debt Financing (10) 3,379,502 Debt Financing (10) 2,958,365 Debt Financing (10) 2,537,227 Equity Partner Financing (see profit spilt below, note 11) Equity Partner Financing (see profit spilt below, note 11) Equity Partner Financing (see profit spilt below, note 11) Marketing (% of Tot.Rev) 2.5% 1,459,575 Marketing (% of Tot.Rev) 2.5% 1,277,690 Marketing (% of Tot.Rev) 2.5% 1,095,804 Commission & Closing Costs (% of Tot.Rev) 2.5% 1,459,575 Commission & Closing Costs (% of Tot.Rev) 2.5% 1,277,690 Commission & Closing Costs (% of Tot.Rev) 2.5% 1,095,804 Total Project Costs 49,625,596 Total Project Costs 43,441,494 Total Project Costs 37,257,380 Net Profit 8,757,404 Net Profit 7,666,086 Net Profit 6,574,780 Net Profit as a % of Revenues (11) 15.0% Net Profit as a % of Revenues (11) 15.0% Net Profit as a % of Revenues (11) 15.0% (Profit Split: 20% to developer and 80% to equity partner) (Profit Split: 20% to developer and 80% to equity partner) (Profit Split: 20% to developer and 80% to equity partner) Developer Funds Available for TDRs Developer Funds Available for TDRs Developer Funds Available for TDRs Total Value of TDR's (from above) 20,362,754 Total Value of TDR's (from above) 17,505,916 Total Value of TDR's (from above) 14,649,065 Less Pre-Development Agreement Land Payment (12) 5% 2,919,150 Less Pre-Development Agreement Land Payment (12) 5% 2,555,379 Less Pre-Development Agreement Land Payment (12) 5% 2,191,608 Developers' Total Willingness to Pay for TDRs 17,443,604 Developers' Total Willingness to Pay for TDRs 14,950,537 Developers' Total Willingness to Pay for TDRs 12,457,457 Per unit Willingness to PAY for TDR 582,619 Per unit Willingness to PAY for TDR 499,350 Per unit Willingness to PAY for TDR 416,081 NOTES: NOTES: NOTES: (1) 60% of total parcel(s) size (1) 60% of total parcel(s) size (1) 60% of total parcel(s) size (2) Estimated allowed up-zoning based on surrounding landuses and densities (2) Estimated allowed up-zoning based on surrounding landuses and densities (2) Estimated allowed up-zoning based on surrounding landuses and densities (3) Average size for a single family detached unit at 1.8 units/acre (3) Average size for a single family detached unit at 1.8 units/acre (3) Average size for a single family detached unit at 1.8 units/acre (4) Based on surrounding like sales from dataquick, MLS, County Assessor (4) Based on surrounding like sales from dataquick, MLS, County Assessor (4) Based on surrounding like sales from dataquick, MLS, County Assessor (5) Determined from sales of property with like zoning (Ag land inside UGB assumed to sell at $100k/acre) (5) Determined from sales of property with like zoning (Ag land inside UGB assumed to sell at $100k/acre) (5) Determined from sales of property with like zoning (Ag land inside UGB assumed to sell at $100k/acre) (6) Added value to the land with TDR up-zone; determined by a fixed net profit of 15% (6) Added value to the land with TDR up-zone; determined by a fixed net profit of 15% (6) Added value to the land with TDR up-zone; determined by a fixed net profit of 15% (7) % construction costs for grading, sewer, water, and roads (more constrained sites face greater site costs) (7) % construction costs for grading, sewer, water, and roads (more constrained sites face greater site costs) (7) % construction costs for grading, sewer, water, and roads (more constrained sites face greater site costs) (8) % of direct costs that includes permitting costs, impact fees, legal, insurance and design costs (8) % of direct costs that includes permitting costs, impact fees, legal, insurance and design costs (8) % of direct costs that includes permitting costs, impact fees, legal, insurance and design costs (9) % of revenue developers charge to cover project overhead (9) % of revenue developers charge to cover project overhead (9) % of revenue developers charge to cover project overhead (10) Assumes bank loans 75% of total project costs, with a linear draw; interest payment 7% on 60% of this amount for 2 years (10) Assumes bank loans 75% of total project costs, with a linear draw; interest payment 7% on 60% of this amount for 2 years (10) Assumes bank loans 75% of total project costs, with a linear draw; interest payment 7% on 60% of this amount (11) Private equity investors expect 80% split of net profit with no 'preferred return' payments during development period (11) Private equity investors expect 80% split of net profit with no 'preferred return' payments during development period (11) Private equity investors expect 80% split of net profit with no 'preferred return' payments during development p (12) % of total revenue landowner receives as payment above baseline land costs in a pre-development agreement; (12) % of total revenue landowner receives as payment above baseline land costs in a pre-development agreement; (12) % of total revenue landowner receives as payment above baseline land costs in a pre-development agreemen this amount compensates receiving site land owner for capitalized land value with a TDR up-zone this amount compensates receiving site land owner for capitalized land value with a TDR up-zone this amount compensates receiving site land owner for capitalized land value with a TDR up-zone 110
123 Appendix D: Secondary Screening - Developer Willingness to Pay for TDRs Appendix D: Secondary Screening - Developer Willingness to Pay for TDRs Appendix D: Secondary Screening - Developer Willingness to Pay for TDRs Unincorporated South Coast: Montecito Area 3 Unincorporated South Coast: Montecito Area 3 Unincorporated South Coast: Montecito Area 3 100% residential market rate single family units Mixed Income ( 85% market rate, 15% affordable workforce units) single family units Mixed Income ( 70% market rate, 30% affordable workforce units) single family units Santa Barbara County TDR Study Santa Barbara County TDR Study Santa Barbara County TDR Study Site Characteristics Site Characteristics Site Characteristics Parcel(s) Size Parcel(s) Size Parcel(s) Size Buildable Area (1) 60% Buildable Area (1) 60% Buildable Area (1) 60% Existing Zoning.3 unit/acre Existing Zoning.3 unit/acre Existing Zoning.3 unit/acre TDR Re-zone / Up-zone (2) 1.8 units/acre TDR Re-zone / Up-zone (2) 1.8 units/acre TDR Re-zone / Up-zone (2) 1.8 units/acre Development Program Development Program Development Program Residential Residential Residential # of units w/ existing zoning 4 # of units w/ existing zoning 4 # of units w/ existing zoning 4 # of units w/ TDR up-zone (based on buildable area) 19 # of units w/ TDR up-zone (based on buildable area) 19 # of units w/ TDR up-zone (based on buildable area) 19 # of Total Units 23 # of Total Units 23 # of Total Units 23 Average Market Rate Unit Size (3) 3,000 Average Market Rate Unit Size (3) 3,000 Average Market Rate Unit Size (3) 3,000 Average Affordable Rate Unit Size (3) Average Affordable Rate Unit Size (3) 1,500 Average Affordable Rate Unit Size (3) 1,500 Building Revenue Assumption Total Building Revenue Assumption Total Building Revenue Assumption Total Residential Residential Residential Market Rate Units 100% 19 Market Rate Units 85% 16 Market Rate Units 70% 13 Average Sale Price / sqft (4) $650 Average Sale Price / sqft (4) $650 Average Sale Price / sqft (4) $650 Average Unit Sale Price (4) $1,950,000 Average Unit Sale Price (4) ######### Average Unit Sale Price (4) $1,950,000 Affordable Units 0% 0 Affordable Units 15% 3 Affordable Units 30% 6 Area Median Income (4-person HH) Area Median Income (4-person HH) $64,700 Area Median Income (4-person HH) $64,700 Income Category (% of AMI) Income Category (% of AMI) % Income Category (% of AMI) % Sales Price Sales Price $330,000 Sales Price $330,000 Total Project Revenue 37,311,300 Total Project Revenue 32,661,738 Total Project Revenue 28,012,176 Project Costs Project Costs Project Costs Land (per acre and total, see note 5) $150,000 3,189,000 Land (per acre and total, see note 5) $150,000 3,189,000 Land (per acre and total, see note 5) $150,000 3,189,000 Value of TDR's (6) 12,681,808 Value of TDR's (6) 10,113,428 Value of TDR's (6) 7,545,073 Total Land Value 15,870,808 Total Land Value 13,302,428 Total Land Value 10,734,073 Building Construction Building Construction Building Construction Res. Construction Costs per sqft $120 6,888,240 Res. Construction Costs per sqft $120 6,371,622 Res. Construction Costs per sqft $120 5,855,004 Site Development Costs (7) 15% 1,033,236 Site Development Costs (7) 15% 955,743 Site Development Costs (7) 15% 878,251 Comm. Construction Costs per sqft $80 0 Comm. Construction Costs per sqft $80 0 Comm. Construction Costs per sqft $80 0 Indirect Costs (8) 25% 2,777,619 Indirect Costs (8) 25% 2,629,091 Indirect Costs (8) 25% 2,480,564 Developer Fee (9) 3% 1,119,339 Developer Fee (9) 3% 979,852 Developer Fee (9) 3% 840,365 Financing Financing Financing Debt Financing (10) 2,159,761 Debt Financing (10) 1,890,621 Debt Financing (10) 1,621,484 Equity Partner Financing (see profit spilt below, note 11) Equity Partner Financing (see profit spilt below, note 11) Equity Partner Financing (see profit spilt below, note 11) Marketing (% of Tot.Rev) 2.5% 932,783 Marketing (% of Tot.Rev) 2.5% 816,543 Marketing (% of Tot.Rev) 2.5% 700,304 Commission & Closing Costs (% of Tot.Rev) 2.5% 932,783 Commission & Closing Costs (% of Tot.Rev) 2.5% 816,543 Commission & Closing Costs (% of Tot.Rev) 2.5% 700,304 Total Project Costs 31,714,568 Total Project Costs 27,762,445 Total Project Costs 23,810,350 Net Profit 5,596,732 Net Profit 4,899,293 Net Profit 4,201,826 Net Profit as a % of Revenues (11) 15.0% Net Profit as a % of Revenues (11) 15.0% Net Profit as a % of Revenues (11) 15.0% (Profit Split: 20% to developer and 80% to equity partner) (Profit Split: 20% to developer and 80% to equity partner) (Profit Split: 20% to developer and 80% to equity partner) Developer Funds Available for TDRs Developer Funds Available for TDRs Developer Funds Available for TDRs Total Value of TDR's (from above) 12,681,808 Total Value of TDR's (from above) 10,113,428 Total Value of TDR's (from above) 7,545,073 Less Pre-Development Agreement Land Payment (12) 5% 1,865,565 Less Pre-Development Agreement Land Payment (12) 5% 1,633,087 Less Pre-Development Agreement Land Payment (12) 5% 1,400,609 Developers' Total Willingness to Pay for TDRs 10,816,243 Developers' Total Willingness to Pay for TDRs 8,480,341 Developers' Total Willingness to Pay for TDRs 6,144,464 Per unit Willingness to PAY for TDR 565,289 Per unit Willingness to PAY for TDR 443,208 Per unit Willingness to PAY for TDR 321,128 NOTES: NOTES: NOTES: (1) 60% of total parcel(s) size (1) 60% of total parcel(s) size (1) 60% of total parcel(s) size (2) Estimated allowed up-zoning based on surrounding landuses and densities (2) Estimated allowed up-zoning based on surrounding landuses and densities (2) Estimated allowed up-zoning based on surrounding landuses and densities (3) Average size for a single family detached unit at 1.8 units/acre (3) Average size for a single family detached unit at 1.8 units/acre (3) Average size for a single family detached unit at 1.8 units/acre (4) Based on surrounding like sales from dataquick, MLS, County Assessor (4) Based on surrounding like sales from dataquick, MLS, County Assessor (4) Based on surrounding like sales from dataquick, MLS, County Assessor (5) Determined from sales of property with like zoning (Ag land inside UGB assumed to sell at $100k/acre) (5) Determined from sales of property with like zoning (Ag land inside UGB assumed to sell at $100k/acre) (5) Determined from sales of property with like zoning (Ag land inside UGB assumed to sell at $100k/acre) (6) Added value to the land with TDR up-zone; determined by a fixed net profit of 15% (6) Added value to the land with TDR up-zone; determined by a fixed net profit of 15% (6) Added value to the land with TDR up-zone; determined by a fixed net profit of 15% (7) % construction costs for grading, sewer, water, and roads (more constrained sites face greater site costs) (7) % construction costs for grading, sewer, water, and roads (more constrained sites face greater site costs) (7) % construction costs for grading, sewer, water, and roads (more constrained sites face greater site costs) (8) % of direct costs that includes permitting costs, impact fees, legal, insurance and design costs (8) % of direct costs that includes permitting costs, impact fees, legal, insurance and design costs (8) % of direct costs that includes permitting costs, impact fees, legal, insurance and design costs (9) % of revenue developers charge to cover project overhead (9) % of revenue developers charge to cover project overhead (9) % of revenue developers charge to cover project overhead (10) Assumes bank loans 75% of total project costs, with a linear draw; interest payment 7% on 60% of this amount for 2 years (10) Assumes bank loans 75% of total project costs, with a linear draw; interest payment 7% on 60% of this amount for 2 years (10) Assumes bank loans 75% of total project costs, with a linear draw; interest payment 7% on 60% of this a (11) Private equity investors expect 80% split of net profit with no 'preferred return' payments during development period (11) Private equity investors expect 80% split of net profit with no 'preferred return' payments during development period (11) Private equity investors expect 80% split of net profit with no 'preferred return' payments during develop (12) % of total revenue landowner receives as payment above baseline land costs in a pre-development agreement; (12) % of total revenue landowner receives as payment above baseline land costs in a pre-development agreement; (12) % of total revenue landowner receives as payment above baseline land costs in a pre-development agr this amount compensates receiving site land owner for capitalized land value with a TDR up-zone this amount compensates receiving site land owner for capitalized land value with a TDR up-zone this amount compensates receiving site land owner for capitalized land value with a TDR up-zone 111
124 City of Santa Barbara WTP Calculations on Optimal Receiving Sites 1. Wright Property - East (3) 2. Cota st. City Parking Lot (CS) 3. Haley/Anacapa City Parking Lot (HA) 4. City Redevelopment Lots (5) 5. Pony Lot Redevelopment site (7) (#s in parentheses indicate location on Map B in Appendix A) 112
125 Appendix D: Secondary Screening - Developer Willingness to Pay for TDRs Appendix D: Secondary Screening - Developer Willingness to Pay for TDRs Appendix D: Secondary Screening - Developer Willingness to Pay for TDRs City of Santa Barbara : Wright Property - East of Garden st. City of Santa Barbara : Wright Property - East of Garden st. City of Santa Barbara : Wright Property - East of Garden st. 100% residential market rate townhomes (no commercial) - 20 units/acre Mixed Income townhomes - 15% workforce (no commercial) - 20 units/acre Mixed Income townhomes - 30% workforce (no commercial) - 20 units/acre Santa Barbara County TDR Study Santa Barbara County TDR Study Santa Barbara County TDR Study Site Characteristics Site Characteristics Site Characteristics Parcel(s) Size Parcel(s) Size Parcel(s) Size Buildable Area (1) 7.79 Buildable Area (1) 7.79 Buildable Area (1) 7.79 Existing Zoning M - 1, HRC - 2 Existing Zoning M - 1, HRC - 2 Existing Zoning M - 1, HRC - 2 TDR Re-zone / Up-zone (2) 20 units/ac TDR Re-zone / Up-zone (2) 20 units/ac TDR Re-zone / Up-zone (2) 20 units/ac Development Program Development Program Development Program Residential Residential Residential # of units w/ existing zoning 0 # of units w/ existing zoning 0 # of units w/ existing zoning 0 # of units w/ TDR up-zone 156 # of units w/ TDR up-zone 156 # of units w/ TDR up-zone 156 # of Total Units 156 # of Total Units 156 # of Total Units 156 Average Market Rate Unit Size (3) 1,250 Average Market Rate Unit Size (3) 1,250 Average Market Rate Unit Size (3) 1,250 Average Affordable Rate Unit Size (3) 850 Average Affordable Rate Unit Size (3) 850 Average Affordable Rate Unit Size (3) 850 Commercial Commercial Commercial Allowed square footage 0 Allowed square footage 0 Allowed square footage 0 Additional Up-zone square footage 0 Additional Up-zone square footage 0 Additional Up-zone square footage 0 Parking Parking Parking Residential Spaces (4) 351 Residential Spaces (4) 327 Residential Spaces (4) 304 Commercial Spaces (4) 0 Commercial Spaces (4) 0 Commercial Spaces (4) 0 Building Revenue Assumption Total Building Revenue Assumption Total Building Revenue Assumption Total Residential Residential Residential Market Rate Units 100% 156 Market Rate Units 85% 132 Market Rate Units 70% 109 Average Sale Price / sqft (5) $900 Average Sale Price / sqft (5) $900 Average Sale Price / sqft (5) $900 Average Unit Sale Price (5) $1,125, ,365,000 Average Unit Sale Price (5) $1,125, ,060,250 Average Unit Sale Price (5) $1,125, ,755,500 Affordable Units 0% 0 Affordable Units 15% 23 Affordable Units 30% 47 Area Median Income (4-person HH) $64,700 Area Median Income (4-person HH) $64,700 Area Median Income (4-person HH) $64,700 Income Category (% of AMI) % Income Category (% of AMI) % Income Category (% of AMI) % Sales Price $450,000 0 Sales Price $450,000 10,521,900 Sales Price $450,000 21,043,800 Commercial 0 0 Commercial 0 0 Commercial 0 0 Lease Rate Lease Rate Lease Rate Revenue Periods/year Revenue Periods/year Revenue Periods/year Gross Annual Income Gross Annual Income Gross Annual Income Less Vacancy Less Vacancy Less Vacancy Less Operating Expenses Less Operating Expenses Less Operating Expenses Net Operating Income Net Operating Income Net Operating Income Capitalized Value 0 Capitalized Value 0 Capitalized Value 0 Total Project Revenue 175,365,000 Total Project Revenue 159,582,150 Total Project Revenue 143,799,300 Project Costs Project Costs Project Costs Land (per acre and total, see note 6) $1,500,000 19,485,000 Land (per acre and total, see note 6) $1,500,000 19,485,000 Land (per acre and total, see note 6) $1,500,000 19,485,000 Value of TDR's (7) 57,471,414 Value of TDR's (7) 48,403,692 Value of TDR's (7) 39,335,970 Total Land Value 76,956,414 Total Land Value 67,888,692 Total Land Value 58,820,970 Building Construction Building Construction Building Construction Res. Construction Costs per sqft $130 25,330,500 Res. Construction Costs per sqft $130 24,114,636 Res. Construction Costs per sqft $130 22,898,772 Site Development Costs (8) 15% 3,799,575 Site Development Costs (8) 15% 3,617,195 Site Development Costs (8) 15% 3,434,816 Comm. Construction Costs per sqft $80 0 Comm. Construction Costs per sqft $80 0 Comm. Construction Costs per sqft $80 0 Parking (podium) Construction (per space see note $17,000 5,962,410 Parking (podium) Construction (per space see note 9) $17,000 5,564,916 Parking (podium) Construction (per space see note 9) $17,000 5,167,422 Indirect Costs (10) 25% 13,644,371 Indirect Costs (10) 25% 13,195,437 Indirect Costs (10) 25% 12,746,502 Developer Fee (11) 3% 5,260,950 Developer Fee (11) 3% 4,787,465 Developer Fee (11) 3% 4,313,979 Financing Financing Financing Debt Financing (12) 10,214,429 Debt Financing (12) 9,295,131 Debt Financing (12) 8,375,832 Equity Partner Financing (see profit spilt below, note 13) Equity Partner Financing (see profit spilt below, note 13) Equity Partner Financing (see profit spilt below, note 13) Marketing & Commission (% of Tot.Rev) 4.5% 7,891,425 Marketing & Commission (% of Tot.Rev) 4.5% 7,181,197 Marketing & Commission (% of Tot.Rev) 4.5% 6,470,969 Total Project Costs 149,060,075 Total Project Costs 135,644,668 Total Project Costs 122,229,261 Net Profit 26,304,925 Net Profit 23,937,482 Net Profit 21,570,039 Net Profit as a % of Revenues (expected to be 15%) 15.0% Net Profit as a % of Revenues (expected to be 15%) 15.0% Net Profit as a % of Revenues (expected to be 15%) 15.0% (Profit Split: 20% to developer and 80% to equity partner) (Profit Split: 20% to developer and 80% to equity partner) (Profit Split: 20% to developer and 80% to equity partner) Developer Funds Available for TDRs Developer Funds Available for TDRs Developer Funds Available for TDRs Total Value of TDR's (from above) 57,471,414 Total Value of TDR's (from above) 48,403,692 Total Value of TDR's (from above) 39,335,970 Less Pre-Development Agreement Land Payment (14) 5% 8,768,250 Less Pre-Development Agreement Land Payment (14) 5% 7,979,108 Less Pre-Development Agreement Land Payment (14) 5% 7,189,965 Developers' Total Willingness to Pay for TDRs 48,703,164 Developers' Total Willingness to Pay for TDRs 40,424,584 Developers' Total Willingness to Pay for TDRs 32,146,005 Per unit Willingness to PAY for TDR 312,440 Per unit Willingness to PAY for TDR 259,331 Per unit Willingness to PAY for TDR 206,223 NOTES: NOTES: NOTES: (1) 60% of total parcel(s) size (1) 60% of total parcel(s) size (1) 60% of total parcel(s) size (2) Estimated allowed up-zoning based on surrounding landuses and densities; (2) Estimated allowed up-zoning based on surrounding landuses and densities; (2) Estimated allowed up-zoning based on surrounding landuses and densities; three stories- two residential above one level of above street level parking three stories- two residential above one level of above street level parking three stories- two residential above one level of above street level parking (3) Average size for a luxury 2-bedroom townhome at 20 units/acre (3) Average size for a luxury 2-bedroom townhome at 20 units/acre (3) Average size for a luxury 2-bedroom townhome at 20 units/acre (4) 2 for every market rate unit, 1 for workforce and 1 for every 4 units; # comm lots = 1/500sqft comm (4) 2 for every market rate unit, 1 for workforce and 1 for every 4 units; # comm lots = 1/500sqft comm (4) 2 for every market rate unit, 1 for workforce and 1 for every 4 units; # comm lots = 1/500sqft comm (5) Based on surrounding like sales from dataquick, MLS, County Assessor (5) Based on surrounding like sales from dataquick, MLS, County Assessor (5) Based on surrounding like sales from dataquick, MLS, County Assessor (6) Determined from sales of property with like zoning and/or County Assessor appraised Land value (6) Determined from sales of property with like zoning and/or County Assessor appraised Land value (6) Determined from sales of property with like zoning and/or County Assessor appraised Land value (7) Added value to the land with TDR up-zone; determined by a fixed net profit of 15% (7) Added value to the land with TDR up-zone; determined by a fixed net profit of 15% (7) Added value to the land with TDR up-zone; determined by a fixed net profit of 15% (8)% construction costs for grading, sewer, water, and roads (8)% construction costs for grading, sewer, water, and roads (8)% construction costs for grading, sewer, water, and roads (9) Assumes podium style parking with each space 380 sf at a cost of $45/sf for a total of $17,000/space (9) Assumes podium style parking with each space 380 sf at a cost of $45/sf for a total of $17,000/space (9) Assumes podium style parking with each space 380 sf at a cost of $45/sf for a total of $17,000/space (10) % of direct costs that includes permitting costs, impact fees, legal, insurance and design costs (10) % of direct costs that includes permitting costs, impact fees, legal, insurance and design costs (10) % of direct costs that includes permitting costs, impact fees, legal, insurance and design costs (11) % of revenue developers charge to cover project overhead (11) % of revenue developers charge to cover project overhead (11) % of revenue developers charge to cover project overhead (12) Assumes bank loans 75% of total project costs, with a linear draw; interest payment 7% on 60% of this amount for 2 years (12) Assumes bank loans 75% of total project costs, with a linear draw; interest payment 7% on 60% of this amount for 2 years (12) Assumes bank loans 75% of total project costs, with a linear draw; interest payment 7% on 60% of this amount for (13) Private equity investors expect 80% split of net profit with no 'preferred return' payments during development period (13) Private equity investors expect 80% split of net profit with no 'preferred return' payments during development period (13) Private equity investors expect 80% split of net profit with no 'preferred return' payments during development perio (14) % of total revenue landowner receives as payment above baseline land costs in a pre-development agreement; (14) % of total revenue landowner receives as payment above baseline land costs in a pre-development agreement; (14) % of total revenue landowner receives as payment above baseline land costs in a pre-development agreement; this amount compensates receiving site land owner for capitalized land value with a TDR up-zone this amount compensates receiving site land owner for capitalized land value with a TDR up-zone this amount compensates receiving site land owner for capitalized land value with a TDR up-zone 113
126 Appendix D: Secondary Screening - Developer Willingness to Pay for TDRs Appendix D: Secondary Screening - Developer Willingness to Pay for TDRs Appendix D: Secondary Screening - Developer Willingness to Pay for TDRs City Santa Barbara - Cota & Santa Barbara st Public Parking Lot City Santa Barbara - Cota & Santa Barbara st Public Parking Lot City Santa Barbara - Cota & Santa Barbara st Public Parking Lot 100% residential market rate Condos- 50 units/ac, 4 levels Mixed Income Condos, 15% workforce- 50 units/ac, 4 levels Mixed Income Condos, 30% workforce- 50 units/ac, 4 levels Santa Barbara County TDR Study Santa Barbara County TDR Study Santa Barbara County TDR Study Site Characteristics Site Characteristics Site Characteristics Parcel(s) Size 1.46 Parcel(s) Size 1.46 Parcel(s) Size 1.46 Buildable Area (1) 1.46 Buildable Area (1) 1.46 Buildable Area (1) 1.46 Existing Zoning Parking lot Existing Zoning Parking lot Existing Zoning Parking lot TDR Re-zone / Up-zone (2) 50 units/ac TDR Re-zone / Up-zone (2) 50 units/ac TDR Re-zone / Up-zone (2) 50 units/ac Development Program Development Program Development Program Residential Residential Residential # of units w/ existing zoning 0 # of units w/ existing zoning 0 # of units w/ existing zoning 0 # of units w/ TDR up-zone 73 # of units w/ TDR up-zone 73 # of units w/ TDR up-zone 73 # of Total Units 73 # of Total Units 73 # of Total Units 73 Average Market Rate Unit Size (3) 1,250 Average Market Rate Unit Size (3) 1,250 Average Market Rate Unit Size (3) 1,250 Average Affordable Rate Unit Size (3) 850 Average Affordable Rate Unit Size (3) 850 Average Affordable Rate Unit Size (3) 850 Commercial Commercial Commercial Allowed square footage 0 Allowed square footage 0 Allowed square footage 0 Additional Up-zone square footage 0 Additional Up-zone square footage 0 Additional Up-zone square footage 0 Parking Parking Parking Residential Spaces (4) 164 Residential Spaces (4) 153 Residential Spaces (4) 142 Commercial Spaces (4) 0 Commercial Spaces (4) 0 Commercial Spaces (4) 0 Replacement Spaces (4) 219 Replacement Spaces (4) 219 Replacement Spaces (4) 219 Building Revenue Assumption Total Building Revenue Assumption Total Building Revenue Assumption Total Residential Residential Residential Market Rate Units 100% 73 Market Rate Units 85% 62 Market Rate Units 70% 51 Average Sale Price / sqft (5) $900 Average Sale Price / sqft (5) $900 Average Sale Price / sqft (5) $900 Average Unit Sale Price (5) $1,125,000 82,125,000 Average Unit Sale Price (5) $1,125,000 69,806,250 Average Unit Sale Price (5) $1,125,000 57,487,500 Affordable Units 0% 0 Affordable Units 15% 11 Affordable Units 30% 22 Area Median Income (4-person HH) $64,700 Area Median Income (4-person HH) $64,700 Area Median Income (4-person HH) $64,700 Income Category (% of AMI) % Income Category (% of AMI) % Income Category (% of AMI) % Sales Price $450,000 Sales Price $450,000 Sales Price $450,000 Commercial 0 0 Commercial 0 0 Commercial 0 0 Lease Rate Lease Rate Lease Rate Revenue Periods/year Revenue Periods/year Revenue Periods/year Gross Annual Income Gross Annual Income Gross Annual Income Less Vacancy Less Vacancy Less Vacancy Less Operating Expenses Less Operating Expenses Less Operating Expenses Net Operating Income Net Operating Income Net Operating Income Capitalized Value 0 Capitalized Value 0 Capitalized Value 0 Total Project Revenue 82,125,000 Total Project Revenue 74,733,750 Total Project Revenue 67,342,500 Project Costs Project Costs Project Costs Land (per acre and total, see note 6) $0 0 Land (per acre and total, see note 6) $0 0 Land (per acre and total, see note 6) $0 0 Value of TDR's (7) 20,253,216 Value of TDR's (7) 16,389,886 Value of TDR's (7) 12,526,710 Total Land Value 20,253,216 Total Land Value 16,389,886 Total Land Value 12,526,710 Building Construction Building Construction Building Construction Res. Construction Costs per sqft $130 11,862,500 Res. Construction Costs per sqft $130 11,293,100 Res. Construction Costs per sqft $130 10,723,700 Site Development Costs (8) 15% 1,779,375 Site Development Costs (8) 15% 1,693,965 Site Development Costs (8) 15% 1,608,555 Comm. Construction Costs per sqft $80 0 Comm. Construction Costs per sqft $80 0 Comm. Construction Costs per sqft $80 0 Parking (podium) Construction (per space see note $45,000 17,246,250 Parking (podium) Construction (per space see note 9) $45,000 16,753,500 Parking (podium) Construction (per space see note 9) $45,000 16,260,750 Indirect Costs (10) 25% 7,722,031 Indirect Costs (10) 25% 7,435,141 Indirect Costs (10) 25% 7,148,251 Developer Fee (11) 3% 2,463,750 Developer Fee (11) 3% 2,242,013 Developer Fee (11) 3% 2,020,275 Financing Financing Financing Debt Financing (12) 4,783,516 Debt Financing (12) 4,352,993 Debt Financing (12) 3,922,483 Equity Partner Financing (see profit spilt below, note 13) Equity Partner Financing (see profit spilt below, note 13) Equity Partner Financing (see profit spilt below, note 13) Marketing & Commission (% of Tot.Rev) 4.5% 3,695,625 Marketing & Commission (% of Tot.Rev) 4.5% 3,363,019 Marketing & Commission (% of Tot.Rev) 4.5% 3,030,413 Total Project Costs 69,806,262 Total Project Costs 63,523,617 Total Project Costs 57,241,137 Net Profit 12,318,738 Net Profit 11,210,133 Net Profit 10,101,363 Net Profit as a % of Revenues (expected to be 15%) 15.0% Net Profit as a % of Revenues (expected to be 15%) 15.0% Net Profit as a % of Revenues (expected to be 15%) 15.0% (Profit Split: 20% to developer and 80% to equity partner) (Profit Split: 20% to developer and 80% to equity partner) (Profit Split: 20% to developer and 80% to equity partner) Developer Funds Available for TDRs Developer Funds Available for TDRs Developer Funds Available for TDRs Total Value of TDR's (from above) 20,253,216 Total Value of TDR's (from above) 16,389,886 Total Value of TDR's (from above) 12,526,710 Less Pre-Development Agreement Land Payment (14) 0% 0 Less Pre-Development Agreement Land Payment (14) 0% 0 Less Pre-Development Agreement Land Payment (14) 0% 0 Developers' Total Willingness to Pay for TDRs 20,253,216 Developers' Total Willingness to Pay for TDRs 16,389,886 Developers' Total Willingness to Pay for TDRs 12,526,710 Per unit Willingness to PAY for TDR 277,441 Per unit Willingness to PAY for TDR 224,519 Per unit Willingness to PAY for TDR 171,599 NOTES: NOTES: NOTES: (1) 100% of total parcel(s) size (1) 100% of total parcel(s) size (1) 100% of total parcel(s) size (2) Estimated allowed up-zoning based on surrounding landuses and densities; (2) Estimated allowed up-zoning based on surrounding landuses and densities; (2) Estimated allowed up-zoning based on surrounding landuses and densities; 4 levels- 3 residential above 1 below and 1 above grade parking 4 levels- 3 residential above 1 below and 1 above grade parking 4 levels- 3 residential above 1 below and 1 above grade parking (3) Average size for a luxury 2-bedroom townhome at 20 units/acre (3) Average size for a luxury 2-bedroom townhome at 20 units/acre (3) Average size for a luxury 2-bedroom townhome at 20 units/acre (4) 2 for every market rate unit, 1 for workforce and 1 for every 4 units;1/500sqft com; replacement spaces from 2003 study (4) 2 for every market rate unit, 1 for workforce and 1 for every 4 units;1/500sqft com; replacement spaces from 2003 study (4) 2 for every market rate unit, 1 for workforce and 1 for every 4 units;1/500sqft com; replacement spaces from 20 (5) Based on surrounding like sales from dataquick, MLS, County Assessor (5) Based on surrounding like sales from dataquick, MLS, County Assessor (5) Based on surrounding like sales from dataquick, MLS, County Assessor (6) Determined from sales of property with like zoning and/or County Assessor appraised Land value (6) Determined from sales of property with like zoning and/or County Assessor appraised Land value (6) Determined from sales of property with like zoning and/or County Assessor appraised Land value (7) Added value to the land with TDR up-zone; determined by a fixed net profit of 15% (7) Added value to the land with TDR up-zone; determined by a fixed net profit of 15% (7) Added value to the land with TDR up-zone; determined by a fixed net profit of 15% (8)% construction costs for grading, sewer, water, and roads (8)% construction costs for grading, sewer, water, and roads (8)% construction costs for grading, sewer, water, and roads (9) cost estimate taken from City 2003 feasibility study which used $26K, assuming here 70% increase in costs (9) cost estimate taken from City 2003 feasibility study which used $26K, assuming here 70% increase in costs (9) cost estimate taken from City 2003 feasibility study which used $26K, assuming here 70% increase in costs (10) % of direct costs that includes permitting costs, impact fees, legal, insurance and design costs (10) % of direct costs that includes permitting costs, impact fees, legal, insurance and design costs (10) % of direct costs that includes permitting costs, impact fees, legal, insurance and design costs (11) % of revenue developers charge to cover project overhead (11) % of revenue developers charge to cover project overhead (11) % of revenue developers charge to cover project overhead (12) Assumes bank loans 75% of total project costs, with a linear draw; interest payment 7% on 60% of this amount for 2 years (12) Assumes bank loans 75% of total project costs, with a linear draw; interest payment 7% on 60% of this amount for 2 years (12) Assumes bank loans 75% of total project costs, with a linear draw; interest payment 7% on 60% of this amoun (13) Private equity investors expect 80% split of net profit with no 'preferred return' payments during development period (13) Private equity investors expect 80% split of net profit with no 'preferred return' payments during development period (13) Private equity investors expect 80% split of net profit with no 'preferred return' payments during development p (14) % of total revenue landowner receives as payment above baseline land costs in a pre-development agreement; (14) % of total revenue landowner receives as payment above baseline land costs in a pre-development agreement; (14) % of total revenue landowner receives as payment above baseline land costs in a pre-development agreemen this amount compensates receiving site land owner for capitalized land value with a TDR up-zone this amount compensates receiving site land owner for capitalized land value with a TDR up-zone this amount compensates receiving site land owner for capitalized land value with a TDR up-zone 114
127 Appendix D: Secondary Screening - Developer Willingness to Pay for TDRs Appendix D: Secondary Screening - Developer Willingness to Pay for TDRs Appendix D: Secondary Screening - Developer Willingness to Pay for TDRs City Santa Barbara - Haley & Anacapa st Public Parking Lot City Santa Barbara - Haley & Anacapa st Public Parking Lot City Santa Barbara - Haley & Anacapa st Public Parking Lot 100% residential market rate Condos- 50 units/ac, 4 levels Mixed Income Condos, 15% workforce- 50 units/ac, 4 levels Mixed Income Condos, 30% workforce- 50 units/ac, 4 levels Santa Barbara County TDR Study Santa Barbara County TDR Study Santa Barbara County TDR Study Site Characteristics Site Characteristics Site Characteristics Parcel(s) Size 1.74 Parcel(s) Size 1.74 Parcel(s) Size 1.74 Buildable Area (1) 1.74 Buildable Area (1) 1.74 Buildable Area (1) 1.74 Existing Zoning Parking lot Existing Zoning Parking lot Existing Zoning Parking lot TDR Re-zone / Up-zone (2) 50 units/ac TDR Re-zone / Up-zone (2) 50 units/ac TDR Re-zone / Up-zone (2) 50 units/ac Development Program Development Program Development Program Residential Residential Residential # of units w/ existing zoning 0 # of units w/ existing zoning 0 # of units w/ existing zoning 0 # of units w/ TDR up-zone 87 # of units w/ TDR up-zone 87 # of units w/ TDR up-zone 87 # of Total Units 87 # of Total Units 87 # of Total Units 87 Average Market Rate Unit Size (3) 1,250 Average Market Rate Unit Size (3) 1,250 Average Market Rate Unit Size (3) 1,250 Average Affordable Rate Unit Size (3) 850 Average Affordable Rate Unit Size (3) 850 Average Affordable Rate Unit Size (3) 850 Commercial Commercial Commercial Allowed square footage 0 Allowed square footage 0 Allowed square footage 0 Additional Up-zone square footage 0 Additional Up-zone square footage 0 Additional Up-zone square footage 0 Parking Parking Parking Residential Spaces (4) 196 Residential Spaces (4) 183 Residential Spaces (4) 170 Commercial Spaces (4) 0 Commercial Spaces (4) 0 Commercial Spaces (4) 0 Replacement Spaces (4) 260 Replacement Spaces (4) 260 Replacement Spaces (4) 260 Building Revenue Assumption Total Building Revenue Assumption Total Building Revenue Assumption Total Residential Residential Residential Market Rate Units 100% 87 Market Rate Units 85% 74 Market Rate Units 70% 61 Average Sale Price / sqft (5) $900 Average Sale Price / sqft (5) $900 Average Sale Price / sqft (5) $900 Average Unit Sale Price (5) $1,125,000 97,875,000 Average Unit Sale Price (5) $1,125,000 83,193,750 Average Unit Sale Price (5) $1,125,000 68,512,500 Affordable Units 0% 0 Affordable Units 15% 13 Affordable Units 30% 26 Area Median Income (4-person HH) $64,700 Area Median Income (4-person HH) $64,700 Area Median Income (4-person HH) $64,700 Income Category (% of AMI) % Income Category (% of AMI) % Income Category (% of AMI) % Sales Price $450,000 Sales Price $450,000 Sales Price $450,000 Commercial 0 0 Commercial 0 0 Commercial 0 0 Lease Rate Lease Rate Lease Rate Revenue Periods/year Revenue Periods/year Revenue Periods/year Gross Annual Income Gross Annual Income Gross Annual Income Less Vacancy Less Vacancy Less Vacancy Less Operating Expenses Less Operating Expenses Less Operating Expenses Net Operating Income Net Operating Income Net Operating Income Capitalized Value 0 Capitalized Value 0 Capitalized Value 0 Total Project Revenue 97,875,000 Total Project Revenue 89,066,250 Total Project Revenue 80,257,500 Project Costs Project Costs Project Costs Land (per acre and total, see note 6) $0 0 Land (per acre and total, see note 6) $0 0 Land (per acre and total, see note 6) $0 0 Value of TDR's (7) 24,193,643 Value of TDR's (7) 19,589,397 Value of TDR's (7) 14,985,256 Total Land Value 24,193,643 Total Land Value 19,589,397 Total Land Value 14,985,256 Building Construction Building Construction Building Construction Res. Construction Costs per sqft $130 14,137,500 Res. Construction Costs per sqft $130 13,458,900 Res. Construction Costs per sqft $130 12,780,300 Site Development Costs (8) 15% 2,120,625 Site Development Costs (8) 15% 2,018,835 Site Development Costs (8) 15% 1,917,045 Comm. Construction Costs per sqft $80 0 Comm. Construction Costs per sqft $80 0 Comm. Construction Costs per sqft $80 0 Parking (podium) Construction (per space see note $45,000 20,508,750 Parking (podium) Construction (per space see note 9) $45,000 19,921,500 Parking (podium) Construction (per space see note 9) $45,000 19,334,250 Indirect Costs (10) 25% 9,191,719 Indirect Costs (10) 25% 8,849,809 Indirect Costs (10) 25% 8,507,899 Developer Fee (11) 3% 2,936,250 Developer Fee (11) 3% 2,671,988 Developer Fee (11) 3% 2,407,725 Financing Financing Financing Debt Financing (12) 5,700,902 Debt Financing (12) 5,187,813 Debt Financing (12) 4,674,733 Equity Partner Financing (see profit spilt below, note 13) Equity Partner Financing (see profit spilt below, note 13) Equity Partner Financing (see profit spilt below, note 13) Marketing & Commission (% of Tot.Rev) 4.5% 4,404,375 Marketing & Commission (% of Tot.Rev) 4.5% 4,007,981 Marketing & Commission (% of Tot.Rev) 4.5% 3,611,588 Total Project Costs 83,193,764 Total Project Costs 75,706,223 Total Project Costs 68,218,795 Net Profit 14,681,236 Net Profit 13,360,027 Net Profit 12,038,705 Net Profit as a % of Revenues (expected to be 15%) 15.0% Net Profit as a % of Revenues (expected to be 15%) 15.0% Net Profit as a % of Revenues (expected to be 15%) 15.0% (Profit Split: 20% to developer and 80% to equity partner) (Profit Split: 20% to developer and 80% to equity partner) (Profit Split: 20% to developer and 80% to equity partner) Developer Funds Available for TDRs Developer Funds Available for TDRs Developer Funds Available for TDRs Total Value of TDR's (from above) 24,193,643 Total Value of TDR's (from above) 19,589,397 Total Value of TDR's (from above) 14,985,256 Less Pre-Development Agreement Land Payment (14) 0% 0 Less Pre-Development Agreement Land Payment (14) 0% 0 Less Pre-Development Agreement Land Payment (14) 0% 0 Developers' Total Willingness to Pay for TDRs 24,193,643 Developers' Total Willingness to Pay for TDRs 19,589,397 Developers' Total Willingness to Pay for TDRs 14,985,256 Per unit Willingness to PAY for TDR 278,088 Per unit Willingness to PAY for TDR 225,165 Per unit Willingness to PAY for TDR 172,244 NOTES: NOTES: NOTES: (1) 100% of total parcel(s) size (1) 100% of total parcel(s) size (1) 100% of total parcel(s) size (2) Estimated allowed up-zoning based on surrounding landuses and densities; (2) Estimated allowed up-zoning based on surrounding landuses and densities; (2) Estimated allowed up-zoning based on surrounding landuses and densities; 4 levels- 3 residential above 1 below and 1 above grade parking 4 levels- 3 residential above 1 below and 1 above grade parking 4 levels- 3 residential above 1 below and 1 above grade parking (3) Average size for a luxury 2-bedroom townhome at 20 units/acre (3) Average size for a luxury 2-bedroom townhome at 20 units/acre (3) Average size for a luxury 2-bedroom townhome at 20 units/acre (4) 2 for every market rate unit, 1 for workforce and 1 for every 4 units;1/500sqft com; replacement spaces from 2003 study (4) 2 for every market rate unit, 1 for workforce and 1 for every 4 units;1/500sqft com; replacement spaces from 2003 study (4) 2 for every market rate unit, 1 for workforce and 1 for every 4 units;1/500sqft com; replacement spaces from 20 (5) Based on surrounding like sales from dataquick, MLS, County Assessor (5) Based on surrounding like sales from dataquick, MLS, County Assessor (5) Based on surrounding like sales from dataquick, MLS, County Assessor (6) Determined from sales of property with like zoning and/or County Assessor appraised Land value (6) Determined from sales of property with like zoning and/or County Assessor appraised Land value (6) Determined from sales of property with like zoning and/or County Assessor appraised Land value (7) Added value to the land with TDR up-zone; determined by a fixed net profit of 15% (7) Added value to the land with TDR up-zone; determined by a fixed net profit of 15% (7) Added value to the land with TDR up-zone; determined by a fixed net profit of 15% (8)% construction costs for grading, sewer, water, and roads (8)% construction costs for grading, sewer, water, and roads (8)% construction costs for grading, sewer, water, and roads (9) cost estimate taken from City 2003 feasibility study which used $26K, assuming here 70% increase in costs (9) cost estimate taken from City 2003 feasibility study which used $26K, assuming here 70% increase in costs (9) cost estimate taken from City 2003 feasibility study which used $26K, assuming here 70% increase in costs (10) % of direct costs that includes permitting costs, impact fees, legal, insurance and design costs (10) % of direct costs that includes permitting costs, impact fees, legal, insurance and design costs (10) % of direct costs that includes permitting costs, impact fees, legal, insurance and design costs (11) % of revenue developers charge to cover project overhead (11) % of revenue developers charge to cover project overhead (11) % of revenue developers charge to cover project overhead (12) Assumes bank loans 75% of total project costs, with a linear draw; interest payment 7% on 60% of this amount for 2 years (12) Assumes bank loans 75% of total project costs, with a linear draw; interest payment 7% on 60% of this amount for 2 years (12) Assumes bank loans 75% of total project costs, with a linear draw; interest payment 7% on 60% of this amoun (13) Private equity investors expect 80% split of net profit with no 'preferred return' payments during development period (13) Private equity investors expect 80% split of net profit with no 'preferred return' payments during development period (13) Private equity investors expect 80% split of net profit with no 'preferred return' payments during development p (14) % of total revenue landowner receives as payment above baseline land costs in a pre-development agreement; (14) % of total revenue landowner receives as payment above baseline land costs in a pre-development agreement; (14) % of total revenue landowner receives as payment above baseline land costs in a pre-development agreemen this amount compensates receiving site land owner for capitalized land value with a TDR up-zone this amount compensates receiving site land owner for capitalized land value with a TDR up-zone this amount compensates receiving site land owner for capitalized land value with a TDR up-zone 115
128 Appendix D: Secondary Screening - Developer Willingness to Pay for TDRs Appendix D: Secondary Screening - Developer Willingness to Pay for TDRs Appendix D: Secondary Screening - Developer Willingness to Pay for TDRs City of Santa Barbara : Redevelopment Site City of Santa Barbara : Redevelopment Site City of Santa Barbara : Redevelopment Site 100% residential market rate townhomes (no commercial) - 20 units/acre Mixed Income Townhomes - 15% Workforce - 20 units/ac Mixed Income Townhomes - 30% Workforce - 20 units/ac Santa Barbara County TDR Study Santa Barbara County TDR Study Santa Barbara County TDR Study Site Characteristics Site Characteristics Site Characteristics Parcel(s) Size 2.5 Parcel(s) Size 2.5 Parcel(s) Size 2.5 Buildable Area (1) 2.00 Buildable Area (1) 2.00 Buildable Area (1) 2.00 Existing Zoning M - 1, HRC - 2 Existing Zoning M - 1, HRC - 2 Existing Zoning M - 1, HRC - 2 TDR Re-zone / Up-zone (2) 20 units/ac TDR Re-zone / Up-zone (2) 20 units/ac TDR Re-zone / Up-zone (2) 20 units/ac Development Program Development Program Development Program Residential Residential Residential # of units w/ existing zoning 0 # of units w/ existing zoning 0 # of units w/ existing zoning 0 # of units w/ TDR up-zone 40 # of units w/ TDR up-zone 40 # of units w/ TDR up-zone 40 # of Total Units 40 # of Total Units 40 # of Total Units 40 Average Market Rate Unit Size (3) 1,250 Average Market Rate Unit Size (3) 1,250 Average Market Rate Unit Size (3) 1,250 Average Affordable Rate Unit Size (3) 850 Average Affordable Rate Unit Size (3) 850 Average Affordable Rate Unit Size (3) 850 Commercial Commercial Commercial Allowed square footage 0 Allowed square footage 0 Allowed square footage 0 Additional Up-zone square footage 0 Additional Up-zone square footage 0 Additional Up-zone square footage 0 Parking Parking Parking Residential Spaces (4) 90 Residential Spaces (4) 84 Residential Spaces (4) 78 Commercial Spaces (4) 0 Commercial Spaces (4) 0 Commercial Spaces (4) 0 Building Revenue Assumption Total Building Revenue Assumption Total Building Revenue Assumption Total Residential Residential Residential Market Rate Units 100% 40 Market Rate Units 85% 34 Market Rate Units 70% 28 Average Sale Price / sqft (5) $900 Average Sale Price / sqft (5) $900 Average Sale Price / sqft (5) $900 Average Unit Sale Price (5) $1,125,000 45,000,000 Average Unit Sale Price (5) $1,125,000 38,250,000 Average Unit Sale Price (5) $1,125,000 31,500,000 Affordable Units 0% 0 Affordable Units 15% 6 Affordable Units 30% 12 Area Median Income (4-person HH) $64,700 Area Median Income (4-person HH) $64,700 Area Median Income (4-person HH) $64,700 Income Category (% of AMI) % Income Category (% of AMI) % Income Category (% of AMI) % Sales Price $450,000 0 Sales Price $450,000 2,700,000 Sales Price $450,000 5,400,000 Commercial 0 0 Commercial 0 0 Commercial 0 0 Lease Rate Lease Rate Lease Rate Revenue Periods/year Revenue Periods/year Revenue Periods/year Gross Annual Income Gross Annual Income Gross Annual Income Less Vacancy Less Vacancy Less Vacancy Less Operating Expenses Less Operating Expenses Less Operating Expenses Net Operating Income Net Operating Income Net Operating Income Capitalized Value 0 Capitalized Value 0 Capitalized Value 0 Total Project Revenue 45,000,000 Total Project Revenue 40,950,000 Total Project Revenue 36,900,000 Project Costs Project Costs Project Costs Land (per acre and total, see note 6) $1,149,126 2,872,815 Land (per acre and total, see note 6) $1,149,126 2,872,815 Land (per acre and total, see note 6) $1,149,126 2,872,815 Value of TDR's (7) 17,406,606 Value of TDR's (7) 15,079,739 Value of TDR's (7) 12,752,892 Total Land Value 20,279,421 Total Land Value 17,952,554 Total Land Value 15,625,707 Building Construction Building Construction Building Construction Res. Construction Costs per sqft $130 6,500,000 Res. Construction Costs per sqft $130 6,188,000 Res. Construction Costs per sqft $130 5,876,000 Site Development Costs (8) 15% 975,000 Site Development Costs (8) 15% 928,200 Site Development Costs (8) 15% 881,400 Comm. Construction Costs per sqft $80 0 Comm. Construction Costs per sqft $80 0 Comm. Construction Costs per sqft $80 0 Parking (podium) Construction (per space see note 9 $17,000 1,530,000 Parking (podium) Construction (per space see note 9) $17,000 1,428,000 Parking (podium) Construction (per space see note $17,000 1,326,000 Indirect Costs (10) 25% 2,969,454 Indirect Costs (10) 25% 2,854,254 Indirect Costs (10) 25% 2,739,054 Developer Fee (11) 3% 1,350,000 Developer Fee (11) 3% 1,228,500 Developer Fee (11) 3% 1,107,000 Financing Financing Financing Debt Financing (12) 2,621,102 Debt Financing (12) 2,385,202 Debt Financing (12) 2,149,303 Equity Partner Financing (see profit spilt below, note 13) Equity Partner Financing (see profit spilt below, note 13) Equity Partner Financing (see profit spilt below, note 13) Marketing & Commission (% of Tot.Rev) 4.5% 2,025,000 Marketing & Commission (% of Tot.Rev) 4.5% 1,842,750 Marketing & Commission (% of Tot.Rev) 4.5% 1,660,500 Total Project Costs 38,249,977 Total Project Costs 34,807,459 Total Project Costs 31,364,963 Net Profit 6,750,023 Net Profit 6,142,541 Net Profit 5,535,037 Net Profit as a % of Revenues (expected to be 15%) 15.0% Net Profit as a % of Revenues (expected to be 15%) 15.0% Net Profit as a % of Revenues (expected to be 15%) 15.0% (Profit Split: 20% to developer and 80% to equity partner) (Profit Split: 20% to developer and 80% to equity partner) (Profit Split: 20% to developer and 80% to equity partner) Developer Funds Available for TDRs Developer Funds Available for TDRs Developer Funds Available for TDRs Total Value of TDR's (from above) 17,406,606 Total Value of TDR's (from above) 15,079,739 Total Value of TDR's (from above) 12,752,892 Less Pre-Development Agreement Land Payment (14) 5% 2,250,000 Less Pre-Development Agreement Land Payment (14) 5% 2,047,500 Less Pre-Development Agreement Land Payment (14) 5% 1,845,000 Developers' Total Willingness to Pay for TDRs 15,156,606 Developers' Total Willingness to Pay for TDRs 13,032,239 Developers' Total Willingness to Pay for TDRs 10,907,892 Per unit Willingness to PAY for TDR 378,915 Per unit Willingness to PAY for TDR 325,806 Per unit Willingness to PAY for TDR 272,697 NOTES: NOTES: NOTES: (1) 80% of total parcel(s) size (1) 80% of total parcel(s) size (1) 80% of total parcel(s) size (2) Estimated allowed up-zoning based on surrounding landuses and densities; (2) Estimated allowed up-zoning based on surrounding landuses and densities; (2) Estimated allowed up-zoning based on surrounding landuses and densities; three stories- two residential above one level of above street level parking three stories- two residential above one level of above street level parking three stories- two residential above one level of above street level parking (3) Average size for a luxury 2-bedroom townhome at 20 units/acre (3) Average size for a luxury 2-bedroom townhome at 20 units/acre (3) Average size for a luxury 2-bedroom townhome at 20 units/acre (4) 2 for every market rate unit, 1 for workforce and 1 for every 4 units; # comm lots = 1/500sqft comm (4) 2 for every market rate unit, 1 for workforce and 1 for every 4 units; # comm lots = 1/500sqft comm (4) 2 for every market rate unit, 1 for workforce and 1 for every 4 units; # comm lots = 1/500sqft comm (5) Based on surrounding like sales from dataquick, MLS, County Assessor (5) Based on surrounding like sales from dataquick, MLS, County Assessor (5) Based on surrounding like sales from dataquick, MLS, County Assessor (6) City purchased property in 2001 for $2,872,815; assumes City would sell to recoup costs and make $ in dev agreement (6) City purchased property in 2001 for $2,872,815; assumes City would sell to recoup costs and make $ in dev agreement (6) City purchased property in 2001 for $2,872,815; assumes City would sell to recoup costs and make $ in d (7) Added value to the land with TDR up-zone; determined by a fixed net profit of 15% (7) Added value to the land with TDR up-zone; determined by a fixed net profit of 15% (7) Added value to the land with TDR up-zone; determined by a fixed net profit of 15% (8)% construction costs for grading, sewer, water, and roads (8)% construction costs for grading, sewer, water, and roads (8)% construction costs for grading, sewer, water, and roads (9) Assumes podium style parking with each space 380 sf at a cost of $45/sf for a total of $17,000/space (9) Assumes podium style parking with each space 380 sf at a cost of $45/sf for a total of $17,000/space (9) Assumes podium style parking with each space 380 sf at a cost of $45/sf for a total of $17,000/space (10) % of direct costs that includes permitting costs, impact fees, legal, insurance and design costs (10) % of direct costs that includes permitting costs, impact fees, legal, insurance and design costs (10) % of direct costs that includes permitting costs, impact fees, legal, insurance and design costs (11) % of revenue developers charge to cover project overhead (11) % of revenue developers charge to cover project overhead (11) % of revenue developers charge to cover project overhead (12) Assumes bank loans 75% of total project costs, with a linear draw; interest payment 7% on 60% of this amount for 2 years (12) Assumes bank loans 75% of total project costs, with a linear draw; interest payment 7% on 60% of this amount for 2 years (12) Assumes bank loans 75% of total project costs, with a linear draw; interest payment 7% on 60% of this (13) Private equity investors expect 80% split of net profit with no 'preferred return' payments during development period (13) Private equity investors expect 80% split of net profit with no 'preferred return' payments during development period (13) Private equity investors expect 80% split of net profit with no 'preferred return' payments during develop (14) % of total revenue landowner receives as payment above baseline land costs in a pre-development agreement; (14) % of total revenue landowner receives as payment above baseline land costs in a pre-development agreement; (14) % of total revenue landowner receives as payment above baseline land costs in a pre-development agr this amount compensates receiving site land owner for capitalized land value with a TDR up-zone this amount compensates receiving site land owner for capitalized land value with a TDR up-zone this amount compensates receiving site land owner for capitalized land value with a TDR up-zone 116
129 Appendix D: Secondary Screening - Developer Willingness to Pay for TDRs Appendix D: Secondary Screening - Developer Willingness to Pay for TDRs Appendix D: Secondary Screening - Developer Willingness to Pay for TDRs City of Santa Barbara : Pony Lot City of Santa Barbara : Pony Lot City of Santa Barbara : Pony Lot 100% residential market rate townhomes (no commercial) - 20 units/acre Mixed Income townhomes - 15% workforce (no commercial) - 20 units/acre Mixed Income townhomes - 30% workforce (no commercial) - 20 units/acre Santa Barbara County TDR Study Santa Barbara County TDR Study Santa Barbara County TDR Study Site Characteristics Site Characteristics Site Characteristics Parcel(s) Size 2 Parcel(s) Size 2 Parcel(s) Size 2 Buildable Area (1) 1.40 Buildable Area (1) 1.40 Buildable Area (1) 1.40 Existing Zoning M - 1, HRC - 2 Existing Zoning M - 1, HRC - 2 Existing Zoning M - 1, HRC - 2 TDR Re-zone / Up-zone (2) 20 units/ac TDR Re-zone / Up-zone (2) 20 units/ac TDR Re-zone / Up-zone (2) 20 units/ac Development Program Development Program Development Program Residential Residential Residential # of units w/ existing zoning 0 # of units w/ existing zoning 0 # of units w/ existing zoning 0 # of units w/ TDR up-zone 28 # of units w/ TDR up-zone 28 # of units w/ TDR up-zone 28 # of Total Units 28 # of Total Units 28 # of Total Units 28 Average Market Rate Unit Size (3) 1,250 Average Market Rate Unit Size (3) 1,250 Average Market Rate Unit Size (3) 1,250 Average Affordable Rate Unit Size (3) 850 Average Affordable Rate Unit Size (3) 850 Average Affordable Rate Unit Size (3) 850 Commercial Commercial Commercial Allowed square footage 0 Allowed square footage 0 Allowed square footage 0 Additional Up-zone square footage 0 Additional Up-zone square footage 0 Additional Up-zone square footage 0 Parking Parking Parking Residential Spaces (4) 63 Residential Spaces (4) 59 Residential Spaces (4) 55 Commercial Spaces (4) 0 Commercial Spaces (4) 0 Commercial Spaces (4) 0 Building Revenue Assumption Total Building Revenue Assumption Total Building Revenue Assumption Total Residential Residential Residential Market Rate Units 100% 28 Market Rate Units 85% 24 Market Rate Units 70% 20 Average Sale Price / sqft (5) $900 Average Sale Price / sqft (5) $900 Average Sale Price / sqft (5) $900 Average Unit Sale Price (5) $1,125,000 31,500,000 Average Unit Sale Price (5) $1,125,000 26,775,000 Average Unit Sale Price (5) $1,125,000 22,050,000 Affordable Units 0% 0 Affordable Units 15% 4 Affordable Units 30% 8 Area Median Income (4-person HH) $64,700 Area Median Income (4-person HH) $64,700 Area Median Income (4-person HH) $64,700 Income Category (% of AMI) % Income Category (% of AMI) % Income Category (% of AMI) % Sales Price $450,000 0 Sales Price $450,000 1,890,000 Sales Price $450,000 3,780,000 Commercial 0 0 Commercial 0 0 Commercial 0 0 Lease Rate Lease Rate Lease Rate Revenue Periods/year Revenue Periods/year Revenue Periods/year Gross Annual Income Gross Annual Income Gross Annual Income Less Vacancy Less Vacancy Less Vacancy Less Operating Expenses Less Operating Expenses Less Operating Expenses Net Operating Income Net Operating Income Net Operating Income Capitalized Value 0 Capitalized Value 0 Capitalized Value 0 Total Project Revenue 31,500,000 Total Project Revenue 28,665,000 Total Project Revenue 25,830,000 Project Costs Project Costs Project Costs Land (per acre and total, see note 6) $1,500,000 3,000,000 Land (per acre and total, see note 6) $1,500,000 3,000,000 Land (per acre and total, see note 6) $1,500,000 3,000,000 Value of TDR's (7) 10,948,352 Value of TDR's (7) 9,319,530 Value of TDR's (7) 7,690,737 Total Land Value 13,948,352 Total Land Value 12,319,530 Total Land Value 10,690,737 Building Construction Building Construction Building Construction Res. Construction Costs per sqft $130 4,550,000 Res. Construction Costs per sqft $130 4,331,600 Res. Construction Costs per sqft $130 4,113,200 Site Development Costs (8) 15% 682,500 Site Development Costs (8) 15% 649,740 Site Development Costs (8) 15% 616,980 Comm. Construction Costs per sqft $80 0 Comm. Construction Costs per sqft $80 0 Comm. Construction Costs per sqft $80 0 Parking (podium) Construction (per space see note $17,000 1,071,000 Parking (podium) Construction (per space see note $17, ,600 Parking (podium) Construction (per space see note $17, ,200 Indirect Costs (10) 25% 2,325,875 Indirect Costs (10) 25% 2,245,235 Indirect Costs (10) 25% 2,164,595 Developer Fee (11) 3% 945,000 Developer Fee (11) 3% 859,950 Developer Fee (11) 3% 774,900 Financing Financing Financing Debt Financing (12) 1,834,773 Debt Financing (12) 1,669,641 Debt Financing (12) 1,504,512 Equity Partner Financing (see profit spilt below, note 13) Equity Partner Financing (see profit spilt below, note 13) Equity Partner Financing (see profit spilt below, note 13) Marketing & Commission (% of Tot.Rev) 4.5% 1,417,500 Marketing & Commission (% of Tot.Rev) 4.5% 1,289,925 Marketing & Commission (% of Tot.Rev) 4.5% 1,162,350 Total Project Costs 26,775,000 Total Project Costs 24,365,221 Total Project Costs 21,955,474 Net Profit 4,725,000 Net Profit 4,299,779 Net Profit 3,874,526 Net Profit as a % of Revenues (expected to be 15%) 15.0% Net Profit as a % of Revenues (expected to be 15%) 15.0% Net Profit as a % of Revenues (expected to be 15%) 15.0% (Profit Split: 20% to developer and 80% to equity partner) (Profit Split: 20% to developer and 80% to equity partner) (Profit Split: 20% to developer and 80% to equity partner) Developer Funds Available for TDRs Developer Funds Available for TDRs Developer Funds Available for TDRs Total Value of TDR's (from above) 10,948,352 Total Value of TDR's (from above) 9,319,530 Total Value of TDR's (from above) 7,690,737 Less Pre-Development Agreement Land Payment (14) 5% 1,575,000 Less Pre-Development Agreement Land Payment (14) 5% 1,433,250 Less Pre-Development Agreement Land Payment (14) 5% 1,291,500 Developers' Total Willingness to Pay for TDRs 9,373,352 Developers' Total Willingness to Pay for TDRs 7,886,280 Developers' Total Willingness to Pay for TDRs 6,399,237 Per unit Willingness to PAY for TDR 334,763 Per unit Willingness to PAY for TDR 281,653 Per unit Willingness to PAY for TDR 228,544 NOTES: NOTES: NOTES: (1) 70% of total parcel(s) size (1) 70% of total parcel(s) size (1) 70% of total parcel(s) size (2) Estimated allowed up-zoning based on surrounding landuses and densities; (2) Estimated allowed up-zoning based on surrounding landuses and densities; (2) Estimated allowed up-zoning based on surrounding landuses and densities; three stories- two residential above one level of above street level parking three stories- two residential above one level of above street level parking three stories- two residential above one level of above street level parking (3) Average size for a luxury 2-bedroom townhome at 20 units/acre (3) Average size for a luxury 2-bedroom townhome at 20 units/acre (3) Average size for a luxury 2-bedroom townhome at 20 units/acre (4) 2 for every market rate unit, 1 for workforce and 1 for every 4 units; # comm lots = 1/500sqft comm (4) 2 for every market rate unit, 1 for workforce and 1 for every 4 units; # comm lots = 1/500sqft comm (4) 2 for every market rate unit, 1 for workforce and 1 for every 4 units; # comm lots = 1/500sqft comm (5) Based on surrounding like sales from dataquick, MLS, County Assessor (5) Based on surrounding like sales from dataquick, MLS, County Assessor (5) Based on surrounding like sales from dataquick, MLS, County Assessor (6) Determined from sales of property with like zoning and/or County Assessor appraised Land value (6) Determined from sales of property with like zoning and/or County Assessor appraised Land value (6) Determined from sales of property with like zoning and/or County Assessor appraised Land value (7) Added value to the land with TDR up-zone; determined by a fixed net profit of 15% (7) Added value to the land with TDR up-zone; determined by a fixed net profit of 15% (7) Added value to the land with TDR up-zone; determined by a fixed net profit of 15% (8)% construction costs for grading, sewer, water, and roads (8)% construction costs for grading, sewer, water, and roads (8)% construction costs for grading, sewer, water, and roads (9) Assumes podium style parking with each space 380 sf at a cost of $45/sf for a total of $17,000/space (9) Assumes podium style parking with each space 380 sf at a cost of $45/sf for a total of $17,000/space (9) Assumes podium style parking with each space 380 sf at a cost of $45/sf for a total of $17,000/space (10) % of direct costs that includes permitting costs, impact fees, legal, insurance and design costs (10) % of direct costs that includes permitting costs, impact fees, legal, insurance and design costs (10) % of direct costs that includes permitting costs, impact fees, legal, insurance and design costs (11) % of revenue developers charge to cover project overhead (11) % of revenue developers charge to cover project overhead (11) % of revenue developers charge to cover project overhead (12) Assumes bank loans 75% of total project costs, with a linear draw; interest payment 7% on 60% of this amount for 2 years (12) Assumes bank loans 75% of total project costs, with a linear draw; interest payment 7% on 60% of this amount for 2 years (12) Assumes bank loans 75% of total project costs, with a linear draw; interest payment 7% on 60% of this am (13) Private equity investors expect 80% split of net profit with no 'preferred return' payments during development period (13) Private equity investors expect 80% split of net profit with no 'preferred return' payments during development period (13) Private equity investors expect 80% split of net profit with no 'preferred return' payments during developm (14) % of total revenue landowner receives as payment above baseline land costs in a pre-development agreement; (14) % of total revenue landowner receives as payment above baseline land costs in a pre-development agreement; (14) % of total revenue landowner receives as payment above baseline land costs in a pre-development agree this amount compensates receiving site land owner for capitalized land value with a TDR up-zone this amount compensates receiving site land owner for capitalized land value with a TDR up-zone this amount compensates receiving site land owner for capitalized land value with a TDR up-zone 117
130 Appendix E: MOU & ALT 1 DEVELOPMENT RIGHT VALUATION 1. Hedonic Valuation Model Study Design In order to determine the underlying value of residential property when certain locational and improvement characteristics are taken into consideration, a hedonic model was used. This analysis entails regressing measures of certain attributes against sale price information. The model is described in detail below. Given the location and nature of the Naples property, it was decided to limit analysis to single-family residential properties located within the ZIP Code zones that abut the coast in the region of Malibu in Los Angeles County and in Ventura, Santa Barbara and San Luis Obispo Counties. Sales of vacant property were also considered, but there were too few sales during the time period in covered by the study to permit any meaningful statistical analysis. Data Collection Data on sales of single family residential properties taking place between January 1, 2000, and March 31, 2004, were purchased from DataQuick Corporation. The quality of data provided by DataQuick varied by county since some county assessor s offices provide DataQuick with more complete information than others. San Luis Obispo posed a particular challenge, as the DataQuick data for this county had very few records that included structure attributes, such as parcel or structure square footage. Consequently, additional data from Assessor books maintained by the San Luis Obispo County Assessor s Office were purchased. The books purchased provided detailed information including information on construction quality and views -- on properties in Pismo Beach, Shell Beach, Los Osos, Morro Bay and Cambria. Due to budgetary constraints, we were not able to purchase data for all areas within the San Luis coastal ZIP Code area. Rather, Assessor books were purchased based on how many DataQuick records they would complete. The DataQuick and San Luis Obispo County data were augmented with neighborhood characteristic information at the census tract level from Census 2000, and with distance variables generated by ArcView, a GIS software package. The completed dataset included 8,170 observations. 118
131 Since the sales spanned several years, prices were converted to current dollars (2005) using quarterly home price appreciation figures based on data for California published by the FDIC. 25 After considering several specifications, we chose a log-linear model of the following form: ln(y) = (ln x 1 ) + 2 (ln x 2 ) + + n (ln x n ) + e where 0 represents a constant term, n represents the number of regressors in the model, and 1 through n represent the coefficients associated with the natural logs (ln) of independent variables x 1 through x n. The benefits of this model are 1) that it facilitates a least squares regression analysis by smoothing non-linear relationships and 2) in this form the log coefficients can be interpreted as elasticities of demand for the various attributes given a relative change in price since the change in log x approximates the relative change in the variable x itself. The equation estimated by the model can also be translated back to its exponential form by using specific quantities for each variable so that property prices can be estimated. The empirical model attempted to decompose the aggregate value of a property into the value associated with its component parts, including the land, housing structure(s) on the parcel, parcel amenities and disamenities, and neighborhood or regional amenities and disamenities. The dependent variable was sale price (valuation) and the independent variables included the following: Lot square footage Structure square footage Age of the structure Number of bedrooms Number of bathrooms Dummy variable indicating the presence (1) or absence (0) of a pool Distance to the ocean in meters (ArcView) Distance in meters to nearest airport with scheduled commercial flights (ArcView) Distance in meters to the closest major thoroughfare (ArcView) Distance in meters to the nearest railroad line (ArcView) Percentage of residents of the census tract identifying themselves as white (Census 2000) Average journey to work in minutes reported for the census tract (Census 2000) Percent of unemployment reported for the census tract (Census 2000)
132 Average annual household income reported for census tract (Census 2000) Percent of census tract residents below poverty line (Census 2000) Percent of vacant households in census tract (Census 2000) Median year of construction for houses in census tract (Census 2000) Dummy variables for Los Angeles, Santa Barbara, and San Luis Obispo Counties Dummy variable indicating whether the property lies on the seaward or inland side of either US101 or Rte. 1 (Pacific Coast Highway), whichever is relevant for the particular property. The seaward/inland dummy variable was included as a variable in the regression on the complete dataset and was used to partition the dataset so that the seaward and inland properties could be studied separately to see if certain variables were relatively more or less important in these two areas. For these estimates, a parcel was defined as seaward (inland) if it was located closer to (further from) the ocean than the nearest major auto thoroughfare. A separate set of regressions was run on the San Luis Obispo properties to determine the influence of views and construction quality on housing price. In many instances sales price information was not reported. In these cases the assessor s valuation was used as a proxy. In other cases the reported sale price was either much lower or much higher than the assessor s valuation. To correct for this, we calculated the ratio of sales price to assessed valuation. Where the ratio was between 0.8 and 1.2, the sale price was used; in the other cases, the assessed valuation was used since in California this is based on sale price. Slightly less than 10% of the observations in the original dataset were deemed as extreme outliers based on the amounts they contributed to residuals and leverage in early runs of the model. These observations were dropped, leaving 7,456 observations that were used in the analysis. The Results The results of the regression analysis are displayed in Exhibit X1, X2 and X3 below. The first set of coefficients (Exhibit 1) relates to the regression in which all properties were considered and the dummy variable for seaward and inland side of the relevant highway (US 101 or Rte. 1) was included in the equation. This model provides an extremely good fit for the data, as the specification explains nearly 80% of the variation in home prices. The remaining 20% is attributable to other characteristics not in the model because of a lack of readily available data (e.g. quality of construction), heterogeneous preferences (e.g. preference for particular floor plans or architectural details), or other factors. 120
133 The coefficients generated by this model specification largely conformed to expectations. The model estimates suggest that price is negatively related to distance from the ocean (i.e., price falls as distance rises), the time required to journey to work, the age of the structure, the median age of homes in the census tract, and the distance from a commercial airport. Location on the seaward side of the highway was also negatively associated with price, but the coefficient is small ( ) and is not statistically significant (-1.45) at the 95% confidence level. Relative to Ventura County (the county for which a dummy variable was not included), properties located in Santa Barbara County (0.259) and Malibu (0.404) were priced at a premium, while prices for parcels in San Luis Obispo County are relatively lower (-0.090) holding other factors constant. Distance to major thoroughfare and railroad lines have positive coefficients as expected; as distance from these increases so does house price. The main exception to standard expectations involved the number of bedrooms, which showed a a negative coefficient. Other hedonic studies have found a similar negative relationship between value and the number of bedrooms, though. 26 The second regression included only those properties on the seaward side of either US 101 or Rte. 1(PCH), and explained about 81% of the variation in prices. In this specification, the sign of a few variables changed from those generated in the first run. Specifically, the coefficient for bathrooms was negative, but it was also statistically insignificant. The coefficient for percent white in the census tract also changed sign, which may reflect the influence of the higher-priced and more heterogeneous Los Angeles and Santa Barbara census tracts relative to the highly homogenous census tracts in San Luis Obispo County. The other variable to change sign was distance to railroad. This may relate to the location of the railroad relative to the ocean in many areas of the study area where being closer to the railroad also means being closer to the beach. The coefficient for distance to highway remained positive, but was statistically insignificant in this specification. The coefficient for the San Luis Obispo dummy variable also changed sign, indicating that properties on the seaward side of US 101 there are relatively more expensive than those observations that are seaward in Ventura County. The third regression considered those properties on the inland side of US 101 and/or Rte. 1. This specification also explains about 80% of variation in price. The coefficients in this regression were substantially like those in the first. The only one to change sign was that for the percent unemployed. The sign for the San Luis Obispo dummy variable was again negative. 26 Sirmans, G. Stacy, David Macpherson and Emily Zietz, The Composition of Hedonic Pricing Models, Journal of Real Estate Literature, 1/1/
134 A second set of regressions was run using only the data from San Luis Obispo. This dataset contains information on the presence of a view and on quality of construction that was not readily available for the other counties. The specification which contains all properties, regardless of whether they are inland or seaward relative to US 101 or Rte. 1 explains about 67% of the variation in house prices, and all census tract variables were statistically insignificant. The specification which considers only those properties on the seaward side of the highway does a better job of explaining the variation in house price (71%). And as would be expected the one which used data only from the inland side properties did worse (57%). The latter was based on a very small dataset (287 observations). The San Luis Obispo specifications for all properties and inland properties indicate that the presence of a view contributes about 8% to the valuation. View appears to be slightly less important on the seaward side (7.4%) than on the inland side of the major highway. 122
135 Exhibit 1 All Properties, All Counties (Seaward/Inland Dummy) Exhibit 2 Seaward Properties, All Counties 123
136 Exhibit 3 Inland Properties, All Counties Exhibit 4 All Properties, San Luis Obispo County (Seaward/Inland Dummy) 124
137 Exhibit 5 Seaward Properties, San Luis Obispo County Exhibit 6 Inland Properties, San Luis Obispo County 125
138 Using the Regression Equations Several hypothetical scenarios were investigated using the various models. For this purpose it was assumed that the census tract variables were those of Santa Barbara County census tract The runs compared a 40,000 square foot parcel with 4,000 square feet of new structures, 4 bedrooms, 4.5 baths and a pool with a 20,000 square foot parcel improved with the same new structure square footage, the same number of bedrooms and bathrooms, and a pool. Table 1: Using All Counties, All Properties (Seaward/Inland Dummy) Estimate Estimate - Difference seaward inland 40,000 sf lot $3,845,162 $2,212,512 $1,632,650 20,000 sf lot $3,085,369 $1,898,862 $1,186,507 Value difference: Single lot v. subdivided 40,000 sf lot into 2 20,000 sf lots $2,325,576 $1,585,212 Table 2: Using All Counties, Seaward and Inland Models Estimate Estimate - Difference seaward inland 40,000 sf lot $4,295,274 $2,064,081 $ 2,231,193 20,000 sf lot $3,693,513 $1,789,870 $ 1,903,643 Value difference: Single lot v. subdivided 40,000 sf lot into 2 20,000 sf lots $3,091,752 $1,515,659 Using the figures from Table 1, we consider the reduction in the number of parcels that could be created in a 40,000 square foot area on the seaward side from 2 to1. Whereas 2 parcels developed with the same structure square footage would have an estimated valuation of approximately $6.2 million, a single lot with identical improvements would be valued at $3.8 million according to the model. The difference in valuation would be slightly more than $2.3 million. Similarly, if the number of parcels that could be developed in a 40,000 square foot area on the inland side were increased from 1 to 2, the valuation of those parcels developed with identical structures would be $3.8 million. This would be a $1.6 million increase over the valuation of a single parcel (40,000 sq. ft.) developed with the same structures. Given an instance where the same people (or company) owned two 40,000 square foot parcels (one on the seaward side of the highway that could be split by right into 2 developable parcels and another on the inland side that could only be developed by right with one dwelling), they would have rights to three developable parcels. If the right to create a second parcel and construct a second dwelling were transferred from the seaward property to the inland property, the loss in valuation would be approximately $800,000 (the difference between the 126
139 loss of potential valuation on the seaward side of $2.3 million reduced by the increase in potential valuation of $1.6 million on the inland side). Conclusions The model helps to quantify the impact on valuation that adjacency and proximity to the ocean have on property valuation. It provides a method for finding the difference in property value if building envelopes are transferred from one area to another. The reported estimates do not include a consideration of view from the property. The San Luis Obispo County data indicate that a view increased the valuation by about 7% to 8% all else held constant. If one assumes a similar relationship for Santa Barbara County, one would need to make an appropriate adjustment. Ideally, however, one would construct a dataset that includes view information for Santa Barbara County, when such data become available, and re-estimate the model to determine if the relationship holds in Santa Barbara County. 2. Calculation of Development Right Valuation The hedonic analysis described above only values the market selling price of the land and improvements. This total value, however, is not the amount that would be transferred in a TDR mechanism. Rather, it is the dollar value of the development right on each of the proposed lots that we look to as the transferable commodity. Lot 57 (agricultural support facility) and Lots Dp-14, 132 (existing residences) are not included in the valuation analysis. Similar to determining the willingness to pay for developers of receiving sites, development right values for the proposed lots in the Santa Barbara Ranch project were backed into by analyzing the total market value of each home relative to the array of costs incurred to build each of the houses. The Microsoft excel worksheets below illustrate the pro-forma methodology we used; worksheets are included for each of the proposed lots in both the MOU and Alt 1 projects. We measure development right value using the following basic formula: Development Right Value = The Capitalized Land Value + Developer s Expected Profit Capitalized land value is simply the added value the land acquires with newly entitled residential development. In order to calculate capitalized land value it was treated as a variable cost in the pro-forma model. In other words it was subtracted from the total market value of the proposed lot and improvements just like the underlying value of land for agricultural purposes and all the cost of preparing the site and constructing the actual house. However, unlike the other fixed costs in the model, capitalized land value varies to produce a net profit that 127
140 is 15% of revenue. The 15% net profit was taken to be the industry s expected net margin through conversations with local area developers. Developer s Expected Profit is defined to be 50% of the project s 15% net profit. In the development industry the common method of financing projects is both with a lending institution and private equity investors. These equity partners expect a higher return on there investments which is captured in a project profit split (usually 80%/20% investor/developer) at the end of the project. Since the money needed for development of certain lots would not be borrowed if development rights are sold, this extra profit should not be considered in the baseline. For this reason we take a modest approach and assume the developers expected profit to be 50% of the project profit. Using this approach we are trying to ascertain the Santa Barbara Ranch project owner s selling price of the potential development rights which ultimately would likely result in a negotiation. Yet our analysis serves as a basis to estimate transfer feasibility. The Total Value cell contains the estimated sale price of the proposed house as determined in our hedonic analysis in section 7. We use both a 100% and 70% house size valuation with either a 1 year or 2 year appreciation (8-9%) followed by discounting to present value (2-3%) depending on whether the lot is located in the coastal zone or inland area. The pro-forma model strives to accurately portray the array of fixed costs a developer would incur in developing the Santa Barbara Ranch project. These fixed project costs are organized as follows: 1. Pre-development Costs (land, land carry, entitlement, professional fees, etc.) 2. Development Costs (building & Construction, Site development costs, indirects) 3. Developer Fee (costs of developer overhead) 4. Marketing Costs 5. Financing Costs 6. Commission & Closing Costs The costs of the land with existing agricultural zoning was determined to be $22,000/acre through research of like sales. The costs to carrying the land are assumed to be 8%/year of the agricultural land value since date of purchase (1997). Various other pre-development costs are also modeled in the pro-forma. Construction cost for luxury style homes are in the range of $200-$250/sqft; double that of typical single family housing. Site development costs (costs associated with grading, sewer, water, and roads) are assumed to be 35% of total building and construction costs. The site 128
141 development costs are higher than what a typical development would be because of the site s distance from urban infrastructure prompts a proposed waste water treatment plant, higher costs of supplying water, and intensive grading for road access. Various indirect development costs including impact fees, permit fees, and insurance are also modeled in the pro-forma. Developer fees the costs of the developer s overhead, were assumed to be 3% of sales. Financing costs - that is, the interest paid to the banks for lent money, is calculated assuming a linear draw on debt with an interest rate that is 1% above prime rates. This amounts to an 8% interest payment on 60% of 75% of all costs not including the land. The remaining 25% of costs are assumed to be financed by equity investors. Marketing costs are assumed to be 1% of sales; Commission & Closing costs are modeled to at 2.5% of sales. Project Net Profit was determined by subtracting the total project costs from the total value. We use the excel tool solver to calculate a Capitalized land Value with a constraint that the net profit be fixed at 15% of total value, and the assumed fixed costs. It should be pointed out that the owner of the Santa Barbara Ranch project is assumed to capture not only his 50% share of the project net profit, but also the capitalized land value. Thus, in order for the owner to sell development rights he must be compensated for both his expected profit and the land s capitalized value. This would explain our basic equation for development right value as the sum of these two. Further detailed pro-forma assumptions are indicated in the notes in the excel worksheets. We illustrate the pro-forma calculations for the development rights associated with the Santa Barbara Ranch Project for only a small number of sites. Complete calculations for all the development right valuations in both the MOU and ALT 1 can be found in technical Appendix E on the County s web site. The example calculations we include here are for the following Lot #s in the ALT 1 Project: ALT 1 project: 1. Coastal zone Bluff-top Lot Coastal Zone Lot 42 located between Hwy 101 and Railroad tracks 3. Coastal Zone Lot 104 north of Hwy Inland Santa Barbara Ranch Lot Inland Option Property Lot
142 6. inland Dos Pueblos Lot DP-1 130
143 Lot #122 Lot #122 SBR Developmetnt Right Valuation -100% project approval, % project '08 Santa Barbara County TDR Study Lot Plans / Revenue Lot Size (1) Planned House Sq Ft (2) 8,400 5,880 Total Value (3) 23,468,936 20,917,032 price per sq ft Project Costs pre-development costs Land (per acre and total, see note 4) $22, ,900 $22, ,900 Land holding costs interest on land note (5) 8.0% 263, % 263,120 property taxe (6) 1.2% 39, % 39,468 entitlement/legal fees (7) 10.0% 63, % 63,149 professional fees ($/sf) (8) $20 $168,000 $20 $117,600 development costs building & Construction costs Res. Construction Costs per sqft (9) $250 2,100,000 $250 1,470,000 Site Development Costs (10) 35% 1,130,769 same 1,130,769 Indirect Costs impact fees 30,000 30,000 building permit 5,000 5,000 insurance (%of revenue) 1.5% 352, % 313,755 contingency (% of costruction costs) 5.0% 161, % 130,038 Developer Fee (11) 3.0% 704, % 627,511 Marketing 1.0% 234, % 209,170 Development Financing Debt Financing (12) 579, ,202 Equity Partner Financing (13, see profit spilt below) Commission, Closing Costs (% of revenue) 3.0% 704, % 627,511 Capitalized Land Value (14) $ 13,083,900 $ 11,945,262 Total Project Costs 19,948,595 17,779,456 Project Net Profit 3,520,340 3,137,576 Project Net Profit as a % of Revenues 15.0% 15.0% (Profit Split: 50% to developer and 50% to equity partner) developers' expected profit (13) 1,760,170 1,568,788 NOTES: (1) As indicated in project plan (2) House sqft as shown in project plan (3) Average of Inland and seward methods from Hedonic Analysis (4) Determined from sales of property with like Ag zoning and/or County Assessor appraised Land value (5) Interest payment for raw land purchase; assuming 8%/yr for 10 years of land ownership. Land purchased in '97 (6) 1.2%/yr property tax payment for 10 years of land ownership. (7) % of land and land holding costs for legal fees and land entitlement (8) Costs/sf of home for professional fees: architecture/design, engineering, environmental (9) Residential sf construction costs are typically double the industry standard of $125/sqft for luxury homes; $250/sf for homes valued over $8 million, $200/sf for homes under $8million (10) % of construction costs for grading, sewer, water, and roads; higher costs with proposed waste water treatment plant and other infrastructure requirements (11) % of revenue developers charge to cover project overhead (12) Assume bank loans 75% of total project costs, not including entitlement, with a linear draw and interest payment that is 8% on 60% of this amount for 3 years (13) Based on equity partner involvement, investor is assumed to expect at minimum 50% of net profit as a return on his/her investment, NOT including the captured entitlement value; developer captures the remaining 50% of net profit. (14) Added value capitalized into land with residential development; developer/ investor captures this amount in addition to net profit upon sale 131
144 Lot #42 Lot #42 SBR Developmetnt Right Valuation -100% project approval, % project '08 Santa Barbara County TDR Study Lot Plans / Revenue Lot Size (1) Planned House Sq Ft (2) 5,992 4,194 Total Value (3) $ 6,502,462 $ 5,816,830 price per sq ft Project Costs pre-development costs Land (per acre and total, see note 4) $22, ,580 $22, ,580 Land holding costs interest on land note (5) 8.0% 130, % 130,064 property taxe (6) 1.2% 19, % 19,510 entitlement/legal fees (7) 10.0% 31, % 31,215 professional fees ($/sf) (8) $20 $119,840 $20 $83,888 development costs building & Construction costs Res. Construction Costs per sqft (9) $250 1,498,000 $250 1,048,600 Site Development Costs (10) 35% 806,615 same 806,615 Indirect Costs impact fees 30,000 30,000 building permit 5,000 5,000 insurance (%of revenue) 1.5% 97, % 87,252 contingency (% of costruction costs) 5.0% 115, % 92,761 Developer Fee (11) 3.0% 195, % 174,505 Marketing 1.0% 65, % 58,168 Development Financing Debt Financing (12) 356, ,260 Equity Partner Financing (13, see profit spilt below) Commission, Closing Costs (% of revenue) 3.0% 195, % 174,505 Capitalized Land Value (14) $ 1,699,805 $ 1,749,376 Total Project Costs 5,527,086 4,944,299 Project Net Profit 975, ,530 Project Net Profit as a % of Revenues 15.0% 15.0% (Profit Split: 50% to developer and 50% to equity partner) developers' expected profit (13) 487, ,265 NOTES: (1) As indicated in project plan (2) House sqft as shown in project plan (3) Average of Inland and seward methods from Hedonic Analysis (4) Determined from sales of property with like Ag zoning and/or County Assessor appraised Land value (5) Interest payment for raw land purchase; assuming 8%/yr for 10 years of land ownership. Land purchased in '97 (6) 1.2%/yr property tax payment for 10 years of land ownership. (7) % of land and land holding costs for legal fees and land entitlement (8) Costs/sf of home for professional fees: architecture/design, engineering, environmental (9) Residential sf construction costs are typically double the industry standard of $125/sqft for luxury homes; $250/sf for homes valued over $8 million, $200/sf for homes under $8million (10) % of construction costs for grading, sewer, water, and roads; higher costs with proposed waste water treatment plant and other infrastructure requirements (11) % of revenue developers charge to cover project overhead (12) Assume bank loans 75% of total project costs, not including entitlement, with a linear draw and interest payment that is 8% on 60% of this amount for 3 years (13) Based on equity partner involvement, investor is assumed to expect at minimum 50% of net profit as a return on his/her investment, NOT including the captured entitlement value; developer captures the remaining 50% of net profit. (14) Added value capitalized into land with residential development; developer/ investor captures this amount in addition to net profit upon sale 132
145 Lot #104 Lot #104 SBR Developmetnt Right Valuation -100% project approval, % project '08 Santa Barbara County TDR Study Lot Plans / Revenue Lot Size (1) Planned House Sq Ft (2) 3,467 2,427 Total Value (3) $ 5,972,976 $ 4,587,331 price per sq ft Project Costs pre-development costs Land (per acre and total, see note 4) $22,000 83,600 $22,000 83,600 Land holding costs interest on land note (5) 8.0% 66, % 66,880 property taxe (6) 1.2% 10, % 10,032 entitlement/legal fees (7) 10.0% 16, % 16,051 professional fees ($/sf) (8) $20 $69,340 $20 $48,538 development costs building & Construction costs Res. Construction Costs per sqft (9) $ ,750 $ ,053 Site Development Costs (10) 35% 466,712 same 466,712 Indirect Costs impact fees 30,000 30,000 building permit 5,000 5,000 insurance (%of revenue) 1.5% 89, % 68,810 contingency (% of costruction costs) 5.0% 66, % 50,638 Developer Fee (11) 3.0% 179, % 137,620 Marketing 1.0% 59, % 45,873 Development Financing Debt Financing (12) 220, ,439 Equity Partner Financing (13, see profit spilt below) Commission, Closing Costs (% of revenue) 3.0% 179, % 137,620 Capitalized Land Value (14) $ 2,668,204 $ 2,017,366 Total Project Costs 5,077,030 3,899,232 Project Net Profit 895, ,100 Project Net Profit as a % of Revenues 15.0% 15.0% (Profit Split: 50% to developer and 50% to equity partner) developers' expected profit (13) 447, ,050 NOTES: (1) As indicated in project plan (2) House sqft as shown in project plan (3) Average of Inland and seward methods from Hedonic Analysis (4) Determined from sales of property with like Ag zoning and/or County Assessor appraised Land value (5) Interest payment for raw land purchase; assuming 8%/yr for 10 years of land ownership. Land purchased in '97 (6) 1.2%/yr property tax payment for 10 years of land ownership. (7) % of land and land holding costs for legal fees and land entitlement (8) Costs/sf of home for professional fees: architecture/design, engineering, environmental (9) Residential sf construction costs are typically double the industry standard of $125/sqft for luxury homes; $250/sf for homes valued over $8 million, $200/sf for homes under $8million (10) % of construction costs for grading, sewer, water, and roads; higher costs with proposed waste water treatment plant and other infrastructure requirements (11) % of revenue developers charge to cover project overhead (12) Assume bank loans 75% of total project costs, not including entitlement, with a linear draw and interest payment that is 8% on 60% of this amount for 3 years (13) Based on equity partner involvement, investor is assumed to expect at minimum 50% of net profit as a return on his/her investment, NOT including the captured entitlement value; developer captures the remaining 50% of net profit. (14) Added value capitalized into land with residential development; developer/ investor captures this amount 133
146 Lot #49 Lot #49 SBR Developmetnt Right Valuation -100% project approval, % project '07 Santa Barbara County TDR Study Lot Plans / Revenue Lot Size (1) Planned House Sq Ft (2) 5,256 3,679 Total Value (3) $ 4,262,766 $ 3,777,102 price per sq ft Project Costs pre-development costs Land (per acre and total, see note 4) $22, ,580 $22, ,580 Land holding costs interest on land note (5) 8.0% 130, % 130,064 property taxe (6) 1.2% 19, % 19,510 entitlement/legal fees (7) 10.0% 31, % 31,215 professional fees ($/sf) (8) $20 $105,120 $20 $73,584 development costs building & Construction costs Res. Construction Costs per sqft (9) $225 1,182,600 $ ,820 Site Development Costs (10) 35% 636,785 same 636,785 Indirect Costs impact fees 30,000 30,000 building permit 5,000 5,000 insurance (%of revenue) 1.5% 63, % 56,657 contingency (% of costruction costs) 5.0% 90, % 73,230 Developer Fee (11) 3.0% 127, % 113,313 Marketing 1.0% 42, % 37,771 Development Financing Debt Financing (12) 279, ,255 Equity Partner Financing (13, see profit spilt below) Commission, Closing Costs (% of revenue) 3.0% 127, % 113,313 Capitalized Land Value (14) $ 587,527 $ 672,440 Total Project Costs 3,623,347 3,210,537 Project Net Profit 639, ,565 Project Net Profit as a % of Revenues 15.0% 15.0% (Profit Split: 50% to developer and 50% to equity partner) developers' expected profit (13) 319, ,283 NOTES: (1) As indicated in project plan (2) House sqft as shown in project plan (3) Average of Inland and seward methods from Hedonic Analysis (4) Determined from sales of property with like Ag zoning and/or County Assessor appraised Land value (5) Interest payment for raw land purchase; assuming 8%/yr for 10 years of land ownership. Land purchased in '97 (6) 1.2%/yr property tax payment for 10 years of land ownership. (7) % of land and land holding costs for legal fees and land entitlement (8) Costs/sf of home for professional fees: architecture/design, engineering, environmental (9) Residential sf construction costs are typically double the industry standard of $125/sqft for luxury homes; $250/sf for homes valued over $8 million, $200/sf for homes under $8million (10) % of construction costs for grading, sewer, water, and roads; higher costs with proposed waste water treatment plant and other infrastructure requirements (11) % of revenue developers charge to cover project overhead (12) Assume bank loans 75% of total project costs, not including entitlement, with a linear draw and interest payment that is 8% on 60% of this amount for 3 years (13) Based on equity partner involvement, investor is assumed to expect at minimum 50% of net profit as a return on his/her investment, NOT including the captured entitlement value; developer captures the remaining 50% of net profit. (14) Added value capitalized into land with residential development; developer/ investor captures this amount in addition to net profit upon sale 134
147 Lot #201 Lot #201 SBR Developmetnt Right Valuation -100% project approval, % project '07 Santa Barbara County TDR Study Lot Plans / Revenue Lot Size (1) Planned House Sq Ft (2) 5,102 3,571 Total Value (3) $ 4,062,462 $ 3,550,075 price per sq ft Project Costs pre-development costs Land (per acre and total, see note 4) $22, ,340 $22, ,340 Land holding costs interest on land note (5) 0.0% - 0.0% - property taxe (6) 0.0% - 0.0% - entitlement/legal fees (7) 10.0% 15, % 15,334 professional fees ($/sf) (8) $20 $102,040 $20 $71,428 development costs building & Construction costs Res. Construction Costs per sqft (9) $225 1,147,950 $ ,565 Site Development Costs (10) 35% 618,127 same 618,127 Indirect Costs impact fees 30,000 30,000 building permit 5,000 5,000 insurance (%of revenue) 1.5% 60, % 53,251 contingency (% of costruction costs) 5.0% 88, % 71,085 Developer Fee (11) 3.0% 121, % 106,502 Marketing 1.0% 40, % 35,501 Development Financing Debt Financing (12) 269, ,238 Equity Partner Financing (13, see profit spilt below) Commission, Closing Costs (% of revenue) 3.0% 121, % 106,502 Capitalized Land Value (14) $ 678,372 $ 729,694 Total Project Costs 3,453,093 3,017,567 Project Net Profit 609, ,508 Project Net Profit as a % of Revenues 15.0% 15.0% (Profit Split: 50% to developer and 50% to equity partner) developers' expected profit (13) 304, ,254 NOTES: (1) As indicated in project plan (2) House sqft as shown in project plan (3) Average of Inland and seward methods from Hedonic Analysis (4) Determined from sales of property with like Ag zoning and/or County Assessor appraised Land value (5) Interest payment for raw land purchase; assuming 8%/yr for 10 years of land ownership. Land purchased in '97 (6) 1.2%/yr property tax payment for 10 years of land ownership. (7) % of land and land holding costs for legal fees and land entitlement (8) Costs/sf of home for professional fees: architecture/design, engineering, environmental (9) Residential sf construction costs are typically double the industry standard of $125/sqft for luxury homes; $250/sf for homes valued over $8 million, $200/sf for homes under $8million (10) % of construction costs for grading, sewer, water, and roads; higher costs with proposed waste water treatment plant and other infrastructure requirements (11) % of revenue developers charge to cover project overhead (12) Assume bank loans 75% of total project costs, not including entitlement, with a linear draw and interest payment that is 8% on 60% of this amount for 3 years (13) Based on equity partner involvement, investor is assumed to expect at minimum 50% of net profit as a return on his/her investment, NOT including the captured entitlement value; developer captures the remaining 50% of net profit. (14) Added value capitalized into land with residential development; developer/ investor captures this amount in addition to net profit upon sale 135
148 Lot DP-1 Lot DP-1 SBR Developmetnt Right Valuation -100% project approval, % project '07 Santa Barbara County TDR Study Lot Plans / Revenue Lot Size (1) Planned House Sq Ft (2) 6,501 4,551 Total Value (3) $ 4,845,510 $ 4,313,900 price per sq ft Project Costs pre-development costs Land (per acre and total, see note 4) $22, ,940 $22, ,940 Land holding costs interest on land note (5) 0.0% - 0.0% - property taxe (6) 0.0% - 0.0% - entitlement/legal fees (7) 10.0% 28, % 28,094 professional fees ($/sf) (8) $20 $130,020 $20 $91,014 development costs building & Construction costs Res. Construction Costs per sqft (9) $225 1,462,725 $225 1,023,908 Site Development Costs (10) 35% 787,621 same 787,621 Indirect Costs impact fees 30,000 30,000 building permit 5,000 5,000 insurance (%of revenue) 1.5% 72, % 64,709 contingency (% of costruction costs) 5.0% 112, % 90,576 Developer Fee (11) 3.0% 145, % 129,417 Marketing 1.0% 48, % 43,139 Development Financing Debt Financing (12) 341, ,792 Equity Partner Financing (13, see profit spilt below) Commission, Closing Costs (% of revenue) 3.0% 145, % 129,417 Capitalized Land Value (14) $ 528,692 $ 686,193 Total Project Costs 4,118,683 3,666,819 Project Net Profit 726, ,081 Project Net Profit as a % of Revenues 15.0% 15.0% (Profit Split: 50% to developer and 50% to equity partner) developers' expected profit (13) 363, ,540 NOTES: (1) As indicated in project plan (2) House sqft as shown in project plan (3) Average of Inland and seward methods from Hedonic Analysis (4) Determined from sales of property with like Ag zoning and/or County Assessor appraised Land value (5) Interest payment for raw land purchase; assuming 8%/yr for 10 years of land ownership. Land purchased in '97 (6) 1.2%/yr property tax payment for 10 years of land ownership. (7) % of land and land holding costs for legal fees and land entitlement (8) Costs/sf of home for professional fees: architecture/design, engineering, environmental (9) Residential sf construction costs are typically double the industry standard of $125/sqft for luxury homes; $250/sf for homes valued over $8 million, $200/sf for homes under $8million (10) % of construction costs for grading, sewer, water, and roads; higher costs with proposed waste water treatment plant and other infrastructure requirements (11) % of revenue developers charge to cover project overhead (12) Assume bank loans 75% of total project costs, not including entitlement, with a linear draw and interest payment that is 8% on 60% of this amount for 3 years (13) Based on equity partner involvement, investor is assumed to expect at minimum 50% of net profit as a return on his/her investment, NOT including the captured entitlement value; developer captures the remaining 50% of net profit. (14) Added value capitalized into land with residential development; developer/ investor captures this amount in addition to net profit upon sale 136
149 Santa Barbara Ranch TDR Feasibility Analysis VOLUME III - APPENDICES
150 Santa Barbara Ranch TDR Feasibility Analysis TECHNICAL APPENDIX A Receiving Site Maps
151
152
153
154
155
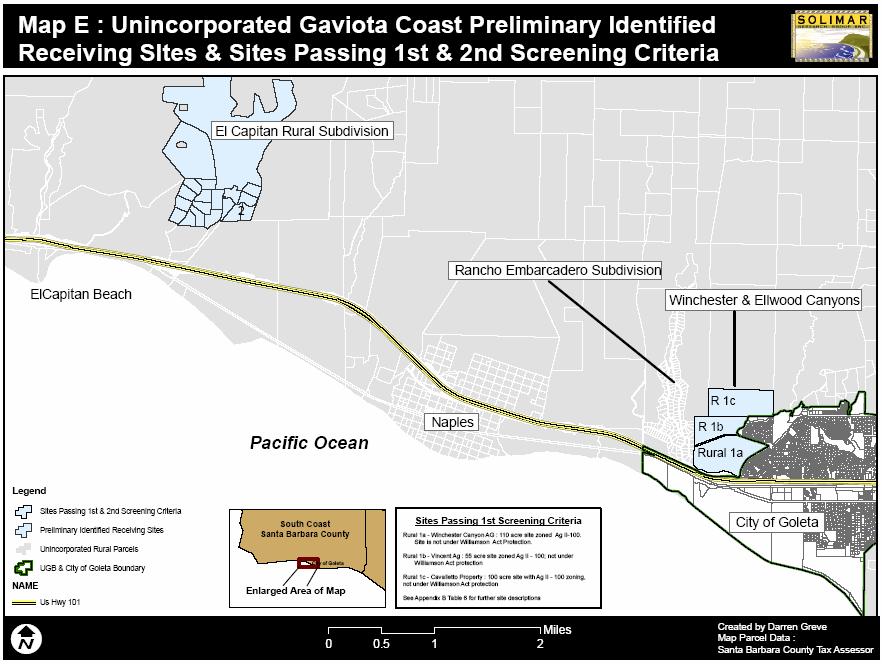
156
157
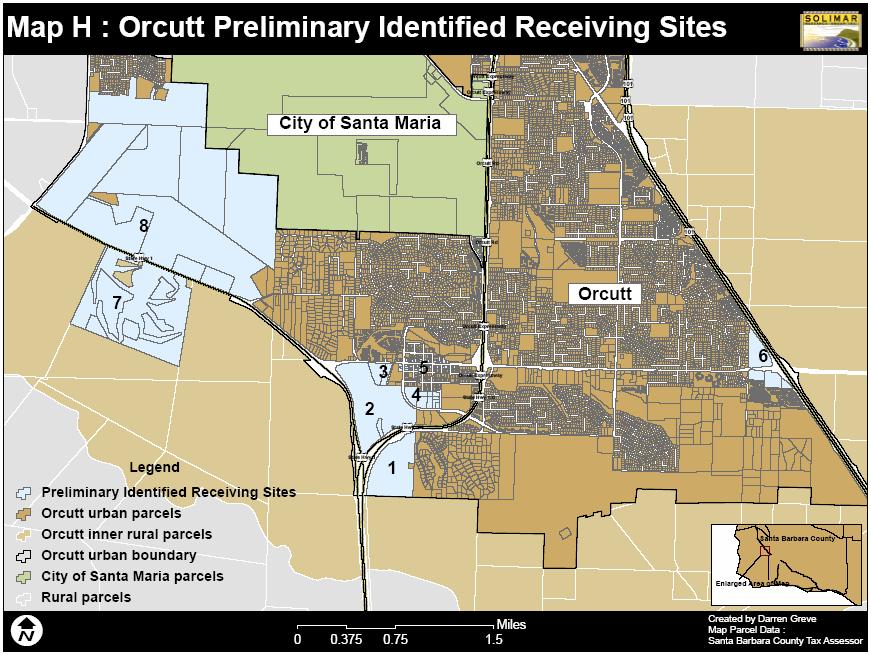
158
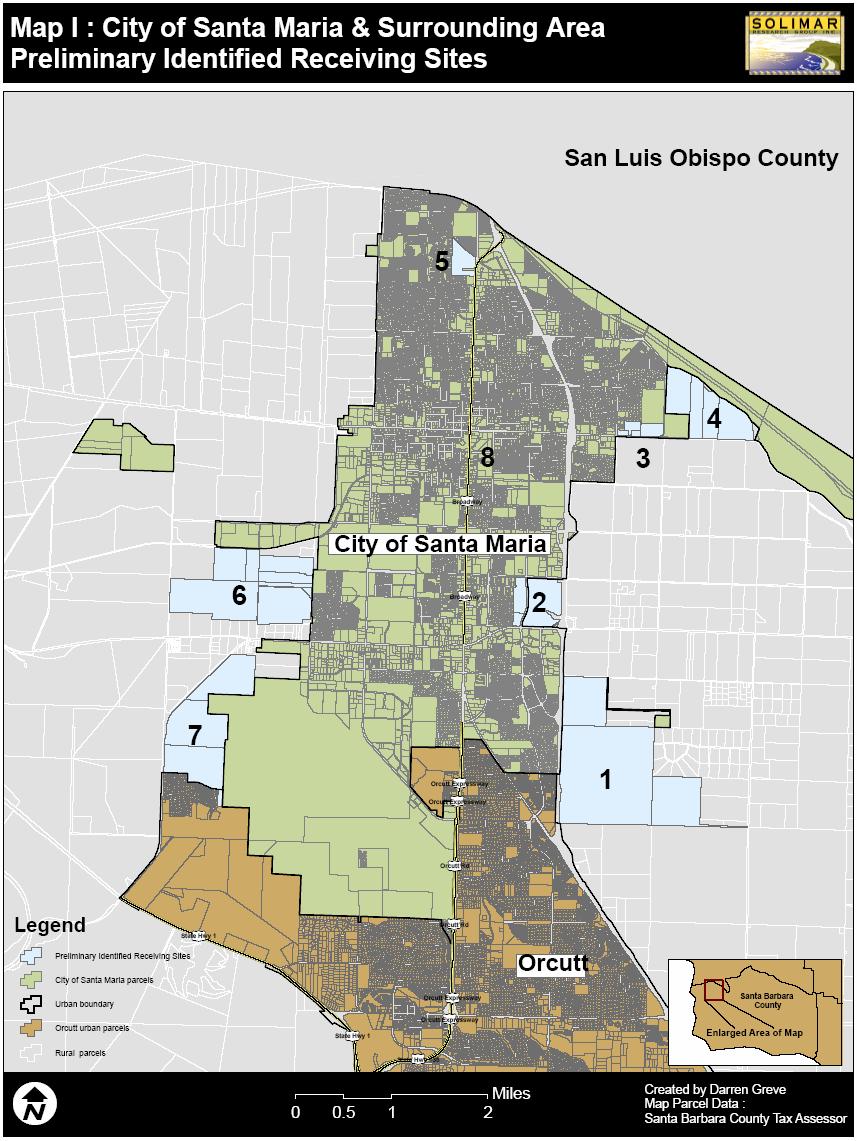
159
TRANSFER OF DEVELOPMENT RIGHTS
 STEPS IN ESTABLISHING A TDR PROGRAM Adopting TDR legislation is but one small piece of the effort required to put an effective TDR program in place. The success of a TDR program depends ultimately on the
A TDR Program for Naples. May 11, 2007
 ATTACHMENT G A TDR Program for Naples May 11, 2007 Introduction This paper is intended to supplement and expand upon the Draft TDR Program Framework authored by Solimar in February 2007. 1 The Framework
Transfer of Development Rights (TDR) in Practice
 in Practice") Transfer of Development Rights (TDR) in Practice Transfer of Development Rights (TDR) programs use market forces to simultaneously promote conservation in high value natural, agricultural, and open space
Transfer of Development Rights (TDR) in Practice Transfer of Development Rights (TDR) programs use market forces to simultaneously promote conservation in high value natural, agricultural, and open space
SANTA BARBARA RANCH PROJECT DETAILED SUMMARY
 SANTA BARBARA RANCH PROJECT DETAILED SUMMARY Setting and Context. The Naples Townsite encompasses an 800-acre area on the Gaviota coast, located two miles west of the City of Goleta. The Townsite has a
Naples TDR Program Framework
 ATTACHMENT F Naples TDR Program Framework Solimar Research Group August 24, 2007 William Fulton Darren Greve 35 S. VENTURA AVENUE VENTURA, CALIFORNIA 93001 PHONE: 805/643-7700 FAX: 643-7782 WEB: WWW.SOLIMAR.ORG
A STUDY OF TRANSFER OF DEVELOPMENT RIGHTS (TDR) IN THURSTON COUNTY, WASHINGTON
 IN THURSTON COUNTY, WASHINGTON") A STUDY OF TRANSFER OF DEVELOPMENT RIGHTS (TDR) IN THURSTON COUNTY, WASHINGTON Prepared June 2010 by Evergreen College students Jenna Fissenden and Steven Michener with guidance from staff members within
A STUDY OF TRANSFER OF DEVELOPMENT RIGHTS (TDR) IN THURSTON COUNTY, WASHINGTON Prepared June 2010 by Evergreen College students Jenna Fissenden and Steven Michener with guidance from staff members within
HIGHLANDS TDR PROGRAM
 HIGHLANDS TDR PROGRAM HDC Bank Board Meeting April 2, 2009 Highlands TDR Program The Highlands TDR Program is a regional program that permits the transfer of development rights, termed Highlands Development
Density Transfer Credits. A workable approach to TDR for New Hampshire
 Density Transfer Credits A workable approach to TDR for New Hampshire Outline Why is DTC / TDR important for our future? What is DTC / TDR? Elements of a DTC program Implementing a DTC Program Development
TRANSFER OF DEVELOPMENT RIGHTS IN THE PHILADELPHIA REGION HOPE OR HYPE?
 TRANSFER OF DEVELOPMENT RIGHTS IN THE PHILADELPHIA REGION HOPE OR HYPE? Dorothy Ives Dewey Department of Geography and Planning West Chester University West Chester, PA 19383 ABSTRACT: This paper is a
Analysis of Infill Development Potential Under the Green Line TOD Ordinance
 Analysis of Infill Development Potential Under the Green Line TOD Ordinance Prepared for the Los Angeles County Second Supervisorial District Office and the Department of Regional Planning Solimar Research
PURCHASE OF DEVELOPMENT RIGHTS AND TRANSFER OF DEVELOPMENT RIGHTS CASE STUDIES
 PURCHASE OF DEVELOPMENT RIGHTS AND TRANSFER OF DEVELOPMENT RIGHTS CASE STUDIES Prepared for Boone County Planning Commission By American Farmland Trust May 4, 2001 Table of Contents Page Number Montgomery
Barbara County Housing Element. Table 5.1 Proposed Draft Housing Element Goals, Policies and Programs
 Table 5.1 Proposed Draft Housing Element Goals, Policies and Programs Goal 1: Enhance the Diversity, Quantity, and Quality of the Housing Supply Policy 1.1: Promote new housing opportunities adjacent to
CHAIRMAN WOLPERT AND MEMBERS OF THE HOUSE LOCAL AND MUNICIPAL GOVERNMENT AND URBAN REVITALIZATION COMMITTEE
 TO: FROM: SUBJECT: CHAIRMAN WOLPERT AND MEMBERS OF THE HOUSE LOCAL AND MUNICIPAL GOVERNMENT AND URBAN REVITALIZATION COMMITTEE LARRY LONG, EXECUTIVE DIRECTOR COUNTY COMMISSIONERS ASSOCIATION OF OHIO (CCAO)
Evaluating the Potential of a Market-Based Transfer of Developments Program to Preserve Open Space in Santa Barbara County
 Evaluating the Potential of a Market-Based Transfer of Developments Program to Preserve Open Space in Santa Barbara County A Group Project submitted in partial satisfaction of the requirements for the
Instructions: Script:
 Before the course, select four of the 11 tool topics to insert into the presentation, including at least one tool from each of the three goal categories. Replace each tool placeholder slide with the slides
2016 Highlands Region Land Preservation Status Report
 State of New Jersey Highlands Water Protection and Planning Council 100 North Road (Route 513) Chester, New Jersey 07930-2322 (908) 879-6737 (908) 879-4205 (fax) www.nj.gov/njhighlands 2016 Highlands Region
RESEARCH BRIEF. Oct. 31, 2012 Volume 2, Issue 3
 RESEARCH BRIEF Oct. 31, 2012 Volume 2, Issue 3 PDR programs affect landowners conversion decision in Maryland PDR programs pay farmers to give up their right to convert their farmland to residential and
Be Happy, Stay Rural!
 Be Happy, Stay Rural! Board of Directors: Diane Neubert, President Judy Lawrence, Vice President Cindy Ellsmore, Treasurer Linda Frost, Secretary Stevee Duber, Project Manager stevee@highsierrarural.org
Transferable Development Rights Edmonton, Alberta
 Transferable Development Rights Edmonton, Alberta 12-1-10 10 Rick Pruetz, FAICP I. TDR Background II. Success Factors III. Program Design TDR Market-based Works with zoning code TDR encourages voluntary
Transferable Development Credits
 Transferable Development Credits Four American Examples Guy Greenaway and Kimberly Good Miistakis Institute, University of Calgary Community Planning Association of Alberta Red Deer April 7, 2008 Four
City and County of San Francisco
 City and County of San Francisco Office of the Controller - Office of Economic Analysis Residential Rent Ordinances: Economic Report File Nos. 090278 and 090279 May 18, 2009 City and County of San Francisco
NANTUCKET ISLANDS LAND BANK AFFORDABLE HOUSING POLICY Adopted by the vote of the Land Bank Commission on November 10, 2015
 NANTUCKET ISLANDS LAND BANK AFFORDABLE HOUSING POLICY Adopted by the vote of the Land Bank Commission on November 10, 2015 In recent history, the island of Nantucket has experienced a shortage of affordable,
To achieve growth, property development, redevelopment and an improved tax base in the cities and boroughs in the Lehigh Valley.
 Most growth in property valuation is in townships. Between 1991 and 2004, the assessed valuation of the townships in the Lehigh Valley increased by more than $2.8 billion, an increase of 41%. At the same
Georgia Conservation Tax Credit Program Frequently Asked Questions
 Georgia Conservation Tax Credit Program Frequently Asked Questions What are the minimum requirements for eligibility under the Georgia Conservation Tax Credit Program (GCTCP)? Individual and corporate
4.2 LAND USE INTRODUCTION
 4.2 LAND USE INTRODUCTION This section of the EIR addresses potential impacts from the Fresno County General Plan Update on land use in two general areas: land use compatibility and plan consistency. Under
Flexibility in the Law: Reengineering of Zoning to Prevent Fragmented Landscapes
 Pace University DigitalCommons@Pace Pace Law Faculty Publications School of Law 2-18-1998 Flexibility in the Law: Reengineering of Zoning to Prevent Fragmented Landscapes John R. Nolon Elisabeth Haub School
4.13 Population and Housing
 Environmental Impact Analysis Population and Housing 4.13 Population and Housing 4.13.1 Setting This section evaluates the impacts to the regional housing supply and population growth associated with implementation
COPYRIGHTED MATERIAL. Comprehensive Site-Planning Overview. 1.1 Introduction. 1.2 Role of Government
 C h a p t e r 1 1.1 Introduction Comprehensive Site-Planning Overview Properly planned and conceptualized large-scale developments are benefits to communities, developers, and end users. The essence of
Appendix J Agricultural Land Preservation in Other States
 Appendix J Agricultural Land Preservation in Other States Appendix J Agricultural land preservation in other states Many states across the U.S. are working to protect agricultural land from development.
Land Use. Land Use Categories. Chart 5.1. Nepeuskun Existing Land Use Inventory. Overview
 Land Use State Comprehensive Planning Requirements for this Chapter A compilation of objectives, policies, goals, maps and programs to guide the future development and redevelopment of public and private
Summary of Key Issues from Skagit County TDR Focus Group Meetings January 7, 2014
 Summary of Key Issues from Skagit County TDR Focus Group Meetings January 7, 2014 Overall Observations Some participants, particularly in the development group, emphasized that TDR was taking something
APPENDIX B. Fee Simple v. Conservation Easement Acquisitions NTCOG Water Quality Greenprint - Training Workshops
 APPENDIX B Fee Simple v. Conservation Easement Acquisitions NTCOG Water Quality Greenprint - Training Workshops Lake Arlington Watershed and Lewisville Lake East Watershed June 21, 2011 Presenter Talking
Santa Barbara County In-Lieu Fee Update Report. Submitted to: The County of Santa Barbara. Submitted by: Bay Area Economics (BAE)
") Santa Barbara County In-Lieu Fee Update Report Submitted to: The County of Santa Barbara Submitted by: Bay Area Economics (BAE) June 2004 Table of Contents 1 Executive Summary...i 2 Introduction...1 2.1
Santa Barbara County In-Lieu Fee Update Report Submitted to: The County of Santa Barbara Submitted by: Bay Area Economics (BAE) June 2004 Table of Contents 1 Executive Summary...i 2 Introduction...1 2.1
RESEARCH BRIEF. Jul. 20, 2012 Volume 1, Issue 12
 RESEARCH BRIEF Jul. 2, 212 Volume 1, Issue 12 Do Agricultural Land Preservation Programs Reduce Overall Farmland Loss? When purchase of development rights () programs are in place to prevent farmland from
About Conservation Easements
 Section Three: Farm Transfer Tools About Conservation Easements Editor s note: One question that our education collaborative has fielded consistently throughout the years is about conservation easements.
Dr af t Sant a Bar b ar a Count y Housing Elem ent
 6. LAND INVENTORY AND QUANTIFIED OBJECTIVE I n t r o d u c t i o n This chapter includes two important components of the Housing Element: (1) the land inventory and analysis, and (2) the quantified objective
Land Preservation in the Highlands Region
 Land Preservation in the Highlands Region Prepared by the Highlands Water Protection and Planning Council - August 2010 The Highlands watersheds are the best in the State in respect to ease of collection,
Special Consideration Multiple jurisdictions is cumbersome
 Elements of Agricultural Land Preservation Hawaii Technique Comments Status in Hawaii Agriculture Zoning Most effective if it minimizes farmland conversion and prevents the intrusion of nonfarm uses into
2018 Highlands Region Land Preservation Status Report
 2018 Highlands Region Land Preservation Status Report Highlands Development Credit (HDC) properties (l to r): Tewksbury Township, Hunterdon County; Mount Olive, Morris County; Independence Township, Warren
Chapter 10 Local Protection Measures
 The DPC fully supports the protection of private property rights and the DPC will work to ensure that there will be no negative impacts stemming from NHA activities on private property, should the designation
Housing Affordability Research and Resources
 Housing Affordability Research and Resources An Analysis of Inclusionary Zoning and Alternatives University of Maryland National Center for Smart Growth Research and Education Abt Associates Shipman &
Chapter 10: Implementation
 Chapter 10: Introduction Once the Comprehensive Plan has been adopted by the City of Oakdale, the City can begin to implement the goals and strategies to make this vision a reality. This chapter will set
Four American TDR Programs
 Four American TDR Programs In February of 2007, the Miistakis Institute had the opportunity to visit and review in depth the following four different successful Transfer of Development Rights (TDR) programs
FARMLAND AMENITY PROTECTION. A Brief Guide To Conservation Easements
 FARMLAND AMENITY PROTECTION A Brief Guide To Conservation Easements The purpose of this guide is to help landowners access their land amenity value and to provide direction to be compensated for this value.
Executive Summary Cache County TDR Feasibility Study
 Executive Summary Cache County TDR Feasibility Study Draft: October 2003 Cache County Executive Summary: Table of Contents I. Background... 1 II. Process... 2 III. Sample Feasibility Study... 3 IV. Conclusions...
Farmland and Open Space Preservation Purchase of Development Rights Program Frequently Asked Questions
 Farmland and Open Space Preservation Purchase of Development Rights Program Frequently Asked Questions Why should a community consider farmland preservation programs? Farmland preservation is important
Summary of Findings & Recommendations
 Summary of Findings & Recommendations Minneapolis/St. Paul Region Mixed Income Housing Feasibility, Education and Action Project Background In 2015 and 2016, the Family Housing Fund and the Urban Land
Town of Yucca Valley GENERAL PLAN 1
 Town of Yucca Valley GENERAL PLAN 1 This page intentionally left blank. 3 HOUSING ELEMENT The Housing Element is intended to guide residential development and preservation consistent with the overall values
Transfer of Development Rights. February 13, 2017
 Transfer of Development Rights City Council Meeting February 13, 2017 Overview What were working on Transfer of Development Rights King County / COS Interlocal TDR Regulations Q & A Transfer of Development
Reading Plats and the Complexities of Antiquated Subdivisions Presented by: David W. Depew, PhD, AICP, LEED AP Morris-Depew Associates, Inc.
 Presented by: David W. Depew, PhD, AICP, LEED AP Morris-Depew Associates, Inc. Introduction Plat is a term for a survey of a piece of land to identify boundaries, easements, flood zones, roadway, and access
UNDERSTANDING THE TAX BASE CONSEQUENCES OF LOCAL ECONOMIC DEVELOPMENT PROGRAMS
 UNDERSTANDING THE TAX BASE CONSEQUENCES OF LOCAL ECONOMIC DEVELOPMENT PROGRAMS Richard K. Gsottschneider, CRE President RKG Associates, Inc. 277 Mast Rd. Durham, NH 03824 603-868-5513 It is generally accepted
Whither the Wilderness County?
 Whither the Wilderness County Lane Kendig Kendig Keast Collaborative Scott Clark Director, Kootenai County Community Development Wilderness City Wilderness City is an oxymoron. Urban City cannot be a wilderness.
Introduction to INRMP Implementation Options
 El Dorado County Integrated Natural Resources Management Plan Introduction to INRMP Implementation Options 1 Our approach to the options evaluation is based on the INRMP components as they are currently
Bending the Cost Curve Solutions to Expand the Supply of Affordable Rentals. Executive Summary
 Bending the Cost Curve Solutions to Expand the Supply of Affordable Rentals Executive Summary Why Bending the Cost Curve Matters The need for affordable rental housing is on the rise. According to The
MONTEREY COUNTY PLANNING COMMISSION
 MONTEREY COUNTY PLANNING COMMISSION Meeting: October 25, 2006 Time: 9:10 A.M. Agenda Item No.: 1 Project Description: Conduct a workshop regarding the County s regulations for covered parking (Chapter
Subject: LandWatch s comments on Salinas Economic Development Element FEIR. Dear Mayor Gunter and Members of the Salinas City Council:
 December 4, 2017 Via hand delivery and e-mail Mayor Joe Gunter City of Salinas 200 Lincoln Avenue Salinas, CA 93901 council@ci.salinas.ca.us Subject: LandWatch s comments on Salinas Economic Development
Financial Analysis of Bell Street Development Potential Final Report
 Financial Analysis of Bell Street Development Potential Final Report February 25, 2008 Prepared for: County of Santa Barbara TABLE OF CONTENTS I. Introduction... 1 II. Key Findings Regarding Bell Street
Affordable Housing Bonus Program. Public Questions and Answers - #2. January 26, 2016
 Affordable Housing Bonus Program Public Questions and Answers - #2 January 26, 2016 The following questions about the Affordable Housing Bonus Program were submitted by the public to the Planning Department
Sri Lanka Accounting Standard LKAS 40. Investment Property
 Sri Lanka Accounting Standard LKAS 40 Investment Property LKAS 40 CONTENTS SRI LANKA ACCOUNTING STANDARD LKAS 40 INVESTMENT PROPERTY paragraphs OBJECTIVE 1 SCOPE 2 DEFINITIONS 5 CLASSIFICATION OF PROPERTY
Reconciling Development and Conservation:
 Reconciling Development and Conservation: Applying Transfer of Development Credits (TDC) Programs in Alberta Guy Greenaway and Kimberly Good Miistakis Institute Alberta Association of Municipal Districts
CHAPTER Committee Substitute for Committee Substitute for Senate Bill No. 2188
 CHAPTER 2004-372 Committee Substitute for Committee Substitute for Senate Bill No. 2188 An act relating to land development; amending s. 197.502, F.S.; providing for the issuance of an escheatment tax
Shawnee Landing TIF Project. City of Shawnee, Kansas. Need For Assistance Analysis
 Shawnee Landing TIF Project City of Shawnee, Kansas Need For Assistance Analysis December 17, 2014 Table of Contents 1 EXECUTIVE SUMMARY... 1 2 PURPOSE... 2 3 THE PROJECT... 3 4 ASSISTANCE REQUEST... 7
Santa Barbara Ranch TDR Feasibility Analysis VOLUME III - APPENDICES
 Santa Barbara Ranch TDR Feasibility Analysis VOLUME III - APPENDICES Santa Barbara Ranch TDR Feasibility Analysis TECHNICAL APPENDIX A Receiving Site Maps Santa Barbara Ranch TDR Feasibility Analysis
AB 1397 HOUSING ELEMENT LAW SITE IDENTIFICATION STRENGTHENED OVERVIEW
 AB 1397 HOUSING ELEMENT LAW SITE IDENTIFICATION STRENGTHENED OVERVIEW The 2017 California legislative session yielded a housing package of 15 bills that significantly increased both the available financing
Conservation Easement Stewardship
 Conservation Easements are effective tools to preserve significant natural, historical or cultural resources. Conservation Easement Stewardship Level of Service Standards March 2013 The mission of the
A Guide to Developing an Inclusionary Housing Program
 Richard Drdla Associates affordable housing consultants inc A Guide to Developing an Inclusionary Housing Program Developed for: Acorn Institute Canada Sept 2010 Acknowledgment This guide was prepared
INCENTIVE POLICY FOR AFFORDABLE HOUSING
 INCENTIVE POLICY FOR AFFORDABLE HOUSING PREPARED BY: CITY OF FLAGSTAFF S HOUSING SECTION COMMUNITY DEVELOPMENT DIVISION OCTOBER 2009 2 1 1 W e s t A s p e n A v e. t e l e p h o n e : 9 2 8. 7 7 9. 7 6
SANTA BARBARA COUNTY ZONING ADMINISTRATOR STAFF REPORT January 11, 2008
 SANTA BARBARA COUNTY ZONING ADMINISTRATOR STAFF REPORT January 11, 2008 PROJECT: Gerrity Parking in Side Setback and Gerrity Student Housing Addition HEARINGDATE: January 28, 2008 STAFF/PHONE: J. Ritterbeck,
Sri Lanka Accounting Standard-LKAS 40. Investment Property
 Sri Lanka Accounting Standard-LKAS 40 Investment Property CONTENTS SRI LANKA ACCOUNTING STANDARD-LKAS 40 INVESTMENT PROPERTY paragraphs OBJECTIVE 1 SCOPE 2-4 DEFINITIONS 5-15 RECOGNITION 16-19 MEASUREMENT
Developing a Consumer-Run Housing Co-op in Hamilton: A Feasibility Study
 Developing a Consumer-Run Housing Co-op in Hamilton: EXECUTIVE SUMMARY December, 2006 Prepared for: Hamilton Addiction and Mental Health Network (HAMHN): c/o Mental Health Rights Coalition of Hamilton
Transfer Development Rights
 Transfer Development Rights Roy Kraynyk VP of Land Protection Alyson Fearon Chatham University Dual Masters Candidate in Business Administration and Sustainability About Us ALLEGHENY LAND TRUST Incorporated
SANTA BARBARA COUNTY ZONING ADMINISTRATOR STAFF REPORT February 15, 2013
 SANTA BARBARA COUNTY ZONING ADMINISTRATOR STAFF REPORT February 15, 2013 PROJECT: Galbraith Lot Line Adjustment HEARING DATE: March 4, 2013 STAFF/PHONE: J. Ritterbeck, (805) 568-3509 GENERAL INFORMATION
This version includes amendments resulting from IFRSs issued up to 31 December 2009.
 International Accounting Standard 40 Investment Property This version includes amendments resulting from IFRSs issued up to 31 December 2009. IAS 40 Investment Property was issued by the International
EN Official Journal of the European Union L 320/323
 29.11.2008 EN Official Journal of the European Union L 320/323 INTERNATIONAL ACCOUNTING STANDARD 40 Investment property OBJECTIVE 1 The objective of this standard is to prescribe the accounting treatment
Valuing Diamonds in the Rough: Utilizing Highest and Best Use Valuation Principles in a Mass Appraisal Environment
 Valuing Diamonds in the Rough: Utilizing Highest and Best Use Valuation Principles in a Mass Appraisal Environment Topics of Discussion Revaluation of a former industrial district at the height of a building
Chapter 35. The Appraiser's Sales Comparison Approach INTRODUCTION
 Chapter 35 The Appraiser's Sales Comparison Approach INTRODUCTION The most commonly used appraisal technique is the sales comparison approach. The fundamental concept underlying this approach is that market
General Development Plan Background Report on Agricultural Land Preservation
 General Development Plan 2008 Background Report on Agricultural Land Preservation February 2008 I. Introduction Anne Arundel County has been an agricultural community for over 350 years, beginning with
County Survey. results of the public officials survey in the narrative. Henry County Comprehensive Plan,
 Introduction During the planning process, a variety of survey tools where used to ensure the Henry County Comprehensive Plan was drafted in the best interests of county residents and businesses. The surveys
CONSERVATION EASEMENTS FREQUENTLY ASKED QUESTIONS
 CONSERVATION EASEMENTS FREQUENTLY ASKED QUESTIONS CCALT Founder and Steamboat rancher, Jay Fetcher notes, You shouldn t even be considering a conservation easement unless two things have happened: (1)
To: Ogunquit Planning Board From: Lee Jay Feldman, Director of Planning Date: April 18, 2018 Re: Senior/Affordable Multi-Family Housing Assessment
 To: Ogunquit Planning Board From: Lee Jay Feldman, Director of Planning Date: April 18, 2018 Re: Senior/Affordable Multi-Family Housing Assessment I. Introduction The Planning Board held a workshop on
The New Starts Grant and Affordable Housing A Roadmap for Austin s Project Connect
 The New Starts Grant and Affordable Housing A Roadmap for Austin s Project Connect Created for Housing Works by the Entrepreneurship and Community Development Clinic at the University of Texas School of
SANTA BARBARA COUNTY PLANNING COMMISSION 1.0 REQUEST
 SANTA BARBARA COUNTY PLANNING COMMISSION Staff Report 2015-2023 Housing Element Implementation: Hearing Date: June 1, 2016 Staff Report Date: May 12, 2016 Case Nos.: 16ORD-00000-00006 and 16ORD-00000-00008
Prepared For: Pennsylvania Utility Law Project (PULP) Harry Geller, Executive Director Harrisburg, Pennsylvania
 Harry Geller, Executive Director Harrisburg, Pennsylvania") THE CONTRIBUTION OF UTILITY BILLS TO THE UNAFFORDABILITY OF LOW-INCOME RENTAL HOUSING IN PENNSYLVANIA June 2009 Prepared For: Pennsylvania Utility Law Project (PULP) Harry Geller, Executive Director Harrisburg,
THE CONTRIBUTION OF UTILITY BILLS TO THE UNAFFORDABILITY OF LOW-INCOME RENTAL HOUSING IN PENNSYLVANIA June 2009 Prepared For: Pennsylvania Utility Law Project (PULP) Harry Geller, Executive Director Harrisburg,
Preserving Farms and Forests in Sussex County, Delaware: Public Value
 Preserving Farms and s in Sussex County, Delaware: Public Value Joshua M. Duke, Ph.D. University of Delaware Robert J. Johnston, Ph.D. Tammy Warner Campson University of Connecticut July 2007 This research
TO MEMBERS OF THE FINANCE AND CAPITAL STRATEGIES COMMITTEE: DISCUSSION ITEM
 F13 Office of the President TO MEMBERS OF THE FINANCE AND CAPITAL STRATEGIES : For Meeting of DISCUSSION ITEM ORCHARD PARK FAMILY HOUSING AND GRADUATE STUDENT HOUSING REDEVELOPMENT PROJECT AND WEST VILLAGE
HOUSING ELEMENT I. GOALS, OBJECTIVES AND POLICIES
 HOUSING ELEMENT I. GOALS, OBJECTIVES AND POLICIES GOAL 1: IN ORDER TO ACHIEVE A BALANCED HOUSING SUPPLY (AND A BALANCED POPULATION AND ECONOMIC BASE), EVERY EFFORT SHOULD BE MADE TO PROVIDE A BROAD RANGE
Allenspark Townsite Planning Initiative Community Meeting July 23, Boulder County Land Use Department
 Allenspark Townsite Planning Initiative Community Meeting July 23, 2018 OBJECTIVES FOR THIS MEETING Update the community on developments, outcomes of recent discussions Recognizing the revised scope (Allenspark
VT0001 TOOL FOR THE DEMONSTRATION AND ASSESSMENT OF ADDITIONALITY IN VCS AGRICULTURE, FORESTRY AND OTHER LAND USE (AFOLU) PROJECT ACTIVITIES
 PROJECT ACTIVITIES") VT0001 TOOL FOR THE DEMONSTRATION AND ASSESSMENT OF ADDITIONALITY IN VCS AGRICULTURE, FORESTRY AND OTHER LAND USE (AFOLU) PROJECT ACTIVITIES Version 3.0 1 February 2012 Sectoral Scope 14 Adapted from the
VT0001 TOOL FOR THE DEMONSTRATION AND ASSESSMENT OF ADDITIONALITY IN VCS AGRICULTURE, FORESTRY AND OTHER LAND USE (AFOLU) PROJECT ACTIVITIES Version 3.0 1 February 2012 Sectoral Scope 14 Adapted from the
In December 2003 the Board issued a revised IAS 40 as part of its initial agenda of technical projects.
 IAS 40 Investment Property In April 2001 the International Accounting Standards Board (the Board) adopted IAS 40 Investment Property, which had originally been issued by the International Accounting Standards
White Paper of Manuel Jahn, Head of Real Estate Consulting GfK GeoMarketing. Hamburg, March page 1 of 6
 White Paper of Manuel Jahn, Head of Real Estate Consulting GfK GeoMarketing Hamburg, March 2012 page 1 of 6 The misunderstanding Despite a very robust 2011 in terms of investment transaction volume and
Developing an Inclusionary Zoning Ordinance
 Developing an Inclusionary Zoning Ordinance Key Considerations August 18, 2006 Dwayne Marsh Senior Associate, PolicyLink Inclusionary Zoning: An Important Affordable Housing Tool Requires or encourages
The Honourable Peter Milczyn Minister of Housing/Minister Responsible for the Poverty Reduction Strategy College Park, 17th Floor
 February 2, 2018 Sent via e-mail: Bill.Mauro@ontario.ca Peter.Milczyn@ontario.ca The Honourable Bill Mauro Minister of Municipal Affairs College Park, 17th Floor 777 Bay Street Toronto, Ontario M5G 2E5
Draft for Public Review. The Market and Octavia Neighborhood Plan
 Draft for Public Review The Market and Octavia Neighborhood Plan San Francisco Planning Department As Part of the Better Neighborhoods Program December 00 . Housing People OBJECTIVE.1 MIXED-USE RESIDENTIAL
Land Trust of Santa Cruz County. Strategic Plan. July 2012 to June This is a public version of a more detailed internal plan.
 Land Trust of Santa Cruz County Strategic Plan July 2012 to June 2015 This is a public version of a more detailed internal plan. Over the next three years the Land Trust will pursue four critical strategies.
[Re. Docket No. FR 6123-A-01] Affirmatively Furthering Fair Housing: Streamlining and Enhancements (the Streamlining Notice )
![[Re. Docket No. FR 6123-A-01] Affirmatively Furthering Fair Housing: Streamlining and Enhancements (the Streamlining Notice )](/thumbs/92/107786342.jpg "[Re. Docket No. FR 6123-A-01] Affirmatively Furthering Fair Housing: Streamlining and Enhancements (the Streamlining Notice )") October 15, 2018 Regulations Division Office of General Counsel Department of Housing and Urban Development 451 7 th Street SW, Room 10276 Washington, DC 20410-0500 [Re. Docket No. FR 6123-A-01] Affirmatively
October 15, 2018 Regulations Division Office of General Counsel Department of Housing and Urban Development 451 7 th Street SW, Room 10276 Washington, DC 20410-0500 [Re. Docket No. FR 6123-A-01] Affirmatively
07/16/2014 Item #10E Page 1
 MEETING DATE: July 16, 2014 PREPARED BY: Jeff Murphy DEPT. DIRECTOR: Jeff Murphy DEPARTMENT: Planning & Building CITY MANAGER: Gus Vina SUBJECT: City Council consideration and possible action and/or staff
Land Use Planning Analysis. Phase 2 Drayton Valley Annexation Proposal
 Land Use Planning Analysis Phase 2 Drayton Valley Annexation Proposal Prepared for Town of Drayton Valley Prepared by Mackenzie Associates Consulting Group Limited March, 2011 TABLE OF CONTENTS 1.0 INTRODUCTION...
Torch Lake Township Antrim County, Michigan
 Torch Lake Township Antrim County, Michigan Farmland and Open Space Development Rights Ordinance Ordinance No. 04-01 Effective September 3, 2004 AN ORDINANCE creating a farmland and open space protection
Open Space. Introduction. Vision. Defining Open Space. Midway City 2017 General Plan
 Open Space Midway City 2017 General Plan Introduction The importance of preserving open space to meet the goals and objectives of the General Plan cannot be overstated. Indeed, references to preserving
The cost of increasing social and affordable housing supply in New South Wales
 The cost of increasing social and affordable housing supply in New South Wales Prepared for Shelter NSW Date December 2014 Prepared by Emilio Ferrer 0412 2512 701 eferrer@sphere.com.au 1 Contents 1 Background