USC Casden Forecast 2009 Industrial & Office Market Report
|
|
|
- Merryl Parrish
- 5 years ago
- Views:
Transcription
1
2
3


4 USC Casden Forecast 2009 Industrial & Office Market Report Sponsors
5 USC Casden Forecast 2009 Industrial & Office Market Report Contents USC Casden Forecast 2009 Industrial & Office Market Report 7 Executive Summary 8 Current View of the Economy 10 Los Angeles Office Market Trends 14 Orange County Office Market Trends 21 Inland Empire Office Market Trends 27 Los Angeles Industrial Market Trends 32 Inland Empire Industrial Market Trends 44 Office Market Forecast 48 Los Angeles County Industrial Forecast 51 Orange County Industrial Forecast 52 Inland Empire Industrial Forecast 53 Technical Notes 54 Casden Forecast Special Topics Paper 56 Report Authors Bios 62
6
7 USC Casden Forecast 2009 Industrial & Office Market Report USC Casden Forecast 2009 Industrial & Office Market Report The Casden Real Estate Economics Forecast is pleased to present its 2009 report on the Los Angeles metropolitan area industrial and office real estate markets. The Casden Real Estate Economics Forecast analyzes fundamentals and forecasts real estate market indicators in the Los Angeles region. The Forecast issues two annual reports, one covering the region s industrial and office markets and the other covering its apartment markets. We begin with overviews of the United States and regional economies, which serve as the foundation for the analysis of the Southern California real estate markets. A comprehensive summary of the fundamental trends in the industrial and office markets for Los Angeles County, Orange County and the Inland Empire as well as individual submarkets make up the main body of the report. The statistical snapshots provide concise summaries of recent movements in quarterly rents, vacancy rates and net absorption for each county as well as the submarkets. We use time series econometric techniques to develop models that forecast the annual rent and vacancy levels. James Hamilton, a well-known time series econometrician, has shown that parsimonious models do better at producing short term forecasts than structural models, which attempt to determine how all aspects of the economy interact with each other. The special topics section for this year has a paper on the state of the luxury hotel market and on the interaction of management companies and hotel owners, and their different interests. This report would not be possible without the contributions of many to whom we are grateful. We thank J.C. Casillas and Grubb & Ellis for providing the fundamental market data and helping to develop the Los Angeles County sections. Jasmin Varjavand provided excellent research assistance. We are also grateful to the Lusk Center staff for its assistance, especially Marilyn Ellis, Matthew Faulkner, Jennifer Frappier, Dawn Santos and Sonia Savoulian. Finally, we gratefully acknowledge our sponsors, Arden Realty, California Real Estate Journal, Globe Street.com, and Grubb & Ellis. Richard K. Green, Director USC Lusk Center for Real Estate Tracey Seslen, Senior Research Associate USC Casden Real Estate Economics Forecast
8 Executive Summary The period from the Summer of 2008 through the Summer of 2009 was as bad an any period in the post-depression era for the four quarters ending with the second quarter of 2009, GDP fell more rapidly than during any other four quarter period after World War II. The antecedents to this collapse have been broadly reported: the housing collapse led to large numbers of mortgage defaults. This in turn caused financial stress for all types of lenders, including commercial banks, investment banks, and investors in securities, which led to a collapse in credit markets. Consumers were unable to get credit with which to spend and businesses were unable to get credit with which to invest, leading to economic contraction in California, the United States, and abroad. This in turn led to substantial government intervention in financial markets and a large, deficit-financed, stimulus program. The efficacy of these programs is a subject of considerable debate, but credit markets are closer to normal than a year ago and GDP in the United States did grow in the 3rd quarter of Many of America s trade partners especially China are well on the road to recovery. Los Angeles County Office: Demand for office space decreased sharply with year-to-date declines of about 4.1 million square feet. Office space demand decreased in most submarkets, with the largest declines in San Gabriel Valley, West Los Angeles and the South Bay. Overall vacancy rates climbed to 15.6 percent and increased in all markets. Average asking rents decreased by 12.3 percent. The largest rent descrease occured in West LA due to the large amount of sub-lease space that became available in the last year. Asking rents also declined in Los Angeles North and the South Bay submarkets. 1.5 million square feet of office space is currently under construction, located mainly in West Los Angeles and the Los Angeles North area. The sale of office properties has slowed significantly from previous years and cap rates are rising. Industrial: With the slowing economy, vacancies in the Los Angeles County industrial market increased this year but are still tight at 3.2 percent. Average asking rents declined by 15.8 percent as demand softened. Construction activity at.74 million square feet in the third quarter of 2009 is less than last year, with half of that located in the South Bay submarket.
9 USC Casden Forecast 2009 Industrial & Office Market Report Orange County Office: The Orange County office market is still slowing because of the housing downturn and the credit crisis. Demand for office space declined again in Office vacancy rates soared to 19.4 percent and available space for lease increased sharply from last year. For the first time in six years, asking rents for Class A space declined by 15.3 percent countywide and by 16.8 and 16.2 percent in the South and Central submarkets, respectively. Slowing sales activity in the investment market is causing cap rates to move upward. The credit crunch has created opportunities for all-cash buyers desiring office space in Orange County, such as institutional and foreign buyers. Industrial: Demand for industrial space in Orange County softened with the slowing economy and average asking rents decreased from last year. Vacancy rates moved up in all submarkets. Vacant space changed sharply in the North County submarket where rents decreased by 29 percent this year. Inland Empire Office: The housing market downturn has deeply affected the Inland Empire and there remains a large number of foreclosed homes. Unemployment in the region is among the highest in the nation with significant layoffs this year in the construction and real estate industries. The region is underserved by services supporting the large population. Developers have responded by building new office space for professionals and executives. Alas, employment has not arrived in these sectors. Almost.73 million square feet of new office space was completed in 2009 and delivered to an office market with weak demand. Vacancy rates slightly increased from 20 percent to 22.4 percent with much of the new space unoccupied. Average asking rents are about the same as last year. Industrial: The Inland Empire remains the nation s top market for building large warehouses and distribution centers, because of its proximity to the ports, extensive transportation network, and cheap, available land for development. Industrial space under construction decreased heavily from 12 million square feet in the third quarter 2008 to 1.4 million in the third quarter of The slowing economy and falling imports have reduced industrial space demand. Vacancy rates have climbed from 8.6 percent last year to 12.8 percent in the third quarter. Large speculative warehouses in the eastern region are taking much longer to lease or sell in the slowing economy.

10 Current View of the Economy GDP Growth Source Bureau of Economic Analysis, US Dept of Commerce Gdp Comparision Source International Monetary Fund Service and Manufacturing Source Economic growth was more negative, at 3.8 percent over the last two quarters of 2008 and the first two quarters of 2009 than any other four quarter period in the post World War II era. This poor GDP performance led unemployment rates to their highest point since 1983 and a labor force participation rate at its lowest level since The economy is weak throughout the United States and across sectors; only health care and education saw gains in employment. Even in the presence of the stimulus package, total government employment (local, state and federal) fell. While GDP did grow by a revised annualized rate of 2.8 percent in the third quarter of 2009, the economy continues to shed jobs at a rate in excess of 190,000 jobs per month. The Philadelphia Federal Reserve Bank Survey of Economic Forecasters project unemployment to remain above 8 percent through the year 2012 and for payrolls to continue to decline in 2010, albeit by not as much as in One bit of good news: job losses went close to zero in November 2009, and the unemployment rate fell slightly. As a result of the high unemployment, forecasters expect inflation to remain below two percent on average for the next three years. This should keep pressure off of interest rates but will mean the real value of debt carried by real estate will remain high. The most important economic positives are a rebound in economies abroad and a sharp increase in labor productivity. In particular, manufacturing output per labor hour soared by 6.8 percent in the second quarter of 2009 and by 13.6 percent in the third quarter of While credit conditions remain weak, they are considerably more normal than they were at this time last year. This is almost certainly because of the federal programs put in place since last year, including: 10
, which advanced government backed loans to investors in AAA rated and other asset backed securities.")
11 USC Casden Forecast 2009 Industrial & Office Market Report The Troubled Asset Relief Program (TARP), which injected capital into banks. New Home Sales Term Asset Backed Securities Loan Facility (TALF), which advanced government backed loans to investors in AAA rated and other asset backed securities. The Public-Private Investment Program (PPIP), which provides debt to and shares equity with investors willing to bid on legacy assets. The Home Affordable Modification Program (HAMP), which seeks to relieve financially stressed homeowners of high payment burdens on their mortgages. Federal Reserve purchases of Fannie Mae and Freddie Mac Mortgage Backed Securities, which have served to push 30- year fixed rate mortgage rates down to their lowest level in 50 years. While it is debatable how much these programs have loosened up lending (except for automobile loans where conditions have returned to something like normal), spreads over Treasury rates for LIBOR and AAA rated securities have dropped considerably from their peaks. The yield on the 10-year Treasury bond is as of this writing 3.2 percent. GDP stopped shrinking in the third quarter of 2009 but grew by a paltry 2.8 percent. This is not sufficient to generate job growth; at best, it suggests that jobs losses will slow in a year or so. As we shall discuss below, when the job recovery does begin it may be particularly to the benefit of California. The housing market has returned to something like normalcy and we have reason to believe that house prices in California are at a bottom, particularly at the lower end of the housing market. Almost all house price indexes have stabilized during Inventories in California have dropped to less than four months for houses selling for less than $750,000; prices in many areas are below replacement cost; and with mortgage rates being so low, the cash flow cost of owning looks favorable relative to renting. Against these positives remain some serious Source Interest Rates Source Board of Governors of the Federal Reserve System 11
12 U.S. Unemployment Source finance.google.com California Unemployment Source Consumer Sentiment Source Michigan Survey of Consumer Sentiment problems, including a shadow inventory of houses that have not yet been foreclosed upon, falling rents in the apartment sector, and an atrocious job picture. The US economy has shed seven million jobs since employment peaked in the fourth quarter of 2007 and California has lost almost one million jobs. The first decade of the 21st century is becoming known as the lost decade because the United States has gained no jobs over that period and California has actually lost jobs; both the national and California labor forces are considerably larger now than they were at the beginning of the decade. In Los Angeles, Riverside, and San Bernardino Counties unemployment is well above ten percent, while in Orange County it is close to ten percent. As we look forward let us consider what will drive economic growth for the United States. The National Income Identity states that total output is equal to the sum of consumption, investment, government spending, and net exports. We may look at the outlook for each of these components and ask how they influence Southern California. The outlook for consumption is, to put it mildly, bleak. While consumer sentiment is well above its nadir a year ago, it is still well below neutral. This is not surprising in light of the fact that consumers are both losing their jobs and their access to credit. Consumer debt burdens reached unsustainable levels, as consumer debt outstanding rose from 60 percent of GDP in 1980 to more than 100 percent. Deleveraging has become a common word in the business lexicon and households are going to need to do more of it for quite some time. Our view is that consumption will not drive economic growth over the next five years. This has important consequences for the retail sector as well as the broader economy. The investment and export sectors go hand-in-hand. Our view is that demand for American exports will increase in the years to 12
; and the dollar is dropping in value,")

13 USC Casden Forecast 2009 Industrial & Office Market Report come for three principal reasons: the Chinese and Indian economies continue to grow and so consumers in those markets will begin to demand goods manufactured in the United States; US labor productivity is high and, as we described earlier, is rising rapidly (and unit labor costs are falling rapidly); and the dollar is dropping in value, making American goods more competitive abroad. This has relevance as we think about the future of industrial and office real estate, especially in Southern California. We shall discuss below the particulars of trade s importance to the region and argue that the Ports of Los Angeles and Long Beach will be a source of recovery. The other sectors that will likely create economic growth nationally are information technology, education, and health care. Los Angeles County has disproportionately high employment in all these areas especially information technology. Orange, San Bernardino and Riverside Counties, however, have disproportionately little employment in these sectors. Trade Deficit Source Location Quotient Capacity Utilization Source 13


14 Los Angeles Office Market Trends Size of Office Submarkets in Los Angeles County Class A Rents and Vacancy Rates for LA County Net Absorption and Completions for LA County Fundamentals in the Los Angeles office market are considerably weaker in 2009 due to the economic recession. The unemployment rate in Los Angeles County is 12.8 percent, significantly higher than the 8.5 percent recorded one year ago. Approximately 27,000 jobs were lost in the year ending in October 2009, with the largest losses in manufacturing, construction, and leisure and hospitality. ( ca.gov/file/lfmonth/la$pds.pdf) The recent financial crisis is putting additional pressure on the office market as businesses downsize and companies place large blocks of sublease space into the market. High rental rates and the economic slowdown have led many tenants to reconsider their space needs and relocate to lower rent alternatives. With these factors in play, rents are softening, landlords are offering more concessions for tenants, and vacancy rates continue to rise. The shift to a tenant s market became apparent in Q4 of 2007 when net absorption turned negative for the first time in four years. During 2009, vacancy rates steadily climbed to 15.6 percent and net absorption was negative 777,000 square feet in the third quarter alone. The year to date demand for office space is negative 4.1 million square feet, in sharp contrast to the positive 1.75 million square feet absorbed by this time two years ago. Vacancy rates increased and asking rents for both Class A and B leases decreased in Overall Class A rents decreased by 12.3 percent from $3.49 per square foot in Q to $3.06 in Q3 2009, while Class B rents changed from $2.57 to$2.26, a 12.1 percent decrease. During this time frame, vacancy rates moved up by 4.2 percentage points, representing nearly 8 million square feet of unoccupied space. In fact, overall rents are decreasing 14


15 USC Casden Forecast 2009 Industrial & Office Market Report for the first time in about five years. There are considerable downward pressures on rents going forward due to the economic slowdown and associated job losses Q3 Office Vacancy Rates for LA County Submarkets The recent trends in the overall Los Angeles office market are also pervasive in each submarket. Vacancy rates in Tri-Cities increased from 10 percent in Q to 17.3 percent in Q3 2009, the highest among the submarkets. South Bay and Los Angeles North have vacancy rates above 16 percent, which are about 3 percent higher than last year. Year-to-date net absorption is negative in all submarkets with West Los Angeles having the lowest net absorption in the first three quarters of With the downsizing of many financial and real estate firms, sublease space is becoming more available in certain submarkets such as Westwood and Culver City. Asking rents for new leases are now much lower than that of last year as landlords scramble to secure and renew tenants. Despite current conditions, the Los Angeles economy is well diversified and should recover from the economic storm. Innovative industries along with expanding sectors such as medical and green technologies, should help the Los Angeles County office market survive the financial crisis and eventually return to its former healthy growth Year-over-year Class A Rent Increases Dollar Value of Office Sales and Cap Rates Activity The credit crisis has continued to slow investment activity in the Los Angeles office market. Stricter lending standards for buyers to obtain financing have made it more difficult to underwrite deals that satisfy both internal and lender requirements. The total volume of office market sales transactions through the third quarter of this year are at 13 percent of last year s 12 month total and are only at 5 percent of the total of the peak year of While the last quarter will improve this number, it is hard 15


16 Class A Rents and Vacancy Rates for West Los Angeles to imagine that this year will come close to last s for sales, and last year was a bad year. The lack of liquidity in the capital markets is clearly restraining the number of deals that are closing. For those transactions that did take place, capitalization rates rose sharply, from 5.9 percent a year ago to 8.3 percent in West Los Angeles Net Absorption and Completions for West Los Angeles West Los Angeles is the largest submarket in Los Angeles County, representing approximately 28.2 percent of the total market with nearly 53 million square feet of office space. It is also the most desirable and highest priced region with current Class A asking rents at $3.81per square foot. Class A asking rents for Los Angeles total which is $3.06 per square foot. Class B rents are $3.02, which is higher than the Class A rents in every other submarket. Class A Rents and Vacancy Rates for Downtown LA But there is growing evidence that the economic downturn is also affecting the West Los Angeles office market. Year-todate net absorption is negative 1.6 million square feet, with 408,700 square feet of that loss occurring in the third quarter alone. Vacancy rates increased from 9.5 percent last year to 14.9 percent in Q They are still low compared to other submarkets but are currently at a four year high, with 800,000 square feet of office space available for lease. Downtown Los Angeles Downtown Los Angeles office market after years of langushing, showed some robustness in the middle of this decade. But many of the gains were erased in 2009 as the recent financial crisis directly affected many of the downtown tenants. Many national financial companies have offices in Downtown Los Angeles. 16


17 USC Casden Forecast 2009 Industrial & Office Market Report Demand for office space slowed significantly, with a negative net absorption of 94,000 square feet in Q alone. Slowing demand is also apparent in the year-to-date net absorption of negative 319,000 square feet. The vacancy rate moved up to 14.6 percent in Q from 13.1 percent last year. Currently, there is more than 4.7 million square feet of office space available. Subleased office space is entering the market as firms downsize. Vacancies are expected to increase next year as the financial services industry continues to consolidate. One good bit of news is that some financial firms approved plans to hire. It will probably be a while before this translates into growing demand for office space. Despite increasing vacancy rates, Downtown Los Angeles has the second highest Class A rents at $3.22 per square foot. Asking rents remained close to last year s $3.23 rents. Class B asking rents decreased by 9 percent from $2.69 last year to $2.44 in Q Landlords have also begun offering more concessions to attract tenants. Although the supply of office buildings for sale in the market is limited, average cap rates are inching up with tighter lending standards. South Bay Previously, South Bay had been one of the healthiest office markets in Los Angeles due to its comparatively affordable rents. Now in 2009, negative net absorption within the first three quarters totals nearly 800,000 square feet. Nearly the entire loss occurred in Q1 and Q2 of 2009 Vacancy rates increased from 13.5 percent in Q to 16.1% in Q Due to this pressure, Class A asking rents decreased by 11.6 percent from $2.50 in Q to $2.21 in Q Class B rents also decreased from $2.14 last year to $1.94 currently. Net Absorption for Downtown LA Class A Rents and Vacancy Rates for South Bay Net Absorption and Completions for South Bay 17


18 Class A Rents and Vacancy Rates for Los Angeles North Net Absorption and Completions for Los Angeles North Class A Rents and Vacancy Rates for Tri-Cities Los Angeles North The Los Angeles North submarket has been affected the most by the economic slowdown. Due to layoffs at Countrywide and Amgen in the past two years, demand for office space has slowed significantly. Although year-to date net absorption is negative 676,000 square feet, the net move outs are showing signs of slowing. In the third quarter of 2009, net absorption was negative 69,000 square feet, a small loss compared to the last six quarters. Vacancy rates increased from 14 percent in Q to 17.4 percent in Q Currently, 5.4 million square feet of office space is available for lease. Landlords responded to turbulent market conditions by reducing asking rates. Class A rents decreased 10.7 percent from $2.80 at this point last year to $2.50 in Q Similarly, Class B rents declined 7.8 percent from $2.44 to $2.25. The Los Angeles North submarket is one of the few that has seen significant construction of office space in recent years. The amount of space under construction is currently 379,000 square feet - about 25 percent of the 1.5 million square feet under construction at this time for LA County. Barring severe job losses, the market indicators suggest that the LA North office submarket is still undergoing a correction but may be starting to stabilize. Tri-Cities Between the third quarter of 2008 and the third quarter of 2009, vacancies in the Tri- Cities submarket rose by 1.4 million square feet, sharply increasing the vacancy rate from 10 percent to 17.3 percent. While year-to-date absorption has been negative 185,000 square feet, absorption was flat for the third quarter of


19 USC Casden Forecast 2009 Industrial & Office Market Report Demand for space remains flat because rents fell. Class A asking rents declined 3.8 percent from $3.12 last year to $3.00 in Q3 2009, while Class B asking rents dropped 18 percent from $2.84 to $2.33 over the same period. Net Absorption and Completions for Tri-Cities The current vacancy rate is 17.3 percent, up from 10 percent last year Along with the other office submarkets, the Tri-Cities market continues to experience the effects of the financial crisis and a slowing economy. Investment activity has slowed as well-capitalized buyers choose to wait for better prices. San Gabriel Valley The San Gabriel Valley submarket has performed relatively well throughout the recent financial turmoil. However, unlike last year s positive net absorption, yearto-date net absorption has been negative 466,000 square feet. On a brighter note the San Gabriel Valley had a small positive absorption of 20,000 square feet in Q Although at 11.9 percent, the San Gabriel Valley vacancy rate is up from a year ago, it has the lowest vacancy rate among the LA submarkets. We attribute the comparative strength of San Gabriel Valley to the area s low asking rents. Class A asking rents are $2.53 in Q3 2009, about the same as last year, while Class B rents at $2.08 have declined 5.5 percent from last year. Class A Rents and Vacancy Rates for San Gabriel Valley Net Absorption and Completions for San Gabriel Valley 19


20 Class A Rents and Vacancy Rates for Mid-Wilshire Net Absorption and Completions for Mid-Wilshire Mid-Wilshire The Mid-Wilshire submarket has also been affected by the financial crisis and demand for office space has slowed. Year-to-date net absorption in 2009 is negative 364,000 square feet, with about half posted in the third quarter. Just last year, office vacancy rates in the Mid-Wilshire area were at 9.4 percent and the second lowest among the Los Angeles submarkets. They have increased sharply to 14.2 percent in Q As a result, nearly 1.2 million square feet of office space is available for lease. With ample sublease space at reduced rents available in the West Los Angeles and Downtown submarkets, the Mid-Wilshire area has lost some of its attraction as a low cost alternative. Despite the rising vacancies, asking rents for Class A properties increased 6.4 percent from $1.87 last year to $1.99 in Q This may reflect the problem with using asking rents as a metric. Class B rents on the contrary decreased by 2.3 percent, from $1.72 at this point in 2008 to $1.68 currently. Asking rents in the Mid-Wilshire area continue to be the lowest among the Los Angeles submarkets. The investment market has also slowed as investors remain on the sidelines in expectation of lower prices. Most of the sales activity in the area centers on smaller owner-user buildings and medical office properties. 20


21 USC Casden Forecast 2009 Industrial & Office Market Report Orange County Office Market Trends Orange County was ground zero for the subprime morgage industry. As a result, its office market has been on a downward path since 2007, and a considerable amount of office space has been vacated. Although there has been a loss of 52,000 jobs this year, a glimmer of hope has come this fall as nonfarm employment in Orange County did increase by 8,200 jobs between September 2009 and October The financial activities and professional/ business services each posted job gains of 5,400 jobs in the one month period. The government, education and health sectors accounted for more than 6,000 added jobs. Construction, leisure and hospitality, and manufacturing were the only sectors that had losses in employment. ( lfmonth/oran$pds.pdf) Size of Office Submarkets in Orange County Class A Rents and Vacancy Rates for Orange County Overall office vacancy rates increased sharply from 16.1 percent in the third quarter of 2008 to 19.4 percent in the third quarter of The amount of vacant office space has increased by nearly 3 million square feet, for a total of 17 million square feet available. Demand for office space continues to decline with net absorption in 2009 at negative 1.6 million square feet year-todate, with more than half occurring in the second quarter alone. During previous down cycles, substantial office investments and significant amounts of new construction occurred even as the market softened. Now, only 82,000 square feet of new construction are scheduled for delivery, versus 159,000 at this point last year and 1.7 million in Since the beginning of 2009, rising vacancy rates and ample sublease space have forced landlords hands and caused lease rates to decline. Overall asking rents for Class A office space decreased 15.3 percent from last year to $2.50 per square foot in Q Asking rents for Class B office space averaged $2.01 Net Absorption and Completions for Orange County 21


22 2009 Q3 Office Vacancy Rates for Orange County Submarkets in Q3 2008, down 11 percent from last year. The smaller price decline in Class B space may indicates that tenants are shifting towards less expensive. Also, sectors outside of housing and finance continue to seek new office space. These include law firms, as well as technology, interactive entertainment, and healthcare companies Year-over-year Class A Rent Changes Investment Activity Investment activity in the Orange County office market has declined dramatically from recent years and is at a virtual standstill; for the first three quarters, it is at half the level of last year s very bad total level, and more than 90 percent lower than the total in the peak year of It is not surprising that investors are choosing to wait on the sidelines for lower prices due to economic uncertainty and financial volatility. Reduced capital available for lending and tighter lending standards is also making it more difficult for previous investors who relied heavily on leverage deals. With downward pressure on prices, the market is creating opportunities for all cash buyers. Dollar Value of Office Sales and Cap Rates 22

23 USC Casden Forecast 2009 Industrial & Office Market Report Airport Class A Rents and Vacancy Rates for Orange County Airport Area The Airport Area is the central hub for the Orange County office market. Consisting of almost 45 percent of the office base, it is the home for many of the most prominent Class A buildings in the region. The submarket accounts for over 39 million square feet of office space. The year-to-date net absorption in 2009 remains negative, with the loss of 1.6 million square feet. Stemming from the financial crisis, 70 percent of the loss occurred in the second quarter alone. The Airport Area s vacancy rates increased from 16.9 percent in Q to 21.9 percent in Q The high vacancy rate is highest to the South County submarket. Net Absorption and Completions for Orange County Airport Area Major companies are taking advantage of their comparative strength as renters to lock in lower rates in the Airport Area. With rising vacancy rates, asking rents for Orange County s most desirable spaces are dropping sharply. The average asking rates for Class A space decreased 15.1 percent from $3.05 last year to $2.59 in Q Class B rents have also decreased since last year from $2.47 to $2.14 in Q South County The South County submarket has been hit hard by a combination of the credit crisis, oversupply of space, and reduced leasing demand by financial services companies. Class A Rents and Vacancy Rates for South Orange County Year-to-date net absorption is down 17,000square feet, with most negative absorption occurring in the first and second quarters. Vacancy rates increased from 17.9 percent last year to 19.1 percent in Q This is the second highest vacancy rate among the Orange County submarkets for


24 Net Absorption and Completions for South Orange County Class A Rents and Vacancy Rates for North Orange County The slowdown in office investment has completely stopped construction in most submarkets including South County. This coincides with 150,000 square feet at this point last year and 769,000 square feet in With weak demand expected to persist, vacancy rates are likely to continue rising. With rising vacancies and an abundance of available space, Class A rents have decreased by 16.8 percent, at $2.42 in the third quarter of While class B asking rents increased 20 percent between 2006 and 2007, they have been falling in the past two years. They declined 10.7 percent from $2.34 last year to $2.09 currently. North County Although faced with many of the same economic difficulties as other areas, the North County submarket is doing slighty better than the county with vacancy rates that increased from 13.9 percent in the third quarter of 2008 to 18.1 percent in the third quarter of The year-to-date net absorption loss is 173,668 square feet. Net Absorption and Completions for North Orange County Leasing activity includes more allowances and rent concessions and asking rents have decreased. Class A rents are at $2.42 per square foot in Q and significantly lower than last year. Class B rents have also decreased, declining from $2.06 per square foot last year to $1.92 currently. 24

25 USC Casden Forecast 2009 Industrial & Office Market Report Central County Class A Rents and Vacancy Rates for Central Orange County Central County has outperformed the region, as year-to-date net absorption in the third quarter of 2009 was positive 63,000 square feet, the highest in net absorption in any submarket. Vacancy rates increased slightly from 16.5 percent in Q to 17.7 percent in Q Weak demand and high vacancy rates have put pressure on asking rents in the Central County submarket. Class A rents declined 16.2 percent from $2.66 per square foot last year to $2.23 in Q Class B rents decreased b 12.4 percent to $1.83 Net Absorption and Completions for Central Orange County 25
26 Class A Rents and Vacancy Rates for West Orange County Net Absorption and Completions for West Orange County West County The West County submarket is closer to equilibrium than most. Vacancy rates slightly decreased from 8.7 percent in the Q to 8.3 percent in the Q Year-to-date negative net absorption decreased from negative 150,000 square feet last year to only negative 15,600 square feet in Q Class A asking rents dipped from $2.68 last year to $2.34 in Q3 2009, a 12.7 percent decline. Class B rents also decreased by a high percentage, posting a 12.8 percent decline from last year to the current rate of $1.56 per square foot. 26

27 USC Casden Forecast 2009 Industrial & Office Market Report Inland Empire Office Market Trends Size of Office Submarkets in the Inland Empire Class A Rents and Vacancy Rates for Inland Empire Net Absorption and Completions for Inland Empire The recession has been especially harsh to the Inland Empire. Before last year, the region had substantial new construction, causing the previously rapidly growing rental rates to come to a halt. The increase in construction activity has created a supply of office space that has greatly surpassed the level of demand. These conditions, along with the slowing economy, have led the Inland Empire to witness negative absorption for the second year in a row. The Inland Empire has been hard hit by the economic downturn, and had an unemployment rate of 14.6 percent in October 2009 compared to 9.5 percent in October The unemployment rates for Riverside and San Bernardino Counties are 15.1 and 14 percent, respectively and among the highest in the nation. Nearly 2,000 jobs were lost in construction alone by October However, not all industries are experiencing declines in employment. Government institutions added 8,700 jobs in The Inland Empire is also undergoing considerable housing market distress. Between July and September 2009, nearly 28,000 foreclosures were reported, which is an increase of about 16 percent from last year. Due to the Inland Empire s diversified tenant mix and large population of 4.2 million, the office market should eventually affect educators, credit unions, and medical and legal firms. There is also demand for coastalbased service companies to create satellite offices in the cheaper inland areas once the economy recovers. But the Inland Empire in general and San Bernardino County in particular, are at a competitive disadvantage because educational attainment there lags the region. 27


28 2009 Q3 Office Vacancy Rates for Inland Empire Submarkets 2009 Year-over-year Class A Rent Changes In 2009, completions in the Inland Empire totaled 734,000 square feet. Class A asking rents have stayed firm at $2.17 in Q3 2009, whereas Class B rents have declined by 7.5 percent from last year to $1.63 per square foot. Landlords are dropping rental rates for older inventory to compete with the newer properties. The overall vacancy rate remains very high at 22.4 percent. Net absorption was positive in the first and second quarters of 2009, but turned negative in Q3 2009, at negative 69,600 square feet. However, opportunities in the office market do exist for specific industries and regions in the Inland Empire. While the diverse local population continues to attract many businesses, landlords are showing a willingness to negotiate on office leases. In addition, aging baby boomers may move to the Inland Empire to its lower costof-living, which is generating demand for medical office space. Dollar Value of Office Sales and Cap Rates Investment Activity The commercial mortgage-backed securities market, which previously facilitated practically half of all commercial lending, shut down during the second half of 2008 and first half of As we write this, however, there is some inkling of a revival of the market. The Term Asset-Backed Loan Facility has issued $1.3 billion in loans to purchase existing commercial mortgage securities, and Bank of America and Developers Diversified Realty have issued new CMBS recently. Office cap rates have moved up in the Inland Empire, reflecting the tight credit environment and pressure on sale prices. Despite the economic downturn in 2009, there is still high-profile investment activity in the Inland Empire. 28


29 USC Casden Forecast 2009 Industrial & Office Market Report Ontario Airport Region Class A Rents and Vacancy Rates for Ontario Airport The office space in Ontario Airport region constitutes 30 percent of the total in Riverside County. Despite expectations, the Riverside and Ontario submarkets will continue to have high vacancy rates in the remainder of Demand for office space in the Ontario Airport area has increased, with year-to-date net absorption of positive 25,700 square feet in Q Asking rents in the Airport Region are $2.18 per square foot for Class A space in Q3 2009, which is consistent with the Q rate. This region was not as hard hit as the others, owing to the prominence and desirability of the area s proximity to the local airport (although flights there are down substantially from a year ago). Class B rents were more affected in Q3 2009, dropping 6.8 percent from last year s asking rents of $1.73 per square foot. Net Absorption and Completions for Ontario Airport Riverside The Riverside office submarket takes up approximately 8.3 million square feet of space, roughly 32 percent of the Inland Empire s total. Vacancy rates in Q were 26.6 percent, increasing from 21.8 percent in Q and dramatically increasing from 9.2 percent in Q Until recently, the City of Riverside has had strong job and income growth, with a five-year annualized job growth rate of 4.3 percent from Unfortunately, the job growth decreased to negative 5.9 percent as of September Class A Rents and Vacancy Rates for Riverside Riverside is facing the same problems as those of Ontario: low absorption and high vacancy rates. In fact, the Lakeshore Plaza project in Corona has similar fundamentals to those of the Ontario Airport Towers project. 29


30 Net Absorption and Completions for Riverside Class A Rents and Vacancy Rates for San Bernardino San Bernardino San Bernardino s office market is quite small with only 5.7 million square feet of office space. Similar to the rest of the Inland Empire, year-to-date net absorption is at negative 42,100 square feet in Q3 2009, dropping by more than 143,000 square feet from this time last year. San Bernardino s asking rents continue to remain the most affordable in the Inland Empire, with Class A space at $1.69 per square foot, lower than last year. However, vacancy rates have increased to 18.8 percent, which is up 9.3 percentage points from one year ago. In Q4 2008, absorption numbers were heavily driven by prelease activity. However, these absorption numbers were a poor indicator of what was to come in The ubiquitous trend of low absorption and high vacancy rates in San Bernardino will require a longer recovery period than for Riverside and Ontario. Net Absorption and Completions for San Bernardino 30


31 USC Casden Forecast 2009 Industrial & Office Market Report Temecula/South Class A Rents and Vacancy Rates for Temecula Temecula has the highest vacancy rate in the Inland Empire at 25.8 percent in Q The vacancy rate is up 14.2 percentage points from one year ago. Beginning in the third quarter of 2009, net absorption turned negative, reaching negative 10,270 square feet of absorption in Q Asking rents for Class A space are $1.93 per square foot in Q3 2009, down 10.3 percent from one year ago, and lower than the average rent of $2.17 per square foot in the region. Temecula s location directly north of the Orange County continues to attract tenants interested in purchasing cheaper office space. For example, the Kaiser Health Foundation Plan purchased a 23,709 square-foot building in 2008, which will provide a much needed service to the growing senior population in the area. Many of the smaller projects in Temecula will be marketed by developers as condos for lease or for sale, as well as medical and professional offices. Net Absorption and Completions for Temecula 31


32 Los Angeles Industrial Market Trends Size of Industrial Submarkets in Los Angeles County Average Asking Rents and Vacancy Rates for LA County Sales & Leasing for LA County Until the third quarter of 2009, the Los Angeles industrial market had been relatively sheltered from the financial crisis, because the Ports of LA and Long Beach and the regions pre-eminence in manufacturing gives Los Angeles the strongest industrial fundelmental in the nation. Now, however, the economic downturn has begun to affect the Los Angeles industrial market. As a result of the slowing economy, rising unemployment, and a deepening recession, industrial vacancy rates have climbed to 3.2 percent in Q3 2009, which is 0.9 percentage points higher than last year. It is important to note that the solid demand in the region for industrial space has managed to keep vacancy rates very tight by national standards: for the country as a whole, industrial vacancy rates are about three times higher than in Los Angeles County. In addition to rising vacancies, industrial asking rents have fallen by $0.09 since Q3 2008, bringing the county- wide asking rate to $0.48 in Q Landlords are trying to retain tenants and sustain high occupancies with lower asking rents and greater concessions. Slowing demand for industrial space in Los Angeles County is apparent from the negative net absorption of 1.1 million square feet in Q After four years of strong demand, net absoprtion was negative 1.7 million square feet in 2008 and negative 7.7 million in 2009 year-to-date. All submarkets have slowing demand and negative net absorption, with the San Gabriel Valley and Central Los Angeles reporting the two highest levels year-to-date, at negative 2.4 million square feet and 2.1 million square feet respectively. Retail sales are down from last year, although the 2009 holiday season is likely to be better than If you don t want to make that 32


33 USC Casden Forecast 2009 Industrial & Office Market Report change, please remove the the before weak Retail companies are cutting back on their warehouse space and the number of import containers has declined 9 percent in Los Angeles and 22 percent in Long Beach. October port statistics, however, show a glimmer of recovery, particularly for exports. Still, industrial sublease space with lower rents has entered the market, causing overall asking rents to decline. Despite the fact that the Los Angeles industrial market has softened somewhat from the economic downturn. We expect rapid recovery in this sector; the area s port proximity and unique amenities should cause demand to remain steady Q3 Industrial Vacancy Rates for LA Submarkets 2009 Year-over-year Average Rent Changes Activity The absence of financing and uncertainty about values has led to a substantial drop in investments in industrial real estate in Los Angeles County, with transactions falling from $1.3 billion for all of 2008 to $215 million for the first three quarters of this year. Dollar Value of Industrial Sales and Cap Rates 33


34 Average Asking Rents and Vacancy Rates for Central Los Angeles Sales & Leasing Activity for Central Los Angeles Average Asking Rents and Vacancy Rates for North Los Angeles Central Los Angeles With a vacancy rate of 2.5 percent, Central Los Angeles is the tightest submarket in the Los Angeles County industrial market. While this rate is up 0.7 percentage points from last year, it is still 0.7 percent lower than the county-wide rate in Q Despite tight vacancy rates, overall demand in Central Los Angeles has softened. The negative absorption of over 104,000 in Q brought year-to-date net absorption below negative 2.1 million square feet. Asking rents have fallen $0.08 since last year to $0.43 in Q North Los Angeles By national standards, the North Los Angeles submarket has remained stable. However, vacancy rates in this submarket have increased from 2.5 percent in Q to 3.4 percent in Q Furthermore, like all other submarkets, this submarket reported negative net absorption in Q The year-to-date net absorption is negative 636,000 square feet. Asking rents in the region declined $0.06 from last year to $0.56 per square foot in Q Although asking rents were lower this year, North Los Angeles is the only submarket in which sublease space actually decreased in 2009 from last year. Stable vacancy rates are positive signs in this challenging economy. Construction activity declined to nearly zero in Q from approximately 1.2 million square feet in Q and 430,000 square feet in Q Many projects are in the planning phases, so that anticipated high levels of demand can be met once the financial crisis passes and economic recovery begins. In previous quarters, demand for space in the North Los Angeles submarket remained steady because the buildings are newer and provide more attractive amenities. 34


35 USC Casden Forecast 2009 Industrial & Office Market Report Mid-Cities Sales & Leasing Activity for North Los Angeles The Mid-Cities are much like other areas in LA County. Vacancy rates increased from 2.5 percent in Q to 4.1 percent in Q Net absorption for the quarter was negative 875,000 square feet Asking rents decreased 15.3 percent from $0.59 in Q to $0.50 in Q The economic recession has led to weaker retail sales and decreased import activity at the Los Angeles/Long Beach ports. As a result, businesses are cutting costs and reducing their need for warehouse space. The decline in demand for warehouse space has not yet reduced leasing rates and sale prices, which remain stable as potential buyers and tenants adopt a wait and see attitude. Average Asking Rents and Vacancy Rates for Mid-Cities Asking rents in the Mid-Cities submarket should remain stable or even rise because of relatively low vacancy rates. There is little new construction in the area and the location is highly desirable. Mid-Cities submarket should help it weather the economic downturn until solid demand returns. Sales & Leasing Activity for Mid-Cities 35

36 Average Asking Rents and Vacancy Rates for San Gabriel Valley San Gabriel Valley During Q3 2009, the San Gabriel Valley reported a vacancy rate of 4.3 percent, up from 2.5 percent at this time last year. This is the highest vacancy rate that the San Gabriel Valley has reported in the last six years. Demand for industrial space has slowed with year-to date net absorption at negative 2.4 million square feet. Slowing demand and rising vacancy rates have led asking rents to decrease from $0.55 per square foot in Q to $0.44 per square foot in Q Sales & Leasing Activity for San Gabriel Valley 36

37 USC Casden Forecast 2009 Industrial & Office Market Report South Bay Average Asking Rents and Vacancy Rates for South Bay During Q3 2009, vacancy rates were 2.8 percent and up 0.4 percentage points from Q Net absorption was negative 32,100 square feet in the third quarter and the year-to-date absorption is negative 1 million square feet. In conjunction with the indicators of slowing demand, asking rents in the South Bay have decreased from $0.67 per square foot in Q to $0.57 in Q Sales & Leasing Activity for South Bay 37

38 Orange County Industrial Market Trends Size of Industrial Submarkets in Orange County The Orange County industrial real estate market is also affected by the recession. Leasing and sales activity have both slowed in 2009, with negative net absorption in all submarkets, caused by national economic distress and job losses in the manufacturing, financial services and construction sectors. Average Asking Rents and Vacancy Rates for Orange County However, proximity to the Ports of Long Beach and Los Angeles and the comparative strength of the manufacturing base in Orange County have so far prevented the area from experiencing the high levels of vacancy rates occurring elsewhere in the country. Sales & Lease Activity for Orange County The Orange County industrial market has four submarkets with a total of 266 million square feet of space. The market has two main components: the 188 million square feet (70.5 percent) of manufacturing and distribution space, and the 78 million square feet (29.5 percent) of R&D/Flex space. Negative net absorption increased significantly, with over a 3 million square feet loss year-to-date. The overall vacancy rate increased to 6.5 percent, up from 4.6 percent in Q Orange County s warehouse and distribution sector had the lowest net absorption, with year-to-date net absorption of negative 1.4 million square feet. The general industrial sector has been hit the least, with Q3 positive net absorption of 43,100 square feet. Vacancy rates have increased and asking rents in many submarkets have decreased. In addition, landlords are providing rent concessions to tenants signing new leases. Average asking rents for all product types decreased to $0.58 per square foot in Q


39 USC Casden Forecast 2009 Industrial & Office Market Report Landlords of R&D/Flex space, who previously weathered periods of slowing demand, have adjusted to the new market realities and decreased their asking rent from $1.32 of this time last year to $1.05 presently. With rising unemployment rates, a reduction in demand for space, and the slowdown of shipments to the nearby ports, the Orange County industrial market has actually experienced comparative stability, particularly in the last quarter. Rising vacancies should continue to put downward pressure on rents, until the industrial market and economy begin to recover. Investment Activity Sales in Orange County so far in 2009 are at 28 percent of their 2008 totals Q3 Industrial Vacancy Rates for OC Submarkets 2009 Year-over-year Average Rent Changes Dollar Value of Industrial Sales and Cap Rates 39
40 Average Asking Rents and Vacancy Rates for Orange County Airport Area Airport The Airport submarket has year-to-date net absorption of negative 1.5 million square feet, sharply worse than last year s negative 353,635 square feet of net absorption. Overall industrial vacancy rates are at 7.3 percent, which is a substantial increase from the 4.8 percent in Q Average asking rents decreased from $1.16 at this point last year to $0.63 currently. Sales & Leasing Activity for Orange County Airport Area 40


41 USC Casden Forecast 2009 Industrial & Office Market Report North Average Asking Rents and Vacancy Rates for North Orange County The North submarket, the largest in Orange County, features 101 million square feet of space, 38 percent of the total industrial space available. Vacancy rates have increased from 4 percent in Q to 5.5 percent in Q This represents an additional 1.5 million square feet of available industrial space. Although net absorption has trended negative, with 1.03 million square feet lost year to date, the current quarter showed dramatic improvement, with negative absorption of only 85,500 square feet. Sales & Leasing Activity for North Orange County 41


42 Average Asking Rents and Vacancy Rates for West Orange County West The West County submarket has had negative net absorption of 242,500 square feet year-to-date. Vacancy rates significantly increased from 3.5 percent in Q to 5.6 percent in Q Sales & Leasing Activity for West Orange County 42


43 USC Casden Forecast 2009 Industrial & Office Market Report South Average Asking Rents and Vacancy Rates for South Orange County The South submarket had negative net absorption of 245,300 square feet. Vacancy rates rose from 6.9 percent in Q to 8.8 percent currently. Sales & Leasing Activity for South Orange County 43

44 Inland Empire Industrial Market Trends Size of Industrial Submarkets in Inland Empire Change In Rents for Inland Empire The Inland Empire s availability of land and close proximity to major ports made it attractive to industrial users for years. But the subprime crisis and the substantial decline in retail sales has hit San Bernardino and Riverside Counties especially hard, and they have long-term structural issues, including relatively low levels of educational attainment. Still, we expect that over the long term, major distributors will have reason to locate in a relatively cheap place that is not far from where 40 percent of the nation s imported goods enter the country. As we have noted, vacancies in Los Angeles County remain quite low, meaning that when demand picks up again, industrial vacancies in Inland Empire places along major truck routes should start falling again. In 2008, the Los Angeles and Long Beach ports ranked first in the nation and fifth in the world for container ship activity. Heavy container activity and a lack of space in Los Angeles County pushed distributors toward the Inland Empire. But as container traffic declined (in Los Angeles, year-to-date traffic is down 15.4 percent, and in Long Beach it is down 24.5 percent), the Inland Empire was the first place to get hit, and vacancies in many parts of the region soared. Consequently, construction dropped by more than 90 percent from last year to this, to1.5 million square feet. Unemployment rates in Riverside and San Bernardino are among the highest in the nation, with significant job losses in construction, manufacturing and trade and transportation. Consequently, the Inland Empire has had negative net absorption of warehouse space and rising vacancy rates. 44


45 USC Casden Forecast 2009 Industrial & Office Market Report Net absorption was negative 6.4 million square feet year-to-date in Q3 of The Ontario/Mira Loma submarket was the worst with 2.1 million square feet of negative absorption. Average asking rents for industrial space range from $0.27 to $0.46 per square foot. The Inland Empire s asking rents have dropped substantially by 22.9 percent from one year ago. The vacancy rate is currently 12.8 percent, up from 8.6 percent one year ago. There is still a surplus of activity in the eastern regions when compared to the western regions of the Inland Empire. The highest rents are in the western areas of Chino ($0.41 per square foot) and Temecula ($0.46 per square foot) Q3 Industrial Vacancy Rates for Inland Empire Sales Activity and Cap Rates, Inland Empire 45


46 Average Asking Rents and Vacancy Rates for Ontario Average Asking Rents and Vacancy Rates for Chino Ontario/Mira Loma and Chino Net absorption by Q3 of 2009 for Ontario/ Mira Loma was negative 2.1 million square feet year-to-date, a drastic drop from the 138,181 square feet at this time last year and the positive absorption of 3.5 million square feet in Net absorption for the Chino submarket was negative 910,000 square feet, worse than the 515,100 square feet one year ago. Average rental rates decreased in Ontario from $0.44 per square foot in Q to $0.33in Q Average asking rents in Chino decreased by 15.8 percent to $0.41 per square foot. 46


47 USC Casden Forecast 2009 Industrial & Office Market Report Riverside Average Asking Rents and Vacancy Rates for Riverside Riverside vacancy rates have jumped from 13.8 percent in Q to 18.7 percent in Q Average asking rents have decreased from $0.39 last year to $0.32 per square foot this year. San Bernardino The San Bernardino submarket has dropped from 2.3 million square feet of space under construction in Q to zero this year. Demand for industrial space has significantly decreased, changing from 4.4 million square feet of industrial space absorbed year-todate last year to negative 1 million this year. The vacancy rate increased from 19.7 percent in Q to 24.9 percent in Q Average Asking Rents and Vacancy Rates for San Bernardino Average asking rents have declined by 13.9 percent to $0.30 from $0.35 one year ago. San Bernardino s principal competitive advantage is its very low rents by regional standards. Moreno Valley/Perris The Moreno Valley/Perris submarket is one of the newest emerging industrial submarkets in the Inland Empire. It is one of the smallest regions with only 18.9 million square feet of industrial space. Currently, this area shows a 19.1 percent vacancy rate. Because warehouse space in the area has been completed in large blocks, one new building can have a profound impact on vacancy. The availability of space has kept average asking rents low at $0.27 per square foot in Q Average Asking Rents and Vacancy Rates for Moreno Valley/Perris 47
48 Office Market Forecast Southern California s office markets are likely to face significant challenges over the next two years. The financial crisis has sent shockwaves through all economic sectors, leading to widespread layoffs of employees and an overall reduction in the need for office space. Compared to other areas of the nation, Southern California s economic diversity may help its office market rebound more quickly, but recovery is still a long way off. Office market fundamentals weakened steadily through the third quarter and are expected to remain weak due to high unemployment. Vacancy rates have risen in the last year to over 15% in Los Angeles, 19% in Orange County, and 22% in the Inland Empire. Asking rents have declined year-over-year in Los Angeles and Orange County by more than 10%, and increased by a modest 1.9% in the Inland Empire. Bankruptcies and mergers of financial service firms have contributed significantly to the decline in office occupancy and asking rents. The leasing arena has become a tenant s market. In addition to an increase in direct vacancy, space available for sublease has increased significantly, putting pressure on landlords to offer lower rents and more aggressive concession packages. Tighter lending standards are keeping many potential buyers out of the market. As more and more distressed properties come onto the market, an increase in sales activity is likely to occur. Those with cash to invest are looking for bargains, but with so much uncertainty about future cash flow-generating potential, many for-sale properties will remain unsold. In spite of some signs of recovery in the broader economy and a rebound on Wall Street, the Southern California office market will continue to experience high rates of vacancy and declining rents for the near future. The areas with the greatest growth in unemployment will likely see the greatest decline in office demand and, in turn, the greatest decline in rents. 48
49 USC Casden Forecast 2009 Industrial & Office Market Report Los Angeles County Forecast Vacancy rates increased substantially over the last year and may not level out until early Office rents will continue their downward trend for the foreseeable future. In spite of the widespread economic troubles, construction activity has been relatively high. Nearly two million square feet of space have come online in 2009 and another 1.5 million is under construction. Together with the increase in sublease space, the new construction will no doubt put significant downward pressure on rents. If the early signs of broader economic recovery turn into something more sustained, more tenants will likely commit to leases and vacancy will decline. Asking rents will be lowest in submarkets with the greatest amount of sublease space. Vacancy will likely increase and rents decline the most in areas populated by a high fraction of financial services tenants and in the submarkets with new space under construction (West and North Los Angeles). Forecast Vacancy Rates for Los Angeles County Forecast Average Rents for Los Angeles County Orange County Forecast Vacancy rates increased substantially over the last year, but are likely to peak sooner. Orange County has been a leader of sorts in the real estate collapse and may be a leader in recovery as well. Vacancy is expected to peak by early- to mid Rents may decline 20-30% further as landlords redouble their efforts to retain current tenants. The relatively positive vacancy outlook is supported by the fact that only 80,000 square feet of new space is currently under construction in the entire county and no new space has come online in all of Forecast Vacancy Rates for Orange County 49
50 Forecast Average Rents for Orange County Forecast Vacancy Rates for Inland Empire Inland Empire Forecast Vacancy rates have bounced around during the last four quarters, but showed an overall increase of around 8.7% (1.8 percentage points). Vacancy rates are likely to continue to increase over the next two years, but at a more modest pace compared to Los Angeles. After a short-lived bump in asking rents in the first quarter of 2009, rents declined again and will likely continue to do so for the near future. The rate of decline in rents is expected to be significantly lower than in Los Angeles or Orange County. This trend is somewhat surprising considering the large level of recent completions and properties under construction relative to total market size. Perhaps the office market will experience some positive spillovers from the more optimistic industrial property outlook for the region. Forecast Average Rents for Inland Empire 50
51 USC Casden Forecast 2009 Industrial & Office Market Report Los Angeles County Industrial Forecast The Los Angeles industrial market is the nation s largest with over 1 billion square feet. Although industrial space demand has softened, it continues to be a very tight market. Forecast Vacancy Rates for Los Angeles County Vacancy rates climbed to 3.3 percent which is one percentage point higher than last year but remains by far the lowest vacancy rate for any major industrial market in the United States. Rents have however declined dramatically: asking rents declined by 16 percent over the past years, and effective rents have likely dropped even further. We are nevertheless bullish on the mediumand long-term outlook for industrial space in Los Angeles. While the ports have seen a dramatic reduction in containers over the past two years, a striking change is in the balance between outgoing and incoming containers outgoing containers with cargo has been ticking upward this quarter, while inbound containers continue to fall. Forecast Average Rents for Los Angeles County We have already noted our view that exports are likely to be one of the drivers behind the US economic recovery, and as such, the ports in Los Angeles County and their nearby industrial buildings should benefit. At the same time, if energy costs start rising again, proximity to the ports will become increasingly beneficial, which should give Los Angeles industrial space an advantage over space in the rest of the region. Our view is therefore that vacancies will start falling and rents will start rising in Los Angeles County industrial real estate sooner rather than later. We should emphasize, however, that this does not mean we will see strong recovery in industrial market values any time soon. As we have discussed elsewhere, we find it unlikely that capitalization rates for real estate will fall in the near future, so that valuations will remain well below their peaks for several years to come. 51
52 Orange County Industrial Forecast Forecast Vacancy Rates for Orange County Forecast Average Rents for Orange County The Orange County industrial real estate market is similar to the Los Angeles market: by national standards it is pretty healthy, but by its own standards it has deteriorated considerably. Vacancy rates jumped by nearly 50 percent, standing at 6.5 percent. Because asking rents in Orange County remain higher than Los Angeles County, despite a vacancy rate that is twice as high, we expect recovery in Orange County to lag recovery in Los Angeles County. Specifically, we believe that the Orange County industrial market will not bottom until the fourth quarter of 2010, and rents will not cover to peak levels until 2011 at the earliest. That said, because West Orange County is close to the ports, and because its vacancy rate is not far above the natural vacancy rate (i.e., the rate at which real rents remain flat), there is some chance that it will snap back faster than we expect. 52
53 USC Casden Forecast 2009 Industrial & Office Market Report Inland Empire Industrial Forecast The Inland Empire industrial market has lots of variation: markets near major transportation corridors, such as Chino and Temecula, have softened, but not catastrophically so; while the rest of the Inland Empire has vacancy rates in excess of 20 percent and sharply falling rents. Our forecast techniques prevent us from doing anything more localized than the entire Inland Empire Market, and as such give our expected average performance across very diverse markets. As a whole, we expect the market to begin to recover in 2010, but that does not imply that all submarkets will recover. Specifically, we expect Chino and Temecula to behave much like Los Angeles and Orange Counties, but other parts of the region will wait a long time before experiencing recovery. Forecast Vacancy Rates for Inland Empire Forecast Average Rents for Inland Empire 53
54 Technical Notes Office Data Inventory: Office inventory includes all multi-tenant and single tenant buildings with a minimum size threshold of 20,000 square feet. Owner-occupied, government and medical buildings are not included. Office Building Classifications: Grubb and Ellis adhere to the BOMA guidelines. Class A properties are the most prestigious buildings competing for premier office users with rents above average for the area. Class B properties compete for a wide range of users with rents in the average range for the area. Class C buildings compete for tenants requiring functional space at rents below the area average. Vacancy and Availability: The vacancy rate is the amount of physically vacant space divided by the inventory. The availability rate is the amount of space available for lease divided by the inventory. Net Absorption: The net change in physically occupied space over a period of time. Asking Rent: The dollar amount asked by landlords for available space expressed in dollars per square foot per month. Office rents are reported as full service where all costs of operation are paid by the landlord up to a base year or expense stop. Average Weighted Asking Rent: An average market rent where the asking rent for each building in the market is weighted by the building size. Industrial Data Inventory: Industrial inventory includes all multi-tenant, single tenant and owner-occupied buildings with at least 10,000 square feet and World Ports Industrial Market with at least 50,000 square feet. Industrial Product Types: Industrial buildings are categorized as warehouse/distribution, general industrial, R&D/flex and incubator based on their physical characteristics including percent office build-out, clear height, typical bay depth, typical suite size, type of loading and typical uses. Space Under Construction: Space under construction that includes speculative, build-to-suit for lease and owner-built projects. Vacant and Available Space: Vacant space is space that is physically unoccupied. It may or may not be available for lease or sublease. Available space is available for lease and may or may not be vacant. Asking Rent: The dollar amount asked by landlords for available space expressed in dollars per square foot per month. Industrial rents are expressed as triple net where all costs including, but not limited to, real estate taxes, insurance and common area maintenance are borne by the tenant on a pro rata basis. Average Weighted Asking Rent: An average market rent where the asking rent for each building in the market is weighted by amount of available space in the building. 54
55 USC Casden Forecast 2009 Industrial & Office Market Report Overall Disclaimer Some of the data in this report has been gathered from third party sources and has not been independently verified. Neither Grubb & Ellis nor the Casden Forecast make no warranties or representations as to the completeness or accuracy thereof. Technical Notes 2009 University of Southern California, Casden Real Estate Economics Forecast 55
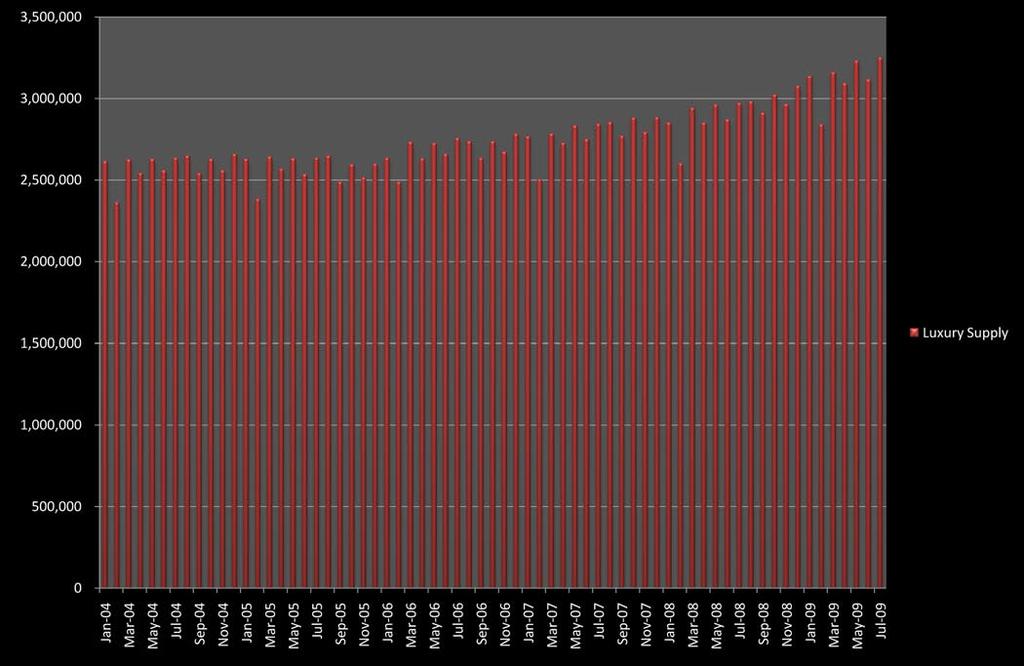
56 Casden Forecast Special Topics Paper By Lloyd F. Hussey MBA/Master of Real Estate Development Candidate A Four Star Dilemma - the recession is deepening the inherent conflicts between owners and management companies in the high end of the hotel business Luxury hospitality is severely affected by the current recession, as headline risk scares expense account travelers away from anything that looks extravagant and consumers make similar lifestyle adjustments. Luxury hotels are primarily owned by high net worth families and large institutional investors who hire wellknown management companies to brand and operate their properties on a long-term contract. The global luxury hotel brands or flags that these hotel management companies have invested heavily to create are their most valuable assets. They protect their brand identity and service culture, characterized by high staffing levels and high fixed costs, above all else. They typically do not cut service levels under any circumstances. However, with occupancy in the luxury segment declining significantly more than it has in the overall hospitality industry over the past year, owners are increasingly finding themselves locked into an untenable situation Luxury s Fall from Grace They call it the AIG effect in the lodging industry. This term refers to the political risk or headline risk that is driving many large corporate events and individual expense account travelers away from luxury flags and exotic locales. With many of the largest banks and brokers on some form of taxpayer funded life support, nobody wants to be caught having a corporate meeting at a five-star resort. The political fallout for AIG was swift and severe. Frugal is in. Conspicuous consumption has become professionally and socially taboo in many circles and accordingly, occupancy in the luxury segment of the hotel industry has declined sharply from the same period a year ago. The luxury occupancy and revenue declines have been much deeper than those felt in the lodging industry as a whole (Fig. 1 & 2). According to data from Smith Travel Research, luxury rooms were 61.1% occupied YTD through July of this year vs. 70.4% through July of (Fig. 3) Revenue per Available Room or RevPAR is the key financial metric in the hotel industry and the numbers for the luxury segment are startling year over year RevPAR has declined 27.4% in the luxury segment vs. an 18.2% drop industry wide through July of No doubt compounding the pain is the supply side of the story. The net change in supply of luxury rooms was up 9.1% as of July vs. the same period in According to Smith Travel Research, about half the supply growth is new build and the other is net conversions, for example, independents converting into a luxury chain. (Fig. 4) The luxury hotel segment has some unique characteristics that are exacerbating the already formidable headwinds of changing consumer attitudes towards luxury and heightened fiscal conservatism in business and politics. Like all luxury goods and services, pricing in this segment of the hotel business has powerful psychological implications and is deeply tied to the brand s reputation for exclusivity and value. As 56


57 USC Casden Forecast 2009 Industrial & Office Market Report Figure 1 Figure 2-57

58 Figure 3- Figure 4-58

59 USC Casden Forecast 2009 Industrial & Office Market Report we touched upon in the opening vignette, protecting the brand s image over the long term is an overriding strategic goal of the luxury flags and as such, they are much less inclined than operators in lower-tier segments to respond tactically with pricing or cost cutting measures when market conditions change. Even if the luxury flags were more willing to discount rooms in an attempt to boost occupancy, the nature of basic hotel finance shows us that this is may not be sustainable. Looking at a simple model (Fig. 5) for a hypothetical luxury hotel with 250 rooms, an average daily rate (ADR) of $319, and 55% occupancy, we can see from the resulting sensitivity table that lowering rates to $219 would not produce a breakeven in revenue per available room (RevPAR) until occupancy increases dramatically to 80%. Figure 5 shows other combinations of room rates and occupancy that produce equivalent revenues. For the Competing Interests of Owners and Operators Exacerbate the Recession s Effects Since the late 1970s, economic theory has been exploring the principal-agent problem. Owners of complex or dispersed operating businesses (for example, a portfolio of hotel properties) often choose not to selfmanage their assets for a variety of reasons. Owners/principals thencontract with an agent to whom they entrust the operation of the business. The dilemma that both economists and real world actors grapple with is how to best structure the financial relationship between principal and agent so that the agent is incentivized to act in the best interests of the principal. Frictions arise when incentives are not well aligned. Incentive theory outlines the classic case of an agent with a first claim on revenues and a Figure 5 ADR - Occupancy Sensitivty luxury management companies, which make the lion s share of their fees from a 3-5% cut of top line revenue, this rate cut looks like a very risky bet which will lead to lower fee income if the occupancy gains fall short of breakeven, not to mention a cheapened brand and diminished pricing power. principal who is merely a residual claimant on the net income of the business; this is largely the case in the current world of luxury branded hotel management contracts. The typical management fee terms commanded by one of the iconic luxury flags might be a 3% base fee of gross revenue and a 5% incentive fee on bottom line profits. The owners, of course, make nothing if the hotel is not profitable. However, with the higher fixed costs associated with luxury service levels comes a higher breakeven occupancy point and thus the hotel owner s expectation 59
INLAND EMPIRE REGIONAL INTELLIGENCE REPORT. School of Business. April 2018
 INLAND EMPIRE REGIONAL INTELLIGENCE REPORT April 2018 Key economic indicators suggest that the Inland Empire s economy will continue to expand throughout the rest of 2018, building upon its recent growth.
INLAND EMPIRE REGIONAL INTELLIGENCE REPORT
 INLAND EMPIRE REGIONAL INTELLIGENCE REPORT June 2016 EMPLOYMENT After a slow start to 2016, the Inland Empire s labor market returned to form, in recent job figures. Seasonally adjusted nonfarm employment
STRENGTHENING RENTER DEMAND
 5 Rental Housing Rental housing markets experienced another strong year in 2012, with the number of renter households rising by over 1.1 million and marking a decade of unprecedented growth. New construction
Nothing Draws a Crowd Like a Crowd: The Outlook for Home Sales
 APRIL 2018 Nothing Draws a Crowd Like a Crowd: The Outlook for Home Sales The U.S. economy posted strong growth with fourth quarter 2017 Real Gross Domestic Product (real GDP) growth revised upwards to
Summary. Houston. Dallas. The Take Away
 Page Summary The Take Away The first quarter of 2017 was marked by continued optimism through multiple Texas metros as job growth remained positive and any negatives associated with declining oil prices
2008 Midyear Housing Forecast
 2008 Midyear Housing Forecast June 25, 2008 By Alan N. Nevin Chief Economist California Building Industry Association Executive Summary: Housing Production Falling Short of Earlier Forecasts Due to the
NAI CAPITAL Market Report Summer 2012
 NAI CAPITAL Market Report Summer 212 1 Market Report Summer 212 NAI Capital is pleased to provide the following economic outlook to our clients. We understand the importance of timely, accurate data when
Mueller. Real Estate Market Cycle Monitor Third Quarter 2018 Analysis
 Mueller Real Estate Market Cycle Monitor Third Quarter 2018 Analysis Real Estate Physical Market Cycle Analysis - 5 Property Types - 54 Metropolitan Statistical Areas (MSAs). It appears mid-term elections
REGIONAL. Rental Housing in San Joaquin County
 Lodi 12 EBERHARDT SCHOOL OF BUSINESS Business Forecasting Center in partnership with San Joaquin Council of Governments 99 26 5 205 Tracy 4 Lathrop Stockton 120 Manteca Ripon Escalon REGIONAL analyst april
RENTAL PRODUCTION AND SUPPLY
 RENTAL PRODUCTION AND SUPPLY Despite a sharp uptick in the number of renter households, construction of multifamily units for rent declined in 27 for the fifth straight year. Even so, growth in the rental
Mueller. Real Estate Market Cycle Monitor Second Quarter 2018 Analysis
 Mueller Real Estate Market Cycle Monitor Second Quarter 2018 Analysis Real Estate Market Cycle analysis of 5 property types in 54 Metropolitan Statistical Areas (MSAs). Graphic Clarification! Point 11
CB Richard Ellis. Los Angeles Multi-Housing Experts
 Team Lustig Bower CB Richard Ellis Los Angeles Multi-Housing Experts 310.550.2600 Multi-Housing Overview by Team Lustig-Bower Apartments: Sales Volume Cap Rates Price Per Unit Employment Growth Apartment
For the Reno MSA employment has historically been based largely on construction and the leisure and hospitality industry. The construction industry
 For the Reno MSA employment has historically been based largely on construction and the leisure and hospitality industry. The construction industry has lost almost 15,000 construction jobs since 2006,
ECONOMIC CURRENTS. Vol. 4, Issue 3. THE Introduction SOUTH FLORIDA ECONOMIC QUARTERLY
 ECONOMIC CURRENTS THE Introduction SOUTH FLORIDA ECONOMIC QUARTERLY Vol. 4, Issue 3 Economic Currents provides an overview of the South Florida regional economy. The report presents current employment,
The state of the nation s Housing 2011
 The state of the nation s Housing 2011 Fact Sheet PURPOSE The State of the Nation s Housing report has been released annually by Harvard University s Joint Center for Housing Studies since 1988. Now in
Housing Market Update
 Housing Market Update March 2017 New Hampshire s Housing Market and Challenges Market Overview Dean J. Christon Executive Director, New Hampshire Housing Finance Authority New Hampshire s current housing
Housing Price Forecasts. Illinois and Chicago PMSA, December 2015
 Housing Price Forecasts Illinois and Chicago PMSA, December 2015 Presented To Illinois Association of Realtors From R E A L Regional Economics Applications Laboratory, Institute of Government and Public
OFFICE QUICK STATS SUMMARY & OUTLOOK MARKET TRENDS VACANCY & NET ABSORPTION ECONOMIC STATS
 INLAND EMPIRE OFFICE THIRD QUARTER 217 QUICK STATS Direct Vacancy 11.4% Overall Vacancy 11.7% Lease Rate FSG $1.83 Gross Absorption Under Construction MARKET TRENDS Current Quarter 529,634 SF 45,24 SF
Quarterly Housing Market Update
 Quarterly Housing Market Update An Overview New Hampshire s current housing market performance, as well as its overall economy, is slowly improving, with positives such as increasing employment and rising
HOUSING MARKET OUTLOOK: SAN LUIS OBISPO, CA AND SURROUNDING AREA
 HOUSING MARKET OUTLOOK: SAN LUIS OBISPO, CA AND SURROUNDING AREA GABE RANDALL SCOTT KELTING April15, 2009 National Market Overview April 15, 2009 2008: A Year in Review Starting between 1999 and 2000,
September 2016 RESIDENTIAL MARKET REPORT
 September 2016 RESIDENTIAL MARKET REPORT The real estate investment market in Japan has had an abundance of capital (both domestic & foreign) over the past couple of years. This, along with the low (now
San Francisco Housing Market Update
 San Francisco Housing Market Update California Economic and Housing Market Outlook The national economy maintained a healthy growth rate in the first quarter of 2005 and appeared to be settling in for
INDUSTRIAL QUICK STATS SUMMARY & OUTLOOK MARKET TRENDS VACANCY & NET ABSORPTION ECONOMIC STATS. Current Quarter. Direct Vacancy 2.
 ORANGE COUNTY INDUSTRIAL SECOND QUARTER 218 QUICK STATS Direct Vacancy 2.2% Overall Vacancy 2.5% Lease Rate NNN $.95 Gross Absorption Under Construction MARKET TRENDS Current Quarter 2,956,71 SF 1,367,18
Market Report Q ///////// Orange County Industrial. ///////////////L o s A n g e l e s /////////////
 ///////////////L o s A n g e l e s ///////////// ///////////O r a n g e C o u n t y /////////// ////////////V e n t u r a ///////////////// ////////// I n l a n d E m p i r e //////////// Market Report
By several measures, homebuilding made a comeback in 2012 (Figure 6). After falling another 8.6 percent in 2011, single-family
. After falling another 8.6 percent in 2011, single-family") 2 Housing Markets With sales picking up, low inventories of both new and existing homes helped to firm prices and spur new single-family construction in 212. Multifamily markets posted another strong year,
2 Housing Markets With sales picking up, low inventories of both new and existing homes helped to firm prices and spur new single-family construction in 212. Multifamily markets posted another strong year,
ECONOMIC CURRENTS. Vol. 5 Issue 2 SOUTH FLORIDA ECONOMIC QUARTERLY. Key Findings, 2 nd Quarter, 2015
 ECONOMIC CURRENTS THE Introduction SOUTH FLORIDA ECONOMIC QUARTERLY Economic Currents provides an overview of the South Florida regional economy. The report presents current employment, economic and real
Cycle Monitor Real Estate Market Cycles Third Quarter 2017 Analysis
 Cycle Monitor Real Estate Market Cycles Third Quarter 2017 Analysis Real Estate Physical Market Cycle Analysis of Five Property Types in 54 Metropolitan Statistical Areas (MSAs). Income-producing real
CBRE Houston ViewPoint
 CBRE Houston ViewPoint DOWNTOWN HOUSTON: THE NEW GATEWAY MARKET? by Sara R. Rutledge Director, Research and Analysis INTRODUCTION Investor interest from both domestic and foreign sources has revived in
Has The Office Market Reached A Peak? Vacancy. Rental Rate. Net Absorption. Construction. *Projected $3.65 $3.50 $3.35 $3.20 $3.05 $2.90 $2.
 Research & Forecast Report OAKLAND METROPOLITAN AREA OFFICE Q1 Has The Office Market Reached A Peak? > > Vacancy remained low at 5. > > Net Absorption was positive 8,399 in the first quarter > > Gross
OVERVIEW OF RECENT/EXPECTED ECONOMIC/ HOUSING MARKET CONDITIONS
 OVERVIEW OF RECENT/EXPECTED ECONOMIC/ HOUSING MARKET CONDITIONS STRONG ECONOMIC FUNDAMENTALS *BUT* EXTRAORDINARY SHORT-TERM FACTORS RESULTING IN MAJOR SHIFTS IN TYPES OF HOUSING PRODUCTS AND GEOGRAPHICAL
Housing Price Forecasts. Illinois and Chicago PMSA, May 2018
 Housing Price Forecasts Illinois and Chicago PMSA, May 2018 Presented To Illinois Realtors From R E A L Regional Economics Applications Laboratory, Institute of Government and Public Affairs University
OFFICE QUICK STATS SUMMARY & OUTLOOK MARKET TRENDS VACANCY & NET ABSORPTION ECONOMIC STATS
 LOS ANGELES SAN GABRIEL VALLEY OFFICE SECOND QUARTER 218 QUICK STATS Direct Vacancy 11.1% Overall Vacancy 11.4% Lease Rate FSG $2.32 Gross Absorption Under Construction MARKET TRENDS Current Quarter 345,68
2018 Housing Market Outlook. Central Coast Realty Group Business Symposium February 22, 2018 Oscar Wei Senior Economist
 2018 Housing Market Outlook Central Coast Realty Group Business Symposium February 22, 2018 Oscar Wei Senior Economist Overview Economic Update California Housing Market Outlook Regional Housing Market
State of the Nation s Housing 2008: A Preview
 State of the Nation s Housing 28: A Preview Eric S. Belsky Remodeling Futures Conference April 15, 28 www.jchs.harvard.edu The Housing Market Has Suffered Steep Declines Percent Change Median Existing
NAB COMMERCIAL PROPERTY SURVEY Q4 2017
 EMBARGOED UNTIL 11.30 AM WEDNESDAY 21 FEBRUARY 2018 NAB COMMERCIAL PROPERTY SURVEY Q4 2017 Date February 2018 NAB Behavioural & Industry Economics KEY FINDINGS The NAB Commercial Property Index (a measure
Monthly Market Snapshot
 SEPTEMBER 2018 Vacancy continues to fall. Nearing the end of the third quarter, the vacancy rate dropped 10 basis points to 6.4%, compared to this time last month at 6.5%. Occupancy of the 1.1 million
Change on the Horizon:
 Change on the Horizon: An overview of the economy and its impact on commercial real estate By Elliot M. Shirwo, Founder and Principal BridgeCore Capital, Inc. Commercial real estate is intrinsically linked
OFFICE QUICK STATS SUMMARY & OUTLOOK MARKET TRENDS VACANCY & NET ABSORPTION ECONOMIC STATS
 LOS ANGELES NORTH OFFICE FOURTH QUARTER 217 QUICK STATS Direct Vacancy 11.8% Overall Vacancy 12.5% Lease Rate FSG $2.75 Gross Absorption Under Construction MARKET TRENDS Current Quarter 1,6,941 SF 89,158
MARKET WATCH SOUTHERN CALIFORNIA & PHOENIX
 SOUTHERN CALIFORNIA & PHOENIX COMMERCIAL REAL ESTATE MARKET FOURTH QUARTER 217 MARKET WATCH SOUTHERN CALIFORNIA & PHOENIX 1.888.659.DAUM WWW.DAUMCOMMERCIAL.COM D/AQ Corp. # 1129558 DAUM TABLE OF CONTENTS
Market Research. Market Indicators
 colliers international LAS VEGAS, NV Market Research OFFICE Third Quarter 2009 Market Indicators Net Absorption Construction Rental Rate Q3-09 Q4-2009 Projected Clark County Economic Data Jul-09 Jul-08
Reveals National Economy Hurting Local Commercial Markets
 Latest SIOR Index Reveals National Economy Hurting Local Commercial Markets Lawrence Yun is Senior Vice President and Chief Economist at the NATIONAL ASSOCIATION OF REALTORS. He writes regular columns
Linkages Between Chinese and Indian Economies and American Real Estate Markets
 Linkages Between Chinese and Indian Economies and American Real Estate Markets Like everything else, the real estate market is affected by global forces. ANTHONY DOWNS IN THE 2004 presidential campaign,
Economic Highlights. Payroll Employment Growth by State 1. Durable Goods 2. The Conference Board Consumer Confidence Index 3
 August 26, 2009 Economic Highlights Southeastern Employment Payroll Employment Growth by State 1 Manufacturing Durable Goods 2 Consumer Spending The Conference Board Consumer Confidence Index 3 Real Estate
Volume II Edition I Why This is a Once in a Lifetime Opportunity for Investors
 www.arizonaforcanadians.com Volume II Edition I Why This is a Once in a Lifetime Opportunity for Investors In This Edition How to make great investment returns in a soft market U.S. Financing for Canadians
OFFICE QUICK STATS SUMMARY & OUTLOOK MARKET TRENDS VACANCY & NET ABSORPTION ECONOMIC STATS
 LOS ANGELES CENTAL/SOUTHEAST OFFICE THIRD QUARTER 218 QUICK STATS Direct Vacancy 14.7% Overall Vacancy 15.2% Lease Rate FSG $3.16 Gross Absorption Under Construction MARKET TRENDS Change from Last Quarter
QUARTERLY ECONOMIC REPORT. July 2018 QUARTERLY ECONOMIC REPORT 1 INLAND EMPIRE. In July 2018, there is a great deal of change in the forces impacting
 INLAND EMPIRE QUARTERLY ECONOMIC REPORT RIVERSIDE & SAN BERNARDINO COUNTIES, CALIFORNIA VOL. 30 NO. 3 JULY 2018 $5.00 INLAND EMPIRE QUARTERLY ECONOMIC REPORT MID-YEAR LOOK AT INLAND EMPIRE ECONOMIC DRIVERS
Real gross domestic product California vs. United States
 Real gross domestic product California vs. United States Percent change, year ago 6 4 U.S. California 2 0-2 -4-6 2001 2002 2003 2004 2005 2006 2007 2008 2009 2010 2011 Source: Bureau of Economic Analysis.
Market Report Q ///////// Los Angeles Industrial. ///////////////L o s A n g e l e s /////////////
 ///////////////L o s A n g e l e s ///////////// ///////////O r a n g e C o u n t y /////////// ////////////V e n t u r a ///////////////// ////////// I n l a n d E m p i r e //////////// Market Report
INDUSTRIAL QUICK STATS SUMMARY & OUTLOOK MARKET TRENDS VACANCY & NET ABSORPTION ECONOMIC STATS
 ORANGE COUNTY INDUSTRIAL FOURTH QUARTER 217 QUICK STATS Direct Vacancy 2.3% Overall Vacancy 2.7% Lease Rate NNN $.91 Gross Absorption Under Construction MARKET TRENDS Current Quarter 4,283,991 SF 963,138
INDUSTRIAL QUICK STATS SUMMARY & OUTLOOK MARKET TRENDS VACANCY & NET ABSORPTION ECONOMIC STATS
 INLAND EMPIRE INDUSTRIAL FOURTH QUARTER 217 QUICK STATS Direct Vacancy 5.1% Overall Vacancy 5.3% Lease Rate NNN $.57 Gross Absorption Under Construction MARKET TRENDS Current Quarter 9,23,744 SF 16,31,563
Housing Market Update
 Housing Market Update September 2017 EXECUTIVE SUMMARY TIGHT HOUSING MARKET CONTINUES, REFLECTS LOW INVENTORY AND HIGHER PRICES Dean J. Christon, Executive Director September 2017 The trend continues in
OFFICE MARKET ANALYSIS:
 OFFICE MARKET ANALYSIS: DAVID WEST RMLS Fellow Certificate of Real Estate Development Student Masters of Urban and Regional Planning Candidate While the Portland office market continues the slow recovery
Orange County Multifamily
 MARKET REPORT / Orange County Multifamily Employment Gains Driving Rental Demand, Low Vacancy Rates More than 2,600 units have come online to this point in, and nearly 5,000 apartments are currently under
Housing Price Forecasts. Illinois and Chicago PMSA, June 2012
 Housing Price Forecasts Illinois and Chicago PMSA, June 2012 Presented To Illinois Association of REALTORS From R E A L Regional Economics Applications Laboratory, Institute of Government and Public Affairs
ANALYSIS OF THE CENTRAL VIRGINIA AREA HOUSING MARKET 1st quarter 2013 By Lisa A. Sturtevant, PhD George Mason University Center for Regional Analysis
 ANALYSIS OF THE CENTRAL VIRGINIA AREA HOUSING MARKET 1st quarter By Lisa A. Sturtevant, PhD George Mason University Center for Regional Analysis Economic Overview Key economic factors in the first quarter
Detroit-Livonia-Dearborn, MI Local Market Report
 Detroit-Livonia-Dearborn, MI Market Summary Third Quarter 2018. The economy features large healthcare and business services sectors. Recent growth in business services was poor. Total job growth was good
Housing Price Forecasts. Illinois and Chicago PMSA, October 2014
 Housing Price Forecasts Illinois and Chicago PMSA, October 2014 Presented To Illinois Association of Realtors From R E A L Regional Economics Applications Laboratory, Institute of Government and Public
RESURGENCE OF RENTAL DEMAND
 5 Rental Housing The rental market has gained strength over the past year, bringing good news to investors. Demand has picked up sharply, vacancy rates have started to retreat, and rents are turning up.
2013 Arizona Housing Market Mid-Year Report
 2013 Arizona Housing Market Mid-Year Report This mid-year market report outlines the latest trends in Arizona real estate. The housing market hit bottom in mid to late 2011, and has been in recovery mode
REAL ESTATE AND THE ECONOMIC OUTLOOK THROUGH 2013:
 1 1 REAL ESTATE AND THE ECONOMIC OUTLOOK THROUGH 2013: Coping With A Different Kind Of Housing Recovery A Presentation To The Commercial Real Estate Education Summit Monrovia, California July 13, 2012
Q Market Report
 ///////////////L o s A n g e l e s ///////////// ///////////O r a n g e C o u n t y /////////// ////////////V e n t u r a ///////////////// ////////// I n l a n d E m p i r e //////////// Market Report
Las Vegas Valley Executive Summary
 ARROYO MARKET SQUARE Las Vegas Valley Executive Summary Retail Market 4th Quarter 2013 THE DISTRICT AT GREEN VALLEY RANCH January 23, 2014 Re: Commercial Real Estate Survey: 4th Quarter, 2013 Dear Reader,
Phoenix Real Estate Outlook. May 2015
 Phoenix Real Estate Outlook May 2015 General Economy 2 Arizona & US Nonfarm Employment YTY % Change 240,600 jobs lost 208,400 jobs gained (87%) Source: ADOA 3 Arizona Jobs Regained Since Bottom of Cycle
Rapid recovery from the Great Recession, buoyed
 Game of Homes The Supply-Demand Struggle Laila Assanie, Sarah Greer, and Luis B. Torres October 4, 2016 Publication 2143 Rapid recovery from the Great Recession, buoyed by the shale oil boom, has fueled
Market Report Q ///////// Los Angeles Industrial. ///////////////L o s A n g e l e s /////////////
 ///////////////L o s A n g e l e s ///////////// ///////////O r a n g e C o u n t y /////////// ////////////V e n t u r a ///////////////// ////////// I n l a n d E m p i r e //////////// Market Report
OFFICE QUICK STATS SUMMARY & OUTLOOK MARKET TRENDS VACANCY & NET ABSORPTION ECONOMIC STATS
 VENTURA COUNTY OFFICE THIRD QUARTER 217 QUICK STATS Direct Vacancy 13.9% Overall Vacancy 14.3% Lease Rate FSG $2.25 Gross Absorption Under Construction MARKET TRENDS Current Quarter 34,43 SF 18,112 SF
} Construction jobs have
 Texas Housing Market Finally Building a Solid Recovery By D Ann Petersen } Construction jobs have contributed to total employment consistently beginning this year, making construction the last of the major
The Coldwell Banker Carlson Real Estate Market Report
 The Coldwell Banker Carlson Real Estate Market Report 2017 Year-End Stowe Area Report Our 2017 Year-End Market Report uses market-wide data, based on transactions that closed in 2017 in the Multiple Listing
Vacancy Inches Higher, Despite Continued Absorption
 Research & Forecast Report GREATER PHOENIX OFFICE 1Q 2017 Vacancy Inches Higher, Despite Continued Absorption Key Takeaways > > Improving conditions in the Greater Phoenix office market took a pause in
Housing and Economy Market Trends
 Housing and Economy Market Trends Mainstreet Organization Prices of single-family, detached homes in suburban Chicago increased 12.1 percent in May 2014 compared with the same period a year ago. Overall,
Greater Los Angeles MARKETBEAT. Office Q Economy. Market Overview
 LOS ANGELES COUNTY Economic Indicators Q2 16 Q2 17 Los Angeles Employment 4.38M 4.44M Los Angeles Unemployment 5.3% 4.4% U.S. Unemployment 4.9% 4.4% 12-Month Forecast Economy The job growth rate in Los
INDUSTRIAL QUICK STATS SUMMARY & OUTLOOK MARKET TRENDS VACANCY & NET ABSORPTION ECONOMIC STATS
 PHOENIX, ARIZONA INDUSTRIAL THIRD QUARTER 217 QUICK STATS Direct Vacancy 8.7% Overall Vacancy 9.% Lease Rate NNN $.54 Gross Absorption Under Construction MARKET TRENDS Current Quarter 5,991,128 SF 4,751,494
HOULIHAN LAWRENCE COMMERCIAL GROUP
 HOULIHAN LAWRENCE COMMERCIAL GROUP TH QUARTER EXECUTIVE SUMMARY FOURTH QUARTER Dear Clients, With behind us and the new year in full swing, we can now reflect, summarize and gain insight from the past
Market Report Q ///////// Inland Empire Industrial. ///////////////L o s A n g e l e s /////////////
 ///////////////L o s A n g e l e s ///////////// ///////////O r a n g e C o u n t y /////////// ////////////V e n t u r a ///////////////// ////////// I n l a n d E m p i r e //////////// Market Report
Market Research. Industrial Review. Industrial Third Quarter Market Indicators
 colliers international LAS VEGAS, NV Market Research Industrial Third Quarter 2009 Market Indicators Vacancy Net Absorption Construction Rental Rate Q3-09 Q4-2009 Projected Clark County Economic Data Jul-09
Market Trends and Outlook
 Residential Remodeling Market Trends and Outlook Kermit Baker Remodeling Futures Conference April 3, 2012 Remodeling Market Overview 1. Home improvement spending totaled an estimated $290 billion last
Released: February 8, 2011
 Released: February 8, 2011 Commentary 2 The Numbers That Drive Real Estate 3 Recent Government Action 10 Topics for Home Buyers, Sellers, and Owners 13 Brought to you by: KW Research Commentary Gradual
Soaring Demand Drives US Industrial Market to New Heights
 Soaring Demand Drives US Industrial Market to New Heights Capitas (DIFC) Limited I June Issue: 2017 THIS ISSUE COVERS: The Amazon Factor a seismic shift in the way people shop Industrial real estate hitting
Owner spending on improvements to existing homes also rose over the past year. Benefiting from strengthening house sales, CONSTRUCTION RECOVERY
 2 Housing Markets After another year of healthy growth in 213, the housing market paused in the first quarter of 214. The renewed weakness in residential construction, sales, and prices raised fears that
Economy. Denmark Market Report Q Weak economic growth. Annual real GDP growth
 Denmark Market Report Q 1 Economy Weak economic growth In 13, the economic growth in Denmark ended with a modest growth of. % after a weak fourth quarter with a decrease in the activity. So Denmark is
The Corcoran Report 3Q17 MANHATTAN
 The Corcoran Report 3Q17 MANHATTAN Contents Third Quarter 2017 4/7 12/23 3 Overview 8 9 10 Market Wide 11 Luxury 24 4 Sales / Days on Market 5 Inventory / Months of Supply 6 7 Market Share Resale Co-ops
Stronger Office Market Looking Into Future
 Research & Forecast Report Long Island OFFICE MARKET Q2 2015 Stronger Office Market Looking Into Future Rose Liu Research & Financial Analyst Long Island Takeaways Class A & B Long Island economic and
Multifamily Market Commentary December 2018
 Multifamily Market Commentary December 218 Small Multifamily a Big Deal in Los Angeles Small multifamily properties those with five- to 5-units are getting more attention as an important source of affordable
HOUSING MARKETS. Strength in Early 2005 Pushed Most National Housing Indicators into Record Territory
 HOUSING MARKETS Despite another record-setting performance, housing markets showed clear signs of cooling late in 2005. As mortgage interest rates moved up and house prices soared, home sales turned down
OFFICE QUICK STATS SUMMARY & OUTLOOK MARKET TRENDS VACANCY & NET ABSORPTION ECONOMIC STATS
 ORANGE COUNTY OFFICE THIRD QUARTER 217 QUICK STATS Direct Vacancy 12.1% Overall Vacancy 12.9% Lease Rate FSG $2.61 Gross Absorption Under Construction MARKET TRENDS Current Quarter 2,479,293 SF 379, SF
Economic and Market Outlook: SAN ANTONIO OFFICE Q1 2016
 Economic and Market Outlook: HOUSTON SAN ANTONIO AUSTIN Table 1. Key market indicators for Q1 2016, and their percent (%) change on a quarter-over-quarter (QoQ) and year-over-year (YoY) basis (Class A
RESEARCH & FORECAST REPORT
 Q3 2012 OFFICE LAS VEGAS NEVADA RESEARCH & FORECAST REPORT Office Forges Ahead Southern Nevada s office market continued to post positive net absorption in the third quarter of 2012, despite weak employment
KEY TOWER SALE highlights start of 2017
 KEY TOWER SALE highlights start of 2017 Demand for office space in the Greater Cleveland office market remained strong as 2016 wound down and transitioned into the first quarter of 2017. After netting
OFFICE MARKET ANALYSIS
 OFFICE MARKET ANALYSIS KYLE BROWN RMLS Fellow, Master of Real Estate Development Candidate Amid some encouraging signs nationally, the Portland office market has maintained its stability, with the CBD
RESEARCH & FORECAST REPORT
 Q2 2012 OFFICE LAS VEGAS NEVADA RESEARCH & FORECAST REPORT Recovery Without Job Growth? Despite office employment still trending downwards, Southern Nevada s office market posted positive net absorption
Rents Up, Occupancy Steady
 Rents Up, Steady Kansas City s apartment market closed 2014 with a significant increase in rents compared to the prior year. The average per-square-foot rent was $0.88. At the end of 2013 it had been $0.85.
Market Research. OFFICE First Quarter 2010
 colliers international LAS VEGAS, NV Market Research OFFICE First Quarter 2010 Market Indicators Net Absorption Construction Rental Rate Q1-10 Q2-2010 Projected Clark County Economic Data Jan-10 Jan-09
Housing Price Forecasts. Illinois and Chicago PMSA, January 2019
 Housing Price Forecasts Illinois and Chicago PMSA, January 2019 Presented To Illinois Realtors From R E A L Regional Economics Applications Laboratory, Institute of Government and Public Affairs University
Lancaster Commercial & Industrial Market Overview. February 14, 2018
 Lancaster Commercial & Industrial Market Overview February 14, 2018 2017 Macro Economic Assumptions GDP (2017 Average for 4 Quarters) 2.6% 2017 Actual 2018 Forecast Total GDP 2.6% 2.75% to 3.5% Consumer
Sent via and RE: Financial Crisis Inquiry Commission Hearing Written Testimony
 10100 W. Charleston Blvd. Suite 200 Las Vegas, Nevada 89135 t: 702.967.3333 f: 702.314.1439 www.appliedanalysis.com Commissioner Heather Murren and Commissioner Byron Georgiou Financial Crisis Inquiry
Office Market Analysis City of Chicago. According to Costar Property, the City of Chicago office market is distributed as follows:
 Office Market Analysis City of Chicago Market Composition & Distribution According to Costar Property, the City of Chicago office market is distributed as follows: Office Submarket Distribution - City
MULTIFAMILY MARKET REPORT GREATER TORONTO AREA FALL 2017
 MULTIFAMILY MARKET REPORT GREATER TORONTO AREA FALL 2017 Table of Contents 1.0 Demand Indicators 2.0 Economic Snapshot 3.0 Multifamily Housing Market Summary 4.0 Rental Market Summary 5.0 Secondary Rental
CALIFORNIA ECONOMIC & MARKET OUTLOOK. October 29,2014 Contra Costa Association of REALTORS Leslie Appleton Young, Chief Economist
 2014 2015 CALIFORNIA ECONOMIC & MARKET OUTLOOK October 29,2014 Contra Costa Association of REALTORS Leslie Appleton Young, Chief Economist OVERVIEW Economic Outlook California Housing Market Outlook Housing
Cycle Monitor Real Estate Market Cycles Second Quarter 2018 Analysis
 Black Creek Research Cycle Monitor Real Estate Market Cycles Second Quarter 0 Analysis Real Estate Market Cycle analysis of five property types in Metropolitan Statistical Areas (MSAs). Important note:
INDUSTRIAL QUICK STATS SUMMARY & OUTLOOK MARKET TRENDS VACANCY & NET ABSORPTION ECONOMIC STATS
 VENTURA COUNTY INDUSTRIAL FOURTH QUARTER 217 QUICK STATS Direct Vacancy 2.1% Overall Vacancy 2.4% Lease Rate NNN $.7 Gross Absorption Under Construction MARKET TRENDS Current Quarter 1,332,957 SF 774,362