APPRAISAL OF MARKET VALUE OF THE SYNERGY PROPERTY HOLDINGS, LLC PROPERTY 465 AVENUE OF THE CITIES EAST MOLINE, IL (FILE # )
|
|
|
- Lesley Giles Wood
- 5 years ago
- Views:
Transcription

1 APPRAISAL OF MARKET VALUE OF THE SYNERGY PROPERTY HOLDINGS, LLC PROPERTY 465 AVENUE OF THE CITIES EAST MOLINE, IL (FILE # ) PREPARED FOR: HELEN GEE FIRST MIDWEST BANK 725 WAUKEGAN ROAD DEERFIELD, ILLINOIS PREPARED BY: JORDAN D. MAUS ROY R. FISHER 2028 EAST 38TH STREET - SUITE 1 DAVENPORT, IA /14/2016 <10212> 1E
2 August 9, 2016 Helen Gee First Midwest Bank 725 Waukegan Road Deerfield, Illinois RE: Appraisal of Market Value of the Synergy Property Holdings, LLC property, 465 Avenue of the Cities, East Moline, IL (File # ). Ms. Gee: As requested, I have completed an appraisal of the above property. This Appraisal Report is intended to comply with the Uniform Standards of Professional Appraisal Practice (USPAP), FIRREA, and the requirements of First Midwest Bank. The report explains and supports my opinion of value of the subject. It was prepared after an inspection of the property and its neighborhood, and an analysis of sales and income data, as well as other factors deemed pertinent. The level of research and analysis is outlined in the scope of work section of this report. This report is copyrighted. The information in the report, including comparable sales and lease data, cannot be given to parties not identified in the letter of transmittal without the written permission of the appraiser. The As Stabilized prospective market value is subject to the Extraordinary Assumption that the vacant suites will lease up as projected herein. The use of this Extraordinary Assumption may have affected the assignment results. As a result of our investigation, and based upon the analysis of the following data, it is our opinion that the As Is Market Value of the Leased Fee Interest in the subject property, as of July 21, 2016, and the As Stabilized prospective Market Value, as of August 1, 2019, are: AS IS AS STABILIZED $1,550,000 $1,900,000 Jordan D. Maus Certified General Real Property Appraiser Illinois #
3 TABLE OF CONTENTS Letter of Transmittal Table of Contents SUBJECT PHOTOGRAPHS... 4 STATEMENT OF APPRAISAL PROBLEM SALIENT FACTS SUMMARY REGIONAL AND CITY DATA NEIGHBORHOOD DATA SITE ANALYSIS DESCRIPTION OF IMPROVEMENTS MARKET OVERVIEW HIGHEST AND BEST USE ANALYSIS COST APPROACH TO VALUE SALES COMPARISON APPROACH TO VALUE INCOME APPROACH TO VALUE CORRELATION AND VALUE ESTIMATE CERTIFICATION CONTINGENT AND LIMITING CONDITIONS Addenda


4 SUBJECT PHOTOGRAPHS Looking northeast at the subject Looking southeast at the subject Looking northwest at the subject Page 4


 Page 5")
5 SUBJECT PHOTOGRAPHS Looking southwest at the subject An interior view of Suite A (Vacant) An interior view of Suite A (Vacant) Page 5

 An B")

6 SUBJECT PHOTOGRAPHS An interior view of Suite A (Vacant) An interior view of Suite B (Vacant) An interior view of Suite B (Vacant) Page 6


7 SUBJECT PHOTOGRAPHS An interior view of Suite C (Orion Health) An interior view of Suite C (Orion Health) An interior view of Suite D (Vacant) Page 7


 Page 8")
8 SUBJECT PHOTOGRAPHS An interior view of Suite D (Vacant) An interior view of Suite D (Vacant) An interior view of Suite E (Veterans Health Administration) Page 8

 An")

9 SUBJECT PHOTOGRAPHS An interior view of Suite E (Veterans Health Administration) An interior view of Suite E (Veterans Health Administration) Looking north along the shared drive Page 9


10 SUBJECT PHOTOGRAPHS Looking west along Avenue of the Cities Looking east along Avenue of the Cities Page 10

11 AERIAL PHOTO Page 11
12 STATEMENT OF APPRAISAL PROBLEM PURPOSE, INTENDED USER, AND INTENDED USE: The purpose of this appraisal is to estimate the As Is and As Stabilized Market Values of the Leased Fee Interest in the Synergy Property Holdings, LLC property, 465 Avenue of the Cities, East Moline, IL. The intended user is First Midwest Bank and/or affiliates. The intended use is for loan underwriting and/or credit decisions by First Midwest Bank or participants. DEFINITIONS: Market Value is defined by The Appraisal Foundation in its Uniform Standards of Professional Appraisal Practice, published by the Appraisal Institute ( Edition, p. 3) as, a type of value, stated as an opinion, that presumes the transfer of a property (i.e., a right of ownership or a bundle of such rights), as of a certain date, under specific conditions set forth in the definition of the term identified by the appraiser as applicable in an appraisal. Market Value is defined in 12 CFR of FIRREA as, the most probable price which a property should bring in a competitive and open market under all conditions, requisite to a fair sale, the buyer and seller, each acting prudently, knowledgeably and assuming the price is not affected by undue stimulus. Implicit in this definition is consummation of a sale as of a specified date and passing of title from seller to buyer under conditions whereby: - Buyer and seller are typically motivated; - Both parties are well informed or well advised and each acting in what he considers his own best interest; - A reasonable time is allowed for exposure in the open market; - Payment is made in terms of cash in U.S. dollars or in terms of financial arrangements comparable thereto; and - The price represents the normal consideration for the property sold unaffected by special or creative financing or sales concessions granted by anyone associated with the sale. Leased Fee Interest is defined in The Dictionary of Real Estate Appraisal, published by the Appraisal Institute (6 th Edition, 2015, p. 128) as, the ownership interest held by the lessor, which includes the right to receive the contract rent specified in the lease plus the reversionary right when the lease expires. Extraordinary Assumption is defined by The Appraisal Foundation, in its Uniform Standards of Professional Appraisal Practice, ( Edition, p. 3) as, an assumption, directly related to a specific assignment, as of the effective date of the assignment results, which, if found to be false, could alter the appraiser s opinions or conclusions. The As Stabilized prospective market value is subject to the Extraordinary Assumption that the vacant suites will lease up as projected herein. The use of this Extraordinary Assumption may have affected the assignment results. Page 12
13 STATEMENT OF THE APPRAISAL PROBLEM OVERVIEW OF THE PROPERTY: The subject is along the north side of an Avenue of the Cities frontage road, west of 7 th Street. It consists of a 127,630± sq.ft. (2.93± acre) land parcel improved with a 23,484± sq.ft., one-story, multi-tenant office building constructed in The building contains five units, of which two are leased and three are vacant. Rentable area is estimated at 21,451 sq.ft., with current vacancy at 65%. SCOPE OF THE APPRAISAL: In preparing this appraisal, the appraiser: 1. Inspected the site, as well as the interior and exterior of the building; 2. Researched public records to determine ownership and other pertinent information; 3. Reviewed the leases and historical income and expense information; 4. Developed an opinion of Highest and Best Use; 5. Identified and investigated appropriate sales and income data; 6. Developed the Sales Comparison and Income Approaches to Value; and 7. Reconciled the various findings into a final estimate of Market Value. Although applicable, the Cost Approach was not developed. Estimates for replacement cost new, physical depreciation, and functional and external obsolescence are highly subjective, and limit the reliability of the approach. It also typically reflects the Fee Simple interest and does not take into account the leases. Therefore, it was not developed. The Sales Comparison and Income Approaches are both applicable to the subject and were fully developed. Market data used in the report was independently researched by the appraiser or is from the appraiser s files. The comparables used in the report were researched, inspected, and confirmed by the appraiser. The property is being appraised exclusive of any fixtures, equipment, inventory, or personal property. No consideration has been given to any business value. The report is presented in a summary format. All of the data necessary to understand the analysis is included in the report or referenced in the Addenda of the report. DATE OF APPRAISAL: Jordan D. Maus inspected the interior and exterior of the subject on July 21, This is the effective date of value. The date of the report is August 9, Page 13
14 STATEMENT OF THE APPRAISAL PROBLEM OWNERSHIP AND SALES HISTORY: According to the Rock Island County Recorder s Office, title to the property is held by Synergy Property Holdings, LLC. My research has revealed one transfer of title to the subject in the five years prior to this report s effective date. The bank foreclosed on the subject on 12/4/2014 (Sheriff s Deed # ). The grantor was the Sheriff of Rock Island County and the grantee was Synergy Property Holdings, LLC, a wholly owned subsidiary of First Midwest Bank. There was no recorded sale price for this transaction. AMERICANS WITH DISABILITIES ACT: The Americans with Disabilities Act (ADA) became effective January 26, A specific compliance survey and analysis of this property has not been performed to determine whether or not it is in conformity with the various requirements of the ADA. A detailed survey could reveal that the property is not in compliance with one or more of the requirements of the ADA, which could have a negative effect on value. There are five parking spaces reserved for handicapped use, and the building entrances and restrooms appear to be handicapped accessible. HAZARDOUS MATERIALS: The value estimate herein is based upon the assumption that there are no hazardous materials in the building or the site. The appraiser is not qualified to discern the presence or absence of such materials (asbestos, underground tanks, etc.), but is aware that they can have a significant negative effect upon the value of a property. No responsibility is assumed for any such conditions, or for any expertise or engineering knowledge required to discover them. REASONABLE EXPOSURE TIME: The Uniform Standards of Professional Appraisal Practice states in the Comment to Standard 1-2(c)(iv) that, when reasonable exposure time is a component of the definition for the value opinion being developed, the appraiser must also develop an opinion of reasonable exposure time linked to that value opinion. USPAP defines exposure time as, estimated length of time that the property interest being appraised would have been offered on the market prior to the hypothetical consummation of a sale at market value on the effective date of the appraisal. Comment: Exposure time is a retrospective opinion based on an analysis of past events assuming a competitive and open market. The subject is currently for sale at $1,650,000. It was originally listed in December 2013 for $1,750,000. The total marketing time is roughly 30 months. Considering the level of demand for similar properties, and the marketing times of the comparables analyzed later in this report (as well as others contained in my database), I have estimated marketing and exposure times of months. Page 14
15 SALIENT FACTS SUMMARY DATE OF VALUATION: July 21, DATE OF REPORT: August 9, ADDRESS: PROPERTY TYPE: LAND AREA: 465 Avenue of the Cities, East Moline, IL. Multi-Tenant Office Building. 127,630± sq.ft. (2.93± acres). IMPROVEMENTS: A 23,484± sq.ft. office building constructed in CURRENT OWNERSHIP: ZONING: Synergy Property Holdings, LLC. B-2 (Local Business District). ASSESSED VALUE AND TAXES: Real Estate Assessment and Taxes Tax ID Assessment Year Land Improvements Total Equalization Ratio Implied Value Taxes Due Year Tax Rate Tax Rate Per 2015 Taxes SM $110,532 $472,743 $583,275 33% $1,750, $ $100 $61,721 Notes: The 2015 assessment is unchanged from The appraised value and listing price are below the assessed value. Therefore, the owner should consider protesting the assessment. RIGHTS APPRAISED: LEGAL DESCRIPTION: Market Value of the Leased Fee Interest. See Sheriff's Deed in the Addenda VALUE ESTIMATES: AS IS AS STABILIZED $1,550,000 $1,900,000 The As Stabilized prospective market value is subject to the Extraordinary Assumption that the vacant suites will lease up as projected herein. The use of this Extraordinary Assumption may have affected the assignment results Page 15
16 REGIONAL AND CITY DATA Quad City Area Population Data Year Davenport Bettendorf Moline Rock Island East Moline Other MSA* ,264 27,381 46,407 46,828 20, , , ,333 28,139 43,202 40,552 20, , , ,331 31,523 43,299 39,675 21, , , ,685 33,217 43,483 39,018 21, , , ,224 34,967 43,937 38,533 21, , ,231 % Change 2.55% 5.27% 1.04% -1.24% -0.84% 1.02% 1.46% (2010 to 2015) 2020 Projected 105,429 36,727 44,344 38,308 21, , ,955 % Change (2015 to 2020) 3.14% 5.03% 0.93% -0.58% -0.20% 1.12% 1.75% Sources: ESRI 1980 topulation 6% 36% 2020 trojected topulation 6% 37% 10% 27% 12% 12% 27% 9% 11% 7% 5avenport.ettendorf aoline wock Lsland 9ast aoline hther 5avenport.ettendorf aoline wock Lsland 9ast aoline hther Demographic Detail Scott Rock Island Scott Rock Island MSA County County Owner Occupied MSA County County 2015 Households 171,295 75,013 61,740 Average Home Value , , ,254 Projected ,930 78,178 62,068 Change (2015 to 2020) 3,635 3, Housing Units 171,295 75,013 66,560 % Change 2.12% 4.22% 0.53% Owner Occupied 64.2% 63.7% 62.1% Renter Occupied 28.4% 29.5% 30.7% 2015 Median Age Vacant 7.4% 6.9% 7.2% Projected Blue Collar (2015) 25.2% 22.7% 25.6% Avg. Household Size (2015) Services (2015) 18.2% 17.2% 19.9% White Collar (2015) 56.6% 60.1% 54.5% Length of Residence (2000 Census) Stability (% in Res. 5+ yrs) 44.10% 48.10% 43.20% Education (2015) % comp. High School 30.9% 27.4% 31.9% 2000 Median HH Income $40,637 $42,827 $38,599 % with some College 23.0% 21.6% 24.4% 2010 Median HH Income $51,378 $54,786 $48,659 Associates Degree 10.5% 11.4% 9.5% 2015 Median HH Income $51,515 $52,929 $48,656 Bachelor's Degree 17.3% 21.4% 14.8% Projected 2020 $58,873 $63,665 $54,106 Graduate Degree 9.0% 11.1% 7.8% Percentage Increase ( ) 14.28% 20.28% 11.20% Page 16
17 REGIONAL AND CITY DATA GENERAL: The Quad City metropolitan area is situated in east-central Iowa and northwest Illinois. The area actually consists of 14 contiguous municipalities, but the cities with the largest populations are Davenport and Bettendorf in Iowa, and Rock Island and Moline in Illinois. The Quad Cities straddle the Mississippi River midway between Minneapolis and St. Louis and are at the halfway point between Chicago and Des Moines. The metropolitan area has the second largest base population within a 200-mile radius between Chicago and Omaha (Des Moines is larger). The Quad City area, the home of Deere and Company, has historically been typified by heavy, agricultural manufacturing. However, major reductions in manufacturing, in the 1980s included plant closings by International Harvester, J.I. Case, and Caterpillar, Inc. It is a regional center for retail, banking and medical services, serving a roughly 50 mile radius. POPULATION/DEMOGRAPHICS: The Quad City area experienced significant and steady population growth between 1960 and However, the recession in the 1980s resulted in a net loss in population of 8.62%, between 1980 and The 2000 U.S. Census indicated a rebound in population to 376,019, an increase of 7.17%, with an increase to 379,690 in the 2010 Census, an increase of 0.98%. The majority of the growth has been in the Iowa Quad Cities, with population losses in the Illinois Quad Cities municipalities. Bettendorf has shown the greatest percentage increase, while Rock Island has shown the greatest decrease. The primary Illinois communities of Moline and Rock Island are essentially landlocked between the Rock and Mississippi Rivers, limiting their potential for growth. Moline is the only major Illinois community to show growth in the past 15 years. Still, the population of Moline is projected to grow only slightly between 2015 and Proximate surrounding cities such as Eldridge, Blue Grass, and LeClaire in Iowa, and Silvis, Hampton, and Rapid City in Illinois, experienced significant gains in the 1990s, while the smaller towns in rural areas suffered dramatic reductions in population. The regional population is projected to increase modestly by The number of households will increase at a slightly higher rate, with the majority of the growth in the Iowa Quad Cities. This is due to a decrease in the average household size, which is consistent with national trends. The population is also aging modestly, again consistent with national trends. The area is not highly transient, with over 40% of the households in the same residence for over five years (2000 Census data), with annual turnover being less than one in five residences. The median household incomes for the MSA and the two largest counties are slightly below the national average. The median income is roughly 10% higher in the Iowa Quad Cities. Increases in the household income are projected to keep pace with inflation, but recent reductions in household income due to the economic downturn make those projections appear less likely. Scott County has more White Collar workers than does Rock Island County and also has a slightly higher percentage of home ownership. As would be expected by the higher median incomes, Scott County has a notably higher degree of education, when compared to Rock Island County. Page 17


18 REGIONAL AND CITY DATA Page 18
19 REGIONAL AND CITY DATA TRANSPORTATION: The Quad City area has a strong competitive advantage in their excellent highway networks. It is served by Interstates #74, #80, #88, and #280. U.S. Highways #6, #61, and #67 also serve the region. Additionally, Illinois Highways #5 and #92 are heavily used connecting state highways. This is the major reason a number of motor carriers maintain offices and/or terminals in the area. These good linkages allow overnight access to several major population markets for large distributors, suppliers, and consumers. The Quad City International Airport is in Moline, Illinois, and provides flights to major Midwestern hubs, with connections to all national and international destinations. Recovering from the terrorist acts of 2001, passenger traffic rebounded to record levels from 2007 to 2010, but they have since decreased slowly. The Airport Authority has constructed a freight aircraft parking area, a freight storage building, and a computer security system to accommodate air freight service providers. Recently, the airport runways were extended to accommodate larger planes. Smaller private-craft airports include those in Davenport, Aledo, Clinton, and Muscatine. Three railroads serve the area (Burlington Northern Santa Fe, I&M Rail Link, and Iowa Interstate Railroad). Amtrak passenger service is available in Galesburg, 45 miles to the south via I-74. Barge traffic on the Mississippi River gives the area links to Mississippi tributaries, the Gulf of Mexico, the Great Lakes, and foreign ports. River transportation is available roughly ten months a year, at more than 50 public and private facilities in the area (with 26 having rail connections). UTILITIES: The Quad City area is served by MidAmerican Energy, who provides natural gas and electricity, and owns a fossil fuel plant in Louisa County, Iowa (near Muscatine). Exelon operates a nuclear powered generating station in Cordova, Illinois (to the north edge of the MSA). Iowa American Water Company (a private corporation) provides water for Davenport and Bettendorf, Iowa, via a franchise. Moline and Rock Island, Illinois, have municipal water services. Seven metropolitan municipalities draw a domestic water supply from the Mississippi River. Other cities and rural populations tap groundwater sources for domestic use. Waste water treatment facilities serving the larger metropolitan communities are secondary treatment facilities and lagoon systems. They provide adequate water quality protection for existing population and industries, and are not currently having any trouble meeting the established discharge standards. A regional solid waste plan serving a seven-county area, including Henry and Rock Island Counties in Illinois, and Cedar, Clinton, Jackson, Muscatine, and Scott Counties in Iowa, was completed in Implementation of State goals continues to fall upon local governments. The total cost of waste disposal (in 1990) was $42 per household, but significant increases have occurred due to the modernization of various methods of waste collection, including curbside and drop-off collection. Page 19
20 REGIONAL AND CITY DATA Average Annual Labor Force and Employment March Change LABOR FORCE DATA count percent Civ. Labor Force 210, , , , , , , , , ,298-18, % Employment 200, , , , , , , , , ,908-21, % Unemployment 10,062 12,502 19,299 15,973 15,693 13,890 13,598 11,869 11,106 12,390 2, % Percentage 4.80% 6.10% 9.20% 7.80% 7.80% 7.10% 6.80% 5.99% 5.86% 6.48% -1.68% 34.93% Goods Producing 34,300 34,200 34,200 30,900 32,300 30,300 34,400 32,200 33,000 32,300-2, % Construction and Mining 8,200 8,600 8,800 8,000 8,700 7,200 9,600 8,100 8,600 9, % Manufacturing 26,100 25,600 25,400 22,900 23,600 23,100 24,800 24,100 24,400 23,200-2, % Service-Providing 128, , , , , , , , , ,200-7, % Wholesale Trade 10,000 10,000 9,700 9,000 9,100 9,100 10,300 10,000 9,100 8,100-1, % Retail Trade 24,100 24,100 23,400 22,600 21,700 21,800 22,300 23,000 22,600 21,500-2, % Trans., Warehousing, and Utilities 6,700 6,700 6,800 6,500 6,500 7,000 7,100 7,600 7,600 7, % Information 3,000 3,100 3,100 2,700 2,600 2,500 2,400 2,500 2,300 2, % Financial Activities 8,900 8,300 8,400 8,300 8,300 8,100 8,100 8,000 7,900 7,300-1, % Professional and Business Services 26,000 26,000 23,000 21,300 20,700 21,300 23,500 22,500 20,800 23,600-2, % Educational and Health Services 23,800 24,300 25,300 25,600 25,900 26,000 26,100 26,200 25,600 27,000 3, % Leisure and Hospitality 18,500 18,400 18,200 17,700 17,300 16,400 18,700 17,800 17,900 16,900-1, % Other Services 7,500 7,800 7,100 7,300 7,400 7,400 7,500 7,300 7,300 7, % Government 26,900 27,300 27,600 28,400 27,700 27,100 26,200 25,200 25,500 26, % Illinois Dept. of Employment Security: Workforce Information Update March Quad City MSA 4.2% 5.1% 8.3% 8.2% 7.4% 6.9% 7.0% 6.1% 5.6% 6.5% RI County, IL 5.3% 6.7% 10.4% 10.3% 9.5% 8.7% 8.8% 6.9% 6.3% 7.4% Scott County, IA 3.7% 4.3% 7.1% 6.7% 6.2% 5.8% 5.6% 5.2% 4.6% 5.2% 12.0% Quad Cities Unemployment 10.0% 8.0% 6.0% 4.0% vuad City asa wl County, LL Scott County, LA 2.0% 0.0% Sources: Illinois Department of Employment Security, Iowa Workforce Development, Bureau of Labor Statictics Page 20
21 REGIONAL AND CITY DATA EMPLOYMENT: The work force in the Metropolitan Statistical Area was 189,668 in 2015, down substantially from The 2007 to March 2016 annual labor force and employment survey (compiled by the Illinois Department of Employment Security) is on the previous page. The labor force peaked in 2006 and began a decline in response to national recessionary influences. A decline in the late 1900s reversed in 2004, with an increase in the labor force in 2005 and 2006, and then decreasing again in response to the 2008 economic downturn. The unemployment rate was at a low of 3.3% in The most current rate was 6.5 in March 2016, well-below the high of 10.2% in March 2010, and only slightly higher than the lowest reported in recent years. It is noted that Iowa communities fare substantially better than Illinois communities. The employment growth in the past ten years has occurred in the Construction and Mining, Transportation/Warehousing/Utilities, and Educational and Health Services. This pattern of growth parallels national trends, as the national economy becomes more service-oriented, and retail growth accelerates as the area recovers from the recession. Locally the largest service sector growth has been in the call center business. APAC operates a large center in the River Cities Industrial Center (former Caterpillar Plant) in Davenport, and in 2008, Cingular (AT&T) opened a 500-person call center in northeast Davenport. The areas strong manufacturing base still provides a substantial employment base. Manufacturing output has increased over the past decade due to increases in the level of productivity, but resulting in few employment gains. Notably, the overall Goods Producing employment shrank by 3,400 jobs from 2007 to It rebounded in 2011 and has remained somewhat stable through March On the following page is a historical list of major employers in the Quad City area. Deere and Company, headquartered in Moline, has traditionally been the Quad Cities largest private employer and is also one of the largest employers in the State of Iowa. It operates several manufacturing facilities in the Quad City area and is also home to the majority of Deere and Company s sales and support operations. The Rock Island Arsenal had historically been the area s second largest employer, but, in 2007, it became the largest employer in the area, passing the number employed by Deere and Company. A variety of products are made or purchased through operations based on The Island. The reduction in military spending at the end of the Cold War, resulted in employment declines. These were reversed during the 2004 invasion of Iraq. More recently, a base realignment resulted in an increase in overall employment and the relocation of 800 military personnel, including eight generals, 15 full colonels and two dozen high-ranking enlisted soldiers. Page 21
22 REGIONAL AND CITY DATA MAJOR QUAD CITY EMPLOYERS Name City Line of Business Employees Rock Island Arsenal Rock Island Defense Manufacturing 8500 Deere & Company Moline Agriculture OEM 7300 Genesis Health System Davenport Health Care System 4900 HNI Corporation/ The Hon Company, Allsteel Muscatine Office Furniture Manufacturing 3200 Trinity Regional Health System Rock Island Health Care System 2900 Davenport School District Davenport Local School District 2500 Tyson Fresh Meats Hillsdale Food Processing 2400 Alcoa, Inc. Riverdale Aerospace & Defense Aluminum 2250 Hy-Vee Food Stores Regional Supermarket and Other Grocery 2022 Kraft Foods/Oscar Mayer Davenport Food Processing 1500 XPAC Milan Supply Chain Management & Logistics Moline School District No. 40 Moline Local School District 1157 Wal-Mart Super Centers region wide Warehouse Clubs and Supercenters 1066 Isle of Capri Bettendorf Casino, Hotel, Entertainment 1050 Muscatine Community College District Muscatine Junior College 1050 MidAmerican Energy Co. Davenport Utility/ Energy Delivery 1025 Eastern Iowa Community College District Davenport Junior College 1016 Muscatine Foods Grain Processing/Kent Feeds APAC Customer Service, Inc Muscatine Animal Food Manufacturing 1011 Davenport Telecommunications/Customer Service 900 Page 22
23 REGIONAL AND CITY DATA Quad City Area Regional Sales Illinois Quad Cities - State Sales Tax Collected Iowa Quad Cities - Retail Sales Reported Rock Island County Moline East Moline Rock Island Scott County Davenport Bettendorf 2006 $3,616,100 % change $39,240,289 % change $6,819,580 % change $10,124,885 % change 2006 $2,283,300,161 % change $1,827,486,927 % change $314,900,079 % change 2007 $2,906, % $39,720, % $7,050, % $10,570, % 2007 $2,317,619, % $1,849,753, % $320,652, % 2008 $2,568, % $39,245, % $7,079, % $10,729, % 2008 $2,349,373, % $1,871,246, % $317,732, % 2009 $2,462, % $37,896, % $6,967, % $10,222, % 2009 $2,397,888, % $1,941,569, % $302,464, % 2010 $2,124, % $38,468, % $7,302, % $10,606, % 2010 $2,290,880, % $1,869,097, % $281,200, % 2011 $1,846, % $38,765, % $7,533, % $10,547, % 2011 $2,379,338, % $1,929,768, % $296,041, % 2012 $3,389, % $40,072, % $7,624, % $10,991, % 2012 $2,465,349, % $1,981,388, % $315,660, % 2013 $2,001, % $40,693, % $7,681, % $10,477, % 2013 $2,484,179, % $1,980,795, % $339,919, % 2014 $3,267, % $41,125, % $7,706, % $10,425, % 2014 $2,538,092, % $2,024,019, % $336,697, % 2015 $2,394, % $43,357, % $7,921, % $11,288, % 2015 $2,604,865, % $2,066,180, % $354,235, % $50,000,000 $3,000,000,000 $45,000,000 $40,000,000 $2,500,000,000 $35,000,000 $30,000,000 $25,000,000 $20,000,000 $15,000,000 $10,000,000 Rock Island County Moline East Moline Rock Island $2,000,000,000 $1,500,000,000 $1,000,000,000 $500,000,000 Scott County Davenport Bettendorf $5,000,000 $ $ Page 23
24 REGIONAL AND CITY DATA RETAIL SALES: The data above from Iowa is actual retail sales reported and from Illinois is retail sales tax collected, not the same date, so no market share comparisons can be make. However, percent from year to year are a good indication of the area s retail growth. Iowa: Retail sales have increased steadily since 2001 until 2008 in Bettendorf and 2010 for Davenport and the whole of Scott County. The increase in 2011 did not return sales to the 2009 levels, but the 2012 sales exceed the 2009 levels. Retail sales in Bettendorf have been erratic due to the openings and closings of larger retailers, most notably the Duck Creek Mall (see below). Davenport reported steady increases, with a 4.46% decline in 2010, and steady increase since. NorthPark Mall, in north-central Davenport, contains more than one million square feet of gross building area. This is one of the largest malls in Iowa, and had historically been the retail magnet in the Iowa Quad Cities, prior to the East 53 rd Street/Elmore Avenue development. The mall was somewhat reenergized when Dillards Department Store opened in the former Montgomery Ward space in Most of the new retail development is in the Elmore Avenue and East 53 rd Street corridors, in northeast Davenport. More than two million square feet of space has been constructed since 1995, with more space being developed. The most recent development includes 100,000+ sq.ft. of destination retail, along with limited service motel on Elmore Avenue, south of East 46 th Street. Additionally, the Duck Creek Mall, at Middle and Kimberly Roads, Bettendorf, was razed and replaced by a big box development, anchored by a Home Depot store (December 2003) and a Schnucks grocery store (July 2005), with Walgreens and McDonald s on outlots. The former Target/Shopko/Joevan stores south of the Duck Creek Mall were redeveloped into a lifestyle center, contributing to increases in retail activity of over 5% from 2011 through Burlington Coat Factory was the lead tenant, with smaller retail tenants and a regional university in outlot buildings, as well as a free-standing Pizza Ranch restaurant. The most recent addition is a new Hilton Garden Inn, Starbucks drive-thru, and retail strip center. The most recent new development in Davenport is a seven-story, 143-room hotel and casino in the southwest quadrant of Interstates #74 and #80, off of Elmore Avenue. Once complete, this will also include a 1,500 seat event center, restaurants, meeting rooms, and a spa. A future phase of this project will include a 200-room resort hotel, 250,000 sq.ft. shopping center, and 100,000 sq.ft. of office space. An automobile dealership is separately being developed near this site. Page 24
25 REGIONAL AND CITY DATA RETAIL SALES (CONTINUED): Illinois: Retail sales increased steadily in Rock Island County from 2000, before experiencing double digit declines beginning mid-decade (see prior page). Sales taxes collected increased 83.54% in 2012 and 63.30% in 2014 for the county, not within municipalities. After declines in 2009, Moline and East Moline sales taxes collected have increased steadily through Rock Island retail sales taxes have been more volatile but still show growth. SouthPark Mall, in southern Moline, also contains roughly one million square feet of retail space. Dillards opened in the former Montgomery Ward space at SouthPark in Fall This has historically been the larger shopping draw in the Illinois Quad Cities, but has been experiencing substantial line store vacancy. Southpark Mall recently lost Sears as one of the anchors and has demolished space to reduce the retail area added in the late 1980s. Dick s Sporting Goods constructed a store in The Super Wal-Mart store and a Lowe s store, at the intersection of John Deere Road and 38 th Street, in Moline, moved the focus away from SouthPark toward John Deere Road big box retailers. Other retailers opening along John Deere Road include a Farm and Fleet, Target, and Kohl s. Several small in-fill developments followed the big box openings. In 2009, another Wal-Mart SuperCenter was completed in Silvis, at the far-east end of the corridor. The John Deere Road corridor continued to grow, with Hiland Toyota as the lead tenant in a development in the southeast quadrant of John Deere Road and 53 rd Street. A multi-tenant development anchored by a Menards and two car dealerships, between 60 th and 70 th Streets, on the south side of John Deere Road, completed construction in Sam s Club opened in this development in Page 25
26 REGIONAL AND CITY DATA Quad City Area Housing Starts Single Family Units Multi-Family Units Overall Housing Units Year Scott Co. RI County Total Year Scott Co. RI County Total Year Scott Co. RI County Total , , Q Q Q Single Camily Units aulti-camily Units Overall Iousing Units , , Scott Co. RI County Total Scott Co. RI County Total Scott Co. RI County Total Single-Family Real Estate Activity Iowa Illinois QC Total # of Average Percent # of Average Percent # of Average Percent Year Units Price Change Year Units Price Change Year Units Price Change ,424 $ 159, ,167 $ 114, ,591 $ 138, ,332 $ 164, % ,084 $ 115, % ,416 $ 141, % ,084 $ 164, % ,834 $ 110, % ,918 $ 138, % ,061 $ 159, % ,735 $ 113, % ,796 $ 138, % ,970 $ 165, % ,588 $ 111, % ,558 $ 141, % ,915 $ 162, % ,578 $ 107, % ,493 $ 137, % ,173 $ 177, % ,811 $ 110, % ,984 $ 147, % ,344 $ 179, % $ 107, % ,274 $ 146, % ,233 $ 186, % ,932 $ 110, % ,165 $ 151, % ,276 $ 192, % ,145 $ 119, % ,421 $ 156, % vuad Cities Iousing Sales vuad City Iousing trices 5,000 $ 250,000 4,500 4,000 $ 200,000 3,500 3,000 $ 150,000 2,500 2,000 $ 100,000 1,500 1,000 $ 50, $ Lowa Lllinois vc Total Lowa Lllinois vc Total Sources: U.S. Census Bureau, US Department of Housing and Urban Development, Ruhl & Ruhl Realtors Inc., Quad City Area REALTORS Association Page 26
27 REGIONAL AND CITY DATA NEW RESIDENTIAL CONSTRUCTION: New residential construction starts are often a good barometer of the health of an economy. On the previous page is a summary of new construction in Scott County (Iowa) and Rock Island County (Illinois), for the past decade. Residential development declined sharply in 2008/2009, in response to the economic decline. Scott County did not experience as steep a decline as Rock Island County, but Rock Island County has been seen sharper fluctuations. Overall, growth has slowed on both sides of the river. New construction for First Quarter 2016 in Scott County was 70 single family and 48 multi-family units. This is up considerably from 2015, in which there were 42 single family and eight multifamily units started. Rock Island County experienced a slight up tic, from two single family housing starts to three. There have been no multi-family housing starts in Rock Island County, in either year. An abundance of developed lots are available in various price ranges on both sides of the river. The greatest construction activity is in the $150,000 to $250,000 price range. Weakness continues in new homes priced more than $250,000, but inventories of new homes have decreased as local home builders slow almost all speculative construction. The Quad Cities metropolitan area is one of the most affordable housing markets in the country. In Illinois, the average single-family home sold for $119,100 in 2015, catching up with the high of $115,600 in In Iowa, where there has been more new construction, the average single-family home sells for $192,000. Sales volume, measured in the number of sales, increased modestly in the early 2000s, before a decline in 2005, which reversed in OFFICE MARKET: As suggested by the employment figures, there is little to no unmet demand for office space in the market. The steady upward trend in the financial services and professional and business service sectors has ended. This is a flat regional economy, with a lack of new workers available to fill positions. The lack of job market growth has severely limited the demand for office space. Recent surveys suggest that the overall Class A office market is, at best, at equilibrium and may be oversupplied. There is easily enough space currently in place, with nothing under construction to meet the Class A office needs, for the next 24 to 36 months. Market rents increased modestly in Class A buildings, in the late 1990s, but significant increases have been noted in the past three years. There has been no notable increase in Class B or C office rents. Downtown vacancy has been decreasing due to the conversion of office space to residential uses. The vacancy overall is above 15% for Iowa Class A office space and over 12.5% for overall Class B space. New office space is being developed on a built-to-suit basis, much of which is driven by the current low interest rates. There is very little speculative development underway. The East 53 rd Street and Interstate #74 area of northeast Davenport has lead the regional market in office construction. This has especially been true with the new hospital being proximate. Page 27
28 REGIONAL AND CITY DATA OFFICE MARKET (CONTINUED): There are two office buildings recently completed in northeast Davenport. One is the BITCO Insurance corporate headquarters along Market Square Circle, west of Utica Ridge Road. It was built-to-suit for BITCO, who leases it from the developer. Construction is nearly complete. The other building is a multi-tenant development one block east of that. The developer is First Equity, who will occupy a portion. The majority is built-to-suit for Molyneaux Insurance. A third suite will be occupied by a dental practice. The Kone building along the Moline riverfront is the other notable office building constructed in the past decade. This is a nine-story building constructed specifically for Kone, the lead tenant. There is considerable space available for lease and residential condominiums on the upper floors. Any additions to the Class A supply continue to exert downward pressures on Class B rents, as well as older Class A buildings, resulting in reductions in rents or occupancy. It appears that the number of properties listed for sale has been steady over the past three years, with flat to decreasing sale prices. A significant number of properties for sale are not formally listed with the local brokerage community. Most of these properties sold were smaller, suburban buildings. ECONOMIC GROWTH OF THE AREA: The Quad City area had historically been a growing region, less affected by national trends and recessions than larger cities. The 1980s cutbacks in manufacturing employment resulted in a prolonged local recession lasting well into the 1990s when the area recovered significantly. The area shifted from a predominantly manufacturing-based workforce toward a balance between the mainstay manufacturing jobs and the service/information sector. As a result, the Quad City market has become more in-step with national economic trends. The fundamental regional problem is the lack of population growth. Without new employees available to add to the employment base, job growth will continue to be stagnant. This will result in sideways movement in retail sales, office and apartment occupancy, and housing starts. The real estate growth that has occurred in the office market has been at the expense of existing properties, with softening demand and increased vacancy occurring in the office market. The retail growth has been segmented, with targeted retail development proving successful, while older neighborhood developments languish. The low wage rates, high education level of the workforce, and strong transportation links should keep the area competitive with other Midwestern cities in attracting economic opportunities. Even through the recent recession, the region maintained a relatively stable level of employment. This suggests that continued employment growth is anticipated in the future, as the national downturn reverses. However, whatever growth occurs will be at a slower pace than in the 1990s. The area is currently economically stable, relative to the trends in the nation as a whole. While the regional downturn was not as deep as the national trends, the positive economic upward movement was not as strong. Overall, the long-term economic outlook for the area is generally good, but with growth rates expected to be below the national average and somewhat below those in larger Midwestern communities. Page 28

29 NEIGHBORHOOD MAP Page 29
30 NEIGHBORHOOD DATA GENERAL CHARACTERISTICS: The subject is along the north side of an Avenue of the Cities frontage road, west of 7 th Street, in East Moline, IL. The neighborhood boundaries are roughly 30 th Avenue to the north, Archer Drive to the east, 34 th Avenue to the south, and Kennedy Drive to the west. The neighborhood contains a mixture of retail, office, and residential uses along the arteries, surrounded by residential subdivisions. TRANSPORTATION LINKAGES: Avenue of the Cities is an asphalt paved, two-way, four-lane street (with grass median). This is the primary east-west artery in the neighborhood, extending west from Silvis, IL, to 16 th Street, in Moline, IL. It contains a large amount of retail and office uses, with some residential uses near the subject. The frontage road is an asphalt paved, two-way, two-lane street that serves the uses along the north side of Avenue of the Cities. Kennedy Drive and 7 th Street are the nearest north-south arteries in the neighborhood. They extend south from 15 th Avenue to 34 th Avenue, where they become 60 th and 70 th Streets, respectively, as they enter south Moline, connecting with the John Deere Expressway. Access to Interstate #74 is about three miles east of the subject, at its intersection with Avenue of the Cities. Interstate #280 is roughly two miles south of that interchange. The John Deere Expressway (State Highway #5) is 1½ miles to the south. NEIGHBORING PROPERTIES: The larger developments in the neighborhood include Kennedy Square Shopping Center, two blocks west, and Ridgeview Shopping Center, one block east, as well as United Township High School. Kennedy Square is anchored by Jewel-Osco and Ridgeview is anchored by Save-A-Lot grocery store. Both have convenience stores on outlots. Illini Hospital is just east of the neighborhood, Deere & Company World Headquarters is southeast, and Black Hawk College is south. Immediately north of the subject is a residential subdivision. To the east, along the north side of Avenue of the Cities, is a multi-tenant retail building with Hertz Rent-A-Car and a driving school, Yen Ching Express and Checker s restaurants, Ridgewood Tower Apartments, and Ridgeview Shopping Center. South of the subject, along the south side of Avenue of the Cities, is a residential subdivision, a daycare, Wells Elementary School, Aramark Uniform Services, and a car wash. To the west, along the north side of Avenue of the Cities, is Yash Technologies, Allstate Insurance, a dental clinic, chiropractor, florist, Union Federal Savings & Loan, and First Midwest Bank. Page 30
31 NEIGHBORHOOD DATA CONCLUSION: The subject is in a mixed area that has a limited amount of new construction in the recent past. One block west of the subject is a recently completed residential townhome development. This represents the only new construction along this stretch of Avenue of the Cities. The property benefits from the visibility along Avenue of the Cities. Offsetting this is the circuitous access and lack of a significant medical center in the immediate proximity. There appear to be no detrimental influences present in the neighborhood and the long term outlook is continued stability. Relative to the regional market, this is considered to be an average location. Page 31
32 PLAT MAP Page 32
33 SITE ANALYSIS GENERAL: The site is an irregular, corner parcel with an estimated land area of 127,630± sq.ft. It has 190± feet of frontage along the north side of the frontage road and 175± feet of frontage along 4 th Street A (which is a shared drive). A copy of the plat map is on the previous page. TOPOGRAPHY: The site is at grade with the frontage road and is level. Drainage appears to be adequate and the subject is in an unshaded Zone X, which is outside the 100 and 500 year flood hazard areas (a copy of the flood map is in the Addenda). There is no on-site detention area. ZONING: The subject is zoned B-2 (Local Business District) by the City of East Moline. This zoning classification permits a variety of uses, including banks, retail stores, restaurants, offices, etc. Based on the current zoning requirements, it appears the improvements are a legal, conforming use. ACCESS: There is no access to the subject from Avenue of the Cities. Direct access is available from a shared drive (4 th Street A) off of the frontage road and from a driveway along the east property line. This is adequate for most potential uses. UTILITIES: The subject is in the city limits with all public utilities available. These include electricity, water, sewer, and natural gas. EASEMENTS: Other than typical utility easements, no detrimental easements or encroachments are known to exist. Page 33
34 DESCRIPTION OF IMPROVEMENTS GENERAL: The site is improved with a 23,484± sq.ft., one-story, multi-tenant office building constructed in It has a poured concrete foundation and brick veneer and EIFS exterior walls on wood framing. The roof consists of standing seam metal panels around the perimeter with a rubber membrane over the flat, center portion. The windows are insulated glass in aluminum frames. There are also aluminum gutters and downspouts. LAYOUT: There are five suites in the building with a total rentable area of 21,451 sq.ft. A breakdown of each suite is below. Suite Tenant Sq.Ft. 100 Vacant 5, Vacant 3, Orion Health 4, Vacant 4, Vet Center 3,067 Total 21,451 There is a common entrance in the center of the west wall. Access to each suite is available from a common hallway. Suite 100 has a separate entrance in the south wall, and Suite 140 has a separate entrance near the northwest corner. Men s and women s restrooms are in the common hallway. Suites each contain reception areas and waiting rooms inside the entrances. The remainder of these suites consists of private exam rooms and offices, as well as laboratories, x-ray rooms, break rooms, storage rooms, and unisex restrooms. Suite 130 also contains a 300 sq.ft. open room that was formerly part of Suite 140. Suite 140 consists of a lobby, several private offices, a conference room, break room, and two 2-fixture restrooms. INTERIOR FINISHES: The common areas contain ceramic tile and carpet flooring, drywall walls, and suspended acoustic tile ceilings with fluorescent lighting. Each suite contains carpet and vinyl flooring, drywall and wallpaper walls, and suspended acoustic tile ceilings with fluorescent and can lighting. The restrooms have vinyl and ceramic tile flooring, drywall and ceramic tile walls, and suspended acoustic tile ceilings. MECHANICALS: Each unit is heated and cooled by roof-mounted HVAC package units. In addition, each unit has a separate electrical panel and water heater. The building is not sprinklered. Page 34
35 DESCRIPTION OF IMPROVEMENTS SITE IMPROVEMENTS: The site contains 65,000± sq.ft. of concrete paving surrounding the building with a total of 129 striped parking stalls (five are handicap reserved). Two light poles are west of the building, a 26 x 26 canopy is over the main entrance in the west wall, and lighting is attached to the building. There are also three monument signs. CONCLUSION: The building is in good overall condition. The tenant (at their expense) recently completed a remodel of Suite 140 at an estimated cost of $595,000. It is now the only suite that is not medical space. The remaining suites appear to have the original finishes, which are mostly in good condition. The carpet in the vacant suites is showing signs of wear. The land to building ratio of is 5.43:1, which provides adequate parking and easy movement over the site. The chronological age of the building is 17 years. Due to updates over time, a lower effective age of 15 years is estimated. Thus, the remaining economic life is estimated to be 30+ years. Page 35
36 MARKET OVERVIEW Current Competitive Listings Days On MLS # Address City Status Market Price Total SQFT Price/SQFT ND Moline ACTIVE 212 $699,000 12,060 $ KENNEDY East Moline ACTIVE 365 $1,489,000 14,944 $ JOHN DEERE Moline ACTIVE 196 $2,200,000 25,368 $ AAA Bettendorf ACTIVE 821 $2,890,000 37,714 $76.63 Averages: 399 $1,819,500 22,522 $80.24 Sales in Past 2 Years Days On MLS # Address City Status Market Price Total SQFT Price/SQFT W 76TH Davenport SOLD 149 $780,000 12,000 $ W 76TH Davenport SOLD 81 $805,000 15,000 $ E 56TH Davenport SOLD 88 $1,015,000 11,930 $ RIVER Moline SOLD 0 $1,100,000 17,580 $ TH Moline SOLD 11 $1,460,000 19,870 $73.48 Averages: 66 $1,032,000 15,276 $67.96 COMPETITION: There are currently four active office listings offered in the MLS in the metro Quad Cities between 10,000 and 50,000 sq.ft. They are shown in the table above and are considered to be the most comparable to the subject (although not ideal). The listings have an average size of 22,522 sq.ft. and an average asking price just under $1,820,000. The average asking price/sq.ft. is $80.24 and the average number of days on market is 399 days. There have been five sales within the past two years, again between 10,000 sq.ft. and 50,000 sq.ft. These have a smaller average size at 15,276 sq.ft., with an average overall price of $1,032,000. The average price/sq.ft. decreases to $ The number of days on the market is lower at 66 days. BROKER INTERVIEWS: In recent interviews, brokers report there is currently stable to increasing demand for office properties, especially relative to smaller spaces. In addition, sales and leasing activity have been increasing over the past two years, while vacancy rates and rent concessions are on the decline. Brokers also report that office absorption rates are up throughout the Quad Cities. Current vacancy ranges from less than 5% in newer or bank-anchored buildings in the suburban areas, to in excess of 25% in less visible or older buildings, particularly in downtown markets. CONCLUSIONS: Based on the market activity over the past two years, and the broker interviews, there appears to be stable to modestly improving demand for office properties similar to the subject. Page 36
37 HIGHEST AND BEST USE ANALYSIS DEFINITION: Highest and Best Use is defined in The Dictionary of Real Estate Appraisal, published by the Appraisal Institute (6 th Edition, 2015, p. 109) as, the reasonably probable use of property that results in the highest value. The four criteria that the highest and best use must meet are legal permissibility, physical possibility, financial feasibility, and maximum productivity. Therefore, when estimating the Highest and Best Use of a property, four basic questions must be addressed: is the use physically possible, is it legal, is it financially feasible, and is it maximally productive? The analysis must include consideration of the Highest and Best Use as if vacant and as improved. PHYSICAL ANALYSIS: The size, shape, and topography of the site would support any number of uses. It is along Avenue of the Cities, with proximate connections to the local highway system, and all public utilities are available. The circuitous access from the traffic artery would not appeal to a retail user. This suggests an office use of the site would be physically possible. The building is in good condition. The unit layouts are typical of a modern office building. There is adequate parking and circulation over the site. Several other uses are physically possible with renovations. LEGAL ANALYSIS: As mentioned, the subject is zoned B-2 by the City of East Moline. This zoning classification permits a variety of uses, including banks, retail stores, restaurants, offices, etc. Based on the current zoning requirements, it appears the improvements are a legal, conforming use. FINANCIAL FEASIBILITY: Demand for office sites in East Moline has been very limited in recent years. The neighborhood has not seen any commercial developments for several years. The frontage along an artery would be attractive to most users. The circuitous access would preclude a retail use. Thus, the site would be attractive to general office developers. There is demand for multi-tenant office properties for sale, with buildings of varying sizes and quality having sold within the past five years. The building is in good condition, with a remaining economic life estimate of 30+ years. It clearly contributes to the overall value of the property. This location lacks a significant medical user, which results in limited demand for medical space. However, the high costs of converting the vacant units to general office space would not be financially feasible. Notwithstanding the history of high vacancy, a continued multi-tenant office use appears to be feasible. Page 37
38 HIGHEST AND BEST USE ANALYSIS MAXIMALLY PRODUCTIVE: There are good transportation linkages and exposure to traffic. However, access from Avenue of the Cities is quite circuitous. Therefore, the maximally productive use of the subject site, as if vacant, is for general office development. Because of their design and condition, a multi-tenant use is most likely for the building. It is obvious by the photographs and observation of the structure that the existing improvements have significant remaining economic and useful life. As such, the current improvements add substantial value to the land and represent the maximally productive use, as improved. ANALYSIS AS IF VACANT: The strengths of the site include its visibility from a primary artery, with good transportation amenities. The weaknesses include the irregular shape and lack of direct access from Avenue of the Cities. The lack of any significant medical user is a detrimental factor. The most likely buyer would be an investor to develop a multi-tenant property. A secondary buyer would be an owner-user. Based on the preceding analysis, it is my opinion that the Highest and Best Use of the site, as if vacant, is for general office development. ANALYSIS AS IMPROVED: The strengths of the building include its age, condition, and functional utility. Weaknesses could include the history of low occupancy. The most likely buyer would be an investor who would continue leasing to tenants or an owner-user who would occupy a portion. It is my opinion that the existing multi-tenant office use is the Highest and Best Use, as improved. Page 38
39 COST APPROACH TO VALUE METHODOLOGY: The Cost Approach to Value presumes that no prudent buyer will pay more for the subject than an amount necessary to secure equally desirable land and build a new substitute facility. Generally, one will pay somewhat less than cost new depending upon the estimated accrued depreciation as of the date of the inspection. Depreciation is defined as the dollars of cost new in the subject improvements that are not dollars of contributory value to the subject land in that land s Highest and Best Use, as if vacant. As noted in the Scope of Work, the Cost Approach involves estimating the reproduction cost new of the improvements and estimating accrued depreciation and obsolescence in the building. This would require several subjective estimates, rendering the reliability of this approach very limited. Thus, although considered, the Cost Approach has not been developed. Page 39
40 SALES COMPARISON APPROACH TO VALUE METHODOLOGY: The Sales Comparison Approach to Value presumes that no prudent buyer would pay more for the subject than an amount necessary to acquire an equal substitute, assuming no undue delay. Thus, sales of similar properties are pertinent in the valuation process. IMPROVED COMPARABLES: Comp Address City Date Price GBA Price Per SF Subject 465 Avenue of the Cities East Moline Listing $1,650,000 23,484 $ th Avenue Moline 9/30/2015 $1,460,000 19,870 $ Avenue of the Cities East Moline 12/5/2014 $450,000 5,240 $ East 56th Street Davenport 7/31/2014 $1,015,000 12,000 $ Kimberly Road Suite A-1 Davenport 7/17/2014 $710,500 10,450 $ Brady Street Davenport 8/31/2012 $745,000 10,956 $ John Deere Parkway Moline Listing $2,200,000 25,368 $86.72 Six comparables are summarized in the above grid. They range in size from 5,240 to 25,368 sq.ft., with overall prices ranging from $450,000 to $2,200,000. Detailed summaries of the comparables are on the following pages. The unit of comparison chosen is the price per sq.ft. of building area. This is easy to extract from the data and is a common unit of comparison used by buyers and sellers. The comparables range in unadjusted prices/sq.ft. from $67.99 to $ All of the sales were reportedly cash, or conventionally financed transactions, and adjustments for cash equivalency were unnecessary. Comparables #1, #3, and #5 were sales of Leased Fee Interests. However, they had higher occupancy levels than the subject, requiring downward adjustments. Comparables #2, #4, and #6 were sales of Fee Simple Interests and were to be owner-occupied. Thus, they did not require adjustments. Comparable #2 required an upward adjustment for being a sale out of foreclosure. There are indications that economic conditions have recovered from the depth of the market slowdown. Therefore, a 1% adjustment per year has been made for market conditions. Comparable #6 received a downward adjustment for being an active listing. Page 40
41 SALES COMPARISON APPROACH TO VALUE ADJUSTMENTS: Location: Location strongly affects the desirability, and general value levels in each area. The major benefit provided by location would be exposure to traffic along primary roadways and access to the local highway system. Additional consideration is given to synergistic neighborhood influences. The subject has visibility along an artery. However, this is not an ideal location for a medical property due to the lack of a synergy with similar uses. Comparables #1, #3, #4, #5, and #6 are superior locations and required downward adjustments. Comparable #2 is immediately west of the subject and ideally similar in location. Building Size: Any adjustments relative to size are based on the premise that typically, with all other factors being equal, smaller structures tend to sell for higher unit prices than do larger structures and would require downward adjustments. The size adjustments have been made estimating a 1% change in price/sq.ft. for every 2,000 sq.ft. variance in building size, with the larger buildings requiring upward adjustments and the smaller buildings requiring downward adjustments. Condition: Adjustments for condition can be quite subjective and are based on the reported condition of the property at the time of sale. Comparable #6 received a downward adjustment for its superior condition, while #4 and #5 received upward adjustments for their inferior conditions. Age: There is a good relationship between age and the price/sq.ft. for office buildings. Without major renovations, these types of properties lose value as they age. This is accounted for by rounded adjustments estimated by the appraiser, with Comparable #6 warranting a downward adjustment for being newer and #1, #3, #4, and #5 warranting upward adjustments for being older. Land to Building: The land to building ratio adjustment is mathematically based on the ratios of land area to building area. The adjustment is estimated using the variance between the subject s 5.43:1 land to building ratio relative to the comparables. A 1% adjustment was made for every one point variance. Comparable #2 required a downward adjustment for its higher ratio. Comparables #1 and #6 required upward adjustments for their lower ratios. Comparable #4 is a condominium unit that shares access and parking with the larger development. Therefore, it did not require adjustment. Construction Quality: As a medical property, the subject has above average quality construction materials and interior build-out. Comparables #1, #2, and #5 have inferior quality of materials and received upward adjustments. Comparable #4 is also a medical property. However, it received a downward adjustment since it contains a full basement. Comparable #6 is not a medical property but has a similar quality of interior finishes as the subject. Page 41
42 SALES COMPARISON APPROACH TO VALUE Analysis Grid Comp 1 Comp 2 Comp 3 Comp 4 Comp 5 Comp 6 Address 465 Avenue of the Cities th Avenue 455 Avenue of the Cities 4453 East 56th Street 2322 Kimberly Road Suite A Brady Street 7017 John Deere Parkway City State Date Price GBA GBA Unit Price East Moline IL Listing $1,650,000 23,484 $70.26 Moline IL 9/30/2015 $1,460,000 19,870 $73.48 East Moline IL 12/5/2014 $450,000 5,240 $85.88 Davenport IA 7/31/2014 $1,015,000 12,000 $84.58 Davenport IA 7/17/2014 $710,500 10,450 $67.99 Davenport IA 8/31/2012 $745,000 10,956 $68.00 Moline IL Listing $2,200,000 25,368 $86.72 Transaction Adjustments Property Rights Leased Fee Leased Fee -10.0% Fee Simple 0.0% Leased Fee -10.0% Fee Simple 0.0% Leased Fee -10.0% Fee Simple 0.0% Financing Cash Cash 0.0% Cash 0.0% Cash 0.0% Cash 0.0% Cash 0.0% Cash 0.0% Conditions of Sale Arm's Length Arm's Length 0.0% REO 5.0% Arm's Length 0.0% Arm's Length 0.0% Arm's Length 0.0% Arm's Length 0.0% Adjusted GBA Unit Price $66.13 $90.17 $76.13 $67.99 $61.20 $86.72 Market T rends T hrough 7/21/ % 0.8% 1.6% 2.0% 2.0% 3.9% -10.0% Adjusted GBA Unit Price $66.66 $91.64 $77.64 $69.37 $63.61 $78.05 Location % Adjustment $ Adjustment Average Average+ -5.0% -$3.33 Average 0.0% $0.00 Good -10.0% -$7.76 Average+ -5.0% -$3.47 Average+ -5.0% -$3.18 Good -10.0% -$7.81 GBA % Adjustment $ Adjustment 23,484 19,870 5,240 12, % -9.0% -5.5% -$1.33 -$8.25 -$ , % -$ , % -$ , % $0.78 Condition % Adjustment $ Adjustment Good Good 0.0% $0.00 Good 0.0% $0.00 Good 0.0% $0.00 Average 10.0% $6.94 Average 10.0% $6.36 Good+ -5.0% -$3.90 Year Built % Adjustment $ Adjustment / % $ % $ % 4.0% $0.78 $ / % $ % -$0.78 Land to Building Ratio % Adjustment $ Adjustment 5.43 to % $ % -$ % $ % $ % $ % $0.78 Quality % Adjustment $ Adjustment Average+ Average 5.0% $3.33 Average 5.0% $4.58 Average+ Average+ 0.0% -5.0% $0.00 -$3.47 Average 5.0% $3.18 Average+ 0.0% $0.00 Adjusted GBA Unit Price Net Adjustments Gross Adjustments $68.00 $79.27 $66.38 $ % -13.5% -14.5% -2.5% 16.0% 23.5% 16.5% 30.5% $ % 30.0% $ % 18.0% Page 42
43 SALES COMPARISON APPROACH TO VALUE CONCLUSION: After making the adjustments, a range in price/sq.ft. of $66.38 to $79.27 results. The average price/sq.ft. after adjustment is $69.41, down from $77.78 prior to adjustment. Comparable #2 was an REO sale and falls outside the range of the remaining comparables. Therefore, it was given the least weight. Comparables #1, #3, #4, #5, and #6 indicate a very narrow price/sq.ft. range of $66.38 to $68.07, with an average of $ Consideration was also given to the list price of $70.26/sq.ft. However, as a listing, a lower price/sq.ft. is warranted. Despite the subject s good condition, its location in an area that lacks medical synergy, with no significant medical property present, suggests a price/sq.ft. slightly below the adjusted average. Value Ranges & Reconciled Value Number of Comps: 6 Unadjusted Adjusted % Δ Low: High: $67.99 $86.72 $66.38 $ % -9% Average: $77.78 $ % Median: $79.03 $ % Reconciled Value/Unit Value: $79.03 $880, $67.00 gba Subject Size: 23,484 Indicated Value: $1,573,428 Reconciled Final Value: $1,575,000 One Million Five Hundred Seventy Five Thousand Dollars AS IS MARKET VALUE ESTIMATE BY THE SALES COMPARISON APPROACH TO VALUE $1,575,000 There is no reliable means of projecting sales data to a future value. However, the range of values will be used as a check on the As Stabilized value estimate. Page 43

44 IMPROVED COMPARABLE MAP Page 44

45 Page 45

46 Page 46

47 Page 47

48 Page 48

49 Page 49

50 Page 50
51 INCOME APPROACH TO VALUE METHODOLOGY: The Income Approach to Value presumes that no prudent buyer will pay more for the subject than the capitalized income of the property, based upon the buyer s analysis of the recent income and expense history as it should relate to the future potential benefits of ownership. The buyer would only be willing to pay the present value of what he perceives those benefits to be. Typically, a direct capitalization method would be used to estimate the value of the subject. However, one of the leases includes a rent increase and the vacant suites will be leased in the future. Therefore, a Discounted Cash Flow (DCF) analysis has been used to account for the additional rental income over time. This involves an analysis of potential gross income and expenses over a projection period. The resulting annual net income (cash flows) and the future value of the property (the reversion) are then discounted to present value and combined to result in the value estimate. A three year DCF will be used, spanning August 2016 to July Direct Capitalization was used in Year 4, when the property is stabilized. PROJECTED GROSS INCOME: Rent Roll Suite No. of % of Lease Date Lease Date Lease Lease Contract Contract Asking Tenant No. Space Type Units SF Total Start End Term Type Rent* Rent/SF Rent/SF Vacant 100 Medical Office 1 5, % $13.00 Vacant 110 Medical Office 1 3, % $13.00 Orion Health 120 Medical Office 1 4, % 4/1/2014 3/31/ Mos. NNN $54,788 $13.00 Vacant 130 Medical Office 1 4, % $13.00 VA Health 140 Professional Office 1 3, % 8/1/2016 7/31/ Mos. NNN $46,074 $13.68** Totals 5 21, % Total $100,862 Leased 2 7, % Vacant 3 14, % *Contract Rent = Annualized rent as of appraisal date **Rent is based on 3,368 SF The subject is encumbered by two leases, which are summarized above. The leases are net with the tenants paying their pro-rata share of all expenses except structural maintenance. The rentable area for Suite 140 includes their allocated share of common area. In order to determine if the contract rents are reflective of market rent, and to estimate market rents for the vacant suites, I have researched the local market for leases of similar space. My findings are below. A three-story medical building connected to Illini Hospital, in Silvis, IL, has various spaces leased. The units range in size from 891 to 9,262 sq.ft., with all rents at $13.00 (net). The units are roughly similar in condition to the subject. This building is modestly older. However, since it is attached to a regional hospital, it supports market rents below $13.00 for the subject. One medical property in Bettendorf, IA, at the southeast corner of Lincoln and Kimberly Roads, has six leased units. They range in size from 869 to 11,618 sq.ft. The rents range from $10.25 to $17.50 (net). This building is very similar to the subject in terms of age and condition. Its superior location suggests market rents near the lower end of this range for the subject. A one-story building along 52 nd Avenue, adjacent to SouthPark, in Moline, IL, contains a mix of general and medical units. They range in size from 1,310 to 5,474 sq.ft. and in rent from $11.50 to $ This building is very similar to the subject overall. Page 51
52 INCOME APPROACH TO VALUE PROJECTED GROSS INCOME (CONTINUED): The market data brackets the subject s current rents and are very supportive. It is our opinion that the data supports market rents of $ Estimating an absorption rate for the vacant units is difficult due to the lack of direct market evidence. In attempting to do this, I have considered the marketing history of the property. The vacant units have been available for over five years. In addition, I have researched the local MLS for the average marketing time of similar properties. The data indicated an average list time of roughly 350 days for active listings and spaces leased in the past two years. Considering this and the subject s history, we estimate that it will take 2½ years for all three vacant units to be absorbed. Given that the units have been marketed for several years already, I project that Suite 100 will lease up first, six months into Year 1. A 5-year lease at $11.50/sq.ft. is assumed, with a 5-year option signed in Year 6. I project that Suite 110 will lease up one year later, six months into Year 2, also with a 5-year lease at $11.50/sq.ft. Suite 130 is projected to lease up six months into Year 3, with a 5-year lease at $11.50/sq.ft. The lease for Suite 120 expires in March The tenant has one 1-year option remaining at the same rent. It is assumed they will exercise this option, which will expire in March After that, I have projected that a new 5-year lease will be signed at the market rate of $11.50/sq.ft. The rent for Suite 140 increases to $15.60/sq.ft. (applied to 3,368 sq.ft.) in Year 6. CAM REIMBURSEMENTS: In addition to base rent, the tenants reimburse the owner for their pro-rata share of all building expenses except structural maintenance. The current CAM reimbursement for Suite 120 is $4.00/sq.ft., while the reimbursement for Suite 140 will be $5.91/sq.ft. The property manager indicated that the CAM reimbursement will be more similar to that for Suite 140 going forward. Therefore, this is stabilized at $5.90/sq.ft. of rentable area. However, the CAM reimbursement included in each year reflects occupancy for that year. The CAM is increased 2% per year commensurate with the projected increase in expenses and occupancy. Additionally, CAM for Suite 120 is assumed to increase from $4.00 to $5.90 in Year 2 when the new market rate lease is signed, and CAM for Suite 140 increases to $6.74 in Year 6. VACANCY AND COLLECTION LOSS: New 5-year leases for Suites 100, 110, and 130 are assumed in Years 1, 2, and 3, respectively. A new lease of Suite 120 is also assumed in Year 2, when the final option expires. No formal surveys of medical office space are available in East Moline, but local managing agents and brokers indicate that current vacancy levels generally range from 2% to 15%, with smaller medical spaces being near the low end. Given the subject s history and current demand, in conjunction with its location, a market vacancy and collection loss of 10% has been estimated. To account for the risk that subject s suites will not lease up as projected, a 10% deduction will be applied to the combined annual rent from each assumed lease in each year. Thus, in Year 1, the $6,172 represents 10% of $61,720 - the annual rent from the new lease, Suite 100. In Year 2, $15,411 is 10% of $154,111 - the combined annual rent from the leases of Suites 100, 110, and 120 (renewal). In Years 3, 4, 5, and 6, $21,142 represents 10% of $211,416 - the combined annual rent from the leases of Suites 100, 110, 120, and 130. Page 52
53 INCOME APPROACH TO VALUE EXPENSES 2015 JAN-JULY 2016 STABILIZED REAL ESTATE TAXES $58, $0.00 $61,721 INSURANCE $0.00 $0.00 $4,500 REPAIRS & MAINTENANCE $31, $10, $20,000 UTILITIES $16, $8, $15,000 SECURITY $ $1, $1,100 TRASH REMOVAL $3, $2, $4,000 LAWNCARE/SNOW REMOVAL $21, $4, $15,000 PEST CONTROL $6, $ $2,500 JANITORIAL $2, $1, $2,500 LEGAL/ADMINISTRATIVE $4, $4, $4,200 TOTAL $145, $32, $130,521 PER RENTABLE SQ.FT. $6.80 $6.08 EXPENSES: Historical expense data was provided for 2015 and 2016 YTD. A summary is in the table above. No expense was reported for insurance since this property is bundled into an insurance plan with several others they own. Therefore, I have stabilized this based on my familiarity with similar properties. The repairs/maintenance, lawncare/snow removal, and pest control expenses were reportedly high in Therefore, lower expenses were stabilized above. The expenses are stabilized at $6.08/sq.ft. Based on our experience with similar medical properties, expenses typically range from $5.00 to $10.00/sq.ft., with older properties being near the lower end and newer ones being near to top. Therefore, the subject s expenses are considered to be generally reflective of the market. I have increases the expenses by 2% per year in the DCF, which accounts for the increased occupancy. Since I have assumed tenants would sign new 5-year leases in each of Years 1, 2, and 3, it is necessary to include a leasing commission to account for marketing the property and procuring tenants. This expense consists of a 3% commission of the total rent for each new lease. It is assumed that the tenants would sign 5-year leases (with options). A summary of the deductions is below. Suite Annual Rent Term Total Commission (%) Commission ($) 100 $61,720 x 5 Years = $308,600 x 3% = $9, $43,930 x 5 Years = $219,650 x 3% = $6, $57,305 x 5 Years = $286,525 x 3% = $8,596 Page 53
54 INCOME APPROACH TO VALUE EXPENSES (CONTINUED): It is also necessary to include a deduction for a build-out expense. This includes fresh paint and replacing the carpet, which would be necessary to procure tenants. Based on my experience with this type of work, a cost of $2.50/sq.ft. has been estimated. This amount will be applied to the floor area of each vacant suite and deducted in the year it is assumed to be leased. Additionally, a deduction needs to be made for a reserve for capital items. These capital improvements typically include resurfacing a parking lot, and the repair and replacement of the roof and other structural components (heating and cooling systems, etc.) as necessary. A Realtyrates.com survey from 2 nd Quarter 2016 indicates a reserve range of $0.28 to $0.72 for office buildings, averaging $0.52 (a copy is in the Addenda). The building is 17 years old and in good condition. No major repairs or replacements appear imminent. Therefore, this expense is stabilized at $0.30/sq.ft. of building area, or $7,045. CAPITALIZATION OF NET INCOME: An overall capitalization rate (OAR) can be derived by a number of methods. By dividing the net income of comparables by their sale prices, overall rates can be extracted directly from the market. Income and expense data was available for two of the Improved Comparables. Comparable #1 indicated an OAR of 9.18%. This property is modestly older, but is superior in location and had a much higher level of occupancy. Comparable #3 indicated an OAR of 9.77%. This building shares several similarities with the subject, but is in a superior location. The OAR was based on actual NOI with no deductions, which would have resulted in a lower rate. I was able to extract OAR data from one sale in my database (a copy is in the Addenda). It indicated an OAR of 9.20%. This building is superior in location, but is not a medical property. However, it was fully leased at the time of sale. The Band of Investment technique was also used to estimate a capitalization rate. This is essentially a blend of the yield required to service a mortgage (expressed as a mortgage constant) and the yield on equity required by a typical investor. Conventional mortgage rates are approximately 4.25%, with a 20-year amortization period, a 75% loan to value ratio, and a 5-year call. This results in a mortgage constant of The Realtyrates.com survey on the following page indicates an equity dividend rate (cash on cash return) range of 7.74% to 15.56%, with an average of 11.26%. A rate of 12.5% has been selected, which is appropriate for a medical property in the Illinois Quad Cities. Mortgage Yield 75% x = Equity Yield 25% x = Overall Rate 100% = Page 54

55 INCOME APPROACH TO VALUE CAPITALIZATION OF NET INCOME (CONTINUED): I have also considered the Realtyrates.com survey of medical properties from 2 nd Quarter It indicates an OAR range of 5.62% to 12.89%, with an average of 8.83%. The subject is in a less than ideal area for a medical property and is currently 66% vacant. Therefore, an OAR above the average is warranted. Primary weight is given to the OAR indicated by the improved comparables, with general support from the national survey and Band of Investment. Given its historical and current vacancy, as well as the location, an OAR of 9.50% is concluded. The capitalization rate will be applied to the net income from the 6 th year of the DCF. Page 55

56 INCOME APPROACH TO VALUE DISCOUNT RATE: The subject s cash flows are received over time, which needs to be accounted for by discounting. To accomplish this, a discount rate must be chosen. Above is the RealtyRates.com Investor Survey from 2 nd Quarter It indicates a range in discount rates from 5.91% to 13.05% for acquisitions of retail properties, with an average of 9.06%. This is a national survey, not segregated by quality. The subject is in good condition, but lacks synergy with other medical properties and has historically high vacancy. Based on these comparisons, a 10.50% discount rate has been used to discount the annual cash flows to present value. This is a 100 basis points over the rate used in capitalizing the reversion. The reversion carries more risk since it is more difficult to project future value. Therefore, a higher rate of 11.00% has been applied. Page 56
57 INCOME APPROACH TO VALUE Discounted Cash Flow Year 1 Year 2 Year 3 Year 4 Year 5 Year 6 Income 8/16-7/17 8/17-7/18 8/18-7/19 8/19-7/20 8/20-7/21 8/21-7/22 Suite 100 $30,860 $61,720 $61,720 $61,720 $61,720 $61,720 Suite 110 $0 $21,965 $43,930 $43,930 $43,930 $43,930 Suite 120 $54,788 $52,679 $48,461 $48,461 $48,461 $48,461 Suite 130 $0 $0 $28,652 $57,305 $57,305 $57,305 Suite 140 $46,074 $46,074 $46,074 $46,074 $46,074 $52,540 Subtotal $131,722 $182,438 $228,837 $257,490 $257,490 $263,956 CAM Reimbursement $51,011 $80,922 $93,766 $117,524 $119,874 $122,726 Subtotal $182,733 $263,360 $322,603 $375,014 $377,364 $386,682 Less: Vacancy & Collection Effective Gross Income Less: Management Fee (6%) Less: Operating Expenses Less: Lease Commission Less: Build-Out Less: Reserves ($0.30/sq.ft.) Cash Flows $6,172 $15,411 $21,142 $21,142 $21,142 $21,142 $176,561 $247,949 $301,461 $353,872 $356,222 $365,540 $10,594 $14,877 $18,088 $21,232 $21,373 $21,932 $130,521 $133,131 $135,794 $138,510 $141,280 $144,106 $9,258 $6,590 $8,596 $0 $0 $0 $13,418 $9,550 $12,458 $0 $0 $0 $7,045 $7,045 $7,045 $7,045 $7,045 $7,045 $5,725 $76,756 $119,480 $187,085 $186,524 $192, % Sales Costs (5%) Reversion $2,025,862 $101,293 $1,924,569 Discount Rates NPV Cash Flows 10.50% Cash Flows $464,709 Reversion 11.00% Reversion $1,407,228 As Stabilzed $1,871,937 NPV Cash Flows $395,302 Reversion $1,142,138 As Is $1,537,439 Direct Capitalization and a DCF were used to estimate the As Stabilized value. The property will be stabilized beginning in Year 4. The rental incomes are relatively consistent after that. Capitalizing Year 4 NOI at 9.50% results in a value of $1,969,316 ($187,085 / 9.50%), which is rounded to $1,970,000. Since the property will be stabilized in Year 4, I have discounted Years 4-6 and have assumed a sale on the first day after the projection period. The DCF indicates an As Stabilized value of $1,871,937, which has been rounded to $1,870,000. The DCF indicates an As Is value of $1,537,439, rounded to $1,540,000. AS STABILIZED MARKET VALUE ESTIMATE BY THE INCOME APPROACH TO VALUE DIRECT CAP $1,970,000 AS STABILIZED MARKET VALUE ESTIMATE BY THE INCOME APPROACH TO VALUE DCF $1,870,000 AS IS MARKET VALUE ESTIMATE BY THE INCOME APPROACH TO VALUE DCF $1,540,000 Page 57
58 CORRELATION AND VALUE ESTIMATE COST APPROACH TO VALUE Not Developed SALES COMPARISON APPROACH TO VALUE $1,575,000 INCOME APPROACH TO VALUE - As Is - DCF $1,540,000 - As Stabilized - DCF $1,870,000 - As Stabilized - Direct Cap $1,970,000 The Cost Approach to Value was deemed unreliable and was not developed. The Sales Comparison Approach to Value is a helpful approach to utilize for most properties when sufficient data is available with which to make comparisons. Six comparables were found that were considered similar. Although they differed from the subject in several areas, they did indicate a meaningful range from which a comparison was made using an adjustment grid. The adjustments were estimated based on physical comparisons and mathematically rationalized to the best extent possible. The Income Approach to Value was developed using the contract rents and market rents for the vacant units. The expenses of ownership were based on the subject s limited history. To account for the changing cash flows, a Discounted Cash Flow analysis was developed. The capitalization rate used was based upon the four comparable sales, as well as a national survey and the Band of Investment. The discount rate was extracted from a national survey. This analysis reflects what a purchaser of the property would expect to accomplish over a short holding period. The As Stabilized value is $80/sq.ft., which is near the top of the range of the Improved Comparables. In the final analysis, the DCF method of the Income Approach is considered the most reliable and has been given primary weight in estimating both the As Is and As Stabilized values. The Direct Cap rounds the As Stabilized value upward. The Sales Comparison Approach is very supportive, but has been given less weight since it does not capture the income to the subject. The As Stabilized prospective market value is subject to the Extraordinary Assumption that the vacant suites will lease up as projected herein. The use of this Extraordinary Assumption may have affected the assignment results. Therefore, based upon the preceding analysis of data, it is our opinion that the As Is Market Value of the Leased Fee Interest in the subject, as of July 21, 2016, and the As Stabilized prospective Market Value, as of August 1, 2019, are: AS IS AS STABILIZED $1,550,000 $1,900,000 Jordan D. Maus Certified General Real Property Appraiser Illinois # Page 58
59 CERTIFICATION I certify that, to the best of my knowledge and belief... - the statements of fact contained in this report are true and correct. - the reported analyses, opinions, and conclusions are limited only by the reported assumptions and limiting conditions, and are my personal, impartial and unbiased professional analyses, opinions, and conclusions. - I have no present or prospective interest in the property that is the subject of this report, and no personal interest with respect to the parties involved. - I have no bias with respect to the property that is the subject of this report or to the parties involved with this assignment. - my engagement in this assignment was not contingent upon developing or reporting predetermined results. - my compensation for completing this assignment is not contingent upon the development or reporting of a predetermined value or direction in value that favors the cause of the client, the amount of the value opinion, the attainment of a stipulated result, or the occurrence of a subsequent event directly related to the intended use of this appraisal. - the reported analyses, opinions, and conclusions were developed, and this report has been prepared, in conformity with the Code of Professional Ethics and the Standards of Professional Practice of the Appraisal Institute, which include the Uniform Standards of Professional Practice. - the use of this report is subject to the requirements of the Appraisal Institute relating to review by its duly authorized representatives. - as of the date of this report, I have completed the continuing education program of the Appraisal Institute. - I have made a personal inspection of the property that is the subject of this report. - no one provided significant real property appraisal assistance to the person signing this certification. - I have performed no services, as an appraiser or in any other capacity, regarding the property that is the subject of this report within the three-year period immediately preceding acceptance of this assignment. - the appraisal assignment was not based on a requested minimum valuation, a specific valuation or the approval of a loan. - in accordance with Title 68, CH.VII, Section of the Illinois Administrative Code, the fee for this appraisal was $1,900. August 9, 2016 Jordan D. Maus Certified General Real Property Appraiser Illinois # Page 59
60 CONTINGENT AND LIMITING CONDITIONS The legal description, which has been furnished by others, is assumed to be accurate, but no responsibility is assumed for its correctness. The report rendered herein is based on the premise that the property is free and clear of mortgage indebtedness unless specifically stated otherwise, and that there are no special assessments against the property. No report of title is rendered herewith, and it is considered good for purposes of this report. It is further assumed by the appraiser that all leases and lease amendments which have been furnished to the appraiser are correct and accurate. If this is not the case, all values contained herein are voided. Any sketches in this report are included to assist the reader in visualizing the property. No survey of the property has been made by the appraiser and no responsibility for its accuracy is assumed. Lacking any contrary evidence, subsurface soil conditions are assumed to be adequate to support the existing or proposed improvements. The improvements, if any, are assumed to be within the lot lines and in accordance with all local zoning and building ordinances. Also it is assumed that no asbestos, or any other hazardous materials are located in the structure, or the site. Possession of this report does not carry with it the right of publication, nor may it, or any part thereof, be used by anyone but the client without the previous express written consent of the appraiser. The appraiser shall not be required to give testimony or appear in court with reference to the appraisal of the property described herein, unless prior arrangements have been made. Although reasonable attempts have been made to obtain corroborative evidence, information supplied to the appraiser by the client is assumed to be basically correct and heavy reliance has been placed upon this information. Neither all nor any part of the contents of this report shall be conveyed to the public through advertising, public relations, or other media, without the written consent and approval of the author, particularly as to the valuation conclusions, the identity of the appraiser or firm for which he is connected. This appraisal report has been made in conformity with, and is subject to the requirements of the Code of Professional Ethics and Standards of Professional Conduct of the Appraisal Institute. This is an Appraisal Report, and is intended to comply with the reporting requirements set forth under Standards Rule 2-2 (b) of the Uniform Standards of Professional Appraisal Practice, and 12 CFR of the Federal Financial Institutions Reform, Recovery and Enforcement Act of Page 60
61 ADDENDA
62
63

64
65
66
67
68
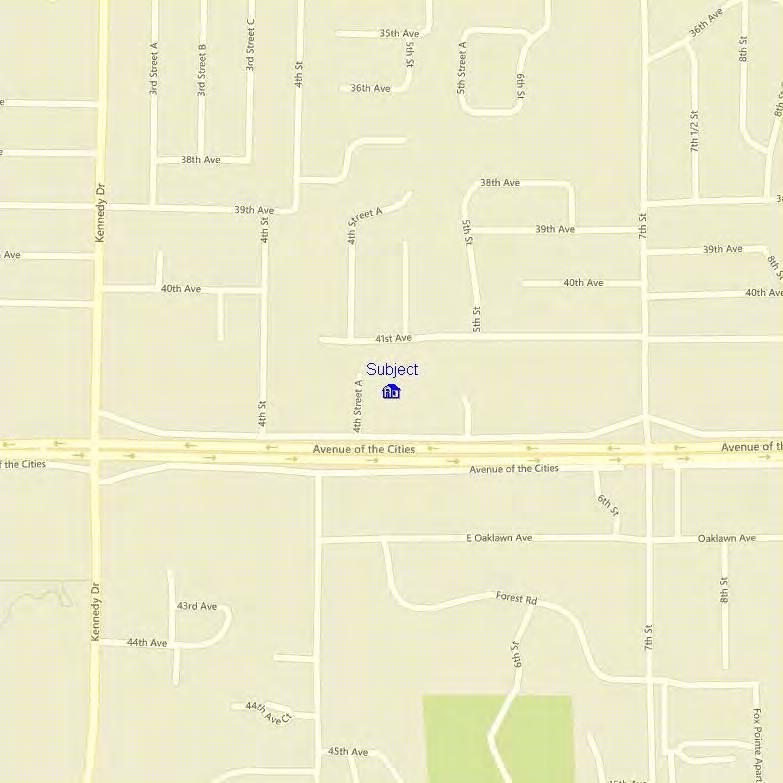

69

70 ZONING MAP

71 RESERVE SURVEY

72 OAR Comparable Transaction Address nd Avenue Date 4/17/2014 City Moline Price $1,470,000 Tax ID SM Price Per SF $ Legal Description Lot 4, Ekhco 5th Addition Conditions of Sale Arm's Length Grantor KPG Company, L.C. Financing Cash Grantee DJB Properties, L.C. Property Rights Leased Fee Sale Instrument Warranty Deed Days on Market 1080 Sales Record # Verification Source Thad Denhartog (Mel Foster) Site Land SF 43,151 Topography Level Shape Rectangular Zoning B-4 Utilities All Public Land to Building Ratio 3.68 Improvements & Financial Data GBA 11,708 PGI NA Year Built 1995 EGI NA Condition Good NOI $135,240 Quality Average Cap Rate 9.20% Comments This is a one-story, wood frame, and brick veneer building along the north side of 52nd Avenue, east of 16th Street, and immediately south of Southpark Mall. It was fully occupied by four tenants at the time of sale, with rents averaging $12.89/sq.ft. (based upon a net leasable area of 11,550 sq.ft.). The property had been marketed for almost three years (originally at $1,725,000) and was most recently listed for $1,470,000. The indicated OAR includes 5% vacancy, 5% mgmt., and $0.25/sq.ft. reserve.
73 ROY R. FISHER The company was initially organized in 1922, but was legally incorporated in This firm specializes in real estate counseling, and valuation. The corporation was operated by Edmond C. Fisher, MAI, SREA, and Kevin M. Pollard, MAI. David Mark Nelson purchased the assets of Roy R. Fisher in 2014, and serves as President of Nelson Valuations, dba Roy R. Fisher. Some of the notable appraisals and professional assistance completed by this firm are listed below. Bridgestone Bandag Corporate Headquarters and R&D Facility, Muscatine, Iowa. Sentry Insurance Company Office Building (75,000 SF), Davenport, Iowa. River Cities Business Park (former Caterpillar plant), Davenport, Iowa. Eagle Window & Door assembly plant and distribution warehouse, Dubuque, Iowa. International Paper Company plants in Clinton and Fort Madison, Iowa, and Sartelle, Minnesota. Tones Brothers spice plant, Ankeny, Iowa. Exide Battery Corporation plant, Burlington, Iowa. Pella Corporation Manufacturing plant, Pella, Iowa. McGraw-Hill distribution warehouse, Dubuque, Iowa. Winnebago Industries plant, Forest City, Iowa. Nordstrom distribution facility, Dubuque, Iowa. Dial Corporation food processing plant, Fort Madison, Iowa. Sears Manufacturing Plant, Davenport, Iowa. General Electric Corporation plants, West Burlington and Carroll, Iowa. Genesis Health Systems East Campus Medical Office Buildings, Davenport, Iowa. Deere & Company Parts Distribution Warehouse (1.8 million SF), Milan, Illinois. Deere & Company Harvester Works, East Moline, and Deere Harvester Works, Moline, Illinois. Deere & Company Corporate Administration Center and Insurance Headquarters, Moline, Illinois. Deere & Company Manufacturing Plants in Davenport, Ottumwa, Dubuque, and Ankeny, Iowa. Deere & Company Davenport Works, Davenport, Iowa. Kraft, Inc. Knudsen Ice Cream plant, Los Angeles, California. IBP Meat Processing plants, Columbus Junction, Denison, and Tama, Iowa, and Madison and Dakota City, Nebraska. Caterpillar Tractor Co., and J.I. Case plants, Burlington, Iowa. Aluminum Company of America rolling mill, Riverdale, Iowa. Catfish Bend Casino and Hotel, Burlington, Iowa, Wild Rose Casino, Clinton, Iowa. Over 10,000 apartment units in various locations in Eastern Iowa and Western Illinois. K-Mart and Wal-Mart stores in Iowa City, Coralville, Ames, Dubuque, Cedar Rapids, and Davenport, Iowa, and Rock Island, Illinois. Walgreens stores in various locations in Eastern Iowa and Western Illinois. Iowa DOT right-of-way acquisitions in Dubuque, Waterloo/Cedar Falls, and Clinton, Scott, and Muscatine Counties in Iowa. Numerous Independent and Assisted Living facilities in Iowa, Illinois, Nebraska, and Wisconsin. Village Shopping Center, Old Town Mall, and Northpark Mall, Davenport, Iowa; Duck Creek Mall, Cumberland Square Shopping Center, Bettendorf, Iowa; Muscatine Mall, Muscatine, Iowa; Marshalltown Mall, Marshalltown, Iowa; Newton Mall, Newton, Iowa; Southpark Mall, Moline, Illinois; Westdale Mall, Cedar Rapids, Iowa; Sandburg Mall, Galesburg, Illinois (rev. 07/13)
74 REFERENCES Dick Davidson Lane & Waterman Davenport, IA 563/ Ralph Heninger Heninger & Heninger Davenport, IA 563/ Charles Meardon Meardon, Sueppel Iowa City, IA 319/ Frank Nowinski Katz, Huntoon Moline, IL 309/ Doug Oelschlaeger Shuttleworth & Ingersoll Cedar Rapids, IA 319/ Tom Pastrnak Pastrnak Law Office Davenport, IA 563/ Jerry Pepping McGehee, Boling Silvis, IL 309/ Scott Power Aspelmeier, Fisch, Power, Hegberg Burlington, IA 319/ Bob Sarnoff Sarnoff & Baccash Chicago, IL 312/ Steve Schalk Schalk Law Office Davenport, IA 563/ Clark Stojan Wessels, Stojan Rock Island, IL 309/ Adrian Pena American Bank Davenport, IA 563/ Nicole Jaeger Bankers Trust Des Moines, IA 515/ John Lewandowski Blackhawk Bank Milan, IL 309/ Michelle Dawson Blackhawk Bank Davenport, IA 563/ Janis Wolf Citibank Chicago, IL 312/ Deborah Van Zuiden Gateway State Bank Clinton, IA 563/ William F. Kusy GMAC Com. Mortgage Urbandale, IA 515/ Aaron Swartzendruber Hills Bank Coralville, IA 319/ Abbey Busch Huntington National Bank Columbus, OH 614/ Craig Slonkosky JPMorganChase Indianapolis, IN 317/ Jeffrey Grendysa National City Bank Plymouth, MI 734/ John Crowe Northwest Bank Davenport, IA 563/ Joe Slavens Northwest Bank Davenport, IA 563/ Greg Keppy Quad City Bank & Trust Davenport, IA 563/ Jennifer Catlin Sunflower Bank McPherson, KS 620/ Jeff Atkinson Sterling Federal Bank Clinton, IA 563/ Lynda Haasch TCF Bank Minneapolis, MN 612/ Diana Stoye THE National Bank Davenport, IA 563/ Bob Forsek U.S. Bank Naperville, IL 630/ Tami Fielder Valley Bank Eldridge, IA 563/ Stanley Goodyear Walcott Trust and Savings Bank Walcott, IA 563/ Jeff Ehrmann Wells Fargo Bank Davenport, IA 563/ David Binner Wells Fargo Retechs Des Moines, IA 515/ Jeremy Winter Wells Fargo Retechs Bloomington, MN 612/ Kevin Koellner Build to Suit Bettendorf, IA 563/ Tom Jarrett Deere & Company Moline, IL 309/ Steven Quataert General Electric Co. Fort Myers, FL 239/ Michael Sharp Genesis Davenport, IA 563/ Jerry Janata International Appraisal Uppr. Saddle River, NJ 201/ Thad Denhartog Mel Foster Company Davenport, IA 563/ Jeff Miller Premier Partners Davenport, IA 563/ David Weiner Ruhl & Ruhl Moline, IL 309/ Richard T. Finn, Jr. Salomon Smith Barney, Inc. New York, NY 212/ Michael Poster St. Ambrose University Davenport, IA 563/ Debbie Davis Strategic Tax Service Chicago, IL 312/ Mary Mangles Trinity Health Systems Rock Island, IL 309/ Brian Frazier Wal-Mart Corp. Bentonville, AR 479/ Matt Johnston West Bend Mutual Insurance Davenport, IA 800/ Becky Eiting City of Davenport Davenport, IA 563/ Brian Heier City of Davenport Attorney Davenport, IA 563/ Dave Hendricx Moline Township Moline, IL 309/ Dale McCrea Muscatine Co. Assessor Muscatine, IA 563/ Greg Lynch Polk County Assessor Des Moines, IA 515/ Joan Russell R.I. Co. Board of Review Rock Island, IL 309/ Dale Denklau Scott Co. Assessor Davenport, IA 563/ John Kiddoo South Moline Township East Moline, IL 309/ Susan Carpentier S.R.I. Township Assessor Rock Island, IL 309/ Michael Ward U.S. Postal Service Englewood, CO 303/
75 JORDAN D. MAUS PROFESSIONAL AFFILIATIONS: General Appraiser with Roy R. Fisher (Nelson Valuations, Inc.), Davenport, IA, since January 2012 Associate Appraiser with DataSource Appraisal, Bettendorf, IA, from September 2010 to January 2012 Associate Appraiser with Renzi & Associates, Inc., Chicago, IL, from July 2008 to September 2010 EDUCATION AND LICENSING: Graduated from Wartburg College, Waverly, IA, May 2005 B.A. Exercise Science Iowa Certified General Real Property Appraiser, License No. CG03083 (Expires 6/30/2017) Illinois Certified General Real Estate Appraiser, License No (Expires 9/30/2017) PROFESSIONAL COURSES: Comparative Analysis, Appraisal Institute, 2015 Appraisal of Owner-Occupied Commercial Properties, McKissock Appraisal School, 2015 Analyzing Operating Expenses, Appraisal Institute, 2015 Self-Storage Economics and Appraisal, Appraisal Institute, 2014 USPAP Update Course, Appraisal Institute, 2014 USPAP Update Course, Appraisal Institute, 2013 Analyzing Tenant Credit Risk and Commercial Lease Analysis, Appraisal Institute, 2012 General Appraiser Income Approach I & II, Appraisal Institute, 2011 Real Estate Finance, Statistics, & Valuation Modeling, Appraisal Institute, 2011 General Appraiser Market Analysis & Highest and Best Use, Appraisal Institute, 2011 Commercial Appraisal Review, McKissock Appraisal School, 2011 General Appraiser Report Writing & Case Studies, McKissock Appraisal School, 2011 Sales Comparison of Small, Mixed-Use Properties, Appraisal Institute, 2011 USPAP Update Course, McKissock Appraisal School, 2011 General Appraiser Sales Comparison Approach, Appraisal Institute, 2011 General Appraiser Site Valuation & Cost Approach, Appraisal Institute, 2010 Uniform Standards of Professional Practice (USPAP), Appraisal Institute, 2010 Basic Appraisal Principles, Appraisal Institute, 2010 Basic Appraisal Procedures, Appraisal Institute, 2010

76 LICENSES
EAGLES CREST II APARTMENT COMMUNITY FOR SALE INCLUDES MULTI FAMILY AND COMMERCIAL LAND 85 UNITS FOR SALE DAVENPORT, IOWA $6,200,000
 APARTMENT COMMUNITY FOR SALE INCLUDES MULTI FAMILY AND COMMERCIAL LAND 1 85 UNITS FOR SALE DAVENPORT, IOWA $6,200,000 EAGLES CREST II CHUCK RUHL, JR., SIOR President 563.355.4000 cruhl@ruhlcommercial.com
To all Appraisers: Brief Overview:
 To all Appraisers: As the appraisal industry continues to change, the demand for alternative valuation solutions grows. That is why is excited to announce the addition of a new product - the Desktop Appraisal
Appraisal and Market Analysis of Indoor Waterpark Resorts
 Appraisal and Market Analysis of Indoor Waterpark Resorts By David J. Sangree, MAI, CPA, ISHC An appraisal of an indoor waterpark resort is similar to other appraisals in that it is a professional appraiser
PARHAM PROFESSIONAL PARK
 20,372 s.f. medical office building value-add and owner occupant oportunity PARHAM PROFESSIONAL PARK PARHAM PROFESSIONAL PARK a Executive Summary THE OPPORTUNITY JLL, as exclusive advisor, is pleased to
FOR SALE 605 Industry Ave DISTRIBUTION WAREHOUSE FACILITY Asking $395,000
 FOR SALE 605 Industry Ave DISTRIBUTION WAREHOUSE FACILITY Asking $395,000 For Additional Information and To View the Property Please Contact Sandy Hoff - Office Phone 218-722-5556 shoff@fisalter.com AREA
RESTRICTED APPRAISAL REPORT
 Restricted Use Appraisal Report Thomas J. Schulte & Associates Page #1 RESTRICTED APPRAISAL REPORT SUBJECT ASSIGNMENT Property City: Zip Code: County: Legal Description: Assessor's Parcel #: Tax Year:
INLAND EMPIRE REGIONAL INTELLIGENCE REPORT. School of Business. April 2018
 INLAND EMPIRE REGIONAL INTELLIGENCE REPORT April 2018 Key economic indicators suggest that the Inland Empire s economy will continue to expand throughout the rest of 2018, building upon its recent growth.
A Demonstration Appraisal Report. Of a. Located at. Date of Appraisal. Prepared for. Prepared by
 A Demonstration Appraisal Report Of a Located at Date of Appraisal Prepared for Prepared by International Association of Assessing Officers Professional Designation Subcommittee 314 W. 10 th Street Kansas
ECONOMIC CURRENTS. Vol. 5 Issue 2 SOUTH FLORIDA ECONOMIC QUARTERLY. Key Findings, 2 nd Quarter, 2015
 ECONOMIC CURRENTS THE Introduction SOUTH FLORIDA ECONOMIC QUARTERLY Economic Currents provides an overview of the South Florida regional economy. The report presents current employment, economic and real
CHAPTER 3. HOUSING AND ECONOMIC DEVELOPMENT
 CHAPTER 3. HOUSING AND ECONOMIC DEVELOPMENT This chapter analyzes the housing and economic development trends within the community. Analysis of state equalized value trends is useful in estimating investment
ROBERT MOON VICE PRESIDENT, BROKERAGE SERVICES
 OFFERING MEMORANDUM MILLENNIUM MEDICAL 28625 NORTHWESTERN HWY SOUTHFIELD, MICHIGAN SEPTEMBER 2013 PREPARED BY: ROBERT MOON VICE PRESIDENT, BROKERAGE SERVICES FRIEDMAN INTEGRATED REAL ESTATE SOLUTIONS 34975
8Land Use. The Land Use Plan consists of the following elements:
 8Land Use 1. Introduction The Land Use Plan consists of the following elements: 1. Introduction 2. Existing Conditions 3. Opportunities for Redevelopment 4. Land Use Projections 5. Future Land Use Policies
Quarterly Housing Market Update
 Quarterly Housing Market Update An Overview New Hampshire s current housing market performance, as well as its overall economy, is slowly improving, with positives such as increasing employment and rising
MARKET VALUE ESTIMATE. April 6, Land, Commercial Lots Southpark Subdivision Six Commercial Lots /- S. Harrison Street Olathe, Kansas 66061
 MARKET VALUE ESTIMATE April 6, 2018 Land, Commercial Lots Southpark Subdivision Six Commercial Lots 14600+/- S. Harrison Street Olathe, Kansas 66061 An Appraisal Report prepared for Job No. 5035726 Bliss
Marketing Presentation 5550 Crowder Boulevard New Orleans, Louisiana 70127
 New Orleans, Louisiana 70127 69,348 SF Land For Sale at $285,000 Robert Hand, MBA, CCIM, SIOR Louisiana Commercial Realty 3900 North Causeway Boulevard-Suite 1200 New Orleans, Louisiana 504-289-8172 www.louisianacommercialrealty.com
ECONOMIC CURRENTS. Vol. 4, Issue 3. THE Introduction SOUTH FLORIDA ECONOMIC QUARTERLY
 ECONOMIC CURRENTS THE Introduction SOUTH FLORIDA ECONOMIC QUARTERLY Vol. 4, Issue 3 Economic Currents provides an overview of the South Florida regional economy. The report presents current employment,
5,787 SF Bank-Owned Property
 FOR SALE 5,787 SF Bank-Owned Property Total SF 5,787 Acreage 0.40 Parcel ID 0820D022 Zoning C-3. General Commercial District List Price $64,000.00 5,787± sf office (based on courthouse records) 0.4± acres
For the Reno MSA employment has historically been based largely on construction and the leisure and hospitality industry. The construction industry
 For the Reno MSA employment has historically been based largely on construction and the leisure and hospitality industry. The construction industry has lost almost 15,000 construction jobs since 2006,
As Of: Prepared For: Prepared By:
 of 216 SW 131st St As Of: 06/11/11 Prepared For: Prime Pacific Bank 2502 196th St SW Lynnwood WA 98036 Prepared By: Cynthia A. Nagle, CREA 922 N Cedar St Tacoma, WA 98406 RESTRICTED APPRAISAL REPORT Restriction
1818 Milton Avenue Janesville, WI 53545
 CVS United - PROSPECT, States CT Postal Service (Anchor) - Janesville, WI NET LEASE OPPORTUNITY NET LEASED INVESTMENT OFFERING 1818 Milton Avenue Janesville, WI 53545 CVS - PROSPECT, CONFIDENTIALITY CT
REAL ESTATE MARKET OVERVIEW 1 st Half of 2015
 REAL ESTATE MARKET OVERVIEW 1 st Half of 2015 With Comparisons to the 2 nd Half of 2014 September 4, 2015 Prepared for: First Bank of Wyoming Prepared by: Ken Markert, AICP MMI Planning 2319 Davidson Ave.
A Demonstration Appraisal Report. Of a. Located at. Date of Appraisal. Prepared for. Prepared by
 A Demonstration Appraisal Report Of a Located at Date of Appraisal Prepared for Prepared by International Association of Assessing Officers Professional Designation Subcommittee 314 West 10 th Street Kansas
REGIONAL. Rental Housing in San Joaquin County
 Lodi 12 EBERHARDT SCHOOL OF BUSINESS Business Forecasting Center in partnership with San Joaquin Council of Governments 99 26 5 205 Tracy 4 Lathrop Stockton 120 Manteca Ripon Escalon REGIONAL analyst april
Integra Realty Resources Memphis. Appraisal of Real Property
 Integra Realty Resources Memphis Appraisal of Real Property Retail Property 1219 1295 Main Street Southaven, Desoto County, Mississippi 38671 Prepared For: Presidential Bank Effective Date of the Appraisal:
OFFERING MEMORANDUM ARBY S NNN SALE
 OFFERING MEMORANDUM ARBY S NNN SALE PRESENTED BY: The Lerner Company Ben Meier Lindsay Banks 10855 W. Dodge Rd. 402.502.4715 402.502.4708 Omaha, NE 68154 bmeier@lernerco.com lbanks@lernerco.com August
ECONOMIC CURRENTS. Vol. 3, Issue 3 SOUTH FLORIDA ECONOMIC QUARTERLY. Introduction
 ECONOMIC CURRENTS THE Introduction SOUTH FLORIDA ECONOMIC QUARTERLY Economic Currents provides an overview of the South Florida regional economy. The report presents current employment, economic and real
JENNERS VILLAGE PROFESSIONAL BUILDING
 JENNERS VILLAGE PROFESSIONAL BUILDING Jennersville, Pennsylvania On behalf of ownership, Jones Lang LaSalle is pleased to offer for sale a 17,520 square foot professional medical building located at 105
CHICAGO CBD OFFICE INVESTMENT PROPERTIES GROUP
 CHICAGO CBD OFFICE INVESTMENT PROPERTIES GROUP SECOND QUARTER NEWSLETTER 216 HOT TOPICS Capital markets remain a focus with 14 assets either under contract or sold totaling $2.6 billion, which includes
MONTGOMERY TRACE CENTER EVA ST. MONTGOMERY, TX 77356
 FOR SALE $10,675,000 8.0 % CAP RATE A GROCERY A GROCERY ANCHORED ANCHORED NEIGHBORHOOD SHOPPING SHOPPING CENTER CENTER FOR MORE INFORMATION CONTACT: Jeff Tinsley Jeff Beard, CCIM 92% OCCUPOIED OCCUPIED
REED APPRAISAL COMPANY REAL PROPERTY APPRAISERS AND CONSULTANTS
 REAL PROPERTY APPRAISERS AND CONSULTANTS 100 SOUTH KENTUCKY AVENUE #230 ip.o. BOX 1645 ilakeland, FLORIDA 33802-1645 OFFICE: (863) 688-6718 ifax: (863) 688-5993iEMAIL: stan@reedappraisalco.com TO: Henry
ECONOMIC CURRENTS. Vol. 3, Issue 1. THE SOUTH FLORIDA ECONOMIC QUARTERLY Introduction
 ECONOMIC CURRENTS THE SOUTH FLORIDA ECONOMIC QUARTERLY Introduction Economic Currents provides an overview of the South Florida regional economy. The report contains current employment, economic and real
Summary. Houston. Dallas. The Take Away
 Page Summary The Take Away The first quarter of 2017 was marked by continued optimism through multiple Texas metros as job growth remained positive and any negatives associated with declining oil prices
Young-Adult Housing Demand Continues to Slide, But Young Homeowners Experience Vastly Improved Affordability
 Young-Adult Housing Demand Continues to Slide, But Young Homeowners Experience Vastly Improved Affordability September 3, 14 The bad news is that household formation and homeownership among young adults
1057 Canton RD Marietta, GA 30066
 1057 Canton RD Marietta, GA 30066 +/- 1.49 Acres Presently Zoned LI $350,000 With all utilities available. Very little lot prep necessary for most uses. Two Level steppes descending from the street level.
Chicago s industrial market thrives during the third quarter.
 CHICAGO INDUSTRIAL MARKET MONITOR THIRD QUARTER 2015 Chicago s industrial market thrives during the third quarter. Demand across the Chicago industrial market remains high sending absorption up and vacancy
FOR SALE CARE PLUS, A SPARKS HEALTH URGENT CARE FACILITY 14 GOTHIC RIDGE RD, VAN BUREN, AR 72956
 FOR SALE EXECUTIVE SUMMARY OFFERING SUMMARY Sale Price: Cap Rate: NOI: Lot Size: Year Built: Building Size: Renovated: $1,750,000.00 9.02% $157,898.91 1.12 Acres 1998 8,671 sf 2005 Zoning: Commercial 2
ACRE DEVELOPMENT SITE OFFERING MEMORANDUM PLAINFIELD, ILLINOIS UNIQUE INDUSTRIAL OR MIXED-USE DEVELOPMENT OPPORTUNITY
 235 CHARLES PLAINFIELD, ILLINOIS UNIQUE INDUSTRIAL OR MIXED-USE DEVELOPMENT OPPORTUNITY OFFERING MEMORANDUM ACRE DEVELOPMENT SITE GREG PACELLI Director Land Advisory Group Greg.Pacelli@colliers.com T +1
SELF-STORAGE REPORT VIEWPOINT 2017 / COMMERCIAL REAL ESTATE TRENDS. By: Steven J. Johnson, MAI, Senior Managing Director, IRR-Metro LA. irr.
 SELF-STORAGE REPORT VIEWPOINT 2017 / COMMERCIAL REAL ESTATE TRENDS By: Steven J. Johnson, MAI, Senior Managing Director, IRR-Metro LA The Self Storage Story The self-storage sector has been enjoying solid
Economic Indicators 2018 MODESTO
 Economic Indicators 2018 MODESTO C A L I F O R N I A Economy and Outlook Modesto is gaining recognition as a land of opportunity within the greater California economy. Modesto offers high quality of life
600 W. St. Germain Street, St. Cloud, MN
 BANKRUPTCY SALE 99,300 Sq. Ft. Fee-Owned Big Box Retail Store Available 600 W. St. Germain Street, St. Cloud, MN Property Information Memorandum Michael Jerbich (312) 454-2057 michael@agrealtypartners.com
Economic Highlights. Payroll Employment Growth by State 1. Durable Goods 2. The Conference Board Consumer Confidence Index 3
 August 26, 2009 Economic Highlights Southeastern Employment Payroll Employment Growth by State 1 Manufacturing Durable Goods 2 Consumer Spending The Conference Board Consumer Confidence Index 3 Real Estate
APPRAISAL REPORT OF THE REAL PROPERTY LOCATED AT. Enterprise Rd Dillon, SC Ronnie Gardner. March 1, 2018
 APPRAISAL REPORT OF THE REAL PROPERTY LOCATED AT Dillon, SC 29536 for as of March 1, 2018 by David McLaurin 105 West Harrison Street Dillon, SC 29536 IDENTIFICATION NEIGHBORHOOD SITE MARKET DATA ANALYSIS
Copyright, 1999, 2002, 2004, Freddie Mac. All Rights Reserved.
 Page 1 of 13 Engineering Requirements/Chapter 12: Appraiser and Appraisal Requirements/12.1: General requirements 12.1: General requirements For all multifamily purchase programs and products, the Seller/Servicer
Housing Indicators in Tennessee
 Housing Indicators in l l l By Joe Speer, Megan Morgeson, Bettie Teasley and Ceagus Clark Introduction Looking at general housing-related indicators across the state of, substantial variation emerges but
City of Lonsdale Section Table of Contents
 City of Lonsdale City of Lonsdale Section Table of Contents Page Introduction Demographic Data Overview Population Estimates and Trends Population Projections Population by Age Household Estimates and
3 November rd QUARTER FNB SEGMENT HOUSE PRICE REVIEW. Affordability of housing
 3 November 2011 3 rd QUARTER FNB SEGMENT HOUSE PRICE REVIEW JOHN LOOS: HOUSEHOLD AND PROPERTY SECTOR STRATEGIST 011-6490125 John.loos@fnb.co.za EWALD KELLERMAN: PROPERTY MARKET ANALYST 011-6320021 ekellerman@fnb.co.za
RIDDLE RIDDLE ASSOCIATES, INC.
 RIDDLE ASSOCIATES Inc. ASSOCIATES Inc. Commercial Real Estate PRICE REDUCTION! OFFICE / WAREHOUSE INDUSTRIAL FOR SALE OR FOR LEASE 1716 Lambert Court Chesapeake, Virginia 23320 (Greenbrier off Woodlake
Linkages Between Chinese and Indian Economies and American Real Estate Markets
 Linkages Between Chinese and Indian Economies and American Real Estate Markets Like everything else, the real estate market is affected by global forces. ANTHONY DOWNS IN THE 2004 presidential campaign,
LAND APPRAISAL REPORT
 IDENTIFICATION LAND APPRAISAL REPORT Page #1 File No. Borrower None Census Tract * Map Reference 462820011000315 Property Address NWC Gaar and Pleasant View Roads City Richmond County Wayne State IN Zip
OFFICE MARKET ANALYSIS:
 OFFICE MARKET ANALYSIS: DAVID WEST RMLS Fellow Certificate of Real Estate Development Student Masters of Urban and Regional Planning Candidate While the Portland office market continues the slow recovery
The PrivateBank (Chicago MSA)
") The PrivateBank (Chicago MSA) 1255 Green Bay Road Wilmette, IL 60091 TABLE OF CONTENTS TABLE OF CONTENTS I. Executive Profile Executive Summary Investment Highlights Property Overview II. Location Overview
The PrivateBank (Chicago MSA) 1255 Green Bay Road Wilmette, IL 60091 TABLE OF CONTENTS TABLE OF CONTENTS I. Executive Profile Executive Summary Investment Highlights Property Overview II. Location Overview
Housing Price Forecasts Illinois Metropolitan Statistical Areas
 Housing Price s Illinois Metropolitan Statistical Areas R E A L Regional Economics Applications Laboratory, Institute of Government and Public Affairs, University of Illinois Dr. Geoffrey J.D. Hewings,
Market Segmentation: The Omaha Condominium Market
 Market Segmentation: The Omaha Condominium Market Roger P. Sindt Steven Shultz University of Nebraska at Omaha Introduction A highly visible and growing niche in the homeownership market is the condominium
Highway 86 in Ridgedale
 Just Listed!!! Highway 86 in Ridgedale 4,000 Sqft.+ Professional Office or Retail Building Sales Price $395,000 2841 State Hwy. 86 Ridgedale Missouri 65739 Great Investment Opportunity! This freestanding
City of Noblesville Unified Development Ordinance Audit. Real Estate Analysis
 City of Noblesville Unified Development Ordinance Audit Real Estate Analysis December 10 th, 2012 Introduction The Noblesville Real Estate Analysis compares the health of the real estate market against
Housing Market Update
 Housing Market Update March 2017 New Hampshire s Housing Market and Challenges Market Overview Dean J. Christon Executive Director, New Hampshire Housing Finance Authority New Hampshire s current housing
INLAND EMPIRE REGIONAL INTELLIGENCE REPORT
 INLAND EMPIRE REGIONAL INTELLIGENCE REPORT June 2016 EMPLOYMENT After a slow start to 2016, the Inland Empire s labor market returned to form, in recent job figures. Seasonally adjusted nonfarm employment
714 BRADDOCK VIEW DRIVE LEMONT FURNACE, PA FOR LEASE INDUSTRIAL MARKETING FLYER
 714 BRADDOCK VIEW DRIVE LEMONT FURNACE, PA 15456 FOR LEASE INDUSTRIAL MARKETING FLYER PENN STATE FAYETTE THE EBERLY CAMPUS 714 BRADDOCK VIEW DRIVE YOUR NEW LOCATION GREATER UNIONTOWN BUSINESS PARK PARK
1636 NORTH VENTURA AVENUE
 1636 NORTH VENTURA AVENUE VENTURA, CA 93001 OFFERING MEMORANDUM N O N - E N D O R S E M E N T A N D D I S C L A I M E R N O T I C E Non-Endorsements Marcus & Millichap is not affiliated with, sponsored
1636 NORTH VENTURA AVENUE
 1636 NORTH VENTURA AVENUE VENTURA, CA 93001 OFFERING MEMORANDUM N O N - E N D O R S E M E N T A N D D I S C L A I M E R N O T I C E Non-Endorsements Marcus & Millichap is not affiliated with, sponsored
. Excellent location near Kansas Speedway/Village
 FOR SALE 220 Acres Master Planned Multifamily and Commercial Near Kansas Speedway Kansas Highway 7 126th Street SITE State Avenue The Plaza at Village West Legends Outlets Community America Ballpark Sporting
TABLE OF CONTENTS. Borrower/Client. File No. Property Address th Ave. Lender. City of Fulton. City of Fulton. Invoice...
 File No. 03-30-12-03 5000 16th Ave City Fulton County Whiteside State IL Zip Code TABLE OF CONTENTS Invoice... 1 Summary of Salient Features... 2 USPAP Identification... 3 GP Land... 4 Additional Comparables
AVAILABLE SEE INSIDE FOR MORE INFORMATION! MAJOR PRICE REDUCTION FRENCH BROAD PLACE CONDOMINIUMS BREVARD NC
 MAJOR PRICE REDUCTION SEE INSIDE FOR MORE INFORMATION! French Broad Place Condominiums First Bank ( Seller ), through as its exclusive agent, is soliciting offers for the purchase of multiple condo units
Cycle Monitor Real Estate Market Cycles Third Quarter 2017 Analysis
 Cycle Monitor Real Estate Market Cycles Third Quarter 2017 Analysis Real Estate Physical Market Cycle Analysis of Five Property Types in 54 Metropolitan Statistical Areas (MSAs). Income-producing real
CONTENTS. Executive Summary 1. Southern Nevada Economic Situation 2 Household Sector 5 Tourism & Hospitality Industry
 CONTENTS Executive Summary 1 Southern Nevada Economic Situation 2 Household Sector 5 Tourism & Hospitality Industry Residential Trends 7 Existing Home Sales 11 Property Management Market 12 Foreclosure
Office Market Continues to Improve
 Research & Forecast Report LAS VEGAS OFFICE Q3 2016 Office Market Continues to Improve > > Southern Nevada s office market is improving at a steady rate > > Net absorption has been positive in twelve of
Dear Valuation Professional
 Dear Valuation Professional First American Mortgage Solutions LLC has a new product offering that we would like you to consider adding to your list of services with us - (Property Assessment Collateral
November An updated analysis of the overall housing needs of the City of Aberdeen. Prepared by: Community Partners Research, Inc.
 City of Aberdeen HOUSING STUDY UPDATE November 2010 An updated analysis of the overall housing needs of the City of Aberdeen Prepared by: Community Partners Research, Inc. nd 10865 32 Street North Lake
DESCRIPTION OF IMPROVEMENTS
 DESCRIPTION OF IMPROVEMENTS PROPERTY TYPE: Class "B" suburban office building NUMBER OF STORIES: 1 YEAR BUILT/RENOVATED: 1995/2013 RENTABLE BUILDING AREA: ON SITE PARKING: STRUCTURE: EXTERIOR WALLS: WINDOWS:
NET LEASE INVESTMENT OFFERING MATTRESS DIRECT
 MATTRESS DIRECT 4680 Interstate 55 North Jackson, MS 39211 TABLE OF CONTENTS TABLE OF CONTENTS I. Executive Profile Executive Summary Investment Highlights Property Overview II. Location Overview Photographs
Existing Conditions: Economic Market Assessment
 Existing Conditions: Economic Market Assessment Introduction The US 24/40 Corridor Study examined existing conditions as they related to economic and commercial market assessments, existing land use, and
Time for Retail to Take Stock
 Q1 2013 RETAIL LAS VEGAS NEVADA RESEARCH & FORECAST REPORT Time for Retail to Take Stock It is heartening to say, after five years of a bad economy, that the first quarter of 2013 s 119,649 square feet
APPRAISAL OF 1117 MONROE STREET, VICKSBURG, MS 39180
 APPRAISAL OF 1117 MONROE STREET, VICKSBURG, MS 39180 CLIENT/INTENDED USER: GLENN TRIPLETT INTENDED USE/USER: TO ASSIST THE CLIENT IN MAKING A PURCHASING DECISION. THIS REPORT IS NOT INTENDED FOR ANY OTHER
CENTRE STREET
 Offering Memorandum 3945-51 CENTRE STREET San Diego, CA 92103 N O N - E N D O R S E M E N T A N D D I S C L A I M E R N O T I C E Non-Endorsements Marcus & Millichap is not affiliated with, sponsored by,
SOUTHWEST CORNER OF CAPITOL DRIVE & 124TH STREET BROOKFIELD (SUBURBAN MILWAUKEE), WISCONSIN
, WISCONSIN") SOUTHWEST CORNER OF CAPITOL DRIVE & 124TH STREET BROOKFIELD (SUBURBAN MILWAUKEE), WISCONSIN INVESTMENT HIGHLIGHTS S U B J E C T O F F E R I N G Mid-America Real Estate Corporation, in cooperation with
SOUTHWEST CORNER OF CAPITOL DRIVE & 124TH STREET BROOKFIELD (SUBURBAN MILWAUKEE), WISCONSIN INVESTMENT HIGHLIGHTS S U B J E C T O F F E R I N G Mid-America Real Estate Corporation, in cooperation with
Industrial Real Estate Portfolio
 Industrial Real Estate Portfolio Portfolio Coverage Page 7 6565 Echo Avenue, Reno, NV Property Summary Address: Size (SF): Office Finish: HVAC Space: Year Built: 2003 Site Area: 6565 Echo Avenue Reno,
Housing Price Forecasts. Illinois and Chicago PMSA, January 2018
 Housing Price Forecasts Illinois and Chicago PMSA, January 2018 Presented To Illinois Realtors From R E A L Regional Economics Applications Laboratory, Institute of Government and Public Affairs University
MARKET AREA UPDATE Report as of: 1Q 2Q 3Q 4Q
 MARKET AREA UPDATE Report as of: 1Q 2Q 3Q 4Q Year: 2013 Market Area (City, State): Washington DC Metropolitan Area Provided by (Company / Companies): LONG & FOSTER REAL ESTATE, INC. What are the most significant
2012 Profile of Home Buyers and Sellers New Jersey Report
 Prepared for: New Jersey Association of REALTORS Prepared by: Research Division December 2012 Table of Contents Introduction... 2 Highlights... 4 Conclusion... 7 Report Prepared by: Jessica Lautz 202-383-1155
Kestrel Air Park (Office and Hangar)
") Kestrel Air Park (Office and Hangar) 116 Kestrel Drive, Spring Branch, TX 78070 For Lease R E O C 8023 Vantage Drive, Suite 1200 San Antonio TX 78230 reocsanantonio.com Table of Contents SECTION 1 SECTION
Kestrel Air Park (Office and Hangar) 116 Kestrel Drive, Spring Branch, TX 78070 For Lease R E O C 8023 Vantage Drive, Suite 1200 San Antonio TX 78230 reocsanantonio.com Table of Contents SECTION 1 SECTION
CVS Pharmacy Ground Lease Merced, CA
 FILE PHOTO OFFERING MEMORANDUM CVS Pharmacy Ground Lease Merced, CA www.preservewestcapital.com TABLE OF CONTENTS PROPERTY HIGHLIGHTS 1 PROPERTY INFORMATION 2 TENANT INFORMATION 3 SITE PLAN 4 PROGRESS
MARKET AREA UPDATE Report as of: 1Q 2Q 3Q 4Q
 MARKET AREA UPDATE Report as of: 1Q 2Q 3Q 4Q Year: 2013 Market Area (City, State): Arlington, Virginia Provided by (Company / Companies): McEnearney Associates, Inc. Realtors What are the most significant
Minneapolis Trends. Permitted residential conversions, remodels and additions. Permitted non-residential conversions, remodels and additions
 Minneapolis Trends A Quarterly Overview of Socioeconomic & Housing Trends in Minneapolis Highlights for the third quarter of 213 third quarter 213 Labor force 219,777 residents change from 3Q-13 2Q-13
Across-the-Fence Value and Hostage Occupancy Agreements
 Across-the-Fence Value and Hostage Occupancy Agreements EUCI Conference: Electric Transmission Projects San Diego, California September 19, 2016 John T. Schmick Shenehon Company 2 What is the goal of valuation
Las Vegas Valley Executive Summary
 ARROYO MARKET SQUARE Las Vegas Valley Executive Summary Retail Market 4th Quarter 2013 THE DISTRICT AT GREEN VALLEY RANCH January 23, 2014 Re: Commercial Real Estate Survey: 4th Quarter, 2013 Dear Reader,
116 Kestrel Drive Vantage Drive, Suite 1200 San Antonio TX reocsanantonio.com. For Sale or Lease R E OC
 Office Building Hangar 116 Kestrel Drive Spring Branch, TX 78070 Office Building with Optional Hangar For Sale or Lease 8023 Vantage Drive, Suite 1200 San Antonio TX 78230 reocsanantonio.com Table of Contents
Chicago s industrial market thrives during the second quarter.
 Economic Overview CHICAGO INDUSTRIAL MARKET MONITOR SECOND QUARTER 2015 Chicago s industrial market thrives during the second quarter. Demand across the Chicago industrial market remains high sending absorption
Minneapolis St. Paul Residential Real Estate Index
 University of St. Thomas Minneapolis St. Paul Residential Real Estate Index Welcome to the latest edition of the UST Minneapolis St. Paul Residential Real Estate Index. The University of St Thomas Residential
APPRAISING COMMERCIAL INVESTMENT PROPERTY
 APPRAISING COMMERCIAL INVESTMENT PROPERTY Cydney G. Bender-Reents, MAI President Jared M. Calabrese, MAI Senior Appraiser YOUR HOUSE AS SEEN BY: Yourself Your Lender YOUR HOUSE AS SEEN BY: Your Buyer Your
Exterior Only Inspection Residential Appraisal Report File #
 SUBJECT Summary Appraisal Report Brian J. Davis & Associates Exterior Only Inspection Residential Appraisal Report File # Page #3 The purpose of this summary appraisal report is to provide the lender/client
Mike Dalton Jr. and Associates. Christina Adams INVOICE NUMBER Mike Dalton Jr. and Associates 8191 Wethersfield Drive. PB125 Germantown, TN 38138
 Mike Dalton Jr. and Associates FROM: INVOICE Christina Adams INVOICE NUMBER Mike Dalton Jr. and Associates 8191 Wethersfield Drive Germantown, TN 38138 DATE 08/14/2016 Telephone Number: (901) 674-0239
The Seattle MD Apartment Market Report
 The Seattle MD Apartment Market Report Volume 16 Issue 2, December 2016 The Nation s Crane Capital Seattle continues to experience an apartment boom which requires constant construction of new units. At
Minneapolis Trends. Permitted residential conversions, remodels and additions. Permitted non-residential conversions, remodels and additions
 Minneapolis Trends A Quarterly Overview of Socioeconomic & Housing Trends in Minneapolis Highlights for the fourth quarter of 214 fourth quarter 214 Labor force 219,419 residents change from 4Q-14 3Q-14
OFFERING MEMORANDUM LONG TERM INDUSTRIAL, OFFICE AND FLEX PORTFOLIO SALE LEASEBACK
 LONG TERM INDUSTRIAL, OFFICE AND FLEX PORTFOLIO SALE LEASEBACK Main Buiding 2917 Latoria Street, Franklin Park STREAM Capital Partners, LLC License No.: 481.012052 Lic: 475.017525 Lic: 475.152062 TABLE
Housing Price Forecasts. Illinois and Chicago PMSA, August 2016
 Housing Price Forecasts Illinois and Chicago PMSA, August 2016 Presented To Illinois Association of Realtors From R E A L Regional Economics Applications Laboratory, Institute of Government and Public
Demonstration Appraisal Report Utilizing a Form Report
 Demonstration Appraisal Report Utilizing a Form Report National Association of Independent Fee Appraisers 330 North Wabash Avenue, Suite 2000 Chicago, IL 60611 Phone: (312) 321-6830 Fax: (312) 673-6652
DEER CREEK ESTATES DEVELOPMENT SITE
 DEER CREEK ESTATES DEVELOPMENT SITE For more information contact: 1-815-741-2226 mgoodwin@bigfarms.com Goodwin & Associates Real Estate, LLC is an AGENT of the SELLERS. County: Will Township: Wilmington
Median Income and Median Home Price
 Homeownership Remains Unaffordable; Rental Affordability Showing Signs of Improvement Richard E. Taylor, Research Manager at MaineHousing MaineHousing has released the 217 Maine Homeownership and Rental
OFFERING MEMORANDUM GEORGETOWN APARTMENTS Tallywood Drive, Fayetteville, NC
 OFFERING MEMORANDUM GEORGETOWN APARTMENTS 3211 Tallywood Drive, Fayetteville, NC N O N - E N D O R S E M E N T A N D D I S C L A I M E R N O T I C E Non-Endorsements Marcus & Millichap is not affiliated
The Remodeling Market International Builders Show January 21, Paul Emrath VP-Survey and Housing Policy Research
 The Remodeling Market International Builders Show January 21, 2010 Paul Emrath VP-Survey and Housing Policy Research Outline NAHB Remodeling Market Index (RMI) NAHB forecasts Legislative/regulatory developments