The Remodeling Market International Builders Show January 21, Paul Emrath VP-Survey and Housing Policy Research
|
|
|
- Blake O’Brien’
- 6 years ago
- Views:
Transcription

1 The Remodeling Market International Builders Show January 21, 2010 Paul Emrath VP-Survey and Housing Policy Research
2 Outline NAHB Remodeling Market Index (RMI) NAHB forecasts Legislative/regulatory developments Impacts of remodeling on income, jobs, taxes
3 Remodeling Market Index Quarterly survey of professional remodelers 400+ responses per quarter (500+ for 2009 Q4) Series of questions on whether conditions have improved or gotten worse since previous quarter Two indices: Current conditions (remodeler ratings of major adds & alterations, minor adds & alterations, maintenance & repair) Indicators of future activity (appointments for proposals, calls for bids, commitments for work, backlog)

4 Index NAHB Remodeling Market Index (Seasonally Adjusted): Current Market Conditions 60 better/worse line st Qtr st Qtr st Qtr st Qtr st Qtr st Qtr st Qtr st Qtr st Qtr Source: NAHB Economics and Housing Policy Group: Remodeling Market Index, Qrtly. Survey of Remodelers.
5 Index NAHB Remodeling Market Index (Seasonally Adjusted): Indicators of Future Activity 60 better/worse line st Qtr st Qtr st Qtr st Qtr st Qtr st Qtr st Qtr st Qtr st Qtr Source: NAHB Economics and Housing Policy Group: Remodeling Market Index, Qrtly. Survey of Remodelers.
6 NAHB Remodeling Market Index (Seasonally Adjusted) 2009 Q1 Q2 Q3 Q4(P) CURRENT MARKET CONDITIONS Major Additions And Alterations ($25,000 or more) Minor Additions And Alterations (Less than $25,000) Maintenance and Repair INDICATORS OF FUTURE ACTIVITY Calls for Bids Amount of Work Committed for next 3 months Backlog of Remodeling Jobs Appointments for Proposals Source: NAHB Economics and Housing Policy Group: Remodeling Market Index, Qrtly. Survey of Remodelers. P = Preliminary Numbers
7 NAHB Forecasts Residential Fixed Investment (RFI) a component of GDP Remodeling a component of RFI Less information available due to cutbacks at Census Bureau SORAR discontinued No maintenance and repairs No improvements in rental properties Lobbying efforts for new Census remodeling survey ongoing NAHB forecasts Census series, integrates into GDP forecast
8 20% Real GDP Growth Q/Q Percent Change, SAAR 15% 10% 5% 0% -5% -10%
9 Residential Fixed Investment 900 Billions 2005$, SAAR
10 Residential Remodeling: Owner-Occupied Improvements 160 Billions 2005 $, SAAR
11 Influences on Remodeling Markets Generally weak economy labor markets consumer confidence Problems with home equity loans Values fall, equity reduced Sometimes made worse by faulty appraisals Even with equity, lenders reluctant Competition from builders diversifying into remodeling Legislative/regulatory developments Lead based paint Green remodeling Remodeling induced by Home Buyer Tax Credit
12 10 Employment Change Q/Q Percent Change, SAAR (00,000)
13 12 Unemployment Rate Percent
14 Consumer Confidence/Sentiment Conference Board Consumer Confidence Index U of Michigan Consumer Sentiment Index
15 200 House Prices January 2001 = Case-Shiller FHFA
16 5.0 House Prices Relative to Income Median House Price / Median Income Avg =
17 House Prices and Income Trend, Peak and Current 0% 20% 40% 60% 80% 100% 120% 140% 160% 180% 200% 220% 240% U S O H M I N V G A N H I N A R A L N M W Y A Z A K C A W V M T M O C O K S I L I D C T M N T N R I M S H I S D K Y N E N D F L O K M E S C I A U T T X V T D E N C P A M A L A V A W I W A O R D C N Y M D N J Percentage of Historical Trend Source: US Census Bureau, National Association of Realtors FL CA NV AZ


18 NAHB HMI Builder Survey: Have you experienced appraisals Below sales price? Below cost? No, 41% Yes, 59% No, 44% Yes, 56%

19 Survey of Builders: If diversified in 2009 or plan to diversify during in 2010, into which activities? Source: BEC Survey, Dec NAHB Echp. Competition from Builders NAHB HMI Builder Survey: If diversified in 2009 or plan to diversify during 2010, into which activities? Residential remodeling 66% Commercial remodeling 26% Light commercial construction 24% Subcontracting Source: BEC Survey, Dec NAHB Echp. Owning/operating/managing real estate Other 17% 22% 25% No, no plans 35% Source: BEC Survey, Dec NAHB Echp.
20 Lead Based Paint Regulation Rule will take effect on April 22, 2010 As first proposed, mandated lead-safe work practices in pre homes with pregnant women or children work area containment prohibited practices waste disposal clean-up In October, EPA proposed extension to cover all pre-1978 housing, irrespective of occupants Cost of compliance could discourage home owners from hiring professional remodelers


21 Professional Remodeling Jobs And Units Targeted by Lead Paint Regulation Jobs in Units Built 1980 or Later 31% Jobs in Units Built Before % Source: NAHB tabulations of data from the 2007 American Housing Survey, U.S. Census Bureau and HUD
22 Green Remodeling American Existing Home Retrofit Tax Credit (25C) Extended through 2010 & increased by ARRA legislation 30 percent of cost, up to $1,500 Wind, Solar, Geothermal and Fuel Cell Tax Credit (25D) 30 percent of cost, no cap In effect through 2016 Pending federal legislation (e.g., Home Star Retrofit Bill) State programs RMI survey periodically contains special green-related questions Most recently, Q3 2009

23 Calls for work to improve the energy efficiency of the home during the last 3 months Increased significantly 5% Increased somewhat 25% No change 61% Decreased somewhat 5% Decreased significantly 4% Source: Remodelers Market Index Special Questions, 3 rd Qtr. 2009, NAHB EcHp. 0% 10% 20% 30% 40% 50% 60% 70%
24 Calls for work to improve the energy efficiency of the home during the last 3 months - HISTORY rd Quarter 3 rd Quarter 3 rd Quarter 4 th Quarter Increased Significantly 5% 5% 2% 3% Increased Somewhat No Change Decreased Somewhat Decreased Significantly Responses Source: Remodelers Market Index Special Questions, 3 rd Qtr. 2009, NAHB EcHp.

25 Top 5 energy related savings products commonly installed during the past 3 months Low-e windows 87% Upgraded insulation 70% Argon gas windows 60% Insulated exterior doors 58% High efficiency HVAC systems 53% Source: Remodelers Market Index Special Questions, 3 rd Qtr. 2009, NAHB EcHp. 0% 20% 40% 60% 80% 100%

26 Top energy related savings materials and products Increase in use from On demand water heaters 13% 33% UV coated windows 25% 39% Argon gas windows 49% 60% High efficiency kitchen appliances 34% 43% Source: Remodelers Market Index Special Questions, 3 rd Qtr. 2009, NAHB EcHp. 0% 20% 40% 60% 80%

27 Green Practices Adopted by Remodelers Use material/products easily available Use energy efficient windows Use energy star appliances Use alternative to dimensional lumber Use OSB rather than plywood 94% 91% 86% 83% 78% Use recycled and recyclable products Use water sense fixtures and/or toilets Waste management system 51% 61% 70% Other 5% Source: Remodelers Market Index Special Questions, 3 rd Qtr. 2009, NAHB EcHp. 0% 20% 40% 60% 80% 100%

28 Percent of jobs completed in 2009 using the federal 25C & 25D energy efficiency tax credits 0% 40% 1 % to 24% 45% 25% to 49% 10% 50% to 74% 3% Median = 5% 75% or more 2% 0% 10% 20% 30% 40% 50% Source: Remodelers Market Index Special Questions, 3 rd Qtr. 2009, NAHB EcHp.
29 Home Buyer Tax Credit $8,000 credit for first-time buyers expired after Nov 2009 Worker, Homeownership, and Business Assistance Act Extended credit through sales contracts signed by April 30, closed by June 30, 2010 Relaxed income limits New $6,500 credit for repeat buyers Impact on remodeling?
30 Analyzing a Home Buyer Tax Credit: Buyers spend more than average on remodeling Single-Family Detached Home Owners' Average Annual Spending on Various Items 1st Year After Buying Home New Home Existing Home Non- Moving Ow ners Property Alterations & Repairs: Bathroom/ Kitchen/ Room addition $0 $127 $72 Other addition $0 $220 $117 Bathroom/Kitchen remodeling $231 $695 $325 Other interior remodeling $44 $394 $130 Painting $158 $266 $119 New fence $219 $128 $45 New drivew ay or w alk $339 $80 $51 Other outside addition or alteration $1,377 $410 $179 Total alterations and repairs $4,275 $4,642 $2,413 Source: NAHB tabulations of data from the Consumer Expenditure Survey, U.S. Bureau of Labor Statistics. See Spending Patterns of Home Buyers
31 Annual Spending on Repairs and Alterations: Differences persist after statistically controlling for characteristics of buyers Typical New Home Buyer After Buying a New Home If Not Moving Difference $4,965 $4,225 $740 Typical Existing Home Buyer After Buying an Existing Home If Not Moving Difference $5,965 $3,955 $2,010 Source: Results of NAHB statistical model based on data from the Consumer Expenditure Survey, U.S. Bureau of Labor Statistics. See Spending Patterns of Home Buyers
32 Effects of Extended Home Buyer Tax Credit Number of new first-time buyers as a result of the policy Number of additional trade-up buyers as a result of the policy Credit users for whom the incentive was not necessary 46,437 69,656 5,267,192 Summary of Estimated Impacts, First Year After Enactment 1. Changes in sales and acquisitions A. Initial induced sales and acquistions 116,093 housing units B. Ripple sales from displaced owners buying homes 63,286 housing units C. Vacant units absorbed 26,403 housing units D. Rented units sold to owner-occupiers 20,109 housing units 2. Net changes in new construction A. Additional single family homes built 38,472 housing units B. Additional multifamily condominiums built 1,411 housing units C. Additional manufactured housing produced 2,772 housing units D. Impact on multifamily rental production -751 housing units E. Aggregate net change in the value of new construction $9,839 million 3. Impact of additional home transactions A. Broker services $1,435 million B. Transaction-related spending $945 million C. Property alterations $124 million D. Appliances and furnishings $180 million E. Aggregate increase in spending $2,684 million Source: NAHB models that estimate the Economic Effects of a Policy to Stimulate Home Buying
33 Extended Home Buyer Tax Credit: Impact on Remodeling Induced spending on remodeling (in $million) First-time buyers of new single family homes built for sale 1.6 First-time owners of new custom single family homes 0.3 First-time buyers of existing single family homes 27.6 Trade-up buyers of new single family homes built for sale 9.6 Trade-up owners of new custom single family homes 3.3 Trade-up buyers of existing single family homes 81.5 Total Source: NAHB models that estimate the Economic Effects of a Policy to Stimulate Home Buying
34 Economic Impacts of Remodeling NAHB has national and local impact estimates to avoid confusion, pick one & stick with it Key impacts estimated: income jobs taxes Lot of interest in jobs recently Information available on web site
35 Presentation Title 35
36 Presentation Title 36
37 Presentation Title 37
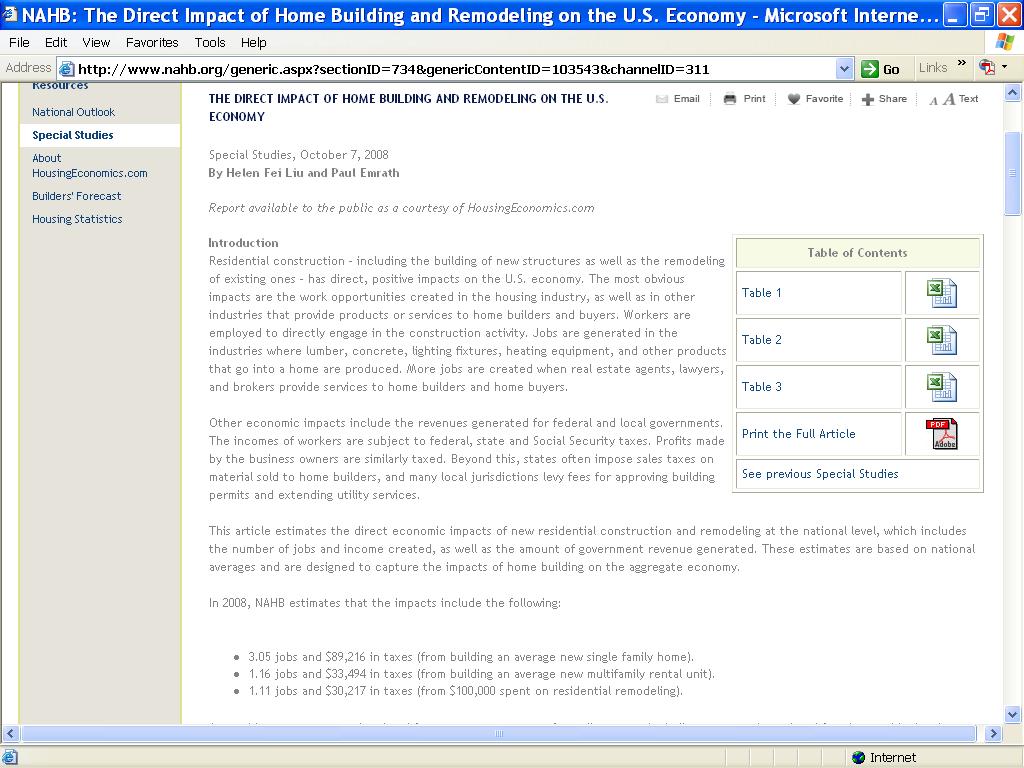
38 Direct Impact of Home Building and Remodeling on the U.S. Economy Table 2. Income and Employment Impacts of New Residential Construction and Remodeling on the U.S. Economy in 2008 Number of Full-time Jobs Wages and Salaries Proprietors' Income Corporate Profits Total Income $100,000 Spent on Remodeling All industries 1.11 $52,709 $13,810 $16,147 $82,667 Construction 0.54 $25,573 $6,601 $4,232 $36,406 Manufacturing 0.18 $8,136 $824 $4,529 $13,489 Wholesale and retail, Transportation and warehousing 0.16 $6,432 $849 $2,307 $9,588 Finance and insurance 0.02 $1,487 $71 $1,459 $3,017 Real estate and rental and leasing 0.01 $315 $1,652 $758 $2,725 Professional, Management, administrative services 0.12 $6,970 $2,191 $764 $9,924 Other services 0.09 $3,797 $1,623 $2,098 $7,518 Source: NAHB estimates, b ased primarily on the data from the U.S. Bureau of Economic Analysis.
39 Direct Impact of Home Building and Remodeling on the U.S. Economy Table 3. Fiscal Impacts of of New Residential Construction and Remodeling in 2008 Average New Single Family Home Average New Multifamily Rental Unit $100,000 of Remodeling Total government revenue generated $89,216 $33,494 $30,217 Federal $66,467 $24,867 $23,656 Income taxes paid by employees $11,791 $4,452 $4,271 Income taxes paid by businesses $30,053 $11,120 $10,485 Social security taxes $22,414 $8,468 $8,124 Taxes on production & imports $2,209 $828 $776 State and local $22,749 $8,628 $6,561 Sales taxes $5,169 $1,987 $1,908 Income taxes paid by employees $3,080 $1,163 $1,116 Income taxes paid by businesses $6,586 $2,434 $2,288 Permit, hook-up, impact, etc. fees $7,915 $3,043 $1,250 Source: NAHB estimates, b ased primarily on the data from the U.S. Bureau of Economic Analysis.
40 Jobs and Income (in $Million) from Remodeling Activity Induced by Extended Home Buyer Tax Credit FTE (full time equivalent) workers Wages and Salaries Source: NAHB models that estimate the Economic Effects of a Policy to Stimulate Home Buying Small Business Persons' income Corporate Profits All industries 1, Agriculture, forestry, fishing and hunting Mining Utilities Construction Manufacturing Wholesale trade Retail trade Transportation and warehousing Information Finance, insurance, real estate, rental, leasing Professional and business services Education, health care, and social assistance Arts, entertainment, recreation, food services Other services, except government Government
41 Thank You
The Local Impact of Home Building in Douglas County, Nevada. Income, Jobs, and Taxes generated. Prepared by the Housing Policy Department
 The Local Impact of Home Building in Douglas County, Nevada Income, Jobs, and Taxes generated = Prepared by the Housing Policy Department May 2007 National Association of Home Builders 1201 15th Street,
Market Trends and Outlook
 Residential Remodeling Market Trends and Outlook Kermit Baker Remodeling Futures Conference April 3, 2012 Remodeling Market Overview 1. Home improvement spending totaled an estimated $290 billion last
Remodeling Trends and Outlook
 Remodeling Trends and Outlook Kermit Baker Remodeling Futures Conference October 16, 2007 www.jchs.harvard.edu Recent Remodeling Trends Growth in remodeling spending began to ease in Q3-2006. After Strong
H12 Economic Impact Analysis: Hickory Creek
 H12 Economic Impact Analysis: Hickory Creek 2012 Executive Summary $5.3 million of local income generated from Dallas Habitat s construction efforts in Hickory Creek 117 new jobs generated in construction
Housing Price Forecasts. Illinois and Chicago PMSA, August 2017
 Housing Price Forecasts Illinois and Chicago PMSA, August 2017 Presented To Illinois Realtors From R E A L Regional Economics Applications Laboratory, Institute of Government and Public Affairs University
Housing Price Forecasts. Illinois and Chicago PMSA, June 2012
 Housing Price Forecasts Illinois and Chicago PMSA, June 2012 Presented To Illinois Association of REALTORS From R E A L Regional Economics Applications Laboratory, Institute of Government and Public Affairs
Housing Price Forecasts. Illinois and Chicago PMSA, April 2013
 Housing Price Forecasts Illinois and Chicago PMSA, April 2013 Presented To Illinois Association of Realtors From R E A L Regional Economics Applications Laboratory, Institute of Government and Public Affairs
CBER-LIED Report on Housing Market Conditions
 CBER-LIED Report on Housing Market Conditions CBER and Lied Institute Report Volume 62, 1st, Housing Markets Conditions in 1 st Beginning with this issue of the CBER-LIED Report on Housing Market Conditions,
Housing Price Forecasts. Illinois and Chicago PMSA, January 2019
 Housing Price Forecasts Illinois and Chicago PMSA, January 2019 Presented To Illinois Realtors From R E A L Regional Economics Applications Laboratory, Institute of Government and Public Affairs University
CONTENTS. Executive Summary 1. Southern Nevada Economic Situation 2 Household Sector 5 Tourism & Hospitality Industry
 CONTENTS Executive Summary 1 Southern Nevada Economic Situation 2 Household Sector 5 Tourism & Hospitality Industry Residential Trends 7 Existing Home Sales 11 Property Management Market 12 Foreclosure
Housing Price Forecasts. Illinois and Chicago PMSA, January 2018
 Housing Price Forecasts Illinois and Chicago PMSA, January 2018 Presented To Illinois Realtors From R E A L Regional Economics Applications Laboratory, Institute of Government and Public Affairs University
Housing Price Forecasts. Illinois and Chicago PMSA, October 2014
 Housing Price Forecasts Illinois and Chicago PMSA, October 2014 Presented To Illinois Association of Realtors From R E A L Regional Economics Applications Laboratory, Institute of Government and Public
Housing Price Forecasts. Illinois and Chicago PMSA, March 2016
 Housing Price Forecasts Illinois and Chicago PMSA, March 2016 Presented To Illinois Association of Realtors From R E A L Regional Economics Applications Laboratory, Institute of Government and Public Affairs
Estimating National Levels of Home Improvement and Repair Spending by Rental Property Owners
 Joint Center for Housing Studies Harvard University Estimating National Levels of Home Improvement and Repair Spending by Rental Property Owners Abbe Will October 2010 N10-2 2010 by Abbe Will. All rights
Virginia Real Estate
 Real Estate Economic Impact Analysis A special report from the and the George Mason University Center for Regional Analysis ABOUT THIS REPORT The real estate industry is recognized as a key contributor
2018 Real Estate Forecast Breakfast. Real Estate Market Update
 2018 Real Estate Forecast Breakfast Central Oregon Association of REALTORS Real Estate Market Update Paul C. Bishop, PhD, CBE Vice President, Research NATIONAL ASSOCIATION OF REALTORS February 22, 2018
Addressing the Impact of Housing for Virginia s Economy
 Addressing the Impact of Housing for Virginia s Economy A REPORT FOR VIRGINIA S HOUSING POLICY ADVISORY COUNCIL NOVEMBER 2017 Appendix Report 1: Economic Impacts of Virginia s Housing Industry Terry Clower
Attachment 3. Guelph s Housing Statistical Profile
 Attachment 3 Guelph s Housing Statistical Profile Table of Contents 1. Population...1 1.1 Current Population (26)...1 1.2 Comparative Growth, Guelph and Ontario (21-26)...1 1.3 Total Household Growth (21
Housing and Economy Market Trends
 Housing and Economy Market Trends Mainstreet Organization Prices of single-family, detached homes in suburban Chicago increased 12.1 percent in May 2014 compared with the same period a year ago. Overall,
INVESTOR PRESENTATION MAY 2013
 INVESTOR PRESENTATION MAY 2013 Forward-Looking Statements This presentation includes forward-looking statements. These statements are subject to a number of risks, uncertainties and other factors that
Monthly Indicators. Monthly Snapshot. July % + 7.8% %
 Monthly Indicators For residential real estate activity by members of the Florida REALTORS 2012 A few short years ago, housing was considered a headwind to economic recovery. Today, housing is seen as
Connecticut First Nine Months Housing Report 2014
 Connecticut First Nine Months Housing Report 2014 First Nine Months of 2014 Highlight Positive Outlook for Multi-family Home Construction Millennial buyers are finally increasing their rate of household
Housing Price Forecasts. Illinois and Chicago PMSA, March 2018
 Housing Price Forecasts Illinois and Chicago PMSA, March 2018 Presented To Illinois Realtors From R E A L Regional Economics Applications Laboratory, Institute of Government and Public Affairs University
FY General Revenue Forecast Presentation
 FY 2015-2019 General Revenue Forecast Presentation Steven A. Solomon Director of Finance February 18, 2014 Overview Current Economic Outlook National State Local FY 2014 2nd Quarter Revenue Update Five
Quick Facts. For Week Ending July 14, 2018 Publish Date: July 23, 2018 All comparisons are to % - 2.7% - 14.
 Weekly Market Report A RESEARCH TOOL FROM THE SAINT PAUL AREA ASSOCIATION OF REALTORS. BROUGHT TO YOU BY THE UNIQUE DATA-SHARING TRADITIONS OF THE REALTOR COMMUNITY For Week Ending July 14, 2018 Publish
Monthly Indicators. September Monthly Snapshot + 2.0% + 7.4% %
 Monthly Indicators For residential real estate activity by members of the Florida REALTORS 2012 Most housing metrics should follow their usual, autumnal movements higher inventory and days on market, fewer
Section 1 - Current Metro Rent Details. Asking Rent by Age Asking Rent Distribution Asking Rent Growth Rate Distribution $788 $859 $860 $931
 Section 1 - Current Metro Rent Details Asking Rent by Age Asking Rent Distribution Asking Rent Growth Rate Distribution Year Built Rent Before 1970 $516 1970-1979 $484 1980-1989 $602 1990-1999 $702 After
ECONOMIC CURRENTS. Vol. 3, Issue 1. THE SOUTH FLORIDA ECONOMIC QUARTERLY Introduction
 ECONOMIC CURRENTS THE SOUTH FLORIDA ECONOMIC QUARTERLY Introduction Economic Currents provides an overview of the South Florida regional economy. The report contains current employment, economic and real
Weekly Market Activity Report
 X0A0T Weekly Market Report A RESEARCH TOOL FROM THE MINNEAPOLIS AREA ASSOCIATION OF REALTORS BROUGHT TO YOU BY THE UNIQUE DATA-SHARING TRADITIONS OF THE REALTOR COMMUNITY For Week Ending July 14, 2018
Residential Real Estate Market Overview: April 2017 Data
 Residential Real Estate Market Overview: April 2017 Data 2017 Mark A. Melikian Chief Valuation Officer mark.melikian@summitvaluations.com 2800 River Road, Suite 460 The following is a market data summary
Monthly Indicators. Monthly Snapshot. April % % + 4.7%
 Monthly Indicators For residential real estate activity in the state of New Jersey 2018 Monthly Snapshot Many sellers and builders are in a good position for financial gains, as the economy continues to
Economic Impact Analysis: Cedar Creek Ranch Neighborhood
 2012 Economic Impact Analysis: Cedar Creek Ranch Neighborhood Dallas Area Habitat for Humanity Neighborhood Investment 9/1/2012 Executive Summary Income to local businesses was almost $1.1 million from
CONTENTS. Executive Summary. Southern Nevada Economic Situation 1 Household Sector 4 Tourism & Hospitality Industry
 CONTENTS Executive Summary Southern Nevada Economic Situation 1 Household Sector 4 Tourism & Hospitality Industry Residential Trends 6 Existing Home Sales 10 Property Management Market 11 Foreclosure Situation
Housing Price Forecasts. Illinois and Chicago PMSA, August 2016
 Housing Price Forecasts Illinois and Chicago PMSA, August 2016 Presented To Illinois Association of Realtors From R E A L Regional Economics Applications Laboratory, Institute of Government and Public
Monthly Indicators. Activity Snapshot % + 8.0% % Activity Overview New Listings Pending Sales. Closed Sales. Days on Market Until Sale
 Monthly Indicators 2018 Many sellers and builders are in a good position for financial gains, as the economy continues to favor putting existing homes on the market and building new homes for sale. While
Quarterly Economic Review
 CITY OF SIMI VALLEY Quarterly Economic Review Welcome to the Simi Valley Quarterly Review, an economic snapshot of valuable information pertaining to the Simi Valley and Ventura County area. As there is
Economic Highlights. Payroll Employment Growth by State 1. Durable Goods 2. The Conference Board Consumer Confidence Index 3
 August 26, 2009 Economic Highlights Southeastern Employment Payroll Employment Growth by State 1 Manufacturing Durable Goods 2 Consumer Spending The Conference Board Consumer Confidence Index 3 Real Estate
Visit our Publications and Open Data Catalogue to find our complete inventory of our freely available information products.
 Welcome to Mississauga Data This report and other related documents can be found at www.mississauga.ca/data. Mississauga Data is the official City of Mississauga website that contains urban planning related
Housing Price Forecasts. Illinois and Chicago PMSA, March 2017
 Housing Price Forecasts Illinois and Chicago PMSA, March 2017 Presented To Illinois Realtors From R E A L Regional Economics Applications Laboratory, Institute of Government and Public Affairs University
Economic Indicators City of Oakland
 Economic Indicators City of Oakland PREPARED BY: THE OFFICE OF ECONOMIC AND WORKFORCE DEVELOPMENT CITY OF OAKLAND JULY 2014 CITY OF OAKLAND ECONOMIC INDICATORS 1 Introduction to Quarter 1, January March
Economic and Housing Update
 Economic and Housing Update Mark Palim Vice President, Applied Economic and Housing Research Fannie Mae January 14, 2015 2012 Fannie Mae. Trademarks of Fannie Mae. Economic Activity Rebounding Solidly
Washington Market Highlights: Fourth Quarter 2017
 Washington State s Housing Market 4th Quarter 2017 Washington Market Highlights: Fourth Quarter 2017 Existing home sales declined in the fourth quarter by 0.2 percent to a seasonally adjusted annual rate
October 1, 2017 thru September 30, 2018 Performance
 Grantee: Hillsborough County, FL Grant: B-11-UN-12-0006 October 1, 2017 thru September 30, 2018 Performance 1 Grant Number: Obligation Date: Award Date: B-11-UN-12-0006 Grantee Name: Contract End Date:
Washington Market Highlights: Third Quarter 2018
 Washington State s Housing Market 3rd Quarter 2018 Washington Market Highlights: Third Quarter 2018 Existing home sales rose in the third quarter by 0.1 percent to a seasonally adjusted annual rate of
The Local Impact of Home Building in Wenatchee, WA. Income, Jobs, and Taxes Generated
 The Local Impact of Home Building in Wenatchee, WA Income, Jobs, and Taxes Generated Prepared by the Housing Policy Department May 2010 National Association of Home Builders 1201 15th Street, NW Washington,
Minneapolis Trends. Permitted residential conversions, remodels and additions. Permitted non-residential conversions, remodels and additions
 Minneapolis Trends A Quarterly Overview of Socioeconomic & Housing Trends in Minneapolis Highlights for the third quarter of 213 third quarter 213 Labor force 219,777 residents change from 3Q-13 2Q-13
Nothing Draws a Crowd Like a Crowd: The Outlook for Home Sales
 APRIL 2018 Nothing Draws a Crowd Like a Crowd: The Outlook for Home Sales The U.S. economy posted strong growth with fourth quarter 2017 Real Gross Domestic Product (real GDP) growth revised upwards to
Making Energy Efficient Upgrades Visible in Home Appraisals. Shaun Hassel Advanced Energy
 Making Energy Efficient Upgrades Visible in Home Appraisals Shaun Hassel Advanced Energy shassel@advancedenergy.org 503-477-0469 What percentage of the nation s total energy consumption is consumed by
Residential Real Estate Market Overview: September 2017 Data
 Residential Real Estate Market Overview: September 2017 Data 2017 Mark A. Melikian Chief Valuation Officer mark.melikian@summitvaluations.com 2800 River Road, Suite 460 The following is a market data summary
Housing the Region s Future Workforce SUMMER 2018
 COMING UP SHORT Housing the Region s Future Workforce SUMMER 2018 Prepared by Greenstreet Ltd. in partnership with Lisa Sturtevant & Associates, LLC All rights reserved 2018. MONTGOMERY BOONE HENDRICKS
Monthly Indicators % - 0.2% - 9.5% Activity Overview New Listings Pending Sales. Closed Sales. Days on Market Until Sale. Median Sales Price
 Monthly Indicators 2015 Home prices were up during summer across the nation in year-over-year comparisons. With the economy on full mend, Federal Reserve Chair Janet Yellen has predicted a fine-tuning
2017 RESIDENTIAL REAL ESTATE MARKET REPORT
 2017 RESIDENTIAL REAL ESTATE MARKET REPORT Published January 26, 2018 Our market reports have been focused on the effects of low inventory on our housing market and for good reason. December 2017 marked
Economic and Housing Market Outlook ( ) October 31, Contra Costa AOR
 October 31, Contra Costa AOR") Economic and Housing Market Outlook (2012 2013) Contra Costa AOR October 31, 2012 Oscar Wei Senior Research Analyst California Association of REALTORS Overview US and California Economies California Housing
Economic and Housing Market Outlook (2012 2013) Contra Costa AOR October 31, 2012 Oscar Wei Senior Research Analyst California Association of REALTORS Overview US and California Economies California Housing
Housing Price Forecasts. Illinois and Chicago PMSA, May 2018
 Housing Price Forecasts Illinois and Chicago PMSA, May 2018 Presented To Illinois Realtors From R E A L Regional Economics Applications Laboratory, Institute of Government and Public Affairs University
Impact Fee Nexus & Economic Feasibility Study
 Impact Fee Nexus & Economic Feasibility Study Stakeholder Working Group November 12, 2015 Urban Economics Oakland Impact Fee Stakeholder Working Group November 12, 2015 INTRODUCTIONS 1 Agenda Introductions
Washington Market Highlights: Fourth Quarter 2018
 Washington State s Housing Market 4th Quarter 2018 Washington Market Highlights: Fourth Quarter 2018 Existing home sales fell in the fourth quarter by 2.7 percent to a seasonally adjusted annual rate of
MARKET AREA UPDATE Report as of: 1Q 2Q 3Q 4Q
 Year: 2013 Market Area (City, State): Baltimore Metropolitan Area MARKET AREA UPDATE Report as of: 1Q 2Q 3Q 4Q Provided by (Company / Companies): LONG & FOSTER REAL ESTATE, INC. What are the most significant
Economic Impacts of MLS Home Sales and Purchases in Canada and the Provinces
 Economic Impacts of MLS Home Sales and Purchases in Canada and the Provinces 2006 2008 FINAL REPORT April 24, 2009 Economic Impacts of MLS Home Sales and Purchases in Canada and the Provinces 2006-2008
Housing Price Forecasts. Illinois and Chicago PMSA, December 2015
 Housing Price Forecasts Illinois and Chicago PMSA, December 2015 Presented To Illinois Association of Realtors From R E A L Regional Economics Applications Laboratory, Institute of Government and Public
ECONOMIC CURRENTS. Vol. 4, Issue 3. THE Introduction SOUTH FLORIDA ECONOMIC QUARTERLY
 ECONOMIC CURRENTS THE Introduction SOUTH FLORIDA ECONOMIC QUARTERLY Vol. 4, Issue 3 Economic Currents provides an overview of the South Florida regional economy. The report presents current employment,
Monthly Indicators % % % Activity Overview New Listings Pending Sales. Closed Sales. Days on Market Until Sale. Median Sales Price
 Monthly Indicators 2018 Residential real estate activity has been relatively slow in the first quarter of 2018, yet housing is proving its resiliency in a consistently improving economy. Some markets have
City of San José. Produced by City of San José Department of Housing. Housing Market Update. First Quarter 2018
 City of San José Produced by City of San José Department of Housing Housing Market Update First Quarter 2018 Q1 2018 San José Housing Market 812 residential permits issued - 83 were for affordable housing
State of the Nation s Housing 2008: A Preview
 State of the Nation s Housing 28: A Preview Eric S. Belsky Remodeling Futures Conference April 15, 28 www.jchs.harvard.edu The Housing Market Has Suffered Steep Declines Percent Change Median Existing
Housing Price Forecasts. Illinois and Chicago PMSA, March 2019
 Housing Price Forecasts Illinois and Chicago PMSA, March 2019 Presented To Illinois Realtors From R E A L Regional Economics Applications Laboratory, Institute of Government and Public Affairs University
Housing Price Forecasts. Illinois and Chicago PMSA, April 2018
 Housing Price Forecasts Illinois and Chicago PMSA, April 2018 Presented To Illinois Realtors From R E A L Regional Economics Applications Laboratory, Institute of Government and Public Affairs University
The Local Impact of Home Building in Winnebago County, WI. Income, Jobs, and Taxes Generated
 The Local Impact of Home Building in Winnebago County, WI Income, Jobs, and Taxes Generated Prepared by the Housing Policy Department November 2010 National Association of Home Builders 1201 15th Street,
4. HOUSEHOLD INCOME AND AFFORDABILITY
 4. HOUSEHOLD INCOME AND AFFORDABILITY The analysis of the Household and Affordability section relied primarily on data from the State Department of Housing and Community Development (HCD), California Tax
Housing and the Economy: Impacts, Forecasts and Challenges
 Presentation to the Illinois Financial Forecast Forum, Lombard, IL January 19, 2018 Housing and the Economy: Impacts, Forecasts and Challenges Geoffrey J.D. Hewings, Ph.D. Director Emeritus Regional Economics
Monthly Indicators % % % Activity Overview New Listings Pending Sales. Closed Sales. Days on Market Until Sale. Median Sales Price
 Monthly Indicators 2017 tends to mark the waning of housing activity ahead of the school year. Not all buyers and sellers have children, but there are enough parents that do not want to uproot their children
Economic Impacts of MLS Home Sales and Purchases In The province of Québec and The Greater Montréal Area
 Home Sales and Purchases In The province of Québec and The Greater Montréal Area Home Sales and Purchases In The Province of Québec and The Greater Montréal Area Prepared for: The Greater Montréal Real
Pulse. prince george s CONTENTS. Changes in Employment. Top Ten Changes in Employment 3rd Quarter 2014 to 3rd Quarter 2015
 M-NCPPC Prince George s County Planning Department APRIL 2016 VOL. 1, ISSUE 4 prince george s CONTENTS Pulse Employment and Wages... 2 Employment Private Sector Employment Total Wages Average Wage Per
Existing Conditions: Economic Market Assessment
 Existing Conditions: Economic Market Assessment Introduction The US 24/40 Corridor Study examined existing conditions as they related to economic and commercial market assessments, existing land use, and
APARTMENT MARKET TRENDS
 VOLUME 21 1ST QUARTER 2018 Featuring data from the Center for Business and Economic Research The Las Vegas apartment market saw a slight increase in the average asking rent and an increase the vacancy
TENNESSEE HOUSING MARKET
 1st Quarter 212 TENNESSEE HOUSING MARKET David A. Penn, Director Business and Economic Research Center Jennings A. Jones College of Business Middle Tennessee State University This quarterly series is supported
Minneapolis Trends. Permitted residential conversions, remodels and additions. Permitted non-residential conversions, remodels and additions
 Minneapolis Trends A Quarterly Overview of Socioeconomic & Housing Trends in Minneapolis Highlights for the fourth quarter of 214 fourth quarter 214 Labor force 219,419 residents change from 4Q-14 3Q-14
Vancouver, Edmonton and Calgary Rental Market Overview
 Vancouver, Edmonton and Calgary Rental Market Overview Christina Butchart, Regional Economist April 2018 Themes 2 Calgary Employment growth has returned Employment, Calgary CMA employed (,000s) 900 850
Congressional District Report for the 115th Congress
 Congressional District Report for the 115th Congress New York District 22 Honorable Claudia Tenney (R) Congressional Districts of New York August 2018 Report National Association of REALTORS Q1/1980 Q3/1981
Housing Price Forecasts. Illinois and Chicago PMSA, September 2016
 Housing Price Forecasts Illinois and Chicago PMSA, September 2016 Presented To Illinois Realtors From R E A L Regional Economics Applications Laboratory, Institute of Government and Public Affairs University
The Economic Impact of Home Building in South Carolina. Income, Jobs, and Taxes Generated
 The Economic Impact of Home Building in South Carolina Income, Jobs, and Taxes Generated Prepared by the Housing Policy Department January 2010 National Association of Home Builders 1201 15th Street, NW
The State of the Nation s Housing
 The State of the Nation s Housing Eric S. Belsky Remodeling Futures Conference April 13, 21 www.jchs.harvard.edu Existing Home Sales Improved then Retracted, While New Home Sales Are Still in the Basement
America s Rental Housing
 America s Rental Housing The Key to a Balanced National Policy Bill Apgar Remodeling Futures Conference April 15, 2008 www.jchs.harvard.edu The Mortgage Market Meltdown Collides with Ongoing Rental Affordability
Minneapolis Trends. Permitted residential conversions, remodels and additions. Permitted non-residential conversions, remodels and additions
 Minneapolis Trends A Quarterly Overview of Socioeconomic & Housing Trends in Minneapolis Highlights for the third quarter of 214 third quarter 214 Labor force 221,16 residents change from 3Q-14 2Q-14 3Q-13
EXHIBIT A Low-Income Housing Tax Credit Selection Criteria
 EXHIBIT A Low-Income Housing Tax Credit Selection Criteria (Applicants must achieve at least 145 points in order for the application to be considered) In calculation percentages: total residential units
Rental Housing: Poised for a Return to Growth
 Rental Housing: Poised for a Return to Growth Christopher Herbert Remodeling Futures Conference November 9, 21 www.jchs.harvard.edu Summary of Ongoing Joint Center Research on The Rental Housing Market
ECONOMIC CURRENTS. Vol. 5 Issue 2 SOUTH FLORIDA ECONOMIC QUARTERLY. Key Findings, 2 nd Quarter, 2015
 ECONOMIC CURRENTS THE Introduction SOUTH FLORIDA ECONOMIC QUARTERLY Economic Currents provides an overview of the South Florida regional economy. The report presents current employment, economic and real
Pikes Peak area housing Market Statistics (As of: 2/28/2018)
") Jan-1-1 -1-1 Jan-2-2 -2-2 Jan-3-3 -3-3 -4-4 -4-5 -5-5 -6-6 -6-7 -7-7 -8-8 -8-9 -9-9 -1-1 -1-11 -11-11 -12-12 -12-13 -13-13 -14-14 -14-15 -15-15 -16-16 -16-17 -17-17 Jan-1-1 -1-1 Jan-2-2 -2-2 Jan-3-3 -3-3
Jan-1-1 -1-1 Jan-2-2 -2-2 Jan-3-3 -3-3 -4-4 -4-5 -5-5 -6-6 -6-7 -7-7 -8-8 -8-9 -9-9 -1-1 -1-11 -11-11 -12-12 -12-13 -13-13 -14-14 -14-15 -15-15 -16-16 -16-17 -17-17 Jan-1-1 -1-1 Jan-2-2 -2-2 Jan-3-3 -3-3
Housing and Mortgage Market Update
 Housing and Mortgage Market Update Views from the Top Frank E. Nothaft Vice President and Chief Economist January 8, 2015 Summary: Housing & Mortgage Market Outlook for 2015 Interest rates expected to
THE OUTLOOK FOR HOUSING IN ILLINOIS
 THE OUTLOOK FOR HOUSING IN ILLINOIS Jonathan Smoke Chief Economist January 25, 2017 NATIONAL TRENDS 2 2000.01 2000.05 2000.09 2001.01 2001.05 2001.09 2002.01 2002.05 2002.09 2003.01 2003.05 2003.09 2004.01
Economic Significance of the Property Industry to the. OTAGO Economy PREPARED FOR PROPERTY COUNCIL NEW ZEALAND BY URBAN ECONOMICS
 Economic Significance of the Property Industry to the OTAGO Economy PREPARED FOR PROPERTY COUNCIL NEW ZEALAND BY URBAN ECONOMICS 2016 ABOUT PROPERTY COUNCIL NEW ZEALAND Property Council New Zealand is
Pulse. Contents. prince george s QUARTERLY REPORT. Changes in Employment. Top Ten Changes in Employment 2nd Quarter 2015 to 2nd Quarter 2016
 Contents prince george s Pulse QUARTERLY REPORT Employment and Wages...2 Employment Private Sector Employment Total Wages Average Wage Per Worker Business Establishments Real Estate...4 Housing Market
By several measures, homebuilding made a comeback in 2012 (Figure 6). After falling another 8.6 percent in 2011, single-family
. After falling another 8.6 percent in 2011, single-family") 2 Housing Markets With sales picking up, low inventories of both new and existing homes helped to firm prices and spur new single-family construction in 212. Multifamily markets posted another strong year,
2 Housing Markets With sales picking up, low inventories of both new and existing homes helped to firm prices and spur new single-family construction in 212. Multifamily markets posted another strong year,
Market Trends Generated on 09/27/2018 Page 1 of Lorenzen Rd, Tracy, CA , San Joaquin County. Pricing Trends
 12 Lorenzen Rd, Tracy, CA 95304-8188, San Joaquin County Pricing Trends Median Sale Price to Current Value - Tax The percentage of properties that have increased or decreased in value based on the year
United States Housing, 2012
 United States Department of Agriculture United States Housing, 2012 Delton Alderman ABSTRACT Provides current and historical information on housing market in the United States. Information includes trends
Las Vegas Housing-Market Conditions
 Las Vegas Housing-Market Conditions The Center for Business and Economic Research Las Vegas Housing Market Searching for Bottom Volume 57, 4th The national housing market remained beset with problems in.
Introducing Transparency and Rationality into the Home Buying Process A RESNET Policy Proposal October 2013
 Introducing Transparency and Rationality into the Home Buying Process A RESNET Policy Proposal October 2013 Published by: Residential Energy Services Network, Inc. http://resnet.us Copyright, Residential
Young-Adult Housing Demand Continues to Slide, But Young Homeowners Experience Vastly Improved Affordability
 Young-Adult Housing Demand Continues to Slide, But Young Homeowners Experience Vastly Improved Affordability September 3, 14 The bad news is that household formation and homeownership among young adults
City of Chicago Affordable Housing Plan Fourth Quarter Progress Report April 8, 2010
 Affordable Housing Plan 2009-2013 2009 Fourth Quarter Progress Report April 8, 2010 2009 Production Commitments In 2009, DCD had a goal to commit more than $324 million to create or preserve 10,500 units
Pikes Peak area housing Market Statistics (As of: 9/30/2018)
") $156,25 $184, $174,697 $177,2 $21,53 $185,83 $173, $178,29 $172,25 $212,75 $21,95 $226,692 $197,5 $199, $196, $28, $25, $223,95 $216,75 $29,527 $234,9 $218,82 $229,74 $235,518 $231,457 $255, $259,11 $269,98
$156,25 $184, $174,697 $177,2 $21,53 $185,83 $173, $178,29 $172,25 $212,75 $21,95 $226,692 $197,5 $199, $196, $28, $25, $223,95 $216,75 $29,527 $234,9 $218,82 $229,74 $235,518 $231,457 $255, $259,11 $269,98
Rent Stabilization, Vacancy Decontrol and Reinvestment in Rental Property in Berkeley, California
 Rent Stabilization, Vacancy Decontrol and Reinvestment in Rental Property in Berkeley, California REVISED FINAL REPORT July 16, 2012 Jay Kelekian, Executive Director Stephen Barton, Ph.D., Project Manager
Economic Highlights. Retail Sales Components 1. University of Michigan Consumer Sentiment Index 2. Industrial Production and Capacity Utilization 3
 November 17, 2010 Economic Highlights Consumer Spending Retail Sales Components 1 University of Michigan Consumer Sentiment Index 2 Manufacturing Industrial Production and Capacity Utilization 3 Real Estate