2018 SECOND QUARTER RESIDENTIAL REAL ESTATE SALES REPORT Westchester, Putnam, Rockland and Orange Counties, New York
|
|
|
- Hilary Ball
- 5 years ago
- Views:
Transcription
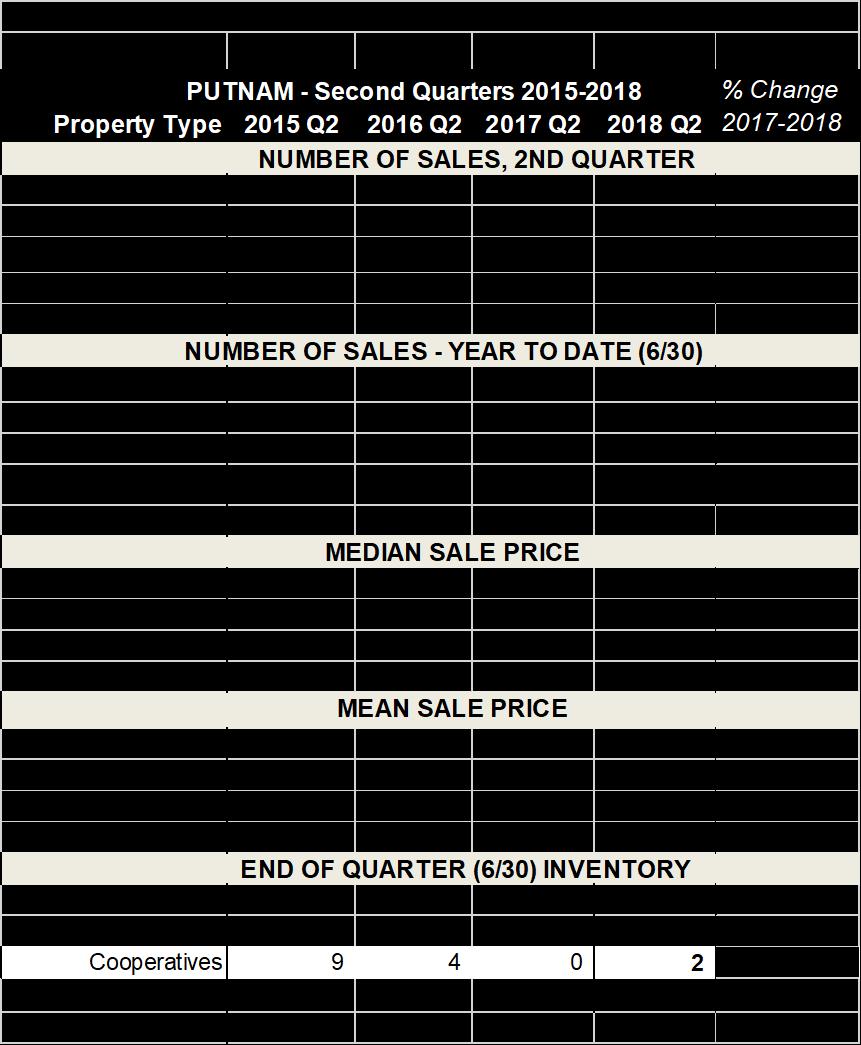
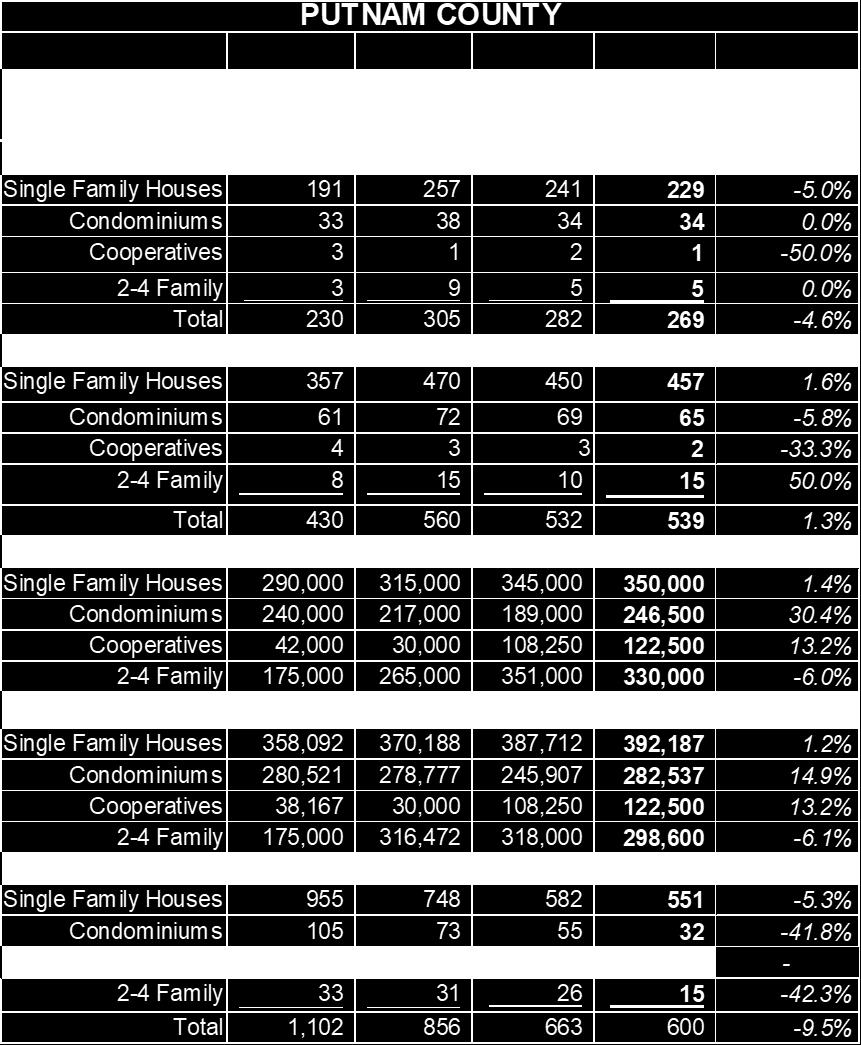
1 July 5, SECOND QUARTER RESIDENTIAL REAL ESTATE SALES REPORT Westchester, Putnam, Rockland and Orange Counties, New York Second quarter sales figures in the lower Hudson region served by the Hudson Gateway Multiple Listing Service Inc. (HGMLS) appear to be following a pattern of déjà vu in terms of price appreciation and constricting inventory. In most areas of the region the median sales price for a single-family residential home increased by about 6% as compared to the second quarter of In Westchester County the median sales price of $710,800 as compared to $670,000 in 2017 was 6.1% higher. The one exception was Putnam County where the median price of a single-family residential dwelling rose only 1.4%. Orange and Rockland counties saw notable gains in median price with the median in Rockland being $468,750, a 6.2% gain over the second quarter of 2017 and Orange with a median sales price of $250,000, a 6.4% gain over the same period last year. The continuing dearth of inventory contributed to upward pressure on prices. While overall inventory in Westchester County remained fairly stagnant, cooperative listings were down 23% from the second quarter of Cooperatives are often a more affordable alternative to a single-family home. Other counties in the region all saw drops in their available inventory; 9.5% in Putnam, 8.1% in Orange and 4.1 % in Rockland County. Hudson Gateway Association of REALTORS One Maple Avenue 9 Coates Drive, Suite 1 2 Medical Park Drive, Suite 17A Hudson Gateway Multiple Listing Service, Inc. White Plains, NY Goshen, NY West Nyack, NY HGAR.com Telephone Telephone Telephone Fax

2 This set of circumstances is beginning to manifest itself in somewhat lower sales figures throughout the region. Overall, residential sales in Westchester were down 5.7% although a healthy 2,511 sales were recorded for the quarter. Sales were down 4.6% in Putnam county and a significant 11.3% in Rockland. Orange County was the exception with an increase of 1.9% overall and a 2.9% increase in single family residences. It is too early to determine what affect the recently passed tax reform law, whose impact has not yet been felt, may be having on sales which remain at historic highs. New construction, still attractive mortgage rates and a vibrant Hudson Valley economy continue to point to prospects for a good year, despite head winds created by chronic low inventory. # # # The Hudson Gateway Multiple Listing Service, Inc. (HGMLS) is a subsidiary of the Hudson Gateway Association of Realtors, Inc. (HGAR). HGMLS s principal service area consists of Westchester, Putnam, Rockland, Orange and Sullivan Counties. It also provides services to Realtors in Bronx, Dutchess, and Ulster Counties. The reported transactions do not include all real estate sales in the area or all sales assisted by the participating offices but they are fairly reflective of general market activity. HGMLS does not provide data on sub-county areas but persons desiring such data are invited to contact Realtor offices in the desired areas. Prior reports back to 1981 as well as current market information and a directory of Realtor members are available on the Association s Web site, *The median sale price is the mid-point of all reported sales, i.e., half of the properties sold for more than the median price and half for less. The median is relatively unaffected by unusually high or low sales prices. The mean sale price is the arithmetic average, i.e., the sum of all sales prices divided by the number of sales. The mean does reflect the influence of sales at unusually low or high prices.

3 Four tables follow with detailed market data for each county.
4
5 ROCKLAND COUNTY ROCKLAND - Second Quarters % Change Property Type 2015 Q Q Q Q NUMBER OF SALES, 2ND QUARTER Single Family Houses % Condominiums % Cooperatives % 2-4 Family % Total % NUMBER OF SALES - YEAR TO DATE (6/30) Single Family Houses % Condominiums % Cooperatives % 2-4 Family % Total 946 1,111 1,316 1, % MEDIAN SALE PRICE Single Family Houses 410, , , , % Condominiums 218, , , , % Cooperatives 65,000 73,000 63,500 78, % 2-4 Family 350, , , , % MEAN SALE PRICE Single Family Houses 422, , , , % Condominiums 248, , , , % Cooperatives 82,000 91, ,468 77, % 2-4 Family 359, , , , % END OF QUARTER INVENTORY Single Family Houses 1,379 1,204 1,037 1, % Condominiums % Cooperatives % 2-4 Family % Total 1,836 1,636 1,358 1, %
6 ORANGE COUNTY ORANGE - Second Quarters % Change Property Type 2015 Q Q Q Q NUMBER OF SALES, 2ND QUARTER Single Family Houses % Condominiums % Cooperatives % 2-4 Family % Total ,107 1, % NUMBER OF SALES - YEAR TO DATE (6/30) Single Family Houses 1,131 1,538 1,696 1, % Condominiums % Cooperatives % 2-4 Family % Total 1,369 1,808 2,036 2, % MEDIAN SALE PRICE Single Family Houses 209, , , , % Condominiums 151, , , , % Cooperatives 41,250 36,000 54, Family 129,000 87, , , % MEAN SALE PRICE Single Family Houses 237, , , , % Condominiums 162, , , , % Cooperatives 41,250 36,000 52, Family 148, , , , % END OF QUARTER INVENTORY Single Family Houses 2,941 2,375 1,995 1, % Condominiums % Cooperatives % 2-4 Family % Total 3,412 2,806 2,333 2, %
2018 ANNUAL AND 4TH QUARTER RESIDENTIAL REAL ESTATE SALES REPORT Westchester, Putnam, Rockland, Orange and Sullivan Counties, New York
 January 8, 2019 2018 ANNUAL AND 4TH QUARTER RESIDENTIAL REAL ESTATE SALES REPORT Westchester, Putnam, Rockland, Orange and Sullivan Counties, New York While remaining robust, residential sales in some
October 10, THIRD QUARTER RESIDENTIAL REAL ESTATE SALES REPORT Westchester, Putnam, Rockland and Orange Counties, New York
 October 10, 2018 2018 THIRD QUARTER RESIDENTIAL REAL ESTATE SALES REPORT Westchester, Putnam, Rockland and Orange Counties, New York Third quarter real estate sales in the lower Hudson Valley remained
October 11, THIRD QUARTER RESIDENTIAL REAL ESTATE SALES REPORT Westchester, Putnam, Rockland and Orange Counties, New York
 October 11, 2017 2017 THIRD QUARTER RESIDENTIAL REAL ESTATE SALES REPORT Westchester, Putnam, Rockland and Orange Counties, New York Real estate sales continued at a brisk pace in the lower Hudson region,
Hudson Valley Home Sales Continue to Increase, But at Lower Rate
 January 11, 2018 Hudson Valley Home Sales Continue to Increase, But at Lower Rate 2017 ANNUAL AND FOURTH QUARTER REAL ESTATE SALES REPORT Westchester, Putnam, Rockland and Orange Counties, New York WHITE
April 11, FIRST QUARTER REAL ESTATE SALES REPORT Westchester, Putnam, Rockland and Orange Counties, New York
 April 11, 2016 2016 FIRST QUARTER REAL ESTATE SALES REPORT Westchester, Putnam, Rockland and Orange Counties, New York Realtors operating in the four-county lower Hudson region served by the Hudson Gateway
2016 ANNUAL AND FOURTH QUARTER REAL ESTATE SALES REPORT Westchester, Putnam, Rockland and Orange Counties, New York
 January 16, 2017 Hudson Valley Posts Strongest Home Sales Since Recession 2016 ANNUAL AND FOURTH QUARTER REAL ESTATE SALES REPORT Westchester, Putnam, Rockland and Orange Counties, New York WHITE PLAINS
HGAR HUDSON GATEWAY ASSOCIATION OF REALTORS, INC.
 HGAR HUDSON GATEWAY ASSOCIATION OF REALTORS, INC. HUDSON GATEWAY ASSOCIATION OF REALTORS, INC. 60 South Broadway, White Plains, New York 10601 914.681.0833 Fax 914.681.6044 www.hgar.com 9 Coates Drive,
HGAR HUDSON GATEWAY ASSOCIATION OF REALTORS, INC.
 HGAR HUDSON GATEWAY ASSOCIATION OF REALTORS, INC. HUDSON GATEWAY ASSOCIATION OF REALTORS, INC. 60 South Broadway, White Plains, New York 10601 914.681.0833 Fax 914.681.6044 www.hgar.com 9 Coates Drive,
HGAR HUDSON GATEWAY ASSOCIATION OF REALTORS, INC.
 09-2 09-3 09-4 10-1 10-2 10-3 10-4 11-1 11-2 11-3 11-4 12-1 12-2 12-3 12-4 13-1 13-2 13-3 13-4 14-1 14-2 Number of Sales HGAR HUDSON GATEWAY ASSOCIATION OF REALTORS, INC. HUDSON GATEWAY ASSOCIATION OF
2011 SECOND QUARTER RESIDENTIAL REAL ESTATE SALES REPORT Westchester and Putnam Counties, New York
 Westchester Putnam Association of REALTORS, Inc. Empire Access Multiple Listing Service, Inc. 60 South Broadway, White Plains, NY 10601 914.681.0833 Fax: 914.681.6044 www.wpar.com Putnam Office: 155 Main
CREATING CONNECTIONS TO HELP YOUR BUSINESS THRIVE
 THE HUDSON GATEWAY ASSOCIATION OF REALTORS CREATING CONNECTIONS TO HELP YOUR BUSINESS THRIVE AFFILIATE MEMBERSHIPS MARKETING EVENT SPONSORSHIPS 2019 REAL ESTATE IN-DEPTH ADVERTISING The Hudson Gateway
Quarterly Indicators. Q Activity Snapshot + 3.5% + 3.1% % Activity Overview New Listings Pending Sales. Closed Sales.
 Quarterly Indicators Q4-2016 Activity Snapshot Most of 2016 offered the same monthly housing market highlights. The number of homes for sale was drastically down in year-over-year comparisons, along with
Annual Report on the New York State Market FOR RESIDENTIAL REAL ESTATE ACTIVITY IN THE STATE OF NEW YORK
 Annual Report on the New York State Market FOR RESIDENTIAL REAL ESTATE ACTIVITY IN THE STATE OF NEW YORK FOR RESIDENTIAL REAL ESTATE ACTIVITY IN THE STATE OF NEW YORK While the 2017 housing market was
Local Board/Association Presidents, Executive Officers, and NYSAR Regional Vice Presidents
 Memo To: Local Board/Association Presidents, Executive Officers, and NYSAR Regional Vice Presidents From: NYSAR President Christine CJ DelVecchio Date: 5/23/18 Re: April 2018 Housing Market Reports The
Annual Report on the New York State Market FOR RESIDENTIAL REAL ESTATE ACTIVITY IN THE STATE OF NEW YORK
 Annual Report on the New York State Market FOR RESIDENTIAL REAL ESTATE ACTIVITY IN THE STATE OF NEW YORK Annual Report on the New York State Market FOR RESIDENTIAL REAL ESTATE ACTIVITY IN THE STATE OF
1 st Quarter 2015 Asheville and Buncombe County Real Estate Market Analysis
 1 st Quarter 2015 Asheville and Buncombe County Real Estate Market Analysis This report examines the Asheville and Buncombe County residential real estate market through the end of the 1 st quarter of
Our High Property Taxes Do Our Assessors Make up the Rules? Real Estate In-Depth November, 2012 By: Edward I. Sumber, Esq.*
 Our High Property Taxes Do Our Assessors Make up the Rules? Real Estate In-Depth November, 2012 By: Edward I. Sumber, Esq.* Approximately two years ago our lower Hudson Valley market was impacted by negative
ECONOMIC PERSPECTIVES
 February 4, 2019 ECONOMIC PERSPECTIVES EXISTING HOME SALES IN FHLBNY AREA HELD UP BETTER THAN THE NATION, REGION IN 2018 Authored by Brian Jones, FHLBNY Financial Economist HIGHLIGHTS:» Existing home sales
Appendix D HOUSING WORK GROUP REPORT JULY 10, 2002
 Appendix D HOUSING WORK GROUP REPORT JULY 10, 2002 Work Group Assignment At the 20/20 forum in April 2001, the community expressed a need for housing policies which will protect both the Town s social
Weekly Market Activity Report
 Weekly Market Report A RESEARCH TOOL FROM THE MINNEAPOLIS AREA ASSOCIATION OF REALTORS BROUGHT TO YOU BY THE UNIQUE DATA-SHARING TRADITIONS OF THE REALTOR COMMUNITY For Week Ending June 30, 2018 Publish
Monthly Indicators. Activity Snapshot % + 8.0% % Activity Overview New Listings Pending Sales. Closed Sales. Days on Market Until Sale
 Monthly Indicators 2018 Many sellers and builders are in a good position for financial gains, as the economy continues to favor putting existing homes on the market and building new homes for sale. While
Monthly Indicators - 7.4% + 5.6% % Activity Overview New Listings Pending Sales. Closed Sales. Days on Market Until Sale. Median Sales Price
 Monthly Indicators 218 Rising home prices, higher interest rates and increased building material costs have pressured housing affordability to a ten-year low, according to the National Association of Home
San Francisco Housing Market Update
 San Francisco Housing Market Update California Economic and Housing Market Outlook The national economy maintained a healthy growth rate in the first quarter of 2005 and appeared to be settling in for
L U X U R Y M A R K E T R E P O R T 2 Q
 L U X U R Y M A R K E T R E P O R T 2 Q 2 1 8 The quarterly Luxury Market Report provided by Trump International Realty is a resource compiling pertinent data and analytics to give you a pulse on the current
Monthly Indicators. Monthly Snapshot. April % % + 4.7%
 Monthly Indicators For residential real estate activity in the state of New Jersey 2018 Monthly Snapshot Many sellers and builders are in a good position for financial gains, as the economy continues to
CAAR Market Report 2010 Mid-Year Published by the Charlottesville Area Association of REALTORS
 CAAR Market Report 2010 Mid-Year Published by the Charlottesville Area Association of REALTORS Where Are We Now? The pace of home purchases in the Charlottesville market area showed a significant increase
Local Government Snapshot
 N Minimum Maximum Sum Assessmen t Costs_CY 2009 Valid N 57 NE W YORK STATE OFFICE (listwise) OF THE STATE COMP TROLLER Thomas P. DiNapoli State Comptroller May 2011 Sum LG Class Code 03 60797625 Real property
Monthly Indicators + 3.5% + 3.0% % Activity Overview New Listings Pending Sales. Closed Sales. Days on Market Until Sale. Median Sales Price
 Monthly Indicators 218 Housing price bubble chatter has increased this summer, as market observers attempt to predict the next residential real estate shift. It is too early to predict a change from higher
CITI HABITATS. Manhattan Residential Sales Market Report
 Manhattan Residential Sales Market Report Contents 4/7 12/17 3 8 9 10 Market Wide 4 Sales / Days on Market 5 / Months of Supply 6 7 Market Share Resale Co-ops Resale Condos New Developments 11 Luxury Neighborhoods
CAAR Market Report 2010 First Quarter Published by the Charlottesville Area Association of REALTORS
 CAAR Market Report 2010 First Quarter Published by the Charlottesville Area Association of REALTORS Where Are We Now? In the first quarter of 2010, the Charlottesville real estate market continued the
MOLLY A. CARHART - APPRAISER'S QUALIFICATIONS 6 FRONT STREET NEWBURGH, NY NYS LICENSE #
 MOLLY A. CARHART - APPRAISER'S QUALIFICATIONS 6 FRONT STREET NEWBURGH, NY 12550 845-568-0600 EMAIL: MOLLYC@VCINY.COM NYS LICENSE # 45000000117 PROFESSIONAL AFFILIATIONS: Orange County Assessor's Association
MARKET AREA UPDATE Report as of: 1Q 2Q 3Q 4Q
 MARKET AREA UPDATE Report as of: 1Q 2Q 3Q 4Q Year: 2013 Market Area (City, State): Arlington, Virginia Provided by (Company / Companies): McEnearney Associates, Inc. Realtors What are the most significant
Monthly Indicators + 9.9% - 1.7% % Activity Overview New Listings Pending Sales. Closed Sales. Days on Market Until Sale. Median Sales Price
 Monthly Indicators 2015 All expectations in 2015 are for a healthy and energetic selling season. National stories have been highlighting an increase in new construction sales and pending sales, but national
+ 3.3% % + 8.4%
 ly Indicators A RESEARCH TOOL PROVIDED BY THE SANTA FE ASSOCIATION OF REALTORS INCLUDES ALL SINGLE FAMILY, CONDO AND TOWNHOME LISTINGS IN THE MLS Q2 2018 Housing markets across the nation are most assuredly
Now is a great time to explore your options with Oxford
 Having trouble reading this email? View it in your browser. For best viewing of future emails, please add us to your Safe Senders List or Address Book. October 3, 2017 Now is a great time to explore your
TERENCE WALSH - APPRAISER'S QUALIFICATIONS NYS LICENSE #
 TERENCE WALSH - APPRAISER'S QUALIFICATIONS NYS LICENSE # 45000002568 EDUCATION: State University of New York at New Paltz Bachelor of Science Degree in Business 1983 Society of Real Estate Appraisers -
Monthly Indicators + 5.7% % % Market Overview New Listings Pending Sales. Closed Sales. Days on Market Until Sale. Median Sales Price
 Monthly Indicators 2018 The three most prominent national market trends for residential real estate are the ongoing lack of abundant inventory, the steadily upward movement of home prices and year-over-year
2Q2017 L O N G ISLAND CITY
 2Q2017 L O N G ISLAND CITY M A R K E T R E P O R T INTRODUCTION L O N G I S L A N D C I T Y S A L E S R E P O R T Q 2 2 0 1 7 : LONG ISLAND CITY IS THE FASTEST GROWING NEIGHBORHOOD IN THE COUNTRY. The
Monthly Indicators + 3.5% + 2.1% - 9.4% Activity Overview New Listings Pending Sales. Closed Sales. Days on Market Until Sale. Median Sales Price
 Monthly Indicators 217 How long can the residential real estate market go on like this? We are about two years into a national trend of dropping housing supply and increasing median sales prices. There
Ridgefield. Interpreting the Market. Real Estate Report 2016 Mid Year Review. karlamurtaugh.com
 Ridgefield Real Estate Report 2016 Mid Year Review Interpreting the Market karlamurtaugh.com 203.856.5534 REAL ESTATE REPORT 2016 MID YEAR REVIEW Ridgefield Real Estate 2016 Mid Year Review Sales During
The Coldwell Banker Carlson Real Estate Market Report
 The Coldwell Banker Carlson Real Estate Market Report 2017 Year-End Stowe Area Report Our 2017 Year-End Market Report uses market-wide data, based on transactions that closed in 2017 in the Multiple Listing
Q Quick Facts + 7.5% + 1.6% - 8.6%
 CAAR Market Report Includes the city of Charlottesville and the counties of Albemarle, Fluvanna, Greene, Louisa and Nelson. Quick Facts + 7.5% + 1.6% Housing markets across the nation are most assuredly
ANALYSIS OF THE CENTRAL VIRGINIA AREA HOUSING MARKET 1st quarter 2013 By Lisa A. Sturtevant, PhD George Mason University Center for Regional Analysis
 ANALYSIS OF THE CENTRAL VIRGINIA AREA HOUSING MARKET 1st quarter By Lisa A. Sturtevant, PhD George Mason University Center for Regional Analysis Economic Overview Key economic factors in the first quarter
Monthly Indicators + 5.9% - 6.6% + 8.1%
 ly Indicators A RESEARCH TOOL PROVIDED BY METRO MLS FOR ACTIVITY IN THE 4-COUNTY MILWAUKEE METROPOLITAN AREA 2019 Quick Facts Despite a strong U.S. economy, historically low unemployment and steady wage
Monthly Indicators + 1.4% % % Activity Overview New Listings Pending Sales. Closed Sales. Days on Market Until Sale. Median Sales Price
 Monthly Indicators 2018 Rising home prices, higher interest rates and increased building material costs have pressured housing affordability to a ten-year low, according to the National Association of
Peter Comitini Senior VP Associate Broker The Corcoran Group
 Sutton Area TriBeCa Upper East Side Upper West Side Washington Heights West Village Battery Park City Beekman Carnegie Hill Central Park South Chelsea Flatiron Clinton East Harlem East Village Financial
JEREMY BARACCA - APPRAISER S QUALIFICATIONS NYS LICENSE #
 JEREMY BARACCA - APPRAISER S QUALIFICATIONS NYS LICENSE # 45000044154 ASSESSOR EDUCATION: New York State Office of Real Property, Department of Taxation & Finance Fundamentals of Data Collection 4/2016
Manhattan Residential. THIRD quarter
 2015 Manhattan Residential MARket Report THIRD quarter Data Highlights Cover Property: halstead.com WEB# 13231035 $995,000 New record median price for Manhattan apartments. Reported sales up 9% from. halstead.com
1 ACRE RETAIL PAD SITE
 LEASE OVERVIEWVIEW PROPERTY DESCRIPTION 1 Acre Retail Pad Site in New 15 Acre Development LEASE RATE: $75,000 Per Year (Ground) LOT SIZE: 1.0 Acres PROPERTY HIGHLIGHTS Shared Signaled Access Close Proximity
REAL ESTATE MARKET OVERVIEW 1 st Half of 2015
 REAL ESTATE MARKET OVERVIEW 1 st Half of 2015 With Comparisons to the 2 nd Half of 2014 September 4, 2015 Prepared for: First Bank of Wyoming Prepared by: Ken Markert, AICP MMI Planning 2319 Davidson Ave.
HOULIHAN LAWRENCE COMMERCIAL GROUP
 HOULIHAN LAWRENCE COMMERCIAL GROUP TH QUARTER EXECUTIVE SUMMARY FOURTH QUARTER Dear Clients, With behind us and the new year in full swing, we can now reflect, summarize and gain insight from the past
The Corcoran Report 4Q16 MANHATTAN
 The Corcoran Report 4Q16 MANHATTAN Contents Fourth Quarter 2016 4/7 12/23 3 Overview 8 9 10 Market Wide 11 Luxury 24 2 Sales / Days on Market 3 Inventory / Months of Supply 4 5 Market Share Resale Co-ops
Advertising Rates Effective January 1, Real Estate
 2018 Advertising Rates Effective January 1, 2018 Real Estate Agate (800) 458-5522 1 Display and Display on classifieds inside NY area (212) 556-1581 / outside NY area (800) 843-3113 The New York Times
MANHATTAN RESIDENTIAL MARKET REPORT
 2017 FOURTH MANHATTAN RESIDENTIAL MARKET REPORT QUARTER Data Highlights FOURTH QUARTER 2017 Cover Property: halstead.com WEB# 17690202 The average apartment price fell for the second straight quarter,
Key Findings on the Affordability of Rental Housing from New York City s Housing and Vacancy Survey 2008
 Furman Center for real estate & urban policy New York University school of law n wagner school of public service 110 West 3rd Street, Suite 209, New York, NY 10012 n Tel: (212) 998-6713 n www.furmancenter.org
Monthly Indicators % - 1.6% + 6.0%
 ly Indicators A RESEARCH TOOL PROVIDED BY METRO MLS FOR ACTIVITY IN THE 4-COUNTY MILWAUKEE METROPOLITAN AREA 2019 Quick Facts It is worthwhile to mention the weather when discussing residential real estate
rd Quarter Market Report
 2012 3 rd Quarter Market Report The voice of real estate in Central Virginia CAAR Member Copy Expanded Edition Charlottesville Area 3 rd Quarter 2012 Highlights: Overall sales in Greater Charlottesville
2 ACRE HOTEL/RETAIL PAD SITE
 LEASE OVERVIEWVIEW PROPERTY DESCRIPTION 2 Acre Pad Site in New 15 Acre Development AVAILABLE SF: 2.0 Acres LEASE RATE: $200,000 Per Year (Ground) LOT SIZE: 2.0 Acres PROPERTY HIGHLIGHTS Shared Signaled
2018 Housing Market Outlook. Central Coast Realty Group Business Symposium February 22, 2018 Oscar Wei Senior Economist
 2018 Housing Market Outlook Central Coast Realty Group Business Symposium February 22, 2018 Oscar Wei Senior Economist Overview Economic Update California Housing Market Outlook Regional Housing Market
Housing Supply Overview
 Housing Supply Overview A RESEARCH TOOL PROVIDED BY SOUTH CAROLINA REALTORS April 217 Spring is in the air, and housing activity is heightening. There appear to be more buyers out on the prowl, given the
Monthly Indicators. Monthly Snapshot. March % % 0.0%
 Monthly Indicators 2017 We can comfortably consider the first quarter to have been a good start for residential real estate in 2017. There was certainly plenty to worry over when the year began. Aside
Monthly Indicators + 7.3% + 6.6% + 8.3% Single-Family Market Overview Condo Market Overview New Listings Pending Sales.
 Monthly Indicators 2018 The three most prominent national market trends for residential real estate are the ongoing lack of abundant inventory, the steadily upward movement of home prices and year-over-year
Monthly Indicators. Quick Facts + 2.3% + 4.0% - 3.1% February 2019
 Monthly Indicators 2019 There were 844 more homes sold across the state in than the month before, making January s increase in pending sales a true prediction. However, year-to-date home sales lag 2018
2015 First Quarter Market Report
 2015 First Quarter Market Report CAAR Member Copy Expanded Edition Charlottesville Area First Quarter 2015 Highlights: Median sales price for the region was up 5.1% over Q1-2014, rising from $244,250 to
2013 Arizona Housing Market Mid-Year Report
 2013 Arizona Housing Market Mid-Year Report This mid-year market report outlines the latest trends in Arizona real estate. The housing market hit bottom in mid to late 2011, and has been in recovery mode
The 2016 Flathead County Real Estate Market
 The 2016 Flathead County Real Estate Market The Flathead Real Estate Market continues to improve with a near record number of sales in 2016 By Jim Kelley Kelley Appraisal 1001 South Main Street Kalispell,
2016 Housing Market Strong
 FOR IMMEDIATE RELEASE Realtor Association of Sarasota and Manatee Contact: Kathy Roberts (941) 952-343 kathy@myrasm.com 216 Housing Market Strong SARASOTA, Fla. (February 9, 217) According to recent data
Queens Rental Market Report October 2017 mns.com
 Queens Rental Market Report October 2017 TABLE OF CONTENTS 03 Introduction 04 A Quick Look 10 Queens Price Trends 11 Neighborhood Price Trends 11 Long Island City 12 Astoria 13 Ridgewood 14 Flushing 15
Manhattan Residential. FOURTH quarter
 2015 Manhattan Residential MARket Report FOURTH quarter Data Highlights FOURTH Quarter 2015 Cover Property: halstead.com WEB# 13676219 The average and median price for all apartments set new records in
Housing Supply Overview
 Housing Supply Overview A RESEARCH TOOL PROVIDED BY SOUTH CAROLINA REALTORS April 2016 We should see a healthy number of sales in most categories for the next few months, yet there is still some lingering
ECONOMIC CURRENTS. Vol. 3, Issue 1. THE SOUTH FLORIDA ECONOMIC QUARTERLY Introduction
 ECONOMIC CURRENTS THE SOUTH FLORIDA ECONOMIC QUARTERLY Introduction Economic Currents provides an overview of the South Florida regional economy. The report contains current employment, economic and real
Monthly Indicators % % - 5.3% Activity Overview New Listings Pending Sales. Closed Sales. Days on Market Until Sale. Median Sales Price
 Monthly Indicators 2018 Housing price bubble chatter has increased this summer, as market observers attempt to predict the next residential real estate shift. It is too early to predict a change from higher
Monthly Indicators % - 0.2% - 9.5% Activity Overview New Listings Pending Sales. Closed Sales. Days on Market Until Sale. Median Sales Price
 Monthly Indicators 2015 Home prices were up during summer across the nation in year-over-year comparisons. With the economy on full mend, Federal Reserve Chair Janet Yellen has predicted a fine-tuning
Monthly Indicators - 6.8% + 5.8% % Activity Overview New Listings Pending Sales. Closed Sales. Days on Market Until Sale. Median Sales Price
 Monthly Indicators 218 Some economy observers are pointing to 218 as the final period in a long string of sentences touting several happy years of buyer demand and sales excitement for the housing industry.
THE SWEARINGEN REPORT VICTORIA MLS
 THE SWEARINGEN REPORT VICTORIA MLS Current Observations: Victoria at a Crossroads -This month's comments are from The Texas A&M Real Estate Center article dated Sept 5, 218. More than a year after Hurricane
PAUL G. WILEY - APPRAISER'S QUALIFICATIONS MEMBERSHIPS AND AFFILIATIONS: State of New York - Certified Real Estate General Appraiser #
 PAUL G. WILEY - APPRAISER'S QUALIFICATIONS MEMBERSHIPS AND AFFILIATIONS: State of New York - Certified Real Estate General Appraiser #46000048291 Mid-Hudson Chapter of the Appraisal Institute Board of
MANHATTAN RESIDENTIAL MARKET REPORT SECOND QUARTER
 2017 MANHATTAN RESIDENTIAL MARKET REPORT SECOND QUARTER Data Highlights SECOND QUARTER 2017 Cover Property: halstead.com WEB# 16183475 New records were set for average and median apartment prices, as high-end
MANHATTAN RESIDENTIAL MARKET REPORT FIRST QUARTER
 2018 MANHATTAN RESIDENTIAL MARKET REPORT FIRST QUARTER Data Highlights FIRST QUARTER 2018 Cover Property: halstead.com WEB# 18230107 The average price for all apartments fell 8% from a year ago to $1,987,045,
Volume II Edition I Why This is a Once in a Lifetime Opportunity for Investors
 www.arizonaforcanadians.com Volume II Edition I Why This is a Once in a Lifetime Opportunity for Investors In This Edition How to make great investment returns in a soft market U.S. Financing for Canadians
WISCONSIN WEST NORTHEAST SOUTH CENTRAL SOUTHEAST
 WISCONSIN The RE/MAX INTEGRA, Midwest s Springboard into Summer Housing Market Report analyzes the latest trends and economic conditions of the residential real estate market throughout Wisconsin. Individual
3Q2017 L O N G ISLAND CITY
 3Q2017 L O N G ISLAND CITY M A R K E T R E P O R T INTRODUCTION L O N G I S L A N D C I T Y S A L E S R E P O R T Q 3 2 0 1 7 : THE SKY IS THE LIMIT Here at Stribling, we are really excited by what s going
INLAND EMPIRE REGIONAL INTELLIGENCE REPORT. School of Business. April 2018
 INLAND EMPIRE REGIONAL INTELLIGENCE REPORT April 2018 Key economic indicators suggest that the Inland Empire s economy will continue to expand throughout the rest of 2018, building upon its recent growth.
Monthly Indicators + 5.8% 0.0% % 2 New Listings. 3 Pending Sales. 4 5 Days on Market Until Sale. 6 7 Average Sales Price
 Monthly Indicators 2013 As potentially the brightest sun in the current economic recovery, housing activity has followed the mercury higher this summer. Interest rates and new construction activity have
ECONOMIC CURRENTS. Vol. 3, Issue 3 SOUTH FLORIDA ECONOMIC QUARTERLY. Introduction
 ECONOMIC CURRENTS THE Introduction SOUTH FLORIDA ECONOMIC QUARTERLY Economic Currents provides an overview of the South Florida regional economy. The report presents current employment, economic and real
ESSEX COUNT Y, NEW JERSEY MARKET REPORT THIRD QUARTER
 2017 ESSEX COUNT Y, NEW JERSEY MARKET REPORT THIRD QUARTER Montclair The average sale price reached $786,000, an increase of 5% over prior year. The median sale price also rose ending at $735,000 or 4%
Monthly Indicators + 0.5% + 3.7% + 4.0%
 Monthly Indicators A RESEARCH TOOL PROVIDED BY NORTH TEXAS REAL ESTATE INFORMATION SYSTEMS, INC. 2018 Many sellers and builders are in a good position for financial gains, as the economy continues to favor
RESIDENTIAL MARKET ANALYSIS
 11 RESIDENTIAL MARKET ANALYSIS Kyle Smith Portland State University National housing market statistics reflect an increase in value from the prior year, bucking the multi-quarter trend of declining sales
THE UA TAKE FIRST QUARTER 2017: LOW SUPPLY HIGH DEMAND HIGHER PRICES THE CYCLE CONTINUES
 THE UA TAKE FIRST QUARTER 2017: LOW SUPPLY HIGH DEMAND HIGHER PRICES THE CYCLE CONTINUES A drop in new home sales from one quarter to another or year over year can usually be attributed to lower demand
Monthly Indicators - 1.1% - 2.8% % Market Overview New Listings Pending Sales. Closed Sales. Days on Market Until Sale. Median Sales Price
 Monthly Indicators 2018 Rising home prices, higher interest rates and increased building material costs have pressured housing affordability to a ten-year low, according to the National Association of
Volume II Edition III Mid Summer update
 The Realtors Canadians Trust www.arizonaforcanadians.com Volume II Edition III Mid Summer update In This Edition What is happening in the market today? Where is the market heading? The Buying Process Our
SECOND QUARTER 2013 QUARTERLY MARKET REPORT
 SECOND QUARTER 2013 QUARTERLY MARKET REPORT Manhattan s and s Average and Median Sale Price Manhattan apartment prices averaged just over $1.4 million in the second quarter, 3% less than a year ago. A
Released: February 8, 2011
 Released: February 8, 2011 Commentary 2 The Numbers That Drive Real Estate 3 Recent Government Action 10 Topics for Home Buyers, Sellers, and Owners 13 Brought to you by: KW Research Commentary Gradual
The 2017 Flathead County Real Estate Market
 The 2017 Flathead County Real Estate Market The Flathead Real Estate Market continues to improve with record number of home sales in 2017 By Jim Kelley Kelley Appraisal 1001 South Main Street Kalispell,
Monthly Indicators. December Monthly Snapshot - 0.7% + 7.5% - 5.3%
 Monthly Indicators 2014 Monthly Snapshot + 7.5% - 5.3% - 0.7% It was another recovery year in 2014, although not quite to the level of 2013. With a broad pattern of rising prices and stable to improving
NANTUCKET REAL ESTATE
 NANTUCKET REAL ESTATE YEAR IN REVIEW 217 Nantucket Real Estate A Comprehensive Analysis by Jen Shalley (58) 228 447 21 Main Street, Nantucket, MA 2 217 Nantucket Real Estate in Photos & Graphics NANTUCKET
Minneapolis St. Paul Residential Real Estate Index
 University of St. Thomas Minneapolis St. Paul Residential Real Estate Index Welcome to the latest edition of the UST Minneapolis St. Paul Residential Real Estate Index. The University of St Thomas Residential
MANHATTAN MARKET REPORT
 MANHATTAN MARKET REPORT 2nd Quarter 2018 RESALE bhhsnyp.com 1 NOTE FROM THE PRESIDENT While temperatures and humidity levels have risen in New York City, consumers have continued to show apprehension this
Westchester Realtors Hit Back on Reports of Troubled Market. Westchester County Second Quarter 2018 Data
 Vol. 23 / No. 8 August 2018 Westchester Realtors Hit Back on Reports of Troubled Market By John Jordan WHITE PLAINS Westchester residential brokerage executives and industry analysts responding to multiple
Monthly Indicators % + 8.3% + 3.7% Activity Overview New Listings. Closed Sales Median Sales Price
 Monthly Indicators 2018 Rising home prices, higher interest rates and increased building material costs have pressured housing affordability to a ten-year low, according to the National Association of
st Quarter Market Report A Recipe That s Hard to Swallow
 2008 1 st Quarter Market Report A Recipe That s Hard to Swallow By Dave Phillips, CEO Charlottesville Area Association of REALTORS Have you ever stood in your kitchen, felt a creative surge and decided