2016 ANNUAL AND FOURTH QUARTER REAL ESTATE SALES REPORT Westchester, Putnam, Rockland and Orange Counties, New York
|
|
|
- Leon Stephens
- 6 years ago
- Views:
Transcription

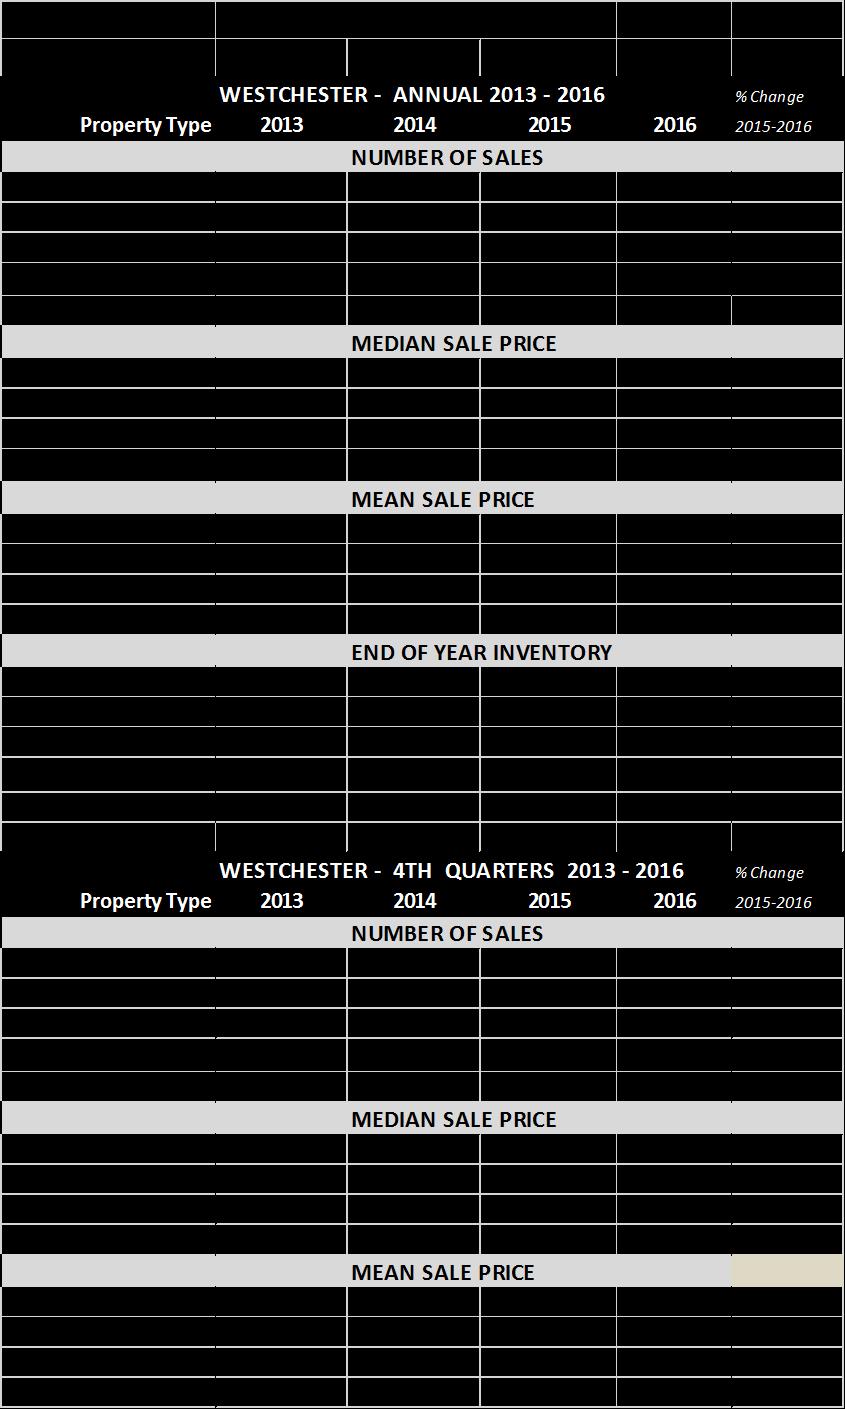
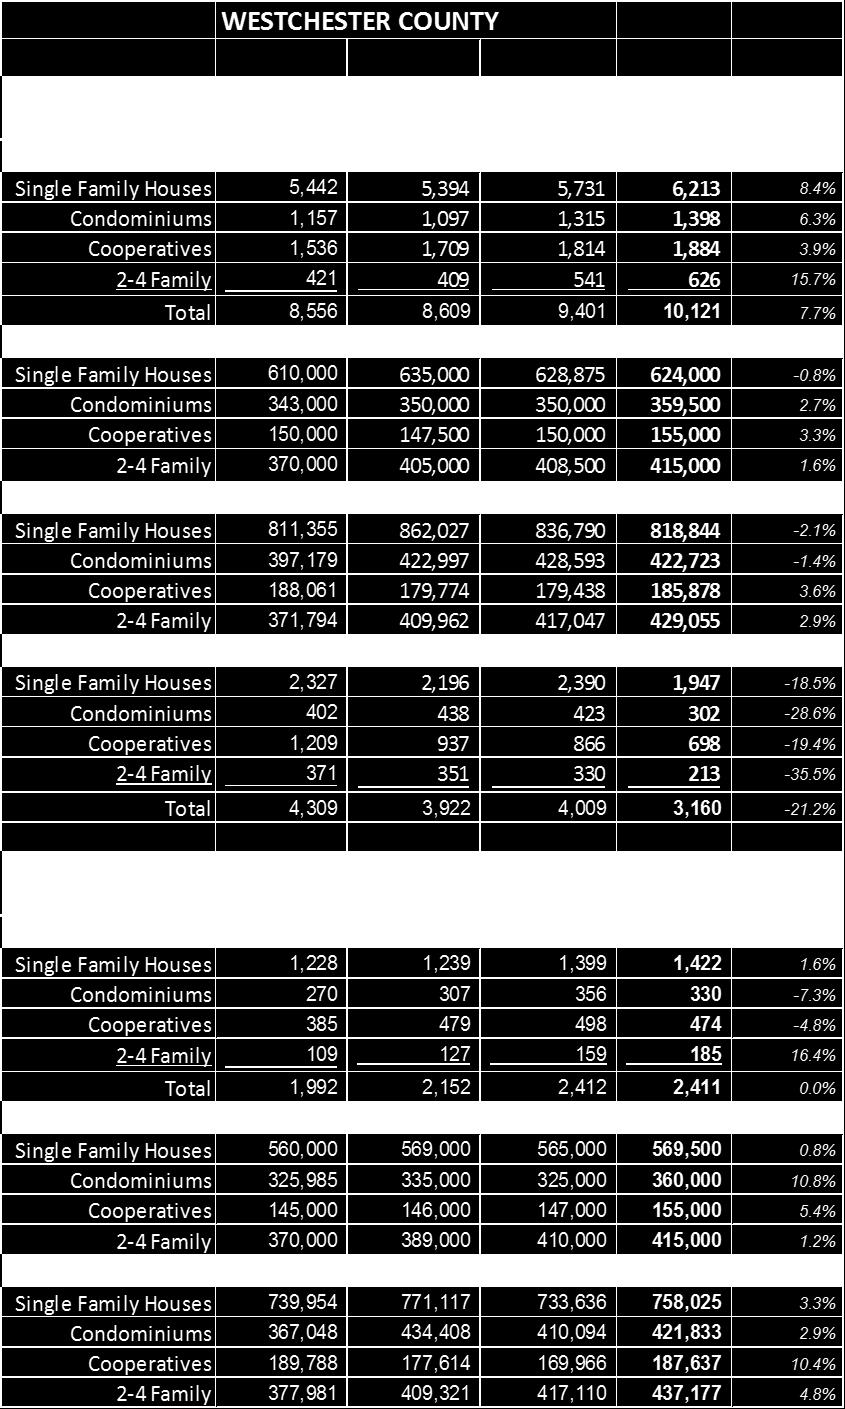
1 January 16, 2017 Hudson Valley Posts Strongest Home Sales Since Recession 2016 ANNUAL AND FOURTH QUARTER REAL ESTATE SALES REPORT Westchester, Putnam, Rockland and Orange Counties, New York WHITE PLAINS 2016 posted the region s best real estate sales results since the postrecession recovery period that commenced in Realtors participating in the four-county Hudson Gateway Multiple Listing Service, Inc., a subsidiary of the Hudson Gateway Association of Realtors, Inc., reported 18,145 closings of residential transactions comprising single-family houses, condominiums, cooperatives, and 2-4 family houses. This was a significant 12.5% increase over 2015 s total of 16,126 sales. It was noted in the MLS s prior third quarter report that the pace of sales slowed moderately at that time in comparison to the first half of the year, but these current fourth quarter results show a speedy bounce-back. The fourth quarter closings largely resulted from marketing activity and contracts that took place in the late summer and autumn months. Hudson Gateway Association of REALTORS One Maple Avenue 9 Coates Drive, Suite 1 2 Medical Park Drive, Suite 17A Hudson Gateway Multiple Listing Service, Inc. White Plains, NY Goshen, NY West Nyack, NY HGAR.com Telephone Telephone Telephone Fax
2 The most impressive gains on both a percentage and volume basis were those posted for Orange County. There were 4,083 sales, most of them (3,479) single-family houses, representing a 24.3% increase over Looking at just the fourth quarter, sales in Orange County exceeded 2015 s fourth quarter sales by 18.8%. For the past several years the Orange County real estate market has been powered by sales of single-family houses in a rather narrow median price range, about $225,000 to $235,000, but prices have been creeping up. The 12-month median sale price of an Orange County house was $229,000, an increase of 1.8% over last year. For the fourth quarter the median was $235,000, an increase of 3.5% over last year. Orange County and the other three counties as well have been confronting an evertightening inventory situation. Inventory is not yet so low as to stall the market but is low enough to create pressure for speedier decision-making by prospective buyers. Orange s year-end supply of listings was 2,190 units in all residential categories, a decrease of 20.8% from last year. Westchester posted a 21.2% decrease, Putnam 31.2%, and Rockland 16.1%. Notwithstanding the high rate of sales and the low levels of inventory, prices throughout the region have not been pressured upwards very much. Westchester County actually experienced a small downward tick in its 12-month median for a single-family house: from $628,875 in 2015 to 624,000 in Westchester s mean or average price also decreased, and by a larger amount. When this happens it usually means that the high-end market was squeezed by sales inactivity and/or by price reduction; MLS Realtors have in fact reported difficulty in the high-end segment of the market.
3 The Putnam and Rockland County markets performed fairly well in Putnam s $325,000 median sale price of a house was 4.8% above last years although its condominium and cooperative sectors posted price decreases. (It is always noted in these reports that Putnam s data, especially its percentages, are subject to large swings because Putnam s sale base is small.) Rockland s median house price of $425,000 was 2.4% higher than last year. Rockland also performed well especially in its condominium sector with a 19.0% year-to-year increase in sales volume was a good year for the real estate market in the four-county service territory of the Hudson Gateway MLS. Buyers and sellers were able to work the market on a level playing field, notwithstanding the fairly low levels of inventory. Unemployment rates decreased through the year and they show no signs of increasing again soon. The Federal Reserve s small, incremental rate hikes appear not to be harming the mortgage lending community. The equity markets, particularly the Dow Jones Index, set records. Both employment and investment security provide confidence to prospective purchasers to act on their intentions. Will these conditions continue into 2017 to power another strong year for real estate? The factors noted above argue in the affirmative. The only prospective negative is that the new government in Washington will want to tamper with tax and regulatory policies that are important to real estate, such as the mortgage interest deduction. But that is months away, if it happens at all. In the meantime, seize the day. # # # The Hudson Gateway Multiple Listing Service, Inc. (HGMLS) is a subsidiary of the Hudson Gateway Association of Realtors, Inc. (HGAR). The MLS s principal service area consists of Westchester, Putnam, Rockland and Orange counties. It also provides services to Realtors in Bronx, Dutchess, Sullivan and Ulster counties. The reported transactions do not include all real estate sales in the area or all sales assisted by the participating offices but they are fairly reflective of general market activity. HGMLS does not provide data on sub-county areas; persons desiring sub-county data are invited to contact participating Realtor offices in the desired areas. Any text or data from this report may be reprinted with attribution to HGMLS as the source. Prior reports dating back to 1981 are available on the Realtor Associations website, a membership directory searchable by municipality is also available on that site. *The median sale price is the mid-point of all reported sales, i.e., half of the properties sold for more than the median price and half for less. The median is relatively unaffected by unusually low or high sale prices. The mean sale price is the arithmetic average, i.e., the sum of all sales prices divided by the number of sales. The mean does reflect the influence of sales at unusually low or high prices. Four tables follow with detailed market data for each of the covered counties.
4
5 PUTNAM - ANNUAL Single Family Houses , % Condominiums % Cooperatives % 2-4 Family % Total ,064 1, % Single Family Houses 308, , , , % Condominiums 201, , , , % Cooperatives 100,000 58,000 60,000 45, % 2-4 Family 230, , , , % Single Family Houses 359, , , , % Condominiums 229, , , , % Cooperatives 95, ,697 76,200 53, % 2-4Famly 293, , , , % END OF YEAR INVENTORY Single Family Houses % Condos & Co-ops % Cooperatives na % 2-4 Family na % Total % PUTNAM - 4TH QUARTERS Property Type Single Family Houses % Condominiums % Cooperatives % 2-4 Family % Total % Single Family Houses 300, , , , % Condominiums 211, , , , % Cooperatives 90, ,000 20,900 31, % 2-4 Family 293, , , , % Single Family Houses 361, , , , % Condominiums 250, , , , % Cooperatives 79, ,000 20,900 39, % 2-4 Family 370, , , , %
6 ROCKLAND - ANNUAL Single Family Houses 1,523 1,514 1,830 2, % Condominiums % Cooperatives % 2-4 Family % Total 1,989 2,057 2,377 2, % Single Family Houses 387, , , , % Condominiums 221, , , , % Cooperatives 78,875 73,250 74,500 70, % 2-4 Family 310, , , , % Single Family Houses 423, , , , % Condominiums 254, , , , % Cooperatives 99, ,382 98,070 92, % 2-4 Family 324, , , , % END OF YEAR INVENTORY Single Family Houses % Condominiums 315* % Cooperatives na % 2-4 Family na % Total 1,263 1,367 1,376 1, % *Includes Cooperatives ROCKLAND - 4TH QUARTERS Single Family Houses % Condominiums % Cooperatives % 2-4 Family % Total % Single Family Houses 380, , , , % Condominiums 200, , , , % Cooperatives 71,000 63, ,500 70, % 2-4 Family 332, , , , % Single Family Houses 405, , , , % Condominiums 237, , , , % Cooperatives 93, , ,345 87, % 2-4 Family 310, , , , %
7 0 ORANGE - ANNUAL Single Family Houses 2,243 2,204 2,746 3, % Condominiums % Cooperatives % 2-4 Family % Total 2,634 2,612 3,284 4, % Single Family Houses 234, , , , % Condominiums 165, , , , % Cooperatives 61,500 42,500 56,500 36, % 2-4 Family 116, ,000 87, , % Single Family Houses 251, , , , % Condominiums 172, , , , % Cooperatives 89,600 47,750 52,925 46, % 2-4 Family 126, , , , % END OF YEAR INVENTORY Single Family Houses 2,331 2,306 2,334 1, % Condominiums 289* % Cooperatives na % 2-4 Family na % *Includes Cooperatives Total 2,620 2,737 2,766 2, % ORANGE - 4TH QUARTERS Single Family Houses % Condominiums % Cooperatives % 2-4 Family % Total , % Single Family Houses 225, , , , % Condominiums 157, , , , % Cooperatives 54,000 48,500-35, % 2-4 Family 120,000 85,000 81, , % Single Family Houses 242, , , , % Condominiums 163, , , , % Cooperatives 54,000 54,250-35, % 2-4 Family 133, , , , %
Hudson Valley Home Sales Continue to Increase, But at Lower Rate
 January 11, 2018 Hudson Valley Home Sales Continue to Increase, But at Lower Rate 2017 ANNUAL AND FOURTH QUARTER REAL ESTATE SALES REPORT Westchester, Putnam, Rockland and Orange Counties, New York WHITE
HGAR HUDSON GATEWAY ASSOCIATION OF REALTORS, INC.
 HGAR HUDSON GATEWAY ASSOCIATION OF REALTORS, INC. HUDSON GATEWAY ASSOCIATION OF REALTORS, INC. 60 South Broadway, White Plains, New York 10601 914.681.0833 Fax 914.681.6044 www.hgar.com 9 Coates Drive,
HGAR HUDSON GATEWAY ASSOCIATION OF REALTORS, INC.
 HGAR HUDSON GATEWAY ASSOCIATION OF REALTORS, INC. HUDSON GATEWAY ASSOCIATION OF REALTORS, INC. 60 South Broadway, White Plains, New York 10601 914.681.0833 Fax 914.681.6044 www.hgar.com 9 Coates Drive,
April 11, FIRST QUARTER REAL ESTATE SALES REPORT Westchester, Putnam, Rockland and Orange Counties, New York
 April 11, 2016 2016 FIRST QUARTER REAL ESTATE SALES REPORT Westchester, Putnam, Rockland and Orange Counties, New York Realtors operating in the four-county lower Hudson region served by the Hudson Gateway
October 10, THIRD QUARTER RESIDENTIAL REAL ESTATE SALES REPORT Westchester, Putnam, Rockland and Orange Counties, New York
 October 10, 2018 2018 THIRD QUARTER RESIDENTIAL REAL ESTATE SALES REPORT Westchester, Putnam, Rockland and Orange Counties, New York Third quarter real estate sales in the lower Hudson Valley remained
2018 ANNUAL AND 4TH QUARTER RESIDENTIAL REAL ESTATE SALES REPORT Westchester, Putnam, Rockland, Orange and Sullivan Counties, New York
 January 8, 2019 2018 ANNUAL AND 4TH QUARTER RESIDENTIAL REAL ESTATE SALES REPORT Westchester, Putnam, Rockland, Orange and Sullivan Counties, New York While remaining robust, residential sales in some
2018 SECOND QUARTER RESIDENTIAL REAL ESTATE SALES REPORT Westchester, Putnam, Rockland and Orange Counties, New York
 July 5, 2018 2018 SECOND QUARTER RESIDENTIAL REAL ESTATE SALES REPORT Westchester, Putnam, Rockland and Orange Counties, New York Second quarter sales figures in the lower Hudson region served by the Hudson
October 11, THIRD QUARTER RESIDENTIAL REAL ESTATE SALES REPORT Westchester, Putnam, Rockland and Orange Counties, New York
 October 11, 2017 2017 THIRD QUARTER RESIDENTIAL REAL ESTATE SALES REPORT Westchester, Putnam, Rockland and Orange Counties, New York Real estate sales continued at a brisk pace in the lower Hudson region,
HGAR HUDSON GATEWAY ASSOCIATION OF REALTORS, INC.
 09-2 09-3 09-4 10-1 10-2 10-3 10-4 11-1 11-2 11-3 11-4 12-1 12-2 12-3 12-4 13-1 13-2 13-3 13-4 14-1 14-2 Number of Sales HGAR HUDSON GATEWAY ASSOCIATION OF REALTORS, INC. HUDSON GATEWAY ASSOCIATION OF
2011 SECOND QUARTER RESIDENTIAL REAL ESTATE SALES REPORT Westchester and Putnam Counties, New York
 Westchester Putnam Association of REALTORS, Inc. Empire Access Multiple Listing Service, Inc. 60 South Broadway, White Plains, NY 10601 914.681.0833 Fax: 914.681.6044 www.wpar.com Putnam Office: 155 Main
Housing Supply Overview
 Housing Supply Overview A RESEARCH TOOL PROVIDED BY SOUTH CAROLINA REALTORS June 2018 We are firmly within summer during an economically strong year in the U.S., thus real estate activity is busy. There
Housing Supply Overview
 Housing Supply Overview A RESEARCH TOOL PROVIDED BY SOUTH CAROLINA REALTORS February 2018 Mortgage rates are on the rise. When this happens, it means that buyers in the lower-priced categories tend to
Quarterly Indicators. Q Activity Snapshot + 3.5% + 3.1% % Activity Overview New Listings Pending Sales. Closed Sales.
 Quarterly Indicators Q4-2016 Activity Snapshot Most of 2016 offered the same monthly housing market highlights. The number of homes for sale was drastically down in year-over-year comparisons, along with
San Francisco Housing Market Update
 San Francisco Housing Market Update California Economic and Housing Market Outlook The national economy maintained a healthy growth rate in the first quarter of 2005 and appeared to be settling in for
Housing Supply Overview
 Housing Supply Overview A RESEARCH TOOL PROVIDED BY SOUTH CAROLINA REALTORS March 2017 Low supply and steadily rising rates and prices have been the story so far after the first quarter of the year zipped
Single Family Sales Maine: Units
 Maine Home Connection 19 Commercial St Portland, Maine 04101 MaineHomeConnection.com Office: (207) 517-3100 Email: Info@MaineHomeConnection.com For the fourth consecutive year, Maine home sales set a new
Annual Report on the New York State Market FOR RESIDENTIAL REAL ESTATE ACTIVITY IN THE STATE OF NEW YORK
 Annual Report on the New York State Market FOR RESIDENTIAL REAL ESTATE ACTIVITY IN THE STATE OF NEW YORK FOR RESIDENTIAL REAL ESTATE ACTIVITY IN THE STATE OF NEW YORK While the 2017 housing market was
CREATING CONNECTIONS TO HELP YOUR BUSINESS THRIVE
 THE HUDSON GATEWAY ASSOCIATION OF REALTORS CREATING CONNECTIONS TO HELP YOUR BUSINESS THRIVE AFFILIATE MEMBERSHIPS MARKETING EVENT SPONSORSHIPS 2019 REAL ESTATE IN-DEPTH ADVERTISING The Hudson Gateway
1 st Quarter 2015 Asheville and Buncombe County Real Estate Market Analysis
 1 st Quarter 2015 Asheville and Buncombe County Real Estate Market Analysis This report examines the Asheville and Buncombe County residential real estate market through the end of the 1 st quarter of
CAAR Market Report 2010 Mid-Year Published by the Charlottesville Area Association of REALTORS
 CAAR Market Report 2010 Mid-Year Published by the Charlottesville Area Association of REALTORS Where Are We Now? The pace of home purchases in the Charlottesville market area showed a significant increase
Housing Supply Overview
 Housing Supply Overview A RESEARCH TOOL PROVIDED BY SOUTH CAROLINA REALTORS April 2016 We should see a healthy number of sales in most categories for the next few months, yet there is still some lingering
Housing Supply Overview
 Housing Supply Overview A RESEARCH TOOL PROVIDED BY SOUTH CAROLINA REALTORS February 2018 Mortgage rates are on the rise. When this happens, it means that buyers in the lower-priced categories tend to
Housing Supply Overview
 Housing Supply Overview A RESEARCH TOOL PROVIDED BY SOUTH CAROLINA REALTORS May 2016 Sellers are getting more of their asking price, meaning higher sales prices in most categories. The overall inventory
Monthly Indicators. Monthly Snapshot. March % % 0.0%
 Monthly Indicators 2017 We can comfortably consider the first quarter to have been a good start for residential real estate in 2017. There was certainly plenty to worry over when the year began. Aside
Sep September 2018
 18 September 18 MONTHLY STATISTICS PACKAGE City of Calgary Persistent buyers market continues 18 City of Calgary, October 1, 18 With no change in the economic climate, Calgary s sales activity totaled
Housing Supply Overview
 Housing Supply Overview This is a research tool provided by the Big Sky Country MLS for Gallatin County, Montana February 2018 Mortgage rates are on the rise. When this happens, it means that buyers in
HOULIHAN LAWRENCE COMMERCIAL GROUP
 HOULIHAN LAWRENCE COMMERCIAL GROUP TH QUARTER EXECUTIVE SUMMARY FOURTH QUARTER Dear Clients, With behind us and the new year in full swing, we can now reflect, summarize and gain insight from the past
Housing Supply Overview
 Housing Supply Overview A RESEARCH TOOL PROVIDED BY SOUTH CAROLINA REALTORS February 2019 Although inventory continues to show signs of improvement across the country especially in markets in the western
Monthly Indicators. Monthly Snapshot. September % % - 1.2%
 Monthly Indicators 2017 Every market is unique, yet the national sentiment has given rise to the notion that housing markets are stalling. Although desirous buyers are out on an increasing number of showings,
Housing Supply Overview
 Housing Supply Overview A RESEARCH TOOL PROVIDED BY SOUTH CAROLINA REALTORS May 2015 The last 12 months have seen a lot of buyer activity. Prices are up in most markets and buyers are hungry to purchase,
Monthly Indicators % % - 2.5% Activity Overview New Listings Pending Sales. Closed Sales. Days on Market Until Sale. Median Sales Price
 Monthly Indicators 2019 It is worthwhile to mention the weather when discussing residential real estate for the state of New York for 2019, because this month has turned in some impressively cold and snowy
Monthly Indicators + 3.5% + 3.0% % Activity Overview New Listings Pending Sales. Closed Sales. Days on Market Until Sale. Median Sales Price
 Monthly Indicators 218 Housing price bubble chatter has increased this summer, as market observers attempt to predict the next residential real estate shift. It is too early to predict a change from higher
Median Income and Median Home Price
 Homeownership Remains Unaffordable; Rental Affordability Showing Signs of Improvement Richard E. Taylor, Research Manager at MaineHousing MaineHousing has released the 217 Maine Homeownership and Rental
Monthly Indicators. December Quick Facts % % Year-Over-Year Change Year-Over-Year Change - 1.3% - 1.4% % + 0.1% - 1.4% + 2.
 Monthly Indicators A RESEARCH TOOL PROVIDED BY THE MASSACHUSETTS ASSOCIATION OF REALTORS 2018 Home prices were consistently up again in most markets in 2018 but at reduced levels compared to recent years.
Weekly Market Activity Report
 Weekly Market Report A RESEARCH TOOL FROM THE MINNEAPOLIS AREA ASSOCIATION OF REALTORS BROUGHT TO YOU BY THE UNIQUE DATA-SHARING TRADITIONS OF THE REALTOR COMMUNITY For Week Ending June 30, 2018 Publish
Housing Supply Overview
 Housing Supply Overview A RESEARCH TOOL PROVIDED BY SOUTH CAROLINA REALTORS July 2017 Local news outlets across the nation have been delving into the cause for lower sales totals in their markets during
+ 3.3% % + 8.4%
 ly Indicators A RESEARCH TOOL PROVIDED BY THE SANTA FE ASSOCIATION OF REALTORS INCLUDES ALL SINGLE FAMILY, CONDO AND TOWNHOME LISTINGS IN THE MLS Q2 2018 Housing markets across the nation are most assuredly
Housing Supply Overview
 Housing Supply Overview A RESEARCH TOOL PROVIDED BY SOUTH CAROLINA REALTORS January 2017 One of the new U.S. presidential administration's first moves was to remove a rate cut for loans backed by the Federal
Q Quick Facts - 3.2% 0.0% %
 CAAR Market Report Includes the city of Charlottesville and the counties of Albemarle, Fluvanna, Greene, Louisa and Nelson. Home prices were consistently up again in most markets in 2018 but at reduced
Quarterly Indicators Gallatin County, Montana
 Quarterly Indicators Gallatin County, Montana Quick Facts - 7.7% + 14.5% Home prices were consistently up again in most markets in 2018 but at reduced levels compared to recent years. High demand for few
ECONOMIC PERSPECTIVES
 February 4, 2019 ECONOMIC PERSPECTIVES EXISTING HOME SALES IN FHLBNY AREA HELD UP BETTER THAN THE NATION, REGION IN 2018 Authored by Brian Jones, FHLBNY Financial Economist HIGHLIGHTS:» Existing home sales
Monthly Indicators + 5.8% 0.0% % 2 New Listings. 3 Pending Sales. 4 5 Days on Market Until Sale. 6 7 Average Sales Price
 Monthly Indicators 2013 As potentially the brightest sun in the current economic recovery, housing activity has followed the mercury higher this summer. Interest rates and new construction activity have
Year to Date (thru June)
") CAAR Market Report 2009 Mid-Year Published by the Charlottesville Area Association of REALTORS Where Are We Now? The pace of home purchases in the Charlottesville area continues to improve from the dismal
CAAR Market Report 2009 Mid-Year Published by the Charlottesville Area Association of REALTORS Where Are We Now? The pace of home purchases in the Charlottesville area continues to improve from the dismal
Monthly Indicators + 8.8% + 4.3% - 3.6% Market Overview New Listings Pending Sales. Closed Sales. Days on Market Until Sale. Median Sales Price
 Monthly Indicators 2015 The third quarter of 2015 has ticked its last tock with the hands pointing firmly upon a reliable clock of a market. Although noon and 6:30 fluctuations are present even within
Monthly Indicators - 8.1% + 3.6% - 0.6% Activity Overview New Listings Pending Sales. Closed Sales. Days on Market Until Sale. Median Sales Price
 Monthly Indicators 2019 In addition to ongoing housing price increases and affordability concerns in the state of New York, the first quarter of 2019 saw a fair share of adverse weather as well. Sales
October 1, Victoria Real Estate Market Continues to Stabilize
 PRESIDENT Kyle Kerr PRESIDENT ELECT Cheryl Woolley SECRETARY TREASURER David Langlois PAST PRESIDENT Ara Balabanian DIRECTORS Jackie Adkins Sandi-Jo Ayers Bill Ethier Karen Dinnie-Smyth Andrew Plank EXECUTIVE
Monthly Indicators % - 1.6% + 6.0%
 ly Indicators A RESEARCH TOOL PROVIDED BY METRO MLS FOR ACTIVITY IN THE 4-COUNTY MILWAUKEE METROPOLITAN AREA 2019 Quick Facts It is worthwhile to mention the weather when discussing residential real estate
Monthly Indicators - 7.4% + 5.6% % Activity Overview New Listings Pending Sales. Closed Sales. Days on Market Until Sale. Median Sales Price
 Monthly Indicators 218 Rising home prices, higher interest rates and increased building material costs have pressured housing affordability to a ten-year low, according to the National Association of Home
Minneapolis St. Paul Residential Real Estate Index
 University of St. Thomas Minneapolis St. Paul Residential Real Estate Index Welcome to the latest edition of the UST Minneapolis St. Paul Residential Real Estate Index. The University of St Thomas Residential
January 2017 Washington, DC Market Trends Report Median Sales Price Up 4.6 percent Reaches Highest January Level on Record
 FOR IMMEDIATE RELEASE Contact: Bobette Banks 301-590-8764 Director of Communications Greater Capital Area Association of REALTORS bbanks@gcaar.com January 2017 Washington, DC Market Trends Report Median
Monthly Indicators. June Monthly Snapshot + 5.0% % + 6.6%
 Monthly Indicators 2017 Although sales have been robust locally, there has been a general slowdown in sales across much of the country, and this cannot be blamed on negative economic news. Wage growth,
Housing Supply Overview
 Housing Supply Overview A Research Tool Provided by the Greater San Diego Association of REALTORS December 2017 Quick Facts + 18.1% + 2.1% - 2.3% Inventory was again a driving metric in residential real
Q SOUTHWEST REGION
 Quarterly Indicators SOUTHWEST REGION Monthly Snapshot Includes the Durango Area Association of REALTORS, Four Corners Board of REALTORS, Pagosa Springs Area Association of REALTORS and the San Luis Valley
Monthly Indicators % % - 5.3% Activity Overview New Listings Pending Sales. Closed Sales. Days on Market Until Sale. Median Sales Price
 Monthly Indicators 2018 Housing price bubble chatter has increased this summer, as market observers attempt to predict the next residential real estate shift. It is too early to predict a change from higher
Monthly Indicators % - 0.2% - 9.5% Activity Overview New Listings Pending Sales. Closed Sales. Days on Market Until Sale. Median Sales Price
 Monthly Indicators 2015 Home prices were up during summer across the nation in year-over-year comparisons. With the economy on full mend, Federal Reserve Chair Janet Yellen has predicted a fine-tuning
Annual Report on the New York State Market FOR RESIDENTIAL REAL ESTATE ACTIVITY IN THE STATE OF NEW YORK
 Annual Report on the New York State Market FOR RESIDENTIAL REAL ESTATE ACTIVITY IN THE STATE OF NEW YORK Annual Report on the New York State Market FOR RESIDENTIAL REAL ESTATE ACTIVITY IN THE STATE OF
Monthly Indicators % % + 3.8% Activity Overview New Listings Pending Sales. Closed Sales. Days on Market Until Sale. Median Sales Price
 Monthly Indicators 2018 Home prices were consistently up again in most markets in 2018 but at reduced levels compared to recent years. High demand for few homes for sale fueled price increases, but evidence
2018 Housing Market Outlook. Central Coast Realty Group Business Symposium February 22, 2018 Oscar Wei Senior Economist
 2018 Housing Market Outlook Central Coast Realty Group Business Symposium February 22, 2018 Oscar Wei Senior Economist Overview Economic Update California Housing Market Outlook Regional Housing Market
rd Quarter Market Report
 2012 3 rd Quarter Market Report The voice of real estate in Central Virginia CAAR Member Copy Expanded Edition Charlottesville Area 3 rd Quarter 2012 Highlights: Overall sales in Greater Charlottesville
Monthly Indicators % % % Activity Overview New Listings Pending Sales. Closed Sales. Days on Market Until Sale. Median Sales Price
 Monthly Indicators 2018 Residential real estate activity has been relatively slow in the first quarter of 2018, yet housing is proving its resiliency in a consistently improving economy. Some markets have
Monthly Indicators % % - 9.2%
 Monthly Indicators 2016 New Listings were down 1.4 percent for single family/duplex homes and 25.0 percent for townhouse-condo properties. Pending Sales increased 58.3 percent for single family/duplex
Monthly Indicators + 6.3% % + 4.1% Market Overview New Listings Pending Sales. Closed Sales. Days on Market Until Sale. Median Sales Price
 Monthly Indicators 2016 As anticipated at the outset of the year, demand has remained high through the first three quarters of 2016, propping up sales and prices despite heavy reductions in inventory and
Monthly Indicators % + 3.6% %
 Monthly Indicators A RESEARCH TOOL PROVIDED BY NORTH TEXAS REAL ESTATE INFORMATION SYSTEMS, INC. 2018 Home prices were consistently up again in most markets in 2018 but at reduced levels compared to recent
Monthly Indicators % + 9.4% % Activity Overview New Listings Pending Sales. Closed Sales. Days on Market Until Sale. Median Sales Price
 Monthly Indicators 2017 The number of homes for sale, days on market and months of supply were all down in year-over-year comparisons in a majority of the country for the entirety of 2017, as was housing
Pikes Peak area housing Market Statistics (As of: 2/28/2018)
") Jan-1-1 -1-1 Jan-2-2 -2-2 Jan-3-3 -3-3 -4-4 -4-5 -5-5 -6-6 -6-7 -7-7 -8-8 -8-9 -9-9 -1-1 -1-11 -11-11 -12-12 -12-13 -13-13 -14-14 -14-15 -15-15 -16-16 -16-17 -17-17 Jan-1-1 -1-1 Jan-2-2 -2-2 Jan-3-3 -3-3
Jan-1-1 -1-1 Jan-2-2 -2-2 Jan-3-3 -3-3 -4-4 -4-5 -5-5 -6-6 -6-7 -7-7 -8-8 -8-9 -9-9 -1-1 -1-11 -11-11 -12-12 -12-13 -13-13 -14-14 -14-15 -15-15 -16-16 -16-17 -17-17 Jan-1-1 -1-1 Jan-2-2 -2-2 Jan-3-3 -3-3
Housing Price Forecasts. Illinois and Chicago PMSA, March 2017
 Housing Price Forecasts Illinois and Chicago PMSA, March 2017 Presented To Illinois Realtors From R E A L Regional Economics Applications Laboratory, Institute of Government and Public Affairs University
Quick Facts. For Week Ending July 29, 2017 Publish Date: August 7, 2017 All comparisons are to % - 4.7% - 16.
 Weekly Market Report A RESEARCH TOOL FROM THE SAINT PAUL AREA ASSOCIATION OF REALTORS. BROUGHT TO YOU BY THE UNIQUE DATA-SHARING TRADITIONS OF THE REALTOR COMMUNITY For Week Ending July 29, 2017 Publish
ANALYSIS OF THE CENTRAL VIRGINIA AREA HOUSING MARKET 1st quarter 2013 By Lisa A. Sturtevant, PhD George Mason University Center for Regional Analysis
 ANALYSIS OF THE CENTRAL VIRGINIA AREA HOUSING MARKET 1st quarter By Lisa A. Sturtevant, PhD George Mason University Center for Regional Analysis Economic Overview Key economic factors in the first quarter
Quick Facts. For Week Ending August 13, 2016 Publish Date: August 22, 2016 All comparisons are to % - 2.8% - 17.
 Weekly Market Report A RESEARCH TOOL FROM THE SAINT PAUL AREA ASSOCIATION OF REALTORS. BROUGHT TO YOU BY THE UNIQUE DATA-SHARING TRADITIONS OF THE REALTOR COMMUNITY For Week Ending August 13, 2016 Publish
The Real Estate Market Report
 The Real Estate Report 3rd quarter 2011 Prepared by: Candace Adams, President, Prudential Connecticut Realty Terence Beaty, Director, New Homes & Land, Prudential Connecticut Realty Connecticut Segments
CALGARY REGIONAL HOUSING MARKET STATISTICS 12.14
 CALGARY REGIONAL HOUSING MARKET STATISTICS 12.14 Yearly records set as monthly sales see slight decline Condominium and townhouse sales set a new record for 214 Calgary, January 2, 215 It was a record
Housing Price Forecasts. Illinois and Chicago PMSA, January 2018
 Housing Price Forecasts Illinois and Chicago PMSA, January 2018 Presented To Illinois Realtors From R E A L Regional Economics Applications Laboratory, Institute of Government and Public Affairs University
Monthly Indicators. Monthly Snapshot. July % + 7.8% %
 Monthly Indicators For residential real estate activity by members of the Florida REALTORS 2012 A few short years ago, housing was considered a headwind to economic recovery. Today, housing is seen as
Pikes Peak area housing Market Statistics (As of: 9/30/2018)
") $156,25 $184, $174,697 $177,2 $21,53 $185,83 $173, $178,29 $172,25 $212,75 $21,95 $226,692 $197,5 $199, $196, $28, $25, $223,95 $216,75 $29,527 $234,9 $218,82 $229,74 $235,518 $231,457 $255, $259,11 $269,98
$156,25 $184, $174,697 $177,2 $21,53 $185,83 $173, $178,29 $172,25 $212,75 $21,95 $226,692 $197,5 $199, $196, $28, $25, $223,95 $216,75 $29,527 $234,9 $218,82 $229,74 $235,518 $231,457 $255, $259,11 $269,98
Monthly Indicators % % %
 Monthly Indicators 2016 Percent changes calculated using year-over-year comparisons. New Listings were down 27.6 percent for single family homes and 41.8 percent for townhouse-condo properties. Pending
September 2016 RESIDENTIAL MARKET REPORT
 September 2016 RESIDENTIAL MARKET REPORT The real estate investment market in Japan has had an abundance of capital (both domestic & foreign) over the past couple of years. This, along with the low (now
Housing Price Forecasts. Illinois and Chicago PMSA, September 2016
 Housing Price Forecasts Illinois and Chicago PMSA, September 2016 Presented To Illinois Realtors From R E A L Regional Economics Applications Laboratory, Institute of Government and Public Affairs University
2017 RESIDENTIAL REAL ESTATE MARKET REPORT
 2017 RESIDENTIAL REAL ESTATE MARKET REPORT Published January 26, 2018 Our market reports have been focused on the effects of low inventory on our housing market and for good reason. December 2017 marked
Aug. Aug 2018 ust 2018
 August 18 MONTHLY STATISTICS PACKAGE City of Calgary Unemployment rate slows housing market recovery 18 City of Calgary, September, 18 Easing sales, gains in new listings and elevated inventory levels
Weak sales persist in Calgary and beyond Jun. 2018
 June 218 MONTHLY STATISTICS PACKAGE City of Calgary Weak sales persist in Calgary and beyond 218 City of Calgary, July 3, 218 Many Canadian energyrelated municipalities within Alberta and Saskatchewan
Monthly Indicators + 1.2% - 2.1% % Activity Overview New Listings Pending Sales. Closed Sales. Days on Market Until Sale. Median Sales Price
 Monthly Indicators 2017 We can comfortably consider the first quarter to have been a good start for residential real estate in 2017. There was certainly plenty to worry over when the year began. Aside
Monthly Indicators - 8.0% + 4.2% - 3.4% Activity Overview New Listings Pending Sales. Closed Sales. Days on Market Until Sale. Median Sales Price
 Monthly Indicators 2018 If the last few months are an indication of the temperature of housing markets across the country, a period of relative calm can be expected during the last three months of the
CAAR Market Report 2010 First Quarter Published by the Charlottesville Area Association of REALTORS
 CAAR Market Report 2010 First Quarter Published by the Charlottesville Area Association of REALTORS Where Are We Now? In the first quarter of 2010, the Charlottesville real estate market continued the
November 2018 Washington, DC Market Trends Report Median sales price highest November level in past 10 years
 FOR IMMEDIATE RELEASE Contact: Bryan Frantz 202.626.0097 Communications Specialist District of Columbia Association of REALTORS bfrantz@dcrealtors.org November 2018 Washington, DC Market Trends Report
Housing Price Forecasts. Illinois and Chicago PMSA, March 2018
 Housing Price Forecasts Illinois and Chicago PMSA, March 2018 Presented To Illinois Realtors From R E A L Regional Economics Applications Laboratory, Institute of Government and Public Affairs University
THE REAL ESTATE BOARD OF NEW YORK
 THE REAL ESTATE BOARD OF NEW YORK REAL ESTATE BROKER CONFIDENCE INDEX FIRST QUARTER 2018 EXECUTIVE SUMMARY The Real Estate Board of New York s (REBNY) Real Estate Broker Index for the first quarter of
MARKET AREA UPDATE Report as of: 1Q 2Q 3Q 4Q
 MARKET AREA UPDATE Report as of: 1Q 2Q 3Q 4Q Year: 2013 Market Area (City, State): Arlington, Virginia Provided by (Company / Companies): McEnearney Associates, Inc. Realtors What are the most significant
September 2017 Washington, DC Market Trends Report September median sales price drops 6.4 percent but still near record high
 FOR IMMEDIATE RELEASE Contact: Bobette Banks 301-590-8764 Director of Communications Greater Capital Area Association of REALTORS bbanks@gcaar.com September 2017 Washington, DC Market Trends Report September
REAL ESTATE MARKET OVERVIEW 1 st Half of 2015
 REAL ESTATE MARKET OVERVIEW 1 st Half of 2015 With Comparisons to the 2 nd Half of 2014 September 4, 2015 Prepared for: First Bank of Wyoming Prepared by: Ken Markert, AICP MMI Planning 2319 Davidson Ave.
Coachella Valley Median Detached Home Price Jan Jan 2017
 The Desert Housing Report Median Price $450,000 Coachella Valley Median Detached Home Price Jan 2002 - Jan 2017 $400,000 $350,000 $300,000 $250,000 $335,000 $340,000 $200,000 $150,000 CV Detached Median
Housing Supply Overview
 Housing Supply Overview A RESEARCH TOOL PROVIDED BY THE UPSTATE ALLIANCE OF REALTORS MLS December 2018 Housing affordability was a growing concern in 2018, and that is expected to intensify in 2019. Although
Our High Property Taxes Do Our Assessors Make up the Rules? Real Estate In-Depth November, 2012 By: Edward I. Sumber, Esq.*
 Our High Property Taxes Do Our Assessors Make up the Rules? Real Estate In-Depth November, 2012 By: Edward I. Sumber, Esq.* Approximately two years ago our lower Hudson Valley market was impacted by negative
Monthly Indicators + 4.3% + 6.5% % Market Overview New Listings Pending Sales. Closed Sales. Days on Market Until Sale. Median Sales Price
 Monthly Indicators 2019 It is worthwhile to mention the weather when discussing residential real estate for large portions of the U.S. for 2019, because this month has turned in some impressively cold,
AAug ugust 2017
 August 17 17 Housing recovery a balancing act Growth in new listings outpaced sales preventing inventory declines City of Calgary, September 1, 17 Sales posted a modest gain in August, but a rise in new
Monthly Indicators + 5.9% - 6.6% + 8.1%
 ly Indicators A RESEARCH TOOL PROVIDED BY METRO MLS FOR ACTIVITY IN THE 4-COUNTY MILWAUKEE METROPOLITAN AREA 2019 Quick Facts Despite a strong U.S. economy, historically low unemployment and steady wage
Monthly Indicators + 5.9% % % Activity Overview New Listings Pending Sales. Closed Sales. Days on Market Until Sale. Median Sales Price
 Monthly Indicators 2012 brought tragedy to many East Coast residents. The effects of Sandy compromised basic infrastructure, putting housing activity on hold in the affected areas as recovery took precedence.
Minneapolis St. Paul Residential Real Estate Index
 University of St. Thomas Minneapolis St. Paul Residential Real Estate Index Welcome to the latest edition of the UST Minneapolis St. Paul Residential Real Estate Index. The University of St Thomas Residential
Fewer home sales and listings in the first quarter of 2018
 News Release FOR IMMEDIATE RELEASE: Fewer home sales and listings in the first quarter VANCOUVER, BC April 4, Home buyers and sellers were less active in Metro Vancouver* throughout the first quarter.
March 2016 Washington, DC Market Trends Report March sales represent a 12 percent increase; top the five-year March average
 FOR IMMEDIATE RELEASE Contact: Bobette Banks 301-590-8764 Director of Communications Greater Capital Area Association of REALTORS bbanks@gcaar.com March 2016 Washington, DC Market Trends Report March sales
Weekly Market Activity Report
 Weekly Market Report A RESEARCH TOOL FROM THE MINNEAPOLIS AREA ASSOCIATION OF REALTORS BROUGHT TO YOU BY THE UNIQUE DATA-SHARING TRADITIONS OF THE REALTOR COMMUNITY For Week Ending July 8, 2017 Publish