October 11, THIRD QUARTER RESIDENTIAL REAL ESTATE SALES REPORT Westchester, Putnam, Rockland and Orange Counties, New York
|
|
|
- Violet Horton
- 6 years ago
- Views:
Transcription

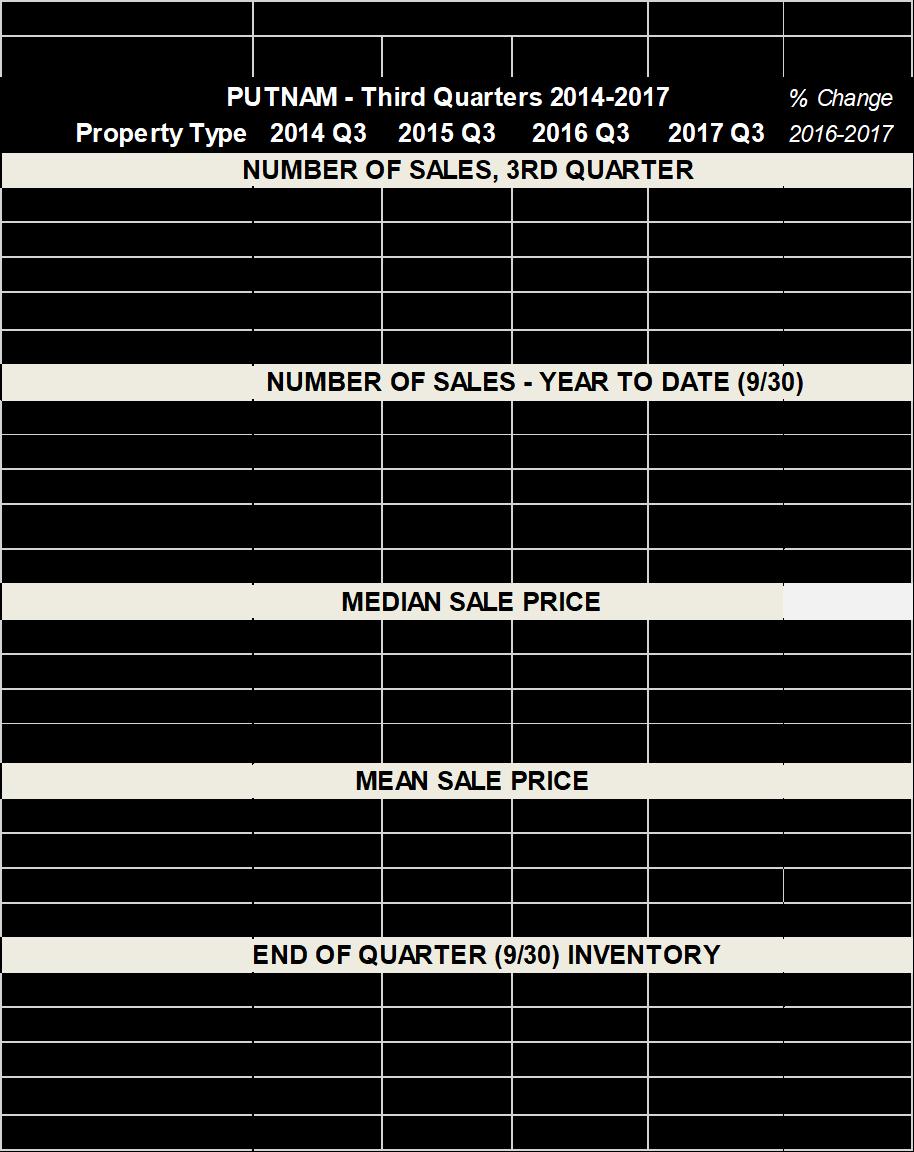
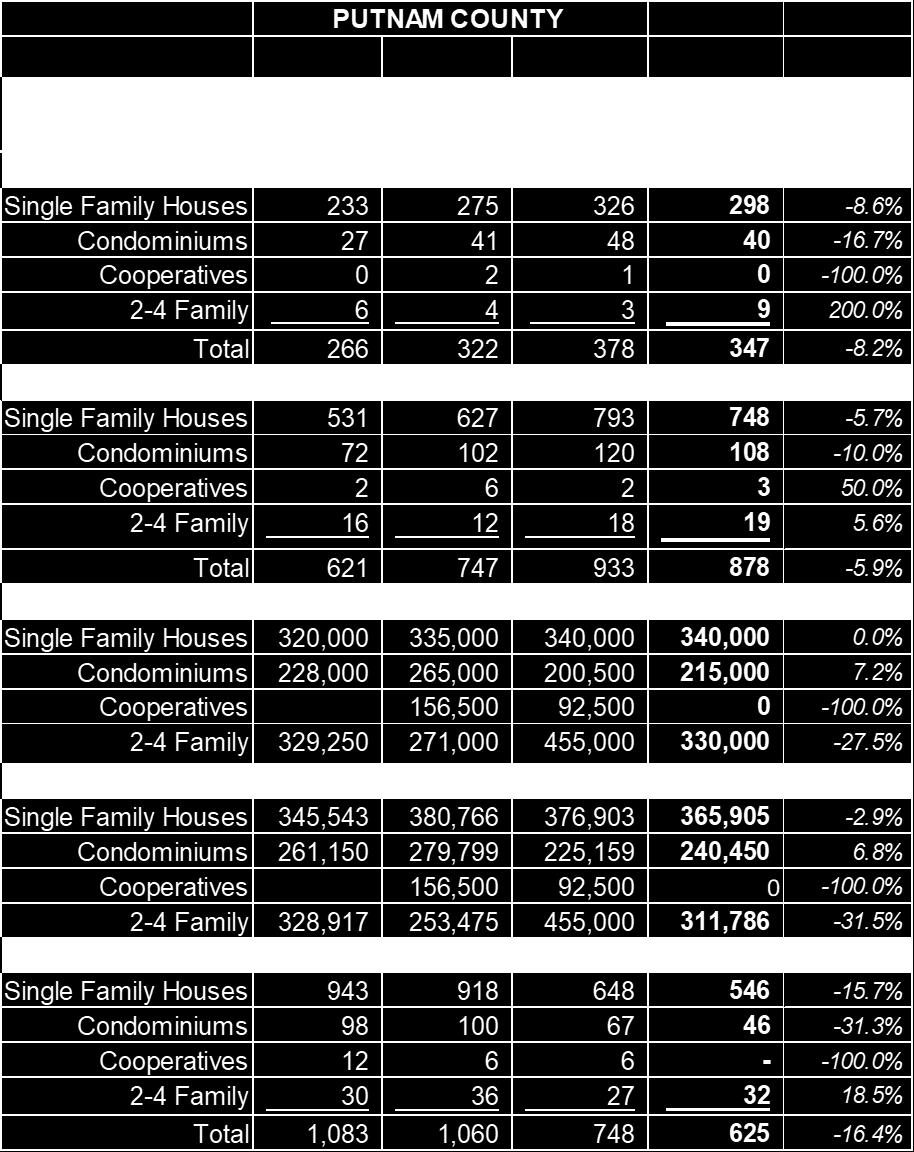
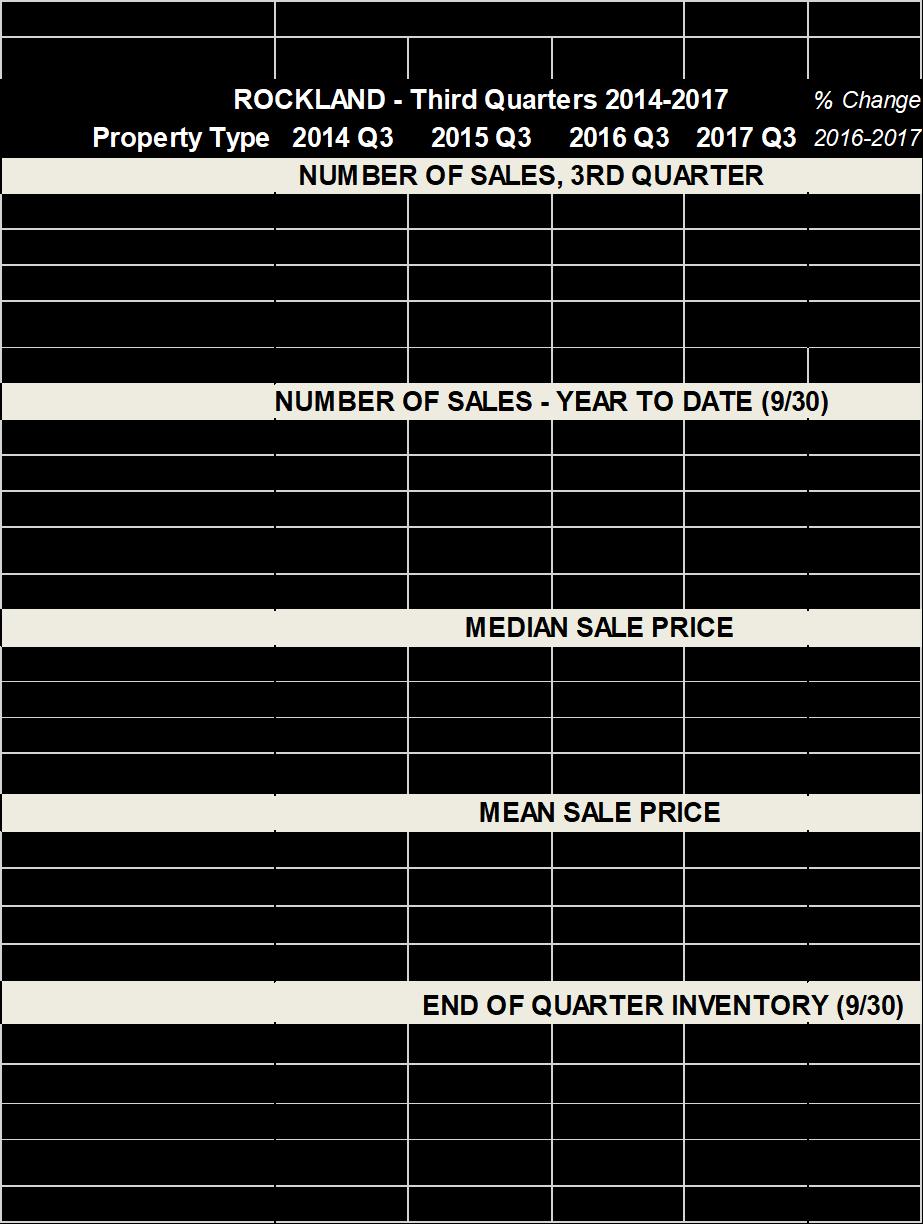
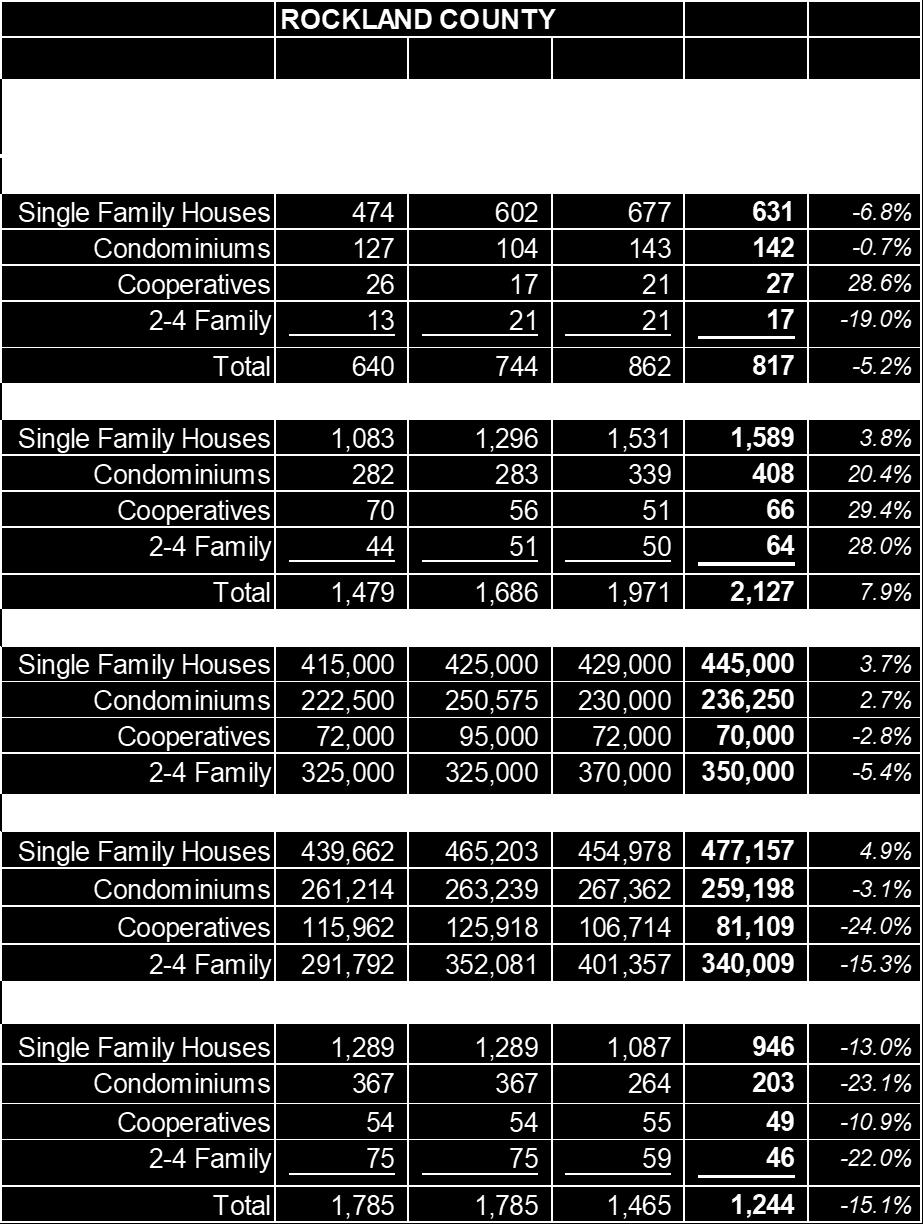
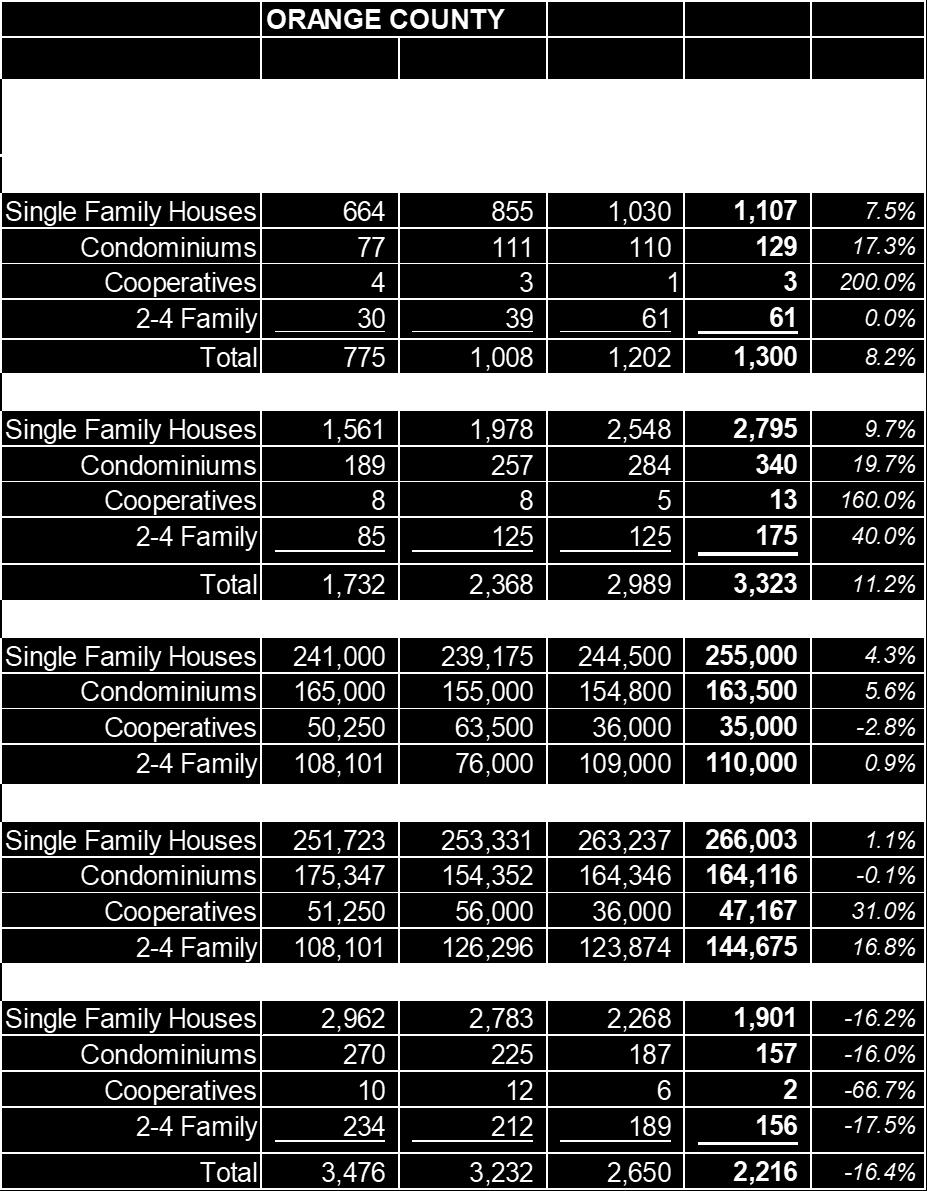
1 October 11, THIRD QUARTER RESIDENTIAL REAL ESTATE SALES REPORT Westchester, Putnam, Rockland and Orange Counties, New York Real estate sales continued at a brisk pace in the lower Hudson region, albeit at a slightly slower pace as the year has progressed. With the exception of Orange County where sales increased by 7.9%, third quarter sales figures were generally flat in the lower Hudson region that is served by the Hudson Gateway Multiple Listing Service. Prices, however, remain strong in all counties. The primary driver of spotty sales figures can most likely be attributed to the lack of inventory; down 16% in Orange, 16% in Putnam, 15% in Rockland and 8% in Westchester as compared to third quarter Westchester, the most populous county and the county with the highest number of sales, recorded a median sale price of $680,000 for a single-family home as compared to $668,000 for the same period last year. This represented an increase of 1.8%. Orange County had the highest percentage increase in median sales price at 4.3% going from $245,000 to $255,000 for the period. Single family median sales price in Rockland County, for the third quarter, rose to $445,000, an increase of 3.7% over last year. In Putnam County the median of $340,000 was unchanged from the third quarter of Total third quarter residential sales numbered 5,646 which was less than 0.5% fewer sales than third quarter Inventory has been consistently lower each quarter in each of the last four years which could indicate a headwind for healthy sales numbers going forward. It is difficult to ascertain at what point rising prices, due to lack of supply, will begin to affect sales. Hudson Gateway Association of REALTORS One Maple Avenue 9 Coates Drive, Suite 1 2 Medical Park Drive, Suite 17A Hudson Gateway Multiple Listing Service, Inc. White Plains, NY Goshen, NY West Nyack, NY HGAR.com Telephone Telephone Telephone Fax
2 The 2017 year to date sales figures continue to trend significantly higher than the previous year for most of the lower Hudson region. The macro environment, e.g. attractive mortgage rates, high employment and a healthy economy should be an indication that the market will remain vibrant. # # # # The Hudson Gateway Multiple Listing Service, Inc. (HGMLS) is a subsidiary of the Hudson Gateway Association of Realtors, Inc. (HGAR). HGMLS s principal service area consists of Westchester, Putnam, Rockland and Orange Counties. It also provides services to Realtors in Bronx, Dutchess, Sullivan and Ulster Counties. The reported transactions do not include all real estate sales in the area or all sales assisted by the participating offices but they are fairly reflective of general market activity. HGMLS does not provide data on sub-county areas but persons desiring such data are invited to contact Realtor offices in the desired areas. Prior reports back to 1981 as well as current market information and a directory of Realtor members are available on the Association s Web site, *The median sale price is the mid-point of all reported sales, i.e., half of the properties sold for more than the median price and half for less. The median is relatively unaffected by unusually high or low sales prices. The mean sale price is the arithmetic average, i.e., the sum of all sales prices divided by the number of sales. The mean does reflect the influence of sales at unusually low or high prices. Four tables follow with detailed market data for each county.
3 WESTCHESTER COUNTY WESTCHESTER - Third Quarters % Change Property Type 2014 Q Q Q Q NUMBER OF SALES, 3RD QUARTER Single Family Houses 1,935 2,065 2,108 1, % Condominiums % Cooperatives % 2-4 Family % Total 2,863 3,157 3,202 3, % NUMBER OF SALES - YEAR TO DATE (9/30) Single Family Houses 4,205 4,092 4,318 4, % Condominiums , % Cooperatives 1,147 1,209 1,308 1, % 2-4 Family % Total 6,539 6,348 6,960 7, % MEDIAN SALE PRICE Single Family Houses 682, , , , % Condominiums 375, , , , % Cooperatives 155, , , , % 2-4 Family 425, , , , % MEAN SALE PRICE Single Family Houses 914, , , , % Condominiums 422, , , , % Cooperatives 188, , , , % 2-4 Family 418, , , , % END OF QUARTER INVENTORY (9/30) Single Family Houses 3,618 3,614 2,956 2, % Condominiums % Cooperatives 1,268 1, % 2-4 Family % Total 5,910 5,657 4,524 4, %
4
5
6
2018 ANNUAL AND 4TH QUARTER RESIDENTIAL REAL ESTATE SALES REPORT Westchester, Putnam, Rockland, Orange and Sullivan Counties, New York
 January 8, 2019 2018 ANNUAL AND 4TH QUARTER RESIDENTIAL REAL ESTATE SALES REPORT Westchester, Putnam, Rockland, Orange and Sullivan Counties, New York While remaining robust, residential sales in some
2018 SECOND QUARTER RESIDENTIAL REAL ESTATE SALES REPORT Westchester, Putnam, Rockland and Orange Counties, New York
 July 5, 2018 2018 SECOND QUARTER RESIDENTIAL REAL ESTATE SALES REPORT Westchester, Putnam, Rockland and Orange Counties, New York Second quarter sales figures in the lower Hudson region served by the Hudson
October 10, THIRD QUARTER RESIDENTIAL REAL ESTATE SALES REPORT Westchester, Putnam, Rockland and Orange Counties, New York
 October 10, 2018 2018 THIRD QUARTER RESIDENTIAL REAL ESTATE SALES REPORT Westchester, Putnam, Rockland and Orange Counties, New York Third quarter real estate sales in the lower Hudson Valley remained
Hudson Valley Home Sales Continue to Increase, But at Lower Rate
 January 11, 2018 Hudson Valley Home Sales Continue to Increase, But at Lower Rate 2017 ANNUAL AND FOURTH QUARTER REAL ESTATE SALES REPORT Westchester, Putnam, Rockland and Orange Counties, New York WHITE
HGAR HUDSON GATEWAY ASSOCIATION OF REALTORS, INC.
 HGAR HUDSON GATEWAY ASSOCIATION OF REALTORS, INC. HUDSON GATEWAY ASSOCIATION OF REALTORS, INC. 60 South Broadway, White Plains, New York 10601 914.681.0833 Fax 914.681.6044 www.hgar.com 9 Coates Drive,
2016 ANNUAL AND FOURTH QUARTER REAL ESTATE SALES REPORT Westchester, Putnam, Rockland and Orange Counties, New York
 January 16, 2017 Hudson Valley Posts Strongest Home Sales Since Recession 2016 ANNUAL AND FOURTH QUARTER REAL ESTATE SALES REPORT Westchester, Putnam, Rockland and Orange Counties, New York WHITE PLAINS
April 11, FIRST QUARTER REAL ESTATE SALES REPORT Westchester, Putnam, Rockland and Orange Counties, New York
 April 11, 2016 2016 FIRST QUARTER REAL ESTATE SALES REPORT Westchester, Putnam, Rockland and Orange Counties, New York Realtors operating in the four-county lower Hudson region served by the Hudson Gateway
HGAR HUDSON GATEWAY ASSOCIATION OF REALTORS, INC.
 09-2 09-3 09-4 10-1 10-2 10-3 10-4 11-1 11-2 11-3 11-4 12-1 12-2 12-3 12-4 13-1 13-2 13-3 13-4 14-1 14-2 Number of Sales HGAR HUDSON GATEWAY ASSOCIATION OF REALTORS, INC. HUDSON GATEWAY ASSOCIATION OF
HGAR HUDSON GATEWAY ASSOCIATION OF REALTORS, INC.
 HGAR HUDSON GATEWAY ASSOCIATION OF REALTORS, INC. HUDSON GATEWAY ASSOCIATION OF REALTORS, INC. 60 South Broadway, White Plains, New York 10601 914.681.0833 Fax 914.681.6044 www.hgar.com 9 Coates Drive,
2011 SECOND QUARTER RESIDENTIAL REAL ESTATE SALES REPORT Westchester and Putnam Counties, New York
 Westchester Putnam Association of REALTORS, Inc. Empire Access Multiple Listing Service, Inc. 60 South Broadway, White Plains, NY 10601 914.681.0833 Fax: 914.681.6044 www.wpar.com Putnam Office: 155 Main
CREATING CONNECTIONS TO HELP YOUR BUSINESS THRIVE
 THE HUDSON GATEWAY ASSOCIATION OF REALTORS CREATING CONNECTIONS TO HELP YOUR BUSINESS THRIVE AFFILIATE MEMBERSHIPS MARKETING EVENT SPONSORSHIPS 2019 REAL ESTATE IN-DEPTH ADVERTISING The Hudson Gateway
Annual Report on the New York State Market FOR RESIDENTIAL REAL ESTATE ACTIVITY IN THE STATE OF NEW YORK
 Annual Report on the New York State Market FOR RESIDENTIAL REAL ESTATE ACTIVITY IN THE STATE OF NEW YORK FOR RESIDENTIAL REAL ESTATE ACTIVITY IN THE STATE OF NEW YORK While the 2017 housing market was
Quarterly Indicators. Q Activity Snapshot + 3.5% + 3.1% % Activity Overview New Listings Pending Sales. Closed Sales.
 Quarterly Indicators Q4-2016 Activity Snapshot Most of 2016 offered the same monthly housing market highlights. The number of homes for sale was drastically down in year-over-year comparisons, along with
Local Board/Association Presidents, Executive Officers, and NYSAR Regional Vice Presidents
 Memo To: Local Board/Association Presidents, Executive Officers, and NYSAR Regional Vice Presidents From: NYSAR President Christine CJ DelVecchio Date: 5/23/18 Re: April 2018 Housing Market Reports The
Annual Report on the New York State Market FOR RESIDENTIAL REAL ESTATE ACTIVITY IN THE STATE OF NEW YORK
 Annual Report on the New York State Market FOR RESIDENTIAL REAL ESTATE ACTIVITY IN THE STATE OF NEW YORK Annual Report on the New York State Market FOR RESIDENTIAL REAL ESTATE ACTIVITY IN THE STATE OF
ECONOMIC PERSPECTIVES
 February 4, 2019 ECONOMIC PERSPECTIVES EXISTING HOME SALES IN FHLBNY AREA HELD UP BETTER THAN THE NATION, REGION IN 2018 Authored by Brian Jones, FHLBNY Financial Economist HIGHLIGHTS:» Existing home sales
Appendix D HOUSING WORK GROUP REPORT JULY 10, 2002
 Appendix D HOUSING WORK GROUP REPORT JULY 10, 2002 Work Group Assignment At the 20/20 forum in April 2001, the community expressed a need for housing policies which will protect both the Town s social
Monthly Indicators + 5.8% 0.0% % 2 New Listings. 3 Pending Sales. 4 5 Days on Market Until Sale. 6 7 Average Sales Price
 Monthly Indicators 2013 As potentially the brightest sun in the current economic recovery, housing activity has followed the mercury higher this summer. Interest rates and new construction activity have
Monthly Indicators % % % Activity Overview New Listings Pending Sales. Closed Sales. Days on Market Until Sale. Median Sales Price
 Monthly Indicators 2018 Residential real estate activity has been relatively slow in the first quarter of 2018, yet housing is proving its resiliency in a consistently improving economy. Some markets have
Monthly Indicators. Quick Facts + 2.3% + 4.0% - 3.1% February 2019
 Monthly Indicators 2019 There were 844 more homes sold across the state in than the month before, making January s increase in pending sales a true prediction. However, year-to-date home sales lag 2018
REAL ESTATE MARKET OVERVIEW 1 st Half of 2015
 REAL ESTATE MARKET OVERVIEW 1 st Half of 2015 With Comparisons to the 2 nd Half of 2014 September 4, 2015 Prepared for: First Bank of Wyoming Prepared by: Ken Markert, AICP MMI Planning 2319 Davidson Ave.
Private Residential Market REAL ESTATE DATA TREND Q3 2018
 Private Residential Market REAL ESTATE DATA TREND Q3 2018 Duo Residences Page 1 Notwithstanding the recent property cooling measures, the private residential market remained resilient in Q3 Sentiment in
Monthly Indicators % % - 5.3% Activity Overview New Listings Pending Sales. Closed Sales. Days on Market Until Sale. Median Sales Price
 Monthly Indicators 2018 Housing price bubble chatter has increased this summer, as market observers attempt to predict the next residential real estate shift. It is too early to predict a change from higher
Our High Property Taxes Do Our Assessors Make up the Rules? Real Estate In-Depth November, 2012 By: Edward I. Sumber, Esq.*
 Our High Property Taxes Do Our Assessors Make up the Rules? Real Estate In-Depth November, 2012 By: Edward I. Sumber, Esq.* Approximately two years ago our lower Hudson Valley market was impacted by negative
Market Segmentation: The Omaha Condominium Market
 Market Segmentation: The Omaha Condominium Market Roger P. Sindt Steven Shultz University of Nebraska at Omaha Introduction A highly visible and growing niche in the homeownership market is the condominium
San Francisco Housing Market Update
 San Francisco Housing Market Update California Economic and Housing Market Outlook The national economy maintained a healthy growth rate in the first quarter of 2005 and appeared to be settling in for
Local Government Snapshot
 N Minimum Maximum Sum Assessmen t Costs_CY 2009 Valid N 57 NE W YORK STATE OFFICE (listwise) OF THE STATE COMP TROLLER Thomas P. DiNapoli State Comptroller May 2011 Sum LG Class Code 03 60797625 Real property
Yearly Median List Price of Residential Homes For December of Each Year (Prescott Area MLS)
") $350,000 $300,000 $250,000 $200,000 $150,000 $100,000 $50,000 $0 $125,992 $138,821 $161,413 Yearly Median List Price of Residential Homes For December of Each Year (Prescott Area MLS) $173,233 $207,325
$350,000 $300,000 $250,000 $200,000 $150,000 $100,000 $50,000 $0 $125,992 $138,821 $161,413 Yearly Median List Price of Residential Homes For December of Each Year (Prescott Area MLS) $173,233 $207,325
Monthly Indicators + 3.5% + 2.1% - 9.4% Activity Overview New Listings Pending Sales. Closed Sales. Days on Market Until Sale. Median Sales Price
 Monthly Indicators 217 How long can the residential real estate market go on like this? We are about two years into a national trend of dropping housing supply and increasing median sales prices. There
1 st Quarter 2015 Asheville and Buncombe County Real Estate Market Analysis
 1 st Quarter 2015 Asheville and Buncombe County Real Estate Market Analysis This report examines the Asheville and Buncombe County residential real estate market through the end of the 1 st quarter of
ANALYSIS OF THE CENTRAL VIRGINIA AREA HOUSING MARKET 1st quarter 2013 By Lisa A. Sturtevant, PhD George Mason University Center for Regional Analysis
 ANALYSIS OF THE CENTRAL VIRGINIA AREA HOUSING MARKET 1st quarter By Lisa A. Sturtevant, PhD George Mason University Center for Regional Analysis Economic Overview Key economic factors in the first quarter
HOULIHAN LAWRENCE COMMERCIAL GROUP
 HOULIHAN LAWRENCE COMMERCIAL GROUP TH QUARTER EXECUTIVE SUMMARY FOURTH QUARTER Dear Clients, With behind us and the new year in full swing, we can now reflect, summarize and gain insight from the past
Monthly Indicators + 8.7% - 1.6% % Activity Overview New Listings Pending Sales. Closed Sales. Days on Market Until Sale. Median Sales Price
 Monthly Indicators 2018 Residential real estate activity has been relatively slow in the first quarter of 2018, yet housing is proving its resiliency in a consistently improving economy. Some markets have
Manhattan Residential Rental Market Report
 Manhattan Residential Rental Market Report Second Quarter 217 Second Quarter 217 This report follows overall conditions in the Manhattan rental market during June as well as throughout the second quarter
Monthly Indicators % % - 3.5%
 Monthly Indicators 2017 New Listings were up 6.3 percent for the category but decreased 33.1 percent for the category. Pending Sales increased 5.0 percent for but decreased 1.3 percent for. The Median
Fourth Quarter 2018 Market Report Manhattan Residential
 Market Report Manhattan Residential Data Highlights Cover Property: Halstead.com WEB# 19041474 A pickup in luxury new development closings pushed the average price higher than a year ago. The median apartment
Ridgefield. Interpreting the Market. Real Estate Report 2016 Mid Year Review. karlamurtaugh.com
 Ridgefield Real Estate Report 2016 Mid Year Review Interpreting the Market karlamurtaugh.com 203.856.5534 REAL ESTATE REPORT 2016 MID YEAR REVIEW Ridgefield Real Estate 2016 Mid Year Review Sales During
CAAR Market Report 2010 Mid-Year Published by the Charlottesville Area Association of REALTORS
 CAAR Market Report 2010 Mid-Year Published by the Charlottesville Area Association of REALTORS Where Are We Now? The pace of home purchases in the Charlottesville market area showed a significant increase
Quick Facts. For Week Ending October 27, 2018 Publish Date: November 5, 2018 All comparisons are to % - 9.1% - 1.
 Weekly Market Report A RESEARCH TOOL FROM THE SAINT PAUL AREA ASSOCIATION OF REALTORS. BROUGHT TO YOU BY THE UNIQUE DATA-SHARING TRADITIONS OF THE REALTOR COMMUNITY For Week Ending October 27, 2018 Publish
Monthly Indicators + 5.7% % % Market Overview New Listings Pending Sales. Closed Sales. Days on Market Until Sale. Median Sales Price
 Monthly Indicators 2018 The three most prominent national market trends for residential real estate are the ongoing lack of abundant inventory, the steadily upward movement of home prices and year-over-year
Austin-area home prices set August record, outpace household income growth in August 2015
 Austin-area home prices set August record, outpace household income growth in August 2015 Market Reports Austin Board of REALTORS releases real estate statistics for August 2015 AUSTIN, Texas September
Manhattan Residential Market Report. Fourth Quarter 2007
 Manhattan Residential Market Report Fourth Quarter 2007 A Strong Finish to 2007 The Manhattan residential market continued to buck the national trend last quarter, as prices finished the year at record
Monthly Indicators + 3.5% + 3.0% % Activity Overview New Listings Pending Sales. Closed Sales. Days on Market Until Sale. Median Sales Price
 Monthly Indicators 218 Housing price bubble chatter has increased this summer, as market observers attempt to predict the next residential real estate shift. It is too early to predict a change from higher
The Coldwell Banker Carlson Real Estate Market Report
 The Coldwell Banker Carlson Real Estate Market Report 2017 Year-End Stowe Area Report Our 2017 Year-End Market Report uses market-wide data, based on transactions that closed in 2017 in the Multiple Listing
Monthly Indicators - 8.1% + 3.6% - 0.6% Activity Overview New Listings Pending Sales. Closed Sales. Days on Market Until Sale. Median Sales Price
 Monthly Indicators 2019 In addition to ongoing housing price increases and affordability concerns in the state of New York, the first quarter of 2019 saw a fair share of adverse weather as well. Sales
Monthly Indicators. September Quick Facts + 0.2% + 5.0% %
 Monthly Indicators 2017 It s not just you there really are fewer homes for sale and more are selling. Indiana s statewide housing market has outpaced 2016 in sales and price growth 9 out of 9 months this
FOR IMMEDIATE RELEASE Contact: Brenda Morton Dulles Area Association of REALTORS
 FOR IMMEDIATE RELEASE Contact: Brenda Morton 703 777 2468 Dulles Area Association of REALTORS bmorton@dullesarea.com August 2018 Loudoun County Market Trends Report Despite persistent low inventory, sales
500 Q Q Q Q Q Q Q Q Q Q Q1-2014
 A QUARTERLY UPDATE ON THE ROLE OF FORECLOSURES IN THE REGION PROVIDED BY THE METROPOLITAN INDIANAPOLIS BOARD OF REALTORS Number of Available for Sale 2,250 2,000 1,750 1,500 1,250 1,000 750 500 Q3-2014
Monthly Indicators + 3.3% + 1.9% % Market Overview New Listings Pending Sales. Closed Sales. Days on Market Until Sale. Median Sales Price
 Monthly Indicators 2017 How long can the residential real estate market go on like this? We are about two years into a national trend of dropping housing supply and increasing median sales prices. There
rd Quarter Market Report
 2012 3 rd Quarter Market Report The voice of real estate in Central Virginia CAAR Member Copy Expanded Edition Charlottesville Area 3 rd Quarter 2012 Highlights: Overall sales in Greater Charlottesville
Market Report Summary 2006 Northwest Arkansas. Prepared By Judy Luna. Copyright 2007 Judy Luna
 Market Report Summary 26 Northwest Arkansas Prepared By Judy Luna Copyright 27 Judy Luna Northwest Arkansas Market Area For the purposes of this report, the Northwest Arkansas market area includes Washington
Quick Facts. For Week Ending July 14, 2018 Publish Date: July 23, 2018 All comparisons are to % - 2.7% - 14.
 Weekly Market Report A RESEARCH TOOL FROM THE SAINT PAUL AREA ASSOCIATION OF REALTORS. BROUGHT TO YOU BY THE UNIQUE DATA-SHARING TRADITIONS OF THE REALTOR COMMUNITY For Week Ending July 14, 2018 Publish
NANTUCKET REAL ESTATE
 NANTUCKET REAL ESTATE YEAR IN REVIEW 2016 Nantucket Real Estate A Comprehensive Analysis by Jen Shalley (508) 228 4407 21 Main Street, Nantucket, MA 2 2016 NANTUCKET REAL ESTATE IN PHOTOS $19 HIGHEST SALE
Monthly Indicators. Monthly Snapshot. July % + 7.8% %
 Monthly Indicators For residential real estate activity by members of the Florida REALTORS 2012 A few short years ago, housing was considered a headwind to economic recovery. Today, housing is seen as
TEXAS LUXURY HOME SALES REPORT Edition
 TEXAS LUXURY HOME SALES REPORT 2018 Edition ABOUT THE TEXAS LUXURY HOME SALES REPORT The 2018 edition of the Texas Luxury Home Sales Report is provided by the Data Relevance Project, a partnership among
Weekly Market Activity Report
 X0A0T Weekly Market Report A RESEARCH TOOL FROM THE MINNEAPOLIS AREA ASSOCIATION OF REALTORS BROUGHT TO YOU BY THE UNIQUE DATA-SHARING TRADITIONS OF THE REALTOR COMMUNITY For Week Ending July 14, 2018
MOLLY A. CARHART - APPRAISER'S QUALIFICATIONS 6 FRONT STREET NEWBURGH, NY NYS LICENSE #
 MOLLY A. CARHART - APPRAISER'S QUALIFICATIONS 6 FRONT STREET NEWBURGH, NY 12550 845-568-0600 EMAIL: MOLLYC@VCINY.COM NYS LICENSE # 45000000117 PROFESSIONAL AFFILIATIONS: Orange County Assessor's Association
The Greater Reno-Tahoe Real Estate Report
 February, 2018February, 2018 February, 2018 Issue The Greater Reno-Tahoe Real Estate Report Housing Market Trends for: Reno, Sparks, Carson City, Carson Valley, Lake Tahoe, Dayton, and Fernley A FREE monthly
QUARTERLY MARKET REPORT SECOND QUARTER 2010
 QUARTERLY MARKET REPORT SECOND QUARTER 2010 Manhattan s and s Average and Median Sale Price Manhattan apartment closings rose 81% compared to a year ago, reaching their highest level since the third quarter
Monthly Indicators + 9.9% - 1.7% % Activity Overview New Listings Pending Sales. Closed Sales. Days on Market Until Sale. Median Sales Price
 Monthly Indicators 2015 All expectations in 2015 are for a healthy and energetic selling season. National stories have been highlighting an increase in new construction sales and pending sales, but national
HOUSING REPORTS. Mountain District Single Family and Condo. Quarter 2, Colorado Association of REALTORS
 HOUSING REPORTS Research tools provided by the Colorado Association of REALTORS Mountain District and Quarter 2, 2014 2014 Colorado Association of REALTORS Total Market Overview Key metrics by report quarter
200 Q Q Q Q Q Q Q Q Q Q Q Q Q Q Q Update Table of Contents
 A QUARTERLY UPDATE ON THE ROLE OF FORECLOSURES IN THE REGION PROVIDED BY THE MIBOR REALTOR ASSOCIATION Number of Available for Sale 2,200 1,950 1,700 1,450 1,200 950 700 450 200 Q3-2017 Update Table of
2008 Mid-Year CAAR Market Report Real Estate Market is as Hot as ANWR
 2008 Mid-Year CAAR Market Report Real Estate Market is as Hot as ANWR By Dave Phillips, CEO Charlottesville Area Association of REALTORS Just about everything in life is relative to your perspective. Based
Now is a great time to explore your options with Oxford
 Having trouble reading this email? View it in your browser. For best viewing of future emails, please add us to your Safe Senders List or Address Book. October 3, 2017 Now is a great time to explore your
ESSEX COUNT Y, NEW JERSEY MARKET REPORT THIRD QUARTER
 2017 ESSEX COUNT Y, NEW JERSEY MARKET REPORT THIRD QUARTER Montclair The average sale price reached $786,000, an increase of 5% over prior year. The median sale price also rose ending at $735,000 or 4%
2015 First Quarter Market Report
 2015 First Quarter Market Report CAAR Member Copy Expanded Edition Charlottesville Area First Quarter 2015 Highlights: Median sales price for the region was up 5.1% over Q1-2014, rising from $244,250 to
Monthly Indicators + 7.3% + 6.6% + 8.3% Single-Family Market Overview Condo Market Overview New Listings Pending Sales.
 Monthly Indicators 2018 The three most prominent national market trends for residential real estate are the ongoing lack of abundant inventory, the steadily upward movement of home prices and year-over-year
Monthly Indicators - 8.0% + 4.2% - 3.4% Activity Overview New Listings Pending Sales. Closed Sales. Days on Market Until Sale. Median Sales Price
 Monthly Indicators 2018 If the last few months are an indication of the temperature of housing markets across the country, a period of relative calm can be expected during the last three months of the
Monthly Indicators - 5.9% + 7.1% % Market Overview New Listings Pending Sales. Closed Sales Median Sales Price
 Monthly Indicators 2018 Housing price bubble chatter has increased this summer, as market observers attempt to predict the next residential real estate shift. It is too early to predict a change from higher
Q Quick Facts - 3.2% 0.0% %
 CAAR Market Report Includes the city of Charlottesville and the counties of Albemarle, Fluvanna, Greene, Louisa and Nelson. Home prices were consistently up again in most markets in 2018 but at reduced
Q B O S T O N M A R K E T R E P O R T
 Q 3 2 1 7 B O S T O N M A R K E T R E P O R T Introducing the Compass Q3 217 Greater Boston Market Report Page 2 Page 3 Page 5 Page 7 Page 8 Map of Coverage Area Single Family Overview Condo Overview Time
Monthly Indicators + 4.8% - 3.5% %
 Monthly Indicators 2015 New Listings were up 45.0 percent for single family/duplex homes but decreased 44.1 percent for townhouse-condo properties. Pending Sales increased 14.3 percent for single family/duplex
MANHATTAN RESIDENTIAL MARKET REPORT FIRST QUARTER
 2018 MANHATTAN RESIDENTIAL MARKET REPORT FIRST QUARTER Data Highlights FIRST QUARTER 2018 Cover Property: halstead.com WEB# 18230107 The average price for all apartments fell 8% from a year ago to $1,987,045,
Monthly Indicators % + 3.9% % 2 New Listings. 3 Pending Sales. 4 5 Days on Market Until Sale. 6 7 Average Sales Price
 Monthly Indicators 2012 It's been a giant year for the housing market and for sports teams named Giants. As we round out the remaining two months of the year, let's recap. Most markets shed listings, resulting
Quick Facts. For Week Ending January 12, 2019 Publish Date: January 21, 2019 All comparisons are to % + 6.9% + 2.
 Weekly Market Report A RESEARCH TOOL FROM THE SAINT PAUL AREA ASSOCIATION OF REALTORS. BROUGHT TO YOU BY THE UNIQUE DATA-SHARING TRADITIONS OF THE REALTOR COMMUNITY For Week Ending January 12, 2019 Publish
Manhattan Residential. SECOND quarter
 2016 Manhattan Residential MARket Report SECOND quarter Data Highlights Cover Property: halstead.com WEB# 14786560 The average and median prices fell from last quarter s records, but remain higher than
Weekly Market Activity Report
 Weekly Market Report A RESEARCH TOOL FROM THE MINNEAPOLIS AREA ASSOCIATION OF REALTORS BROUGHT TO YOU BY THE UNIQUE DATA-SHARING TRADITIONS OF THE REALTOR COMMUNITY For Week Ending June 30, 2018 Publish
The Corcoran Report 3Q17 MANHATTAN
 The Corcoran Report 3Q17 MANHATTAN Contents Third Quarter 2017 4/7 12/23 3 Overview 8 9 10 Market Wide 11 Luxury 24 4 Sales / Days on Market 5 Inventory / Months of Supply 6 7 Market Share Resale Co-ops
MONTGOMERY COUNTY JULY 2018
 STATPAK MONTGOMERY COUNTY JULY 2018 McEnearney.com MARKET IN A MINUTE A SUMMARY OF MARKET CONDITIONS FOR JUNE & FIRST HALF 2018 Contract activity in June 2018 was up 1.2% from June 2017, solely because
Housing market feels the chill as oversupply continues Feb. 2019
 February 19 19 MONTHLY STATISTICS PACKAGE Housing market feels the chill as oversupply continues 19, March 1, 19 The effects of Calgary s economic climate continue to create weak sales activity and elevated
Manhattan Residential. THIRD quarter
 2015 Manhattan Residential MARket Report THIRD quarter Data Highlights Cover Property: halstead.com WEB# 13231035 $995,000 New record median price for Manhattan apartments. Reported sales up 9% from. halstead.com
Monthly Indicators. October Monthly Snapshot % + 9.0% %
 Monthly Indicators For residential real estate activity by members of the Florida REALTORS 2012 As we round out the remaining two months of the year, let's recap. Most markets shed listings, resulting
MARKET AREA UPDATE Year: 2017 Report as of: 1Q 2Q 3Q 4Q
 MARKET AREA UPDATE Year: 2 Report as of: 1Q 2Q 3Q 4Q Market Area (City, State): Fort Myers/Cape Coral, Florida Provided by (Company / Companies): Real Estate Provided by RDC Member(s): What are the most
Monthly Indicators % % % Activity Overview New Listings Pending Sales. Closed Sales. Days on Market Until Sale. Median Sales Price
 Monthly Indicators 2017 tends to mark the waning of housing activity ahead of the school year. Not all buyers and sellers have children, but there are enough parents that do not want to uproot their children
2015 Spring Market trends report
 2015 Spring Market trends Report National Summary Low inventory in Vancouver and Toronto continue to drive prices as buyers find themselves in competition over the low supply of single-family homes. The
CAAR Market Report 2010 First Quarter Published by the Charlottesville Area Association of REALTORS
 CAAR Market Report 2010 First Quarter Published by the Charlottesville Area Association of REALTORS Where Are We Now? In the first quarter of 2010, the Charlottesville real estate market continued the
HOUSING REPORTS. Mountain District Single Family and Condo. Quarter 3, Colorado Association of REALTORS
 HOUSING REPORTS Research tools provided by the Colorado Association of REALTORS Mountain District and Quarter 3, 2014 2014 Colorado Association of REALTORS Total Market Overview Key metrics by report quarter
MonthlyStatistics MAY 2018
 MonthlyStatistics MAY 2018 FOR IMMEDIATE RELEASE June 1, 2018 Single-Family Benchmark Price Surpasses $500,000 in May NANAIMO, BC The benchmark price of a single-family home in the VIREB area broke the
WISCONSIN HOUSING MARKETPLACE
 WISCONSIN REALTORS ASSOCIATION WISCONSIN HOUSING MARKETPLACE Date: 2/16/06 For Release: Immediately For More Information Contact: David E. Clark, Economist C3 Statistical Solutions Inc. Office phone: 414-803-6537
Monthly Indicators % % - 9.2%
 Monthly Indicators 2016 New Listings were down 1.4 percent for single family/duplex homes and 25.0 percent for townhouse-condo properties. Pending Sales increased 58.3 percent for single family/duplex
MARKET AREA UPDATE Report as of: 1Q 2Q 3Q 4Q
 MARKET AREA UPDATE Report as of: 1Q 2Q 3Q 4Q Year: 2013 Market Area (City, State): Arlington, Virginia Provided by (Company / Companies): McEnearney Associates, Inc. Realtors What are the most significant
STATPAK MARKET IN A MINUTE A SUMMARY OF MARKET CONDITIONS FOR JANUARY McEnearney.com CONTRACTS URGENCY INDEX INVENTORY INTEREST RATES
 STATPAK LOUDOUN COUNTY FEBRUARY 2018 McEnearney.com MARKET IN A MINUTE A SUMMARY OF MARKET CONDITIONS FOR JANUARY 2018 Contract activity in January 2018 was down just 2.0% from January 2017, but that is
Q New York City. Market Update. Web:
 Q3 2017 New York City Market Update Web: 00111270 All New York City Luxury Market 04 Market Overview 09 Luxury Market 05 Market Snapshot All Areas 06 Inventory Absorption Rate 07 Days on Market Listing
INLAND EMPIRE REGIONAL INTELLIGENCE REPORT. School of Business. April 2018
 INLAND EMPIRE REGIONAL INTELLIGENCE REPORT April 2018 Key economic indicators suggest that the Inland Empire s economy will continue to expand throughout the rest of 2018, building upon its recent growth.
Monthly Indicators % - 1.7% %
 ly Indicators A RESEARCH TOOL PROVIDED BY THE HILTON HEAD AREA ASSOCIATION OF REALTORS 2012 Quick Facts It's been a giant year for the housing market and for sports teams named Giants. As we round out
Quick Facts. For Week Ending December 15, 2018 Publish Date: December 24, 2018 All comparisons are to % - 6.7% + 1.
 Weekly Market Report A RESEARCH TOOL FROM THE SAINT PAUL AREA ASSOCIATION OF REALTORS. BROUGHT TO YOU BY THE UNIQUE DATA-SHARING TRADITIONS OF THE REALTOR COMMUNITY For Week Ending December 15, 2018 Publish
September 2017 Montgomery County Market Trends Report Median sales price highest since September 2007
 FOR IMMEDIATE RELEASE Contact: Bobette Banks 301-590-8764 Director of Communications Greater Capital Area Association of REALTORS bbanks@gcaar.com September 2017 Montgomery County Market Trends Report
November 2017 Montgomery County Market Trends Report Median sales price up slightly as median days on market quickens
 FOR IMMEDIATE RELEASE Contact: Bobette Banks 301-590-8764 Director of Communications Greater Capital Area Association of REALTORS bbanks@gcaar.com November 2017 Montgomery County Market Trends Report Median
Advertising Rates Effective January 1, Real Estate
 2018 Advertising Rates Effective January 1, 2018 Real Estate Agate (800) 458-5522 1 Display and Display on classifieds inside NY area (212) 556-1581 / outside NY area (800) 843-3113 The New York Times
The Corcoran Report 4Q16 MANHATTAN
 The Corcoran Report 4Q16 MANHATTAN Contents Fourth Quarter 2016 4/7 12/23 3 Overview 8 9 10 Market Wide 11 Luxury 24 2 Sales / Days on Market 3 Inventory / Months of Supply 4 5 Market Share Resale Co-ops