April 11, FIRST QUARTER REAL ESTATE SALES REPORT Westchester, Putnam, Rockland and Orange Counties, New York
|
|
|
- Kathlyn Lambert
- 5 years ago
- Views:
Transcription

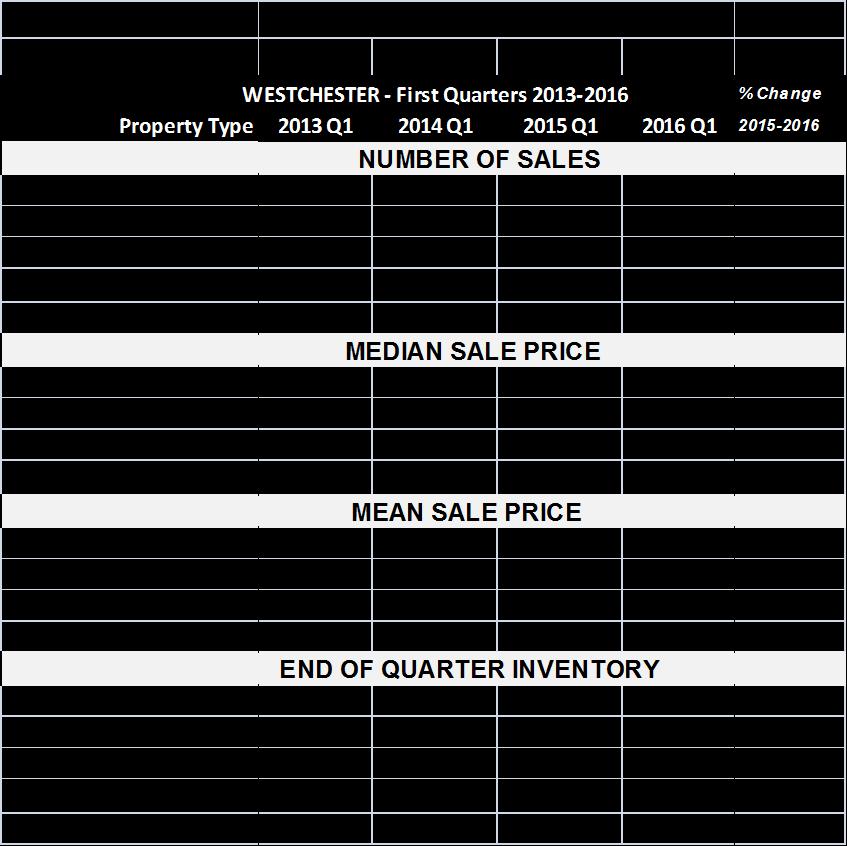
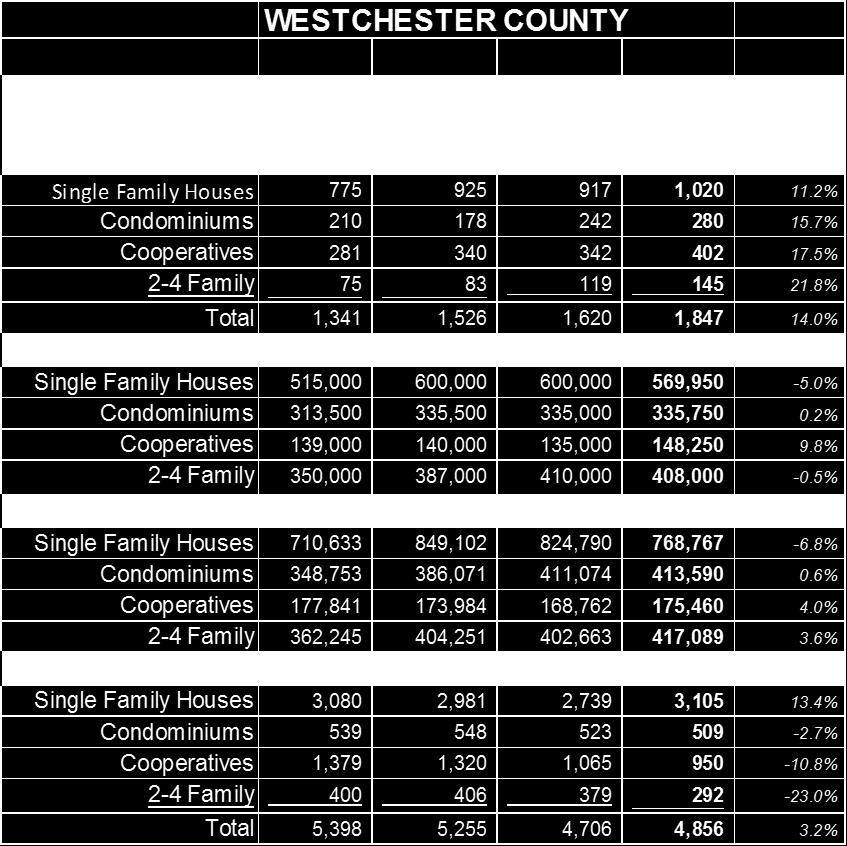
1 April 11, FIRST QUARTER REAL ESTATE SALES REPORT Westchester, Putnam, Rockland and Orange Counties, New York Realtors operating in the four-county lower Hudson region served by the Hudson Gateway Association of Realtors reported 3,391 closed residential transactions during the first three months of 2016, an increase of 530 sales or 18.5% from the same period in The burst of closings largely resulted from market activity that took place during the winter months of 2015 and the first few weeks of The chart below shows that first quarter closings are not only increasing but are accelerating with yearto-year increases of 10.8% from 2013 to 2014, and 12.1% from 2014 to The sales activity in 2016 was accompanied by relatively flat average prices. Westchester County, typically accounting for 50-60% of the region s real estate sales, posted a 14.0% first quarter gain over Setting aside its relatively small multi-family sector, cooperatives were the best performing sector with a 17.5% increase over last year. Condominiums followed at 15.7% and single family houses at 11.2%. Altogether there were 1,847 sales, an increase of 227 units over last year s first quarter total. Orange County continued its high volume sales activity of the past several years with a remarkable 33.0% increase this past quarter: 822 units in 2016 versus 618 in The backbone of the Orange County market is its concentration of single family houses in the range of $200,000 to $230,000, a pricing level that is the most affordable in the region. Hudson Gateway Association of REALTORS One Maple Avenue 9 Coates Drive, Suite 1 2 Medical Park Drive, Suite 17A Hudson Gateway Multiple Listing Service, Inc. White Plains, NY Goshen, NY West Nyack, NY HGAR.com Telephone Telephone Telephone Fax
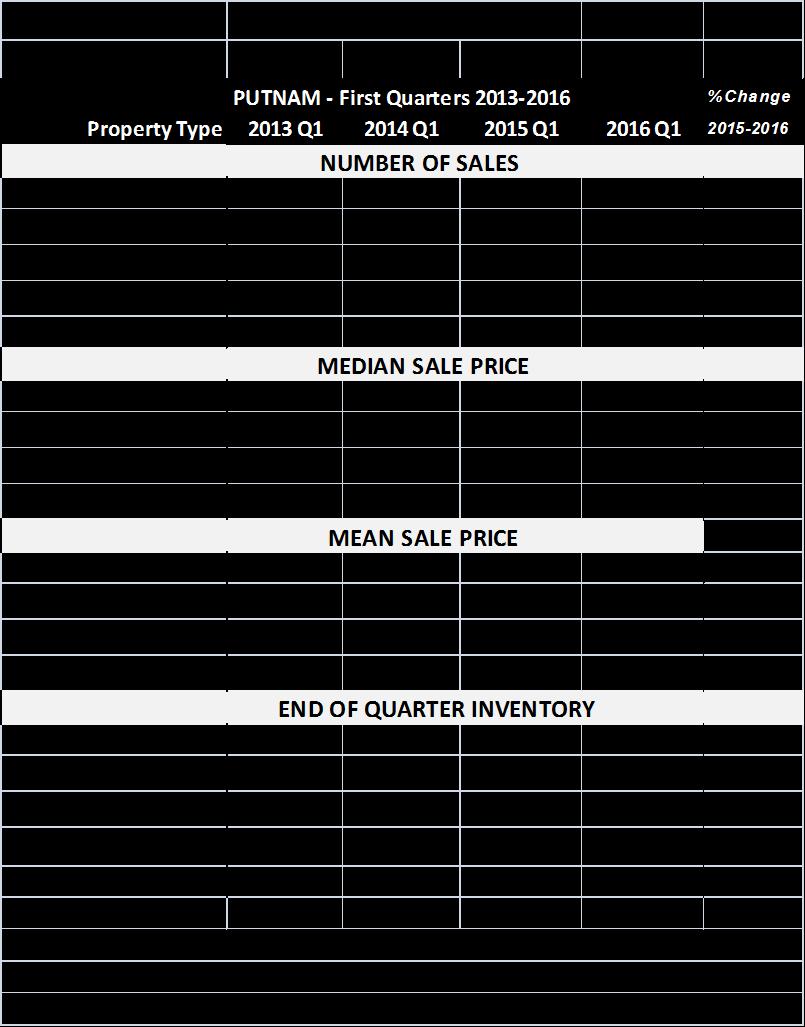
2 Lightly populated Putnam County posted 255 sales, a 30.1% gain over last year. Rockland posted the lowest overall increase among the four counties, 9.4%, although its single family house sector stood out with a respectable 16.6% increase over last year. The overall end-of-quarter supply of properties for sale in the region hardly budged from 9,662 units in 2005 to 9,703 units in 2016 although there were differences among the counties. Westchester, having the most housing stock, also posted the highest percentage of increase, 3.2%, among the counties. Rockland s inventory also increased, by 1.5%. Putnam and Orange Counties, on the other hand, experienced decreases of 6.6% and 2.8% respectively. As observed in prior reports, the region s supply of for-sale housing seems sufficient to support increasingly high volumes of sales without undue upward pressure on prices. In fact, median* and mean* sale prices actually decreased year to year in most cases. Westchester was one of those with a decrease. The median sale price of a single family house was $569,950 down 5.0% from last year s $600,000 (and 2014 as well). Rockland experienced a slight decrease, less than a percentage point, to $399,000 from $400,000 in 2015 for a single family house. Orange County, whose median sale price has bumped along a $210, ,000 track for the past several years, saw an increase this quarter of 2.1%, from $210,500 to $215,000. Putnam County posted a very high increase 10.5% to $300,000 but this was against a small base of sales where a dozen or so sales can yield large percentage changes. The lower Hudson Valley real estate market is running smoothly and at high speed. The supply of housing seems adequate to support the high volume of sales. Price increases are not outpacing inflation and are falling back a little in some areas and among some property types. That easing of prices probably is one of the major factors driving prospective purchasers to enter a local real estate market where buyers and sellers expectations are in accord. The environment that has enabled this performance has been relatively stable for the past several years. High unemployment, which makes consumers fearful for their own jobs and thus dampens
3 their enthusiasm for acting on their own real estate needs, has steadily dropped to 4.5% or lower in all four HGAR counties. Mortgage interest rates remain at historic lows. The recent action of the Federal Reserve to raise its base rate to 25 basis points is not perceived to have any meaningful impact on the real estate market. Volatility in the equity markets could put a damper on enthusiasm for real estate in the short term. So could chaotic post-election government in Washington. But for the time being there is every reason to expect that our local real estate market will do well for at least the next two quarters of # # # The Hudson Gateway Multiple Listing Service, Inc. (HGMLS) is a subsidiary of the Hudson Gateway Association of Realtors, Inc. (HGAR). The MLS s principal service territory consists of Westchester, Putnam, Rockland and Orange Counties. It also provides services to Realtors operating in Bronx, Dutchess, Sullivan and Ulster Counties. The reported transactions do not include all real estate sales in the area or all sales assisted by the participating offices but they are fairly reflective of general market conditions. HGMLS does not provide data on sub-county geographic areas. Persons desiring sub-county data are invited to contact participating real estate offices in the desired areas. Any text or data from this report may be reprinted with attribution to Hudson Gateway Multiple Listing Service, Inc. as the source. Prior reports dating back to 1981 are available on the Realtor Association s website, click on Market Statistics. A membership directory searchable by municipality is also available on that site. * The median sale price is the mid-point of all reported sales, i.e., half of the properties sold for more than the median price and half for less. The median is relatively unaffected by unusually low or high sale prices. The mean sale price is the arithmetic average, i.e., the sum of all sales prices divided by the number of sales. The mean does reflect the influence of sales at unusually low or high prices. Four tables follow, one each with detailed market data for Westchester, Putnam, Rockland and Orange counties.
4
5
6 ROCKLAND COUNTY ROCKLAND - First Quarters % Cha nge Property Type 2013 Q Q Q Q NUMBER OF SALES Single Family Houses % Condominiums % Cooperatives 1 na % 2-4 Family % Total % MEDIAN SALE PRICE Single Family Houses 358, , , , % Condominiums 1 190, , , , % Cooperatives 1 na 68,000 50,750 56, % 2-4 Family 251, , , , % MEAN SALE PRICE Single Family Houses 405, , , , % Condominiums 1 212, , , , % Cooperatives 1 na 99,810 60,393 71, % 2-4 Family 279, , , , % END OF QUARTER INVENTORY Single Family Houses 1,034 1,027 1,036 1, % Condominiums % Cooperatives 1 na % 2-4 Family 2 na % Total 1,382 1,434 1,423 1, % 1 Condominiums & Cooperatives were counted together prior to The number of co-op sales was and is very slight and does not significantly affect totals or percentages Family House end of quarter inventory in Rockland was not compiled prior to 2014.
7 ORANGE COUNTY ORANGE - First Quarters % Cha nge Property Type 2013 Q Q Q Q NUMBER OF SALES Single Family Houses % Condominiums % Cooperatives 1 na na 2-4 Family % Total % MEDIAN SALE PRICE Single Family Houses 226, , , , % Condominiums 1 153, , , , % Cooperatives 1 na 35,000 57,000 65, % 2-4 Family 103, ,000 70,000 67, % MEAN SALE PRICE Single Family Houses 238, , , , % Condominiums 1 186, , , , % Cooperatives 1 na 37,500 57,633 69, % 2-4 Family 119, ,210 92, , % END OF QUARTER INVENTORY Single Family Houses 2,522 2,362 2,338 2, % Condominiums % Cooperatives 1 na % 2-4 Family 2 na % Total 2,822 2,819 2,747 2, % 1 Condominiums & Cooperatives were counted together prior to The number of co-op sales was and is very slight and does not significantly affect totals or percentages Family House end of quarter inventory in Orange was not compiled prior to 2014.
Hudson Valley Home Sales Continue to Increase, But at Lower Rate
 January 11, 2018 Hudson Valley Home Sales Continue to Increase, But at Lower Rate 2017 ANNUAL AND FOURTH QUARTER REAL ESTATE SALES REPORT Westchester, Putnam, Rockland and Orange Counties, New York WHITE
2018 ANNUAL AND 4TH QUARTER RESIDENTIAL REAL ESTATE SALES REPORT Westchester, Putnam, Rockland, Orange and Sullivan Counties, New York
 January 8, 2019 2018 ANNUAL AND 4TH QUARTER RESIDENTIAL REAL ESTATE SALES REPORT Westchester, Putnam, Rockland, Orange and Sullivan Counties, New York While remaining robust, residential sales in some
October 10, THIRD QUARTER RESIDENTIAL REAL ESTATE SALES REPORT Westchester, Putnam, Rockland and Orange Counties, New York
 October 10, 2018 2018 THIRD QUARTER RESIDENTIAL REAL ESTATE SALES REPORT Westchester, Putnam, Rockland and Orange Counties, New York Third quarter real estate sales in the lower Hudson Valley remained
2016 ANNUAL AND FOURTH QUARTER REAL ESTATE SALES REPORT Westchester, Putnam, Rockland and Orange Counties, New York
 January 16, 2017 Hudson Valley Posts Strongest Home Sales Since Recession 2016 ANNUAL AND FOURTH QUARTER REAL ESTATE SALES REPORT Westchester, Putnam, Rockland and Orange Counties, New York WHITE PLAINS
2018 SECOND QUARTER RESIDENTIAL REAL ESTATE SALES REPORT Westchester, Putnam, Rockland and Orange Counties, New York
 July 5, 2018 2018 SECOND QUARTER RESIDENTIAL REAL ESTATE SALES REPORT Westchester, Putnam, Rockland and Orange Counties, New York Second quarter sales figures in the lower Hudson region served by the Hudson
HGAR HUDSON GATEWAY ASSOCIATION OF REALTORS, INC.
 HGAR HUDSON GATEWAY ASSOCIATION OF REALTORS, INC. HUDSON GATEWAY ASSOCIATION OF REALTORS, INC. 60 South Broadway, White Plains, New York 10601 914.681.0833 Fax 914.681.6044 www.hgar.com 9 Coates Drive,
HGAR HUDSON GATEWAY ASSOCIATION OF REALTORS, INC.
 09-2 09-3 09-4 10-1 10-2 10-3 10-4 11-1 11-2 11-3 11-4 12-1 12-2 12-3 12-4 13-1 13-2 13-3 13-4 14-1 14-2 Number of Sales HGAR HUDSON GATEWAY ASSOCIATION OF REALTORS, INC. HUDSON GATEWAY ASSOCIATION OF
October 11, THIRD QUARTER RESIDENTIAL REAL ESTATE SALES REPORT Westchester, Putnam, Rockland and Orange Counties, New York
 October 11, 2017 2017 THIRD QUARTER RESIDENTIAL REAL ESTATE SALES REPORT Westchester, Putnam, Rockland and Orange Counties, New York Real estate sales continued at a brisk pace in the lower Hudson region,
HGAR HUDSON GATEWAY ASSOCIATION OF REALTORS, INC.
 HGAR HUDSON GATEWAY ASSOCIATION OF REALTORS, INC. HUDSON GATEWAY ASSOCIATION OF REALTORS, INC. 60 South Broadway, White Plains, New York 10601 914.681.0833 Fax 914.681.6044 www.hgar.com 9 Coates Drive,
2011 SECOND QUARTER RESIDENTIAL REAL ESTATE SALES REPORT Westchester and Putnam Counties, New York
 Westchester Putnam Association of REALTORS, Inc. Empire Access Multiple Listing Service, Inc. 60 South Broadway, White Plains, NY 10601 914.681.0833 Fax: 914.681.6044 www.wpar.com Putnam Office: 155 Main
Annual Report on the New York State Market FOR RESIDENTIAL REAL ESTATE ACTIVITY IN THE STATE OF NEW YORK
 Annual Report on the New York State Market FOR RESIDENTIAL REAL ESTATE ACTIVITY IN THE STATE OF NEW YORK FOR RESIDENTIAL REAL ESTATE ACTIVITY IN THE STATE OF NEW YORK While the 2017 housing market was
MARKET AREA UPDATE Report as of: 1Q 2Q 3Q 4Q
 MARKET AREA UPDATE Report as of: 1Q 2Q 3Q 4Q Year: 2013 Market Area (City, State): Arlington, Virginia Provided by (Company / Companies): McEnearney Associates, Inc. Realtors What are the most significant
Quarterly Indicators. Q Activity Snapshot + 3.5% + 3.1% % Activity Overview New Listings Pending Sales. Closed Sales.
 Quarterly Indicators Q4-2016 Activity Snapshot Most of 2016 offered the same monthly housing market highlights. The number of homes for sale was drastically down in year-over-year comparisons, along with
1 st Quarter 2015 Asheville and Buncombe County Real Estate Market Analysis
 1 st Quarter 2015 Asheville and Buncombe County Real Estate Market Analysis This report examines the Asheville and Buncombe County residential real estate market through the end of the 1 st quarter of
REAL ESTATE MARKET OVERVIEW 1 st Half of 2015
 REAL ESTATE MARKET OVERVIEW 1 st Half of 2015 With Comparisons to the 2 nd Half of 2014 September 4, 2015 Prepared for: First Bank of Wyoming Prepared by: Ken Markert, AICP MMI Planning 2319 Davidson Ave.
Monthly Indicators % % % Activity Overview New Listings Pending Sales. Closed Sales. Days on Market Until Sale. Median Sales Price
 Monthly Indicators 2018 Residential real estate activity has been relatively slow in the first quarter of 2018, yet housing is proving its resiliency in a consistently improving economy. Some markets have
Annual Report on the New York State Market FOR RESIDENTIAL REAL ESTATE ACTIVITY IN THE STATE OF NEW YORK
 Annual Report on the New York State Market FOR RESIDENTIAL REAL ESTATE ACTIVITY IN THE STATE OF NEW YORK Annual Report on the New York State Market FOR RESIDENTIAL REAL ESTATE ACTIVITY IN THE STATE OF
CREATING CONNECTIONS TO HELP YOUR BUSINESS THRIVE
 THE HUDSON GATEWAY ASSOCIATION OF REALTORS CREATING CONNECTIONS TO HELP YOUR BUSINESS THRIVE AFFILIATE MEMBERSHIPS MARKETING EVENT SPONSORSHIPS 2019 REAL ESTATE IN-DEPTH ADVERTISING The Hudson Gateway
Local Board/Association Presidents, Executive Officers, and NYSAR Regional Vice Presidents
 Memo To: Local Board/Association Presidents, Executive Officers, and NYSAR Regional Vice Presidents From: NYSAR President Christine CJ DelVecchio Date: 5/23/18 Re: April 2018 Housing Market Reports The
Monthly Indicators. Monthly Snapshot. March % % 0.0%
 Monthly Indicators 2017 We can comfortably consider the first quarter to have been a good start for residential real estate in 2017. There was certainly plenty to worry over when the year began. Aside
ECONOMIC PERSPECTIVES
 February 4, 2019 ECONOMIC PERSPECTIVES EXISTING HOME SALES IN FHLBNY AREA HELD UP BETTER THAN THE NATION, REGION IN 2018 Authored by Brian Jones, FHLBNY Financial Economist HIGHLIGHTS:» Existing home sales
RESIDENTIAL MARKET ANALYSIS
 RESIDENTIAL MARKET ANALYSIS RMLS Student Fellow Master of Real Estate Development Candidate Many of the single family housing trends in the second quarter of 2017 bounced upwards following a continuation
Monthly Indicators - 7.4% + 5.6% % Activity Overview New Listings Pending Sales. Closed Sales. Days on Market Until Sale. Median Sales Price
 Monthly Indicators 218 Rising home prices, higher interest rates and increased building material costs have pressured housing affordability to a ten-year low, according to the National Association of Home
nd Quarter Market Report
 2015 2 nd Quarter Market Report The voice of real estate in Central Virginia CAAR Member Copy Expanded Edition Charlottesville Area 2 nd Quarter 2015 Highlights: Closed sales in the Greater Charlottesville
rd Quarter Market Report
 2012 3 rd Quarter Market Report The voice of real estate in Central Virginia CAAR Member Copy Expanded Edition Charlottesville Area 3 rd Quarter 2012 Highlights: Overall sales in Greater Charlottesville
Characteristics of Recent Home Buyers
 Characteristics of Recent Home Buyers Special Studies, February 1, 2019 By Carmel Ford Economics and Housing Policy National Association of Home Builders Introduction To analyze home buyers NAHB uses the
Housing Supply Overview
 Housing Supply Overview A RESEARCH TOOL PROVIDED BY SOUTH CAROLINA REALTORS March 2017 Low supply and steadily rising rates and prices have been the story so far after the first quarter of the year zipped
Monthly Indicators + 5.8% 0.0% % 2 New Listings. 3 Pending Sales. 4 5 Days on Market Until Sale. 6 7 Average Sales Price
 Monthly Indicators 2013 As potentially the brightest sun in the current economic recovery, housing activity has followed the mercury higher this summer. Interest rates and new construction activity have
The Canadian Real Estate Association News Release
 The Canadian Real Estate Association News Release Canadian home sales rebound in January Ottawa, ON, February 16, 2016 According to statistics 1 released today by The Canadian Real Estate Association (CREA),
2008 Mid-Year CAAR Market Report Real Estate Market is as Hot as ANWR
 2008 Mid-Year CAAR Market Report Real Estate Market is as Hot as ANWR By Dave Phillips, CEO Charlottesville Area Association of REALTORS Just about everything in life is relative to your perspective. Based
Monthly Indicators - 3.0% 0.0% % Activity Overview New Listings Pending Sales. Closed Sales. Days on Market Until Sale. Median Sales Price
 Monthly Indicators 2017 We can comfortably consider the first quarter to have been a good start for residential real estate in 2017. There was certainly plenty to worry over when the year began. Aside
STATPAK MARKET IN A MINUTE A SUMMARY OF MARKET CONDITIONS FOR AUGUST McEnearney.com CONTRACTS URGENCY INDEX INVENTORY INTEREST RATES
 STATPAK WASHINGTON, DC SEPTEMBER 2017 McEnearney.com MARKET IN A MINUTE A SUMMARY OF MARKET CONDITIONS FOR AUGUST 2017 Contract activity in August 2017 was up 4.9% from August 2016, and there were increases
The Corcoran Report 4Q16 MANHATTAN
 The Corcoran Report 4Q16 MANHATTAN Contents Fourth Quarter 2016 4/7 12/23 3 Overview 8 9 10 Market Wide 11 Luxury 24 2 Sales / Days on Market 3 Inventory / Months of Supply 4 5 Market Share Resale Co-ops
Monthly Indicators + 8.7% - 1.6% % Activity Overview New Listings Pending Sales. Closed Sales. Days on Market Until Sale. Median Sales Price
 Monthly Indicators 2018 Residential real estate activity has been relatively slow in the first quarter of 2018, yet housing is proving its resiliency in a consistently improving economy. Some markets have
Coachella Valley Median Detached Home Price Jan Jan 2017
 The Desert Housing Report Median Price $450,000 Coachella Valley Median Detached Home Price Jan 2002 - Jan 2017 $400,000 $350,000 $300,000 $250,000 $335,000 $340,000 $200,000 $150,000 CV Detached Median
Monthly Indicators. December Quick Facts % % Year-Over-Year Change Year-Over-Year Change - 1.3% - 1.4% % + 0.1% - 1.4% + 2.
 Monthly Indicators A RESEARCH TOOL PROVIDED BY THE MASSACHUSETTS ASSOCIATION OF REALTORS 2018 Home prices were consistently up again in most markets in 2018 but at reduced levels compared to recent years.
Q SOUTHWEST REGION
 Quarterly Indicators SOUTHWEST REGION Monthly Snapshot Includes the Durango Area Association of REALTORS, Four Corners Board of REALTORS, Pagosa Springs Area Association of REALTORS and the San Luis Valley
CITI HABITATS. Manhattan Residential Sales Market Report
 Manhattan Residential Sales Market Report Contents 4/7 12/17 3 8 9 10 Market Wide 4 Sales / Days on Market 5 / Months of Supply 6 7 Market Share Resale Co-ops Resale Condos New Developments 11 Luxury Neighborhoods
News Release. Canadian home sales ease back in September Ottawa, ON, October 15, The Canadian Real Estate Association
 The Canadian Real Estate Association News Release Canadian home sales ease back in September Ottawa, ON, October 15, 2014 According to statistics 1 released today by The Canadian Real Estate Association
September 2016 RESIDENTIAL MARKET REPORT
 September 2016 RESIDENTIAL MARKET REPORT The real estate investment market in Japan has had an abundance of capital (both domestic & foreign) over the past couple of years. This, along with the low (now
Monthly Indicators - 8.1% + 3.6% - 0.6% Activity Overview New Listings Pending Sales. Closed Sales. Days on Market Until Sale. Median Sales Price
 Monthly Indicators 2019 In addition to ongoing housing price increases and affordability concerns in the state of New York, the first quarter of 2019 saw a fair share of adverse weather as well. Sales
Annual Market Report for 2010 for Naples, Bonita, Estero market area
 Annual Market Review Closed Sales The number of closed sales in once again increased over prior year, making it the third consecutive year to show an increase. Properties priced under $25, continued to
The Canadian Real Estate Association News Release
 According to statistics 1 released today by The Canadian Real Estate Association (CREA), national home sales posted their third monthly increase and broke all previous monthly records. Highlights: The
Q Quick Facts - 3.2% 0.0% %
 CAAR Market Report Includes the city of Charlottesville and the counties of Albemarle, Fluvanna, Greene, Louisa and Nelson. Home prices were consistently up again in most markets in 2018 but at reduced
Monthly Indicators + 1.2% - 2.1% % Activity Overview New Listings Pending Sales. Closed Sales. Days on Market Until Sale. Median Sales Price
 Monthly Indicators 2017 We can comfortably consider the first quarter to have been a good start for residential real estate in 2017. There was certainly plenty to worry over when the year began. Aside
October 1, Victoria Real Estate Market Continues to Stabilize
 PRESIDENT Kyle Kerr PRESIDENT ELECT Cheryl Woolley SECRETARY TREASURER David Langlois PAST PRESIDENT Ara Balabanian DIRECTORS Jackie Adkins Sandi-Jo Ayers Bill Ethier Karen Dinnie-Smyth Andrew Plank EXECUTIVE
CAAR Market Report 2010 Mid-Year Published by the Charlottesville Area Association of REALTORS
 CAAR Market Report 2010 Mid-Year Published by the Charlottesville Area Association of REALTORS Where Are We Now? The pace of home purchases in the Charlottesville market area showed a significant increase
Monthly Indicators - 8.0% + 4.2% - 3.4% Activity Overview New Listings Pending Sales. Closed Sales. Days on Market Until Sale. Median Sales Price
 Monthly Indicators 2018 If the last few months are an indication of the temperature of housing markets across the country, a period of relative calm can be expected during the last three months of the
The Canadian Real Estate Association News Release
 The Canadian Real Estate Association News Release Canadian home sales push higher in February Ottawa, ON, March 15, 2016 According to statistics 1 released today by The Canadian Real Estate Association
Housing Supply Overview
 Housing Supply Overview A RESEARCH TOOL PROVIDED BY SOUTH CAROLINA REALTORS June 2018 We are firmly within summer during an economically strong year in the U.S., thus real estate activity is busy. There
Single-Family Home Resales. Condominium Resales
 FOR IMMEDIATE RELEASE November 7, 2013 MEDIA CONTACT: Caroline Witherspoon Becker Communications, Inc. (808) 533-4165 HONOLULU HOME AND CONDOMINIUM SALES REMAIN STABLE, ACCORDING TO THE HONOLULU BOARD
Monthly Indicators + 3.5% + 3.0% % Activity Overview New Listings Pending Sales. Closed Sales. Days on Market Until Sale. Median Sales Price
 Monthly Indicators 218 Housing price bubble chatter has increased this summer, as market observers attempt to predict the next residential real estate shift. It is too early to predict a change from higher
Hamilton Heights Manhattan. Morningside Heights Harlem
 Sutton Area TriBeCa Upper East Side Upper West Side Washington Heights West Village The Corcoran Report Battery Park City Beekman Carnegie Hill Central Park South Chelsea Flatiron Clinton East Harlem East
THE HONOLULU BOARD OF REALTORS Volume 19, Number 2
 THE HONOLULU BOARD OF REALTORS Volume 19, Number 2 Second Quarter 2009 OVERALL MARKET CONDITIONS The residential housing market on O`ahu bounced back, somewhat, in the second quarter. There were sales
Pikes Peak area housing Market Statistics (As of: 9/30/2018)
") $156,25 $184, $174,697 $177,2 $21,53 $185,83 $173, $178,29 $172,25 $212,75 $21,95 $226,692 $197,5 $199, $196, $28, $25, $223,95 $216,75 $29,527 $234,9 $218,82 $229,74 $235,518 $231,457 $255, $259,11 $269,98
$156,25 $184, $174,697 $177,2 $21,53 $185,83 $173, $178,29 $172,25 $212,75 $21,95 $226,692 $197,5 $199, $196, $28, $25, $223,95 $216,75 $29,527 $234,9 $218,82 $229,74 $235,518 $231,457 $255, $259,11 $269,98
Monthly Indicators % - 1.7% %
 ly Indicators A RESEARCH TOOL PROVIDED BY THE HILTON HEAD AREA ASSOCIATION OF REALTORS 2012 Quick Facts It's been a giant year for the housing market and for sports teams named Giants. As we round out
Ridgefield. Interpreting the Market. Real Estate Report 2016 Mid Year Review. karlamurtaugh.com
 Ridgefield Real Estate Report 2016 Mid Year Review Interpreting the Market karlamurtaugh.com 203.856.5534 REAL ESTATE REPORT 2016 MID YEAR REVIEW Ridgefield Real Estate 2016 Mid Year Review Sales During
MARKET AREA UPDATE Year: 2017 Report as of: 1Q 2Q 3Q 4Q
 MARKET AREA UPDATE Year: 2 Report as of: 1Q 2Q 3Q 4Q Market Area (City, State): Fort Myers/Cape Coral, Florida Provided by (Company / Companies): Real Estate Provided by RDC Member(s): What are the most
The Coldwell Banker Carlson Real Estate Market Report
 The Coldwell Banker Carlson Real Estate Market Report 2017 Year-End Stowe Area Report Our 2017 Year-End Market Report uses market-wide data, based on transactions that closed in 2017 in the Multiple Listing
Monthly Indicators. Activity Snapshot % + 8.0% % Activity Overview New Listings Pending Sales. Closed Sales. Days on Market Until Sale
 Monthly Indicators 2018 Many sellers and builders are in a good position for financial gains, as the economy continues to favor putting existing homes on the market and building new homes for sale. While
RESEARCH & FORECAST REPORT
 Q2 2012 OFFICE LAS VEGAS NEVADA RESEARCH & FORECAST REPORT Recovery Without Job Growth? Despite office employment still trending downwards, Southern Nevada s office market posted positive net absorption
Monthly Indicators + 5.7% % % Market Overview New Listings Pending Sales. Closed Sales. Days on Market Until Sale. Median Sales Price
 Monthly Indicators 2018 The three most prominent national market trends for residential real estate are the ongoing lack of abundant inventory, the steadily upward movement of home prices and year-over-year
Weekly Market Activity Report
 Weekly Market Report A RESEARCH TOOL FROM THE MINNEAPOLIS AREA ASSOCIATION OF REALTORS BROUGHT TO YOU BY THE UNIQUE DATA-SHARING TRADITIONS OF THE REALTOR COMMUNITY For Week Ending June 30, 2018 Publish
MONTGOMERY COUNTY JULY 2018
 STATPAK MONTGOMERY COUNTY JULY 2018 McEnearney.com MARKET IN A MINUTE A SUMMARY OF MARKET CONDITIONS FOR JUNE & FIRST HALF 2018 Contract activity in June 2018 was up 1.2% from June 2017, solely because
Monthly Indicators. December Monthly Snapshot - 0.7% + 7.5% - 5.3%
 Monthly Indicators 2014 Monthly Snapshot + 7.5% - 5.3% - 0.7% It was another recovery year in 2014, although not quite to the level of 2013. With a broad pattern of rising prices and stable to improving
Monthly Indicators % % % Market Overview New Listings Pending Sales. Closed Sales Median Sales Price
 Monthly Indicators 2012 It's been a giant year for the housing market and for sports teams named Giants. As we round out the remaining two months of the year, let's recap. Most markets shed listings, resulting
ANALYSIS OF THE CENTRAL VIRGINIA AREA HOUSING MARKET 1st quarter 2013 By Lisa A. Sturtevant, PhD George Mason University Center for Regional Analysis
 ANALYSIS OF THE CENTRAL VIRGINIA AREA HOUSING MARKET 1st quarter By Lisa A. Sturtevant, PhD George Mason University Center for Regional Analysis Economic Overview Key economic factors in the first quarter
News Release. Canadian home sales slip further in January Ottawa, ON, February 17, The Canadian Real Estate Association
 Canadian home sales slip further in January Ottawa, ON, February 17, 2015 According to statistics 1 released today by The Canadian Real Estate Association (CREA), national home sales activity was down
Year to Date (thru June)
") CAAR Market Report 2009 Mid-Year Published by the Charlottesville Area Association of REALTORS Where Are We Now? The pace of home purchases in the Charlottesville area continues to improve from the dismal
CAAR Market Report 2009 Mid-Year Published by the Charlottesville Area Association of REALTORS Where Are We Now? The pace of home purchases in the Charlottesville area continues to improve from the dismal
Appendix D HOUSING WORK GROUP REPORT JULY 10, 2002
 Appendix D HOUSING WORK GROUP REPORT JULY 10, 2002 Work Group Assignment At the 20/20 forum in April 2001, the community expressed a need for housing policies which will protect both the Town s social
Residential Real Estate Market Overview: April 2017 Data
 Residential Real Estate Market Overview: April 2017 Data 2017 Mark A. Melikian Chief Valuation Officer mark.melikian@summitvaluations.com 2800 River Road, Suite 460 The following is a market data summary
Monthly Indicators % + 8.2% % Market Overview New Listings Pending Sales. Closed Sales. Days on Market Until Sale. Median Sales Price
 Monthly Indicators 2017 We can comfortably consider the first quarter to have been a good start for residential real estate in 2017. There was certainly plenty to worry over when the year began. Aside
Monthly Indicators % % % Market Overview New Listings Pending Sales. Closed Sales. Days on Market Until Sale. Median Sales Price
 Monthly Indicators 2017 We can comfortably consider the first quarter to have been a good start for residential real estate in 2017. There was certainly plenty to worry over when the year began. Aside
Monthly Indicators % + 3.9% % 2 New Listings. 3 Pending Sales. 4 5 Days on Market Until Sale. 6 7 Average Sales Price
 Monthly Indicators 2012 It's been a giant year for the housing market and for sports teams named Giants. As we round out the remaining two months of the year, let's recap. Most markets shed listings, resulting
Housing Supply Overview
 Housing Supply Overview A RESEARCH TOOL PROVIDED BY SOUTH CAROLINA REALTORS May 2015 The last 12 months have seen a lot of buyer activity. Prices are up in most markets and buyers are hungry to purchase,
Housing Price Forecasts. Illinois and Chicago PMSA, March 2016
 Housing Price Forecasts Illinois and Chicago PMSA, March 2016 Presented To Illinois Association of Realtors From R E A L Regional Economics Applications Laboratory, Institute of Government and Public Affairs
HOULIHAN LAWRENCE COMMERCIAL GROUP
 HOULIHAN LAWRENCE COMMERCIAL GROUP TH QUARTER EXECUTIVE SUMMARY FOURTH QUARTER Dear Clients, With behind us and the new year in full swing, we can now reflect, summarize and gain insight from the past
Single Family Sales Maine: Units
 Maine Home Connection 19 Commercial St Portland, Maine 04101 MaineHomeConnection.com Office: (207) 517-3100 Email: Info@MaineHomeConnection.com For the fourth consecutive year, Maine home sales set a new
Housing Supply Overview
 Housing Supply Overview A RESEARCH TOOL PROVIDED BY SOUTH CAROLINA REALTORS April 217 Spring is in the air, and housing activity is heightening. There appear to be more buyers out on the prowl, given the
Monthly Indicators + 1.4% % % Activity Overview New Listings Pending Sales. Closed Sales. Days on Market Until Sale. Median Sales Price
 Monthly Indicators 2018 Rising home prices, higher interest rates and increased building material costs have pressured housing affordability to a ten-year low, according to the National Association of
Monthly Indicators - 6.1% + 8.6% + 1.8% Activity Overview New Listings. Closed Sales Median Sales Price
 Monthly Indicators 2018 Just like last year at this time, prospective home buyers should expect a competitive housing market for the next several months. With payrolls trending upward and unemployment
2017 RESIDENTIAL REAL ESTATE MARKET REPORT
 2017 RESIDENTIAL REAL ESTATE MARKET REPORT Published January 26, 2018 Our market reports have been focused on the effects of low inventory on our housing market and for good reason. December 2017 marked
Our High Property Taxes Do Our Assessors Make up the Rules? Real Estate In-Depth November, 2012 By: Edward I. Sumber, Esq.*
 Our High Property Taxes Do Our Assessors Make up the Rules? Real Estate In-Depth November, 2012 By: Edward I. Sumber, Esq.* Approximately two years ago our lower Hudson Valley market was impacted by negative
Weekly Market Activity Report A RESEARCH TOOL FROM MINNEAPOLIS AREA REALTORS
 Weekly Market Report A RESEARCH TOOL FROM MINNEAPOLIS AREA REALTORS For Week Ending December 1, 2018 Publish Date: December 10, 2018 All comparisons are to 2017 While recent stock market activity has displayed
MARKET AREA UPDATE Year: 2017 Report as of: 1Q 2Q 3Q 4Q
 MARKET AREA UPDATE Year: 2017 Report as of: 1Q 2Q 3Q 4Q Market Area (City, State): Essex, Hunterdon, Middlesex, Morris, Somerset & Union Provided by (Company / Companies): BHHS New Jersey Properties Provided
Monthly Indicators - 6.8% + 5.8% % Activity Overview New Listings Pending Sales. Closed Sales. Days on Market Until Sale. Median Sales Price
 Monthly Indicators 218 Some economy observers are pointing to 218 as the final period in a long string of sentences touting several happy years of buyer demand and sales excitement for the housing industry.
Market Report Summary 2006 Northwest Arkansas. Prepared By Judy Luna. Copyright 2007 Judy Luna
 Market Report Summary 26 Northwest Arkansas Prepared By Judy Luna Copyright 27 Judy Luna Northwest Arkansas Market Area For the purposes of this report, the Northwest Arkansas market area includes Washington
Leasing focused on new construction; renewals up
 MARKETVIEW Midtown Manhattan Office, Q3 216 Leasing focused on new construction; renewals up Leasing Activity 3.96 MSF Net Absorption (.86) MSF Availability Rate 12.1 Vacancy Rate 7.9 Average Asking Rent
Monthly Indicators. October Monthly Snapshot % + 9.0% %
 Monthly Indicators For residential real estate activity by members of the Florida REALTORS 2012 As we round out the remaining two months of the year, let's recap. Most markets shed listings, resulting
BONDREPORT QTR BONDNEWYORK.COM
 BONDREPORT QTR 4 2018 BONDREPORT QTR 4 2018 WELCOME TO THE 23RD EDITION OF THE BOND REPORT Looking back on 2018, the year can perhaps best be described as a consistent movement towards corrections. After
Monthly Indicators + 5.9% % % Activity Overview New Listings Pending Sales. Closed Sales. Days on Market Until Sale. Median Sales Price
 Monthly Indicators 2012 brought tragedy to many East Coast residents. The effects of Sandy compromised basic infrastructure, putting housing activity on hold in the affected areas as recovery took precedence.
RESIDENTIAL MARKET ANALYSIS
 RESIDENTIAL MARKET ANALYSIS CLANCY TERRY RMLS Student Fellow Master of Real Estate Development Candidate Oregon and national housing markets both demonstrated shifting trends in the first quarter of 2015
Monthly Indicators % % - 5.3% Activity Overview New Listings Pending Sales. Closed Sales. Days on Market Until Sale. Median Sales Price
 Monthly Indicators 2018 Housing price bubble chatter has increased this summer, as market observers attempt to predict the next residential real estate shift. It is too early to predict a change from higher
Monthly Indicators % % % Activity Overview New Listings Pending Sales. Closed Sales. Days on Market Until Sale. Median Sales Price
 Monthly Indicators 2018 Last year, U.S. consumers seemed to be operating with a renewed but cautious optimism. The stock market was strong, wages were edging upwards and home buying activity was extremely
STATPAK MARKET IN A MINUTE A SUMMARY OF MARKET CONDITIONS FOR APRIL McEnearney.com CONTRACTS URGENCY INDEX INVENTORY INTEREST RATES
 STATPAK WASHINGTON, DC MAY 2018 McEnearney.com MARKET IN A MINUTE A SUMMARY OF MARKET CONDITIONS FOR APRIL 2018 Contract activity in April 2018 was up 9.4% from April 2017, and four of the six price categories
STATPAK MARKET IN A MINUTE A SUMMARY OF MARKET CONDITIONS FOR JULY McEnearney.com CONTRACTS URGENCY INDEX INVENTORY INTEREST RATES AFFORDABILITY
 STATPAK WASHINGTON, DC AUGUST 2018 McEnearney.com MARKET IN A MINUTE A SUMMARY OF MARKET CONDITIONS FOR JULY 2018 Contract activity in July 2018 was up just 0.5% from July 2017. Through the first seven
Housing Supply Overview
 Housing Supply Overview A Research Tool Provided by the Greater San Diego Association of REALTORS December 2017 Quick Facts + 18.1% + 2.1% - 2.3% Inventory was again a driving metric in residential real
Quarterly Indicators Gallatin County, Montana
 Quarterly Indicators Gallatin County, Montana Quick Facts - 7.7% + 14.5% Home prices were consistently up again in most markets in 2018 but at reduced levels compared to recent years. High demand for few
ARLA Members Survey of the Private Rented Sector
 Prepared for The Association of Residential Letting Agents ARLA Members Survey of the Private Rented Sector Second Quarter 2014 Prepared by: O M Carey Jones 5 Henshaw Lane Yeadon Leeds LS19 7RW June, 2014
Monthly Indicators % % - 6.0% Activity Overview New Listings Pending Sales. Closed Sales. Days on Market Until Sale. Median Sales Price
 Monthly Indicators 2012 It's been a giant year for the housing market and for sports teams named Giants. As we round out the remaining two months of the year, let's recap. Most markets shed listings, resulting