Real Estate Markets 2015 ULI Analysis of City Investment Prospects
|
|
|
- Philippa Simpson
- 5 years ago
- Views:
Transcription

1 Urban Land Institute Chinese Mainland Real Estate Markets 2015 ULI Analysis of City Investment Prospects 城市土地学会 2015 年中国大陆主要城市房地产投资前景分析 Kenneth Rhee Chief Representative, Chinese Mainland, ULI Asia Pacific Anita Kramer ULI Center for Capital Markets and Real Estate ULI Center for Capital Markets and Real Estate
2 About ULI The Urban Land Institute is a 501(c)(3) nonprofit research and education organization supported by its members. Founded in 1936, the Institute now has more than 34,000 members worldwide representing the entire spectrum of land use and real estate development disciplines, working in private enterprise and public service. As the preeminent, multidisciplinary real estate forum, ULI facilitates the open exchange of ideas, information, and experience among local, national, and international industry leaders and policy makers dedicated to creating better places. The mission of the Urban Land Institute is to provide leadership in the responsible use of land and in creating and sustaining thriving communities worldwide. ULI is committed to bringing together leaders from across the fields of real estate and land use policy to exchange best practices and serve community needs by Fostering collaboration within and beyond ULI s membership through mentoring, dialogue, and problem solving; Exploring issues of urbanization, conservation, regen eration, land use, capital formation, and sustainable development; Advancing land use policies and design practices that respect the uniqueness of both built and natural environments; Sharing knowledge through education, applied research, publishing, and electronic media; and Sustaining a diverse global network of local practice and advisory efforts that address current and future challenges. About the ULI Center for Capital Markets and Real Estate The ULI Center for Capital Markets and Real Estate focuses on tracking, analyzing, and exploring real estate investment trends globally. The mission of the Center is to inform, educate, explore issues, create knowledge, and foster communication and networking at the intersection of real estate finance and capital markets and the diverse needs and interests of the ULI membership. The Center also seeks to address members interests in underlying topics such as market forces affecting property sectors and economic trends. About ULI Asia Pacific Across the Asia Pacific region, the Institute has more than 1,800 members, with a particularly strong presence in Japan, Greater China, Singapore, the Philippines, and Australia. The regional headquarters is in Hong Kong, with an office in Tokyo. ULI Asia Pacific brings together industry leaders with a common commitment to improving professional standards, seeking the best use of land, and following excellent practices. By engaging experts from various disciplines, the Institute can arrive at responsible answers to problems that would be difficult to achieve independently. ULI shares its knowledge through various discussion forums, research, publications, and electronic media. ULI s activities in the region are aimed at providing information that is practical, down to earth, and useful so that on-the-ground changes can be made. By building and sustaining a diverse network of local experts in the region, the Institute is able to address the current and future challenges facing Asia s cities. ULI Asia Pacific is the acknowledged authority for policy information and best practices in land use in the Asia Pacific region. Supporting principles: Collaboration with universities, government agencies, and like-minded organizations strengthens and disseminates the Institute s expertise. Priority initiatives effectively address local land use issues. High-quality programs enhance the integrity of the Institute. Substantial interdisciplinary membership is engaged throughout the region by the Urban Land Institute. All rights reserved. No part of this publication may be reproduced in any form or by any means, electronic or mechanical, including photocopying and recording, or by any information storage and retrieval system, without written permission of the publisher. Cover image: Shenzhen Futian central business district. Huitu.


3 Sponsors Dentons is a global law firm driven to provide a competitive edge in an increasingly complex and interconnected marketplace. The partners of Dentons and 大成 have approved a historic combination that will bring together more than 6,500 lawyers and professionals in 120 locations in more than 50 countries. The new firm, which will be the largest in the world, will be the first combination of a Chinese firm and a polycentric global firm. Founded in 2004 with its Greater China headquarters in Shanghai and offices in Beijing and Hong Kong, KaiLong is a leading player in Greater China s vibrant investment and asset management market. KaiLong has raised four RMB funds with a total fund size of about RMB 1.5 billion since KaiLong also closed its maiden USD fund with a total fund size of US$238 million in KaiLong has invested in 24 real estate projects with a total investment of over US$1.2 billion; 12 of these projects were exited and generated very good risk-adjusted returns. PwC Mainland China, Hong Kong, and Macau PricewaterhouseCoopers is the leading professional services organisation in Mainland China ( Hong Kong ( and Macau, with a total staff strength of around 13,700, including 550 partners. Our offices in Mainland China comprise: Beijing, Shenyang, Chongqing, Chengdu, Dalian, Qingdao, Guangzhou, Shanghai, Nanjing, Hangzhou, Wuhan, Xiamen, Ningbo, Shenzhen, Suzhou, Tianjin, and Xi an. Complementing our depth of industry expertise and breadth of skills is our sound knowledge of the local business environment in Mainland China and Hong Kong. PricewaterhouseCoopers is committed to working with our clients to deliver the solutions that help them take on the challenges of the ever-changing business environment. i


4 Sponsors Shine Asset is a leading real estate investment platform and financial service provider in China. Shine Asset specializes in five major real estate areas, including low-carbon building, tourism real estate, commercial property, senior housing, and technology parks, and has created financial service systems in these areas as well as venture capital investment, international real estate, and investment assets. Shine cooperates with leading real estate development enterprises to develop investment and financing services such as structured finance, customized funds, and direct investment funds. As of the end of 2014, Shine Asset had successfully completed 20 investment and financing deals within China, and the value of the assets of the funds managed by Shine Asset exceeded 50 billion CNY. Shine Asset has established strategic partnerships with over 50 influential developers and financial institutions in China and set up 12 industry investment platform companies. Supporting academic organization: Institute of Real Estate Research, Shanghai University of Finance and Economics 上海财经大学不动产研究所学术支持单位 ii
5 Contents Overview 2 Chapter 1: Investment and Development Prospects 6 Top-Ranked Cities: Shanghai (1), Shenzhen (2), Beijing (3), and Guangzhou (4) 7 Nanjing (5) 16 Xiamen (6) 17 Wuhan (7) and Suzhou (8) 18 Zhuhai (9), Hangzhou (10), and Chengdu (11) 19 Fuzhou (12) and Hefei (13) 22 Chongqing (14) 23 Xi an (15) 26 Zhengzhou (16) and Ningbo (17) 26 Kunming (18), Nanning (19), Sanya (20) 29 Qingdao (21), Nanchang (22), and Changsha (23) 29 Tianjin (24) and Dalian (25) 30 Wuxi (26) and Jinan (27) 31 Lanzhou (28) and Haikou (29) 32 Lowest-Ranked Cities (30 to 36) 33 Chapter 2: Trends in Sector Engagement 38 Office 40 Retail 49 Hotel 54 Residential 58 Industrial/Distribution 64 Chapter 3: Issues Affecting Development and Investment 67 Chapter 4: What s New? What s Livable? 77 Appendix A: Recent Regulatory Changes in the Chinese Real Estate Market Appendix B: B2V Reform of the Real Estate and Construction Sectors Is Just around the Corner 96 1
6 Overview Chinese Mainland Real Estate Markets 2015: ULI Analysis of City Investment Prospects the fifth such annual survey conducted by the Urban Land Institute reports on real estate development and investment prospects in 36 of the largest cities in the Chinese mainland, as well as issues affecting those prospects, as evaluated by real estate industry leaders active in the country. The survey consists of a written questionnaire completed by 112 participants, plus about 50 individual interviews and small group discussions held in April and May When this report was written, the Chinese mainland s real estate was beginning to see signs of a slow recovery, with an increase in new home sales and an increase in price in a growing number of cities. The market downturn in 2013 and 2014 was initially induced by home-purchase restrictions on existing homeowners aimed at suppressing speculative home purchases. It was later exacerbated by a slowdown of the economy, with the gross domestic product growing at 7.4 percent in 2014, Zhuhai Dongguan 2
7 the lowest rate since According to government statistics, many cities experienced a decline in home price of 5 to 10 percent, erasing some of the gains made since Residential sales dropped 6 percent year over year from RMB 6.6 trillion to RMB 6.2 trillion for the 12-month period ended April 30, A tough financing environment and the substantial decline in new home sales, as well as local governments unwillingness to cut land prices, led to a drop in land sales by as much as 30 to 50 percent nationwide, starting in the third quarter of However, the wave of loan defaults by developers, feared by some market participants the past year, has not materialized. The current slow recovery of the real estate market is supported by the phaseout of the same home-purchase restrictions in all cities except Tier 1 cities and Sanya and by the current round of credit easing, which has included three interest rate cuts since November In April 2015, of 33 cities in the survey for which information is available, 16 had a price gain month on month, whereas in February 2015, only Shenzhen had a price gain. While the overall market environment remains challenging, survey respondents and interviewees are more optimistic about Tier 1 cities because of strong demand for new homes and strong office demand, especially from high-tech and information technology (IT) companies. Accelerating integration of cities in the Yangtze River Delta and the Pearl River Delta, facilitated by high-speed rail, is making cities in these regions popular with developers and investors. This year, less-recognized Tier 2 or Tier 3 provincial capitals, such as Nanchang, Nanning, and Zhengzhou, saw their rankings Survey Responses by Geographic Scope of Firm 7.1% 4.5% 17.9% 41.1% Chinese mainland firm focused primarily on China Global firm with a Chinese mainland investment strategy Asia Pacific firm focused on the Chinese mainland and other Asian countries/regions Chinese mainland firm focused on the Chinese mainland and other Asian countries/regions Asia Pacific firm focused primarily on the Chinese mainland 29.5% Source: Chinese Mainland Real Estate Markets 2015 survey. 3
8 Survey Responses by Type of Firm 36.6% 32.1% 21.4% 5.5% 2.7% 1.8% Real estate developer Real estate service firm Institutional/equity investor or investment manager Private property investor Bank, lender, or securitized lender Equity REIT or publicly listed property company Source: Chinese Mainland Real Estate Markets 2015 survey. and ratings improve as they benefited from rapid urbanization in their provinces and an improving transportation infrastructure. In comparison, cities still suffering from past overdevelopment, such as Shenyang, Chengdu, Chongqing, and Tianjin, rank relatively low. Going forward, maturation and further expansion of high-speed rail, continued urbanization, initiation of subway lines in a growing number of Tier 2 cities, and robust growth in knowledgebased industries such as IT will sustain the real estate market in general. Cities that have resources in infrastructure and human talent are already outperforming other cities, and this trend is expected to become more pronounced in the coming years. 4
9 Chinese Mainland Cities Survey 2015 ULI ANALYSIS OF CITY INVESTMENT PROSPECTS Population, Millions growth a Change Percentage Shanghai b % Beijing b % Chongqing b % Guangzhou c % Tianjin b % Shenzhen % Wuhan c % Dongguan % Chengdu c % Nanjing c % Shenyang c % Hangzhou c % Xi an c % Harbin c % Suzhou % Qingdao % Dalian % Zhengzhou c % Xiamen % Jinan c % Kunming c % Changsha c % Taiyuan c % Urumqi d % Hefei c % Fuzhou c % Shijiazhuang c % Nanning d % Wenzhou % Ningbo % Wuxi % Lanzhou c % Nanchang c % Haikou c % Zhuhai % Sanya % Source: United Nations, Department of Economic and Social Affairs, Population Division, Population Estimates and Projections Section, World Urbanization Prospects, the 2014 revision. The data are for urban agglomerations, which refer to the de facto population contained within the contours of a contiguous territory inhabited at urban density levels without regard to administrative boundaries. They usually incorporate the population in a city plus that in the suburban areas lying outside but adjacent to the city boundaries. a. Projections. b. Municipality with provincial status. c. Provincial capital. d. Autonomous region capital. 5
10 CHAPTER 1 Investment and Development Prospects In 2015, investment and development ratings for the 36 cities in the Chinese mainland cities survey shifted upward an average of 5.7 percent and 1.0 percent, respectively, thereby indicating a slightly more optimistic outlook overall than the ratings showed in the 2014 survey. Both sets of ratings, however, remain down from their average highs in 2013, with development lagging investment in improvement. Thirty of the 36 cities were rated more positively in investment prospects than in 2014, while only 21 cities experienced an improvement in their development ratings. The same four top-ranked cities Shanghai, Shenzhen, Beijing, and Guangzhou (in descending order) were considered good for investment prospects in 2015, as they were in Twenty-five cities were rated fair and seven cities were rated poor, an improvement from the 11 cities considered poor in For development prospects, five cities were rated good in 2015 Shenzhen, Shanghai, Guangzhou, Beijing, and Nanjing (in descending order) with Beijing back in this top group after being rated fair in Twenty-two cities were considered fair, and nine cities were rated poor, an improvement over the 11 cities ranked poor in In 2013, in contrast, seven cities (the four top-ranked in 2015 plus Suzhou, Wuhan, and Hangzhou) rated good for investment, only six cities rated poor for investment, ten cities rated good (the five top-rated cities in 2015 plus Suzhou, Xi an, Chengdu, Wuhan, Xiamen, and Zhuhai), and just four cities rated poor for development. Given that ratings this year improved from 2014 on average, some cities may have seen their rankings slip if rating increases were relatively small, although some cities have declined both in rank and rating scores. The lower-ranked cities contributed some of the biggest gains in ratings between 2014 and 2015 in investment prospects, while gains in development prospects were more equally distributed. From the interviews conducted, the following trends or characteristics were noted in city preference: Tier 1 cities and leading Tier 2 cities with a strong local economy are favored, while Tier 3 and Tier 4 cities, except in the economically vibrant coastal regions, are generally ranked low. Strong higher-education base and a strong information technology (IT) sector help position certain Tier 2 cities, such as Nanjing, Wuhan, and Xi an, well. Cities such as Tianjin, Shenyang, and Chongqing that oversold land in the past relative to demand are ranked low. High-speed railway connectivity is a key positive trend for Tier 2 and Tier 3 cities, especially those in the Yangtze River Delta or close to that region. Cities with areas designated as free trade zones by the central government have fared well, with the exception of Tianjin. 6
11 Top-Ranked Cities: Shanghai (1), Shenzhen (2), Beijing (3), and Guangzhou (4) For the first time since this survey began in 2011, the four top-ranked cities in investment prospects are identical to those of the previous year s survey. Shanghai and Beijing spent their third year at number one and number three, respectively, while Shenzhen and Guangzhou were on their second year at number two and number four, after breaking into the top four in The top four cities were the only ones of 36 that Exhibit 1-1 City Investment Prospects Shanghai Shenzhen Beijing Guangzhou Nanjing Xiamen Wuhan Suzhou Zhuhai Hangzhou Chengdu Fuzhou Hefei Chongqing Xi an Zhengzhou Ningbo Kunming Nanning Sanya Qingdao Nanchang Changsha Tianjin Dalian Wuxi Jinan Haikou Lanzhou Dongguan Harbin Taiyuan Urumqi Shijiazhuang Wenzhou Shenyang Abysmal Poor Fair Good Excellent Source: Chinese Mainland Real Estate Markets 2015 survey. 7
12 were rated good in investment. Shanghai s numerical rating increased by 5 percent from 2014, while Shenzhen, Beijing, and Guangzhou experienced more robust ratings increases at 9 percent each. Exhibit 1-2 Change in Investment Prospects 2015 average 2014 average Change Change (%) Sanya % Lanzhou % Nanning % Urumqi % Wenzhou % Haikou % Hefei % Nanchang % Fuzhou % Taiyuan % Shenzhen % Beijing % Guangzhou % Xiamen % Chengdu % Ningbo % Zhuhai % Hangzhou % Jinan % Shanghai % Tianjin % Chongqing % Suzhou % Zhengzhou % Wuhan % Kunming % Harbin % Nanjing % Dongguan % Dalian % Qingdao % Xi'an % Changsha % Wuxi % Shijiazhuang % Shenyang % Source: Chinese Mainland Real Estate Markets 2015 survey. 8
13 The top four cities saw some movement in the rankings for development prospects, with Shenzhen overtaking Shanghai for the number-one spot in 2015, ending Shanghai s two-year run, and Beijing overtaking Nanjing for the number-four spot. As with investment prospects, the top four cities for development prospects were also rated good. Three cities saw an increase in their ratings from 2014: Shenzhen s development rating increased by 9.5 percent one of the highest increases among the 36 cities. Guangzhou increased by 3.9 percent and Beijing by 2.8 percent, while Exhibit 1-3 City Development Prospects Shenzhen Shanghai Guangzhou Beijing Nanjing Xiamen Wuhan Suzhou Zhuhai Hangzhou Fuzhou Hefei Chengdu Xi an Chongqing Kunming Zhengzhou Ningbo Qingdao Tianjin Nanning Changsha Dalian Wuxi Sanya Jinan Nanchang Lanzhou Harbin Dongguan Haikou Taiyuan Shijiazhuang Wenzhou Urumqi Shenyang Abysmal Poor Fair Good Excellent Source: Chinese Mainland Real Estate Markets 2015 survey. 9
14 Exhibit 1-4 Change in Development Prospects 2015 average 2014 average Change Change (%) Lanzhou % Sanya % Shenzhen % Hefei % Nanning % Kunming % Haikou % Tianjin % Zhuhai % Urumqi % Xiamen % Guangzhou % Beijing % Fuzhou % Nanchang % Zhengzhou % Chongqing % Chengdu % Hangzhou % Harbin % Suzhou % Shanghai % Dongguan % Nanjing % Wuhan % Dalian % Jinan % Wenzhou % Qingdao % Ningbo % Taiyuan % Shijiazhuang % Xi an % Changsha % Wuxi % Shenyang % Source: Chinese Mainland Real Estate Markets 2015 survey. 10
15 Shanghai s rating slipped, although by just 0.3 percent. Beijing s increase pushed the city out of the fair category from last year and into the good category this year. Interviewees hold a general consensus, including some who have negative views on the market, that there is no bubble or serious oversupply situation in Tier 1 cities. In Tier 1 cities, the available inventory of new homes in months ranges between eight and 13 months, generally considered to be in balance, while the lower-ranked cities of Shenyang and Qingdao have the highest inventory level of 27 and 21 months, respectively. Shanghai. A developer with more than two decades of development experience in the city emphatically expressed the widely shared confidence in Shanghai: If we believe China will eventually become the biggest economy in the world, then Shanghai will be equal to other global cities like London, Paris, New York, and Tokyo. Another investor echoed the sentiment: Shanghai is my favorite. The market has a scale and has more attractions for foreign investors. The same developer also said, Development opportunities in central districts in Shanghai will become scarcer for the next three years. In Shanghai, the growth will be in Pudong; the southern part of Pudong, such as Lingang, Fengxian, and Jinshan; in Anting, China s automobile center, particularly in electric vehicles; and in the Zhangjiang and Caohejing high-tech areas. The North Bund (in Hongkou District) will form a financial loop with Lujiazui. It s easier to cross the river and go north. The area will become an expansion from Lujiazui. Lujiazui Financial Area located along the Huangpu River is nearly fully developed with a limited stock of land that can be developed. The North Bund is connected to Lujiazui with two tunnels and has seen a growing number of office development projects in the past several years. In the 2014 report, we noted the concern expressed by some interviewees that the impact the huge volume of new office-development projects in decentralized locations, such as Hongqiao Transportation Hub, would have on the rent and occupancy rate of the existing buildings in central locations. The rent and occupancy have stayed relatively stable in the past year, with a limited amount of new projects in decentralized locations actually hitting the market. The vast majority of the projects in decentralized locations started construction fewer than two or three years ago and are still under construction. However, the new supply will significantly increase in the coming months and few years. A developer with a substantial portfolio of office properties in downtown and decentralized locations noted, Central locations should be fine. Decentralized areas are facing pressure as most of the new supply are in decentralized areas. While the overall new supply in decentralized locations is quite clear although some delay in completion may occur what is not clear is future demand. How well the office market in decentralized locations will perform will largely depend on how much demand will materialize in the coming years. Positive factors include the recent opening of the first phase of the world s largest convention center with total gross floor area of about 1.47 million square 11
16 meters near the Hongqiao Transportation Hub and the maturation of the high-speed railway station, which, combined with Shanghai Hongqiao International Airport, make the area the most convenient to access the Yangtze River Delta region and the key gateway cities in Northeast Asia. Another developer noted that the Hongqiao Transportation Hub has the potential to become the CBD [central business district] of the Yangtze River Delta region as most cities in the region can be reached in less than two hours by high-speed train. A research analyst notes that despite the large new office supply in decentralized locations, he does not necessarily see an overall drop in rent. The new buildings in decentralized locations generally have high quality standards, he said, and new buildings in good locations such as well-established suburban business parks will seek a higher rent than older buildings in the same or nearby locations. He also sees a healthy demand from companies that currently rent space in central locations moving to suburban office buildings for substantially lower rents. According to this analyst, Shanghai Tower, the 632-meter office tower in Lujiazui scheduled to open in June this year, is seeking RMB 16 per square meter per day, while Grade A office buildings in suburban business parks achieve around RMB 5 per square meter per day. Another recent policy change that could boost the office market is the municipal government s decision to develop Shanghai into a science and innovation center with global influence. Although clearly the most important commercial and financial hub of the Chinese mainland, Shanghai has lagged Beijing and Shenzhen in fostering knowledgebased economy, especially in the IT sector. The ongoing home-purchase restrictions for home owners who already own two or more units and out-of-town buyers continue to have a negative impact on the residential market. Residential sales prices have generally remained flat or even have declined in suburbs, with the city s residential price index declining 3 percent since the end of However, because of the scarcity of new products in central locations, the housing prices in those areas have been holding up much better compared with suburban locations. Overall, the residential market in Shanghai is considered to be generally healthy. As of April 2015, there were 10.1 months of new housing inventory. A number of developers interviewed noted that land price in Shanghai had been increasing in the past year while the land area sold had declined. The generally stable residential price, despite the home purchase restrictions, may be because of a healthy demand from recent migrants who are first-time home buyers. Shanghai has the largest population of net migrant population in the Chinese mainland with more than 9.5 million in 2012, representing around 40 percent of the city s total permanent population. In contrast, the retail sector in Shanghai appears to be facing a challenging environment because of a rapid increase in e-commerce. A lender noted, There are too many retail malls in Shanghai, [although] Shanghai is generally better than other places in China. While the majority of new supply is in the suburbs, some top-end shopping centers in central locations are also seen as not performing well. Few people are actu- 12
17 ally making purchases in retail shops in a particular high-end shopping center downtown, one investor noted, although restaurants are doing well. Shenzhen. The key impetus for Shenzhen s rise in rankings the past year was seen as largely caused by the central government s decision to designate the Qianhai area a special economic zone with significant preferential policies. Shenzhen s office market has experienced a substantial decline in vacancy rate from 7.5 percent in the first quarter of 2014 to 4.6 percent in the first quarter of It was the best performing market among Tier 1 cities. A research analyst noted that in the next several years new office supply would increase by 1 million to 2 million square meters per year, compared with around 500,000 square meters per year in recent years. Much of the new supply will come from Futian District and Houhai and Qianhai areas of Nanshan District. However, he does not expect office rent to drop, given a strong demand. An investor predicted that Shenzhen would soon overtake Guangzhou as the biggest office market in Guangdong province. Shenzhen s residential market has stayed relatively stable with the price index increasing 0.7 percent year on year, the only Tier 1 city to see an uplift. One interviewee noted that the mountainous terrain of the city limited the supply of land that could be developed, unlike the terrain of Beijing or Shanghai. Shenzhen s new home supply in April 2015 declined 11 percent from a year ago, the only Tier 1 city to experience a decline. As a result, the inventory level of new homes was the lowest among the four Tier 1 cities, at 8.2 months, indicating a possible shortage of new homes. A research analyst noted that in the past year the pace of redevelopment of old neighborhoods had slowed, and this pace would affect the future supply of new homes, especially in central locations. Shenzhen s retail and office market benefits from the historically low level of investment. According to the government statistics, Shenzhen only ranks 21st, between Nanjing at 20th and Harbin at 22nd, in investment in office and retail property between 2010 and Another positive factor for Shenzhen, especially for the residential market, is that it has arguably the most dynamic population base among all of the cities in the Chinese mainland. Compared with Beijing, Shanghai, and Guangzhou, Shenzhen has the highest percentage of migrant population. Of the approximately 10.6 million permanent population in 2012, more than 7.7 million or 73 percent were migrants compared with 40 percent in Shanghai, 37 percent in Beijing, and 35 percent in Guangzhou. Unlike the other Tier 1 cities, Shenzhen has a very limited indigenous population as the city was a fishing village with a small local population when the area was declared a special economic zone by the central government in Considered the home of China s private-equity industry and IT giants such as Huawei Technologies Company, the city has a large pool of entrepreneurs and skilled high-tech sector workers who have benefited from the rapid growth of the IT industry. Shenzhen s location next to Hong Kong, where the housing prices are among the highest in the world, and its increasing integration with Hong Kong help the city s residential market. 13
18 According to World Union, the average number of homes per permanent household is only 0.4, much lower than the 1.0 nationwide. Of the 11 million permanents residents in Shenzhen, 70 percent do not own a home in the city. Going forward, the pent-up housing demand is expected to further move up housing prices in the city. A local residential developer noted that while home prices in suburban areas have not held up as well as in central locations ( 关内 ), certain suburban areas such as Longhua and Bao an District have performed well in recent years. Longhua has benefited from the opening of Shenzhen North Railway Station. Once the high-speed railway between downtown Hong Kong and Longhua opens, travel that currently takes two to three hours will take less than 20 minutes. Housing prices in Longhua have more than doubled in the past several years, he noted. Bao an, the western district of the city, has benefited from the development of Qianhai and the improving public transportation infrastructure between the Shenzhen Airport and central locations of the city. Beijing. Beijing elicited strong views from many of the interviewees, especially about its livability and its city planning. One developer noted, Beijing is not livable. Transportation planning is bad. Beijing, unlike Shanghai, does not have things happening in the suburbs. Another developer noted, It s a matter of overcrowding and congestion issues. Beijing s livability rating this year remains near the bottom, at 31st place. Despite the poor living environment, Beijing is still one of the two main go-to markets for institutional investors. A developer based in Beijing explained, Livability s impact on the real estate market is not as strong as people think. The market is still job driven. Beijing s strongest performing real estate sector continues to be office. Average monthly office rent has remained stable since last year and was RMB 382 per square meter in April 2015, which is more than 40 percent higher than in Shanghai. Vacancy remains low at 5.4 percent in April 2015, the lowest of Tier 1 and major Tier 2 cities. The IT sector has been a big source of new demand for office space. One developer with a portfolio of buildings in the city noted that the vast majority of the tenants in her company s recently completed office buildings in the Wangjing Subdistrict are from the IT industry. She added that eight of the top ten IT companies in the Chinese mainland are headquartered in Beijing. The strong office market coupled with a relatively weak retail market has led to a growing number of conversions of retail shopping centers for office use. A research analyst based in Beijing noted, You see retail space converting to office space everywhere in Beijing. Perhaps this trend of converting retail shopping centers to office buildings is most visible in Zhongguancun, the area around Peking University and Tsinghua University considered China s Silicon Valley. A number of former electronics wholesale buildings are now undergoing conversion to office space. Around 2.5 million square meters of Grade A office space in the CBD area are planned for completion in 2017, another analyst noted. However, he does not think that this new supply will have material impact on the market because of the combination of significant 14
19 owner-occupancy, a possible delay in completion, and the strong balance sheets of the developers, including many leading financial institutions. He also noted that the high office rent in the CBD area and Finance Street had led a growing number of tenants to relocate to suburban areas, such as the Fengtai and Lize CBDs. The residential price has declined slightly around 4 percent in the past year affected by the ongoing home-purchase restrictions for owners of multiple homes and out-oftown buyers. The new-home inventory in April of this year grew 16 percent year on year and stood at 13.3 months. An interesting development is a growing number of for-rent apartment buildings near core office areas created by conversions of office buildings. These apartments almost exclusively cater to young white-collar workers in their 20s and early 30s. The growing popularity of so-called youth apartments in Beijing s core office areas is tied to Beijing s notorious traffic and a limited availability of residential properties in central locations. A developer based in Beijing noted that an office building on the fringe of the CBD that was recently converted into youth apartments was for rent but only accepted single professionals. Guangzhou. Among Tier 1 cities, several interviewees mentioned Guangzhou as a class below the other three cities. One investor who has invested in the city noted, I am not too keen on Guangzhou, even though we invested in the city. Guangzhou is in an awkward position geographically. It never received government support, but the situation is changing. Another investor noted that the retail property that they had invested in had not performed well with limited rent growth during the past several years. A more optimistic view was mentioned by another investor who singled out Guangzhou along with Wuhan as having a robust economy and relatively low land price in good locations. Properties there are more attractive. The two cities are more innovative but with high execution risks. Headquarters of IT companies are being set up there. Significant emphasis is being placed on expanding Pazhou s IT sector, located south of Pearl River New Town. Guangzhou s office rent has essentially stayed stable, with the first quarter 2015 average at RMB 163 per square meter, only 42 percent of Beijing s level or 60 percent of Shanghai s level. Office vacancy was 6.7 percent in the first quarter A developer with a project in a nearby city of Guangzhou noted, The city is improving its economic structure and moving out some low-end manufacturing business. He also praised the city s urban planning that includes a good road system. A research analyst based in Guangzhou was optimistic about the office market in the long run. He said the Pearl River New Towns have matured such that many of the buildings are running at near full occupancy. He also noted that the pace of development of the nearby Guangzhou International Finance Town has been slower than previously expected. The retail property market in well-established retail districts is generally seen as stable. However, a research analyst noted that street-level shops that generally sell cheap 15
20 electronic goods and other consumer products have been experiencing a drop in sales because of competition from online retailers. The residential market is considered generally healthy, with the new-home inventory at 11.6 months and the new-home inventory increasing 23 percent year on year as of April Nanjing (5) Nanjing seems to have settled into its number five spot after climbing from the ninth and 11th spots in investment and development, respectively, from An increase of 2.3 percent over last year s ratings allowed Nanjing to hold on to its number-five spot in the rankings for investment prospects, while a slight decrease in development ratings of 1.2 percent moved it in the rankings for that category from number four down to number five. Respondents again rated the city fair in investment but good in development. Nanjing, the capital city of Jiangsu province that is also one of the most affluent provinces in the Chinese mainland, has clearly emerged as one of the four most economically important cities in the Yangtze River Delta, along with Shanghai, Hangzhou, and Suzhou. This year many interviewees expressed generally positive views about Nanjing. A developer familiar with the city said, The number of colleges and students on campus as well as investment in emerging industries are key criteria for city selection. Nanjing, Xi an, Wuhan, and Chengdu are such cities. He also noted that the city was going to start the development of a Lujiazui-type development zone called the Jiangbei New Area during the second half of Another developer noted, Nanjing has a very good fabric to form a promising city. It s the traditional capital of many dynasties in China. It s performing very well and promoting its private sector. The government has taken efforts toward improving the environment. It has the potential to become the fifth Tier 1 city. Nanjing has better urban planning, and the government is more open minded. Many interviewees discussed Nanjing in relation to Suzhou, a nearby rival that is adjacent to Shanghai. Suzhou had a much earlier start in economic development, and Nanjing is still seen as lagging Suzhou in IT and high value-added manufacturing. But Nanjing has a stronger higher-education base, while Suzhou lacks well-regarded universities. Being the capital of Jiangsu province and being more centrally located in that province are considered positive factors for Nanjing s office sector. Corporations with headquarters or regional offices in Shanghai are perceived to be more likely to set up offices in Nanjing rather than in Suzhou. A developer familiar with the city was more cautious about Nanjing s office market. He noted that the office space demand in Nanjing from multinational and domestic companies tended to be substantially smaller than in Shanghai with typical tenants renting between 500 and 1,000 square meters of gross floor area. Nanjing s office sector is more of strata-title sales market, a research analyst noted. 16
21 Nanjing has also benefited from the opening of the high-speed railway linking Shanghai to Beijing. Nanjing s inventory months of new homes are among the lowest, at 8.5 months. Xiamen (6) Xiamen experienced an increase in ratings of 8.3 percent for investment prospects and 3.9 percent for development prospects in 2015, moving it into the sixth spot in the rankings for both categories, from the eighth and ninth spots in Compared with 2013, when respondents ranked Xiamen 13th for investment and tenth for development, this increase indicates an upward momentum for the city year over year. Even so, its rating category remains fair. In 2014 s report, Xiamen was cited to benefit from its high livability and attract a large number of wealthy families from within the province and nearby provinces as well as from Taiwan. Moreover, the city was said to benefit more from the Taiwan Strait than Fuzhou because Xiamen was closer to Taiwan and more Taiwanese enterprises set their footprints in Xiamen. This year, Xiamen elicited positive feedback from a number of interviewees. One interviewee mentioned that the recently established free trade zone in Xiamen should help the local economy. Being closest to Taiwan and having a sizeable number of companies from Taiwan, the city has been the biggest beneficiary of the generally stable strait relations for the past several years. The One Belt One Road policy by the central government is also seen as a positive factor for this port city. Under the One Belt One Road policy, the Chinese mainland will build a Maritime Silk Road linking key port cities in the Chinese mainland to ports in Asia, the Middle East, Africa, and Europe. A residential investor noted, You see sharp growth in price in Xiamen. So, you need to be cautious. Xiamen s residential price index has grown 27 percent since 2010, the highest rate among Tier 1 cities and of all Tier 2 cities. A favorable factor for Xiamen is a big migrant population. Permanent residents without local household registration represent around 48 percent of the total permanent population, the third highest rate among the 36 cities in this survey, behind Shenzhen and Dongguan. The city s livability is another key factor supporting the local residential market. Xiamen is ranked the third most livable among the 36 cities in the survey, behind Hangzhou and Shanghai. Regarding office and retail property sectors, another developer cautioned about a big increase in the new supply of office buildings and retail shopping centers in the next several years. In general, projects in Xiamen Island are considered generally safer because of a limited stock of land that can be developed. 17
22 Wuhan (7) and Suzhou (8) In the seventh and eighth spots, respectively, Wuhan and Suzhou both declined modestly in the rankings this year, mainly because their gains in investment ratings failed to keep up with the pace of the cities at the head of the pack. Wuhan. Wuhan s investment rating grew 3.8 percent in 2015, while its development rating declined 1.5 percent. Wuhan s increase in investment rating was outmatched by a number of cities, including Xiamen, moving Wuhan in the rankings from sixth place in 2014 down to seventh in The decrease in development rating also moved the city from sixth down to seventh place in the rankings for that category as well. Wuhan has experienced an overall decline in investment rankings and largely stable development rankings year over year, after being ranked fourth and eighth for investment and development, respectively, in In 2013, Wuhan s investment and development rating categories were both good, although they are now both fair. The capital city of Hubei province in Central China, Wuhan is clearly the most important economic and transportation hub of Central China. In 2014 s report, Wuhan was cited to benefit from its transportation hub status, growing high-tech industry, and universities. However, the lack of a clear central business district was thought to have a negative impact on the city s economy. This year, Wuhan s generally high ranking and positive prospects seem to stem from the strong IT sector driven economy and the late start of the local real estate market. A developer with a project in the city noted, The IT industry in Wuhan is growing very fast. Wuhan has great potential due to its many universities and well-educated workforces and high-speed rail connections in all directions. It s being upgraded to a knowledge-driven economy. A residential investor with a project in Wuhan noted, The city is merging with the cities around it, and the combined population will reach 30 million people. Optics Valley has good activities and is positive. But further south, there is oversupply. Located in the southeast part of Wuhan, Optics Valley, also known as Donghu New High-Tech Development Zone, is one of the largest IT hubs of the Chinese mainland. A foreign investor cited the generally limited pool of high-quality office assets as a positive for entering the market. In Chengdu, there is a lot of quality supply. This is the problem. In contrast, Wuhan lacks quality supply. So, Wuhan is promising. A local investor noted, Wuhan is a market dominated by a rigid housing demand. According to the investor, as the primary economic center of the province and also the central region of Hubei, Henan, and Hunan, the city holds a strong position in the region. No doubt Wuhan s residential market is also supported by its huge pool of well-educated workers. Wuhan has the second-largest population of college students in the Chinese mainland with 966,000 students in 2013, behind Guangzhou with 983,000 students. 18
23 Wuhan s residential market is deemed balanced with the new-home inventory, at 9.7 months. However, Wuhan experienced a slower start in the office and retail property markets, and now those markets provide more opportunities. In the past, Wuhan s investment in the office and retail markets was relatively limited when compared with similar-sized cities, such as Chengdu and Chongqing. Suzhou. Suzhou experienced an increase of 4.6 percent in investment ratings and a very slight increase of 0.1 percent in development ratings in 2015 but declined in the rankings from seventh to eighth place in both categories this year. For Suzhou, this year marks another in an overall downward trend that began in 2014, when it fell in the rankings to seventh place, from a high of second place in both investment and development in In 2013, its investment and development rating categories were both good"; in 2015, they are both fair. The office sector was seen as the main weak spot for the Suzhou s real estate market. A real estate broker said, The strata title-sales market for office is not doing well. It takes five to six years for an office building of 50 60,000 square meters to sell out. Suzhou is similar to Tianjin the demand for office is not strong. An investor who recently invested in the city shared the generally negative sentiment about the office sector: I am a bit concerned with the office sector in the city. It is softening, and there is a lot of supply. Some of the new office supply is coming from a new office area forming around Suzhou North Railway Station. Located about 15 kilometers north of downtown, the station is the main highspeed railway station in Suzhou along the Beijing-Shanghai line. The same investor, however, was more optimistic about the other property sectors in the city: However, I am not concerned with the retail and the residential sectors. Retail is always about the location. Residential is about the affordability. Suzhou is a very stable and strong market for residential. Zhuhai (9), Hangzhou (10), and Chengdu (11) With respectable increases in investment ratings and largely stable development ratings, Zhuhai, Hangzhou, and Chengdu all either made slight gains or held their spots in the rankings in Zhuhai. Zhuhai kept its ninth spot in the rankings for investment prospects, with a ratings increase of 6.6 percent in 2015, while an increase of 4.9 percent in development prospects moved the city from tenth in the rankings to the ninth spot. For Zhuhai, 2015 represents a more Exhibit 1-5 Number of College Students in 2013 (Thousands) Guangzhou 983 Wuhan 966 Nanjing 807 Xi an 753 Zhengzhou 748 Jinan 727 Chengdu 702 Chongqing 659 Beijing 599 Changsha 573 Nanchang 520 Shanghai 505 Harbin 492 Tianjin 490 Hangzhou 472 Lanzhou 465 Hefei 443 Nanning 442 Shijiazhuang 396 Kunming 386 Shenyang 384 Taiyuan 379 Fuzhou 318 Qingdao 300 Dalian 276 Xiamen 153 Ningbo 149 Haikou 146 Urumqi 146 Shenzhen 82 Source: National Bureau of Statistics. 19
24 moderate upward trend compared with 2014, when the city jumped from 18th to ninth place in investment and stayed at tenth place in development. Zhuhai s current investment and development ratings are both in the fair category. Zhuhai s relatively high ranking is mainly caused by the potential benefit from the Hong Kong Zhuhai Macau Bridge. Zhuhai is seen as an alternative to living in Hong Kong and offers quick access to Hong Kong. The ranking for the city may rise further once the bridge opens in the next couple of years. An investor who visited the city recently noted that the market is relatively weak with limited demand. A research analyst expressed a similar view. He noted that although Hengqin, an island adjacent to Macau, has been designated by the central government as a free trade zone, its main focus is tourism. As a result, the investor does not expect a substantial growth of the nonresidential property market. He sees a potential increase in home price, however, with demand coming from Macau residents. According to the investor, home prices in Macau are around 40 percent higher than in Zhuhai, and as Zhuhai s amenities improve, he sees a potential increase in home price. Hangzhou. Respondents gave Hangzhou a 6.3 percent higher rating in investment in 2015 and a 0.5 percent higher rating in terms of development. The city held the tenth spot in the rankings for investment and moved up from the 11th to take the tenth spot in investment. Hangzhou s investment and development ratings are both in the fair category. A number of interviewees cited volatility of the market as a cause of people s loss of enthusiasm for the city. However, many also thought that the city s real estate market would benefit from a strong economic growth as the capital of Zhejiang province, one of the most affluent provinces in the country. The concern for oversupply of new homes seems to be abating. The new-home inventory has declined to 13 months, a drop of 34 percent year on year with the newhome stock growing around 9 percent year on year. A residential developer with two projects in the city noted that price had been picking up slowly and sales volume had picked up substantially this year in response to the central government s credit easing policies. And although the government substantially reduced land sales in the past year in view of a limited demand, he sees a pickup in interest to acquire new land by developers who have improved their cash positions. A developer with a project in the city said, Our project is in the fringe of Hangzhou. The growth of downtown Hangzhou is limited, and future growth will happen in the fringe. An investor with exposure to a commercial property in the city said, Hangzhou s office is not as good as Guangzhou s. Qianjiang New Town is still in its early stage. There is not much real demand for Grade A office space. During the next five to ten years, there is room for rental growth. A research analyst noted that the owners of new office buildings in Qianjiang New Town were offering relatively low rents to increase occupancy rate with tenants mainly coming from office buildings in the downtown area. With respect to the effect of Alibaba, the 20
25 Exhibit 1-6 Workforce by Highest Level of Education, 2000 vs (Millions) Age group (2000) (2010) (2000) (2010) (2000) (2010) (2000) (2010) Illiterate Primary Secondary Postsecondary Source: National Bureau of Statistics. e-commerce giant headquartered in Hangzhou, he observed a growing number of IT incubators around Alibaba s headquarters complex, which is outside the city center. Chengdu. Chengdu s ratings increased by 7.9 percent for investment prospects and by 0.6 percent for development prospects in The city moved up two places in the rankings for both categories, taking 11th place for investment and 13th place for development. Chengdu recovered slightly after progressive declines in rankings since 2012, when it was the top-ranked city for both investment and development prospects and was rated good for both. Chengdu s investment and development ratings are now both in the fair category. The city is still seen as suffering from an oversupply of office and retail properties because of aggressive expansion that started five to six years ago. With a slowdown of development and a generally strong economy, the overall situation in Chengdu is not expected to worsen. An investor noted, The office market in Chengdu is terrible. The investment volume in Chengdu is only second to Beijing and Shanghai. However, he also noted, Chengdu is the regional center of the Southwest China. It covers Yunnan, Guizhou, Sichuan, and Tibet. One should evaluate the total economy in the whole area. If you take the surrounding provinces into consideration, the market demand is larger and the market is much deeper. The liquidity is higher, and you don t worry about resale. The increase in investment prospects rating may be partly helped by a growing pool of investable assets held en bloc. One real estate broker called the downtown area with mixed-use projects by the Wharf (Holdings) Limited, Tishman Speyer Properties, Swire 21
26 Properties Limited, and Sino-Ocean Land Holdings Limited to be the best office and retail complex in the Chinese mainland in the quality of the buildings. Regarding the residential sector, a developer noted, Residential price has been going down during the last two years. But it s getting better due to the recent policy relaxation. While the new supply of office and retail in the city center and Tianfu City is substantial, Chengdu s economy has been growing at a robust rate. Its gross domestic product (GDP) grew nearly 12 percent in 2013, and the tertiary industry GDP grew 13.6 percent in 2013, which should bode well, especially for the office market in the long run. Fuzhou (12) and Hefei (13) Solid increases in both investment and development ratings helped propel Fuzhou and Hefei to the 12th and 13th spots in the rankings for 2015 up from 19th and 21st, respectively, in Fuzhou. One of the lower-ranked cities during the past couple years, Fuzhou s ratings improved significantly in 2015, by 9.3 percent for investment and 2.1 percent for development prospects. Fuzhou took the 12th and 11th spots in the rankings for investment and development, respectively, after being ranked 19th and 16th in Still, Fuzhou s investment and development ratings remain in the fair category. Fuzhou is still considered second fiddle to its nearby rival, Xiamen. Although the capital of the province, it suffers from the presence of two economically strong cities in the province, Xiamen and Quanzhou. Although its permanent population numbers more than 7 million nearly twice that of Xiamen s Fuzhou has a much smaller pool of migrants than does Xiamen. This year s improved ranking may be caused by the recent establishment of a free trade zone in Fuzhou. Hefei. Like Fuzhou, Hefei also shot up in the rankings in 2015 after experiencing an increase in numerical ratings in both investment and development. Respondents rated Hefei 10.2 percent higher for investment and 9.4 percent higher for development than in Hefei moved up to the 13th and 12th spots in the rankings for investment and development in 2015, from the 21st spot in both categories in Also, similar to Fuzhou, even with the jump in rankings, Hefei s investment and development ratings remain in the fair category. Recognition of Hefei is growing as a part of the economically strong Yangtze River Delta region. Hefei also benefits from not having an economic rival in the province. An investor noted, Hefei should rank high. The market in Hefei is large. It is merging into the Yangtze River Delta region. Another investor noted, In the Yangtze River Delta, the region south of the Yangtze River is shifting from manufacturing to service sector. The manufacturing sector is moving to the northern part of the Yangtze River and into Anhui province. Premier Li has encouraged the development of Anhui and the northern part of the river and has pledged to make the area the new magnet of manufacturing and related businesses moving from the south. 22
27 Chongqing (14) A relatively modest increase in investment ratings and a stable development rating were enough to move Chongqing up two places in the ranks in both categories compared with 2014, from 16th to 14th place for investment and from 17th to 15th place for development. Chongqing s investment and development ratings both remain in the fair category. Many interviewees view Chongqing as suffering from an oversupply of commercial properties, especially Grade A office buildings. A local developer noted, The government requires developers to build office buildings. In two meetings early this year, I learned that the office spaces completed in the past three years together with the future supply of the next five years will be about ten million square meters. Most of them are Grade A standard. But the annual take-up of Grade A office space in the city is about 200,000 to 300,000 square meters. It will take 40 years to take up all the space (at the current absorption rate). Ten million square meters is higher than the total Grade A office stock in Shanghai. Quite a lot of the developers have slowed down their development of office projects. The same developer also noted, Economy in Chongqing is amazing. The government is doing well. They are changing Chongqing from a heavy industry focused to more high tech driven economy. Currently, the city focuses on the hardware sector, such as mobilephone productions. They try to do software, but the competition throughout China is fierce. The retail sector, especially in central locations, is considered fairly good, especially for strata sale of street-level shops. A couple of investors singled out Longfor Properties Paradise Walk in Chongqing as a successful retail development project. The key success of the project appears to be controlling the property management of the streetfront shops that are sold to investors and allowing for an organic growth of the area. The residential sector for the middle market is seen as suffering from an oversupply because of large land-sales volume in the past. However, the luxury residential market is expected to benefit from a change in the way property tax is levied. As one of only two cities in the Chinese mainland to collect property tax on luxury homes along with Shanghai the Chongqing government has recently decided to deduct the cost of the internal fit-out in determining whether a unit qualifies as a luxury unit. A luxury unit is defined as one that is sold at a price in excess of twice the city average. This deduction of the internal fit-out cost means that a large volume of high-end homes would no longer be considered luxury units. As such, this change is expected to encourage developers to develop and sell units as fit-out units rather than as bare-shell units. An investor with a project in the city said, Chongqing has a huge entrepreneurship base with a lot of small and medium enterprises. In this city, en bloc office buildings cannot be leased. There is a very small market for rental office space. However, the loft concept, which allows owners to get extra gross floor area by putting a mezzanine floor between the decks, is performing well. 23
28 Exhibit 1-7 Gross Regional Product (GRP) and the Role of Tertiary Industry GRP (RMB 100 million) Growth in value added from tertiary industry Tertiary industry as percentage of GRP Growth, Shanghai 21,818 20,182 8% 13% 63.2% 60.4% Beijing 19,801 17,879 11% 12% 77.5% 76.5% Guangzhou 15,420 13,551 14% 16% 64.6% 63.6% Shenzhen 14,500 12,950 12% 14% 56.5% 55.6% Tianjin 14,442 12,894 12% 15% 48.3% 47.0% Chongqing 12,783 11,410 12% 33% 46.7% 39.4% Chengdu 9,109 8,139 12% 14% 50.2% 49.5% Wuhan 9,051 8,004 13% 13% 47.7% 47.9% Hangzhou 8,344 7,802 7% 11% 52.9% 50.9% Nanjing 8,012 7,202 11% 13% 54.4% 53.4% Qingdao 8,007 7,302 10% 12% 50.1% 49.0% Dalian 7,651 7,003 9% 12% 42.9% 41.7% Shenyang 7,159 6,603 8% 8% 43.8% 44.0% Changsha 7,153 6,400 12% 15% 40.7% 39.6% Ningbo 7,129 6,582 8% 11% 43.6% 42.5% Zhengzhou 6,202 5,550 12% 14% 41.7% 41.0% Jinan 5,230 4,804 9% 11% 55.3% 54.4% Harbin 5,017 4,550 10% 12% 53.5% 52.8% Xi an 4,884 4,366 12% 11% 52.2% 52.4% Shijiazhuang 4,864 4,500 8% 12% 41.4% 40.2% Fuzhou 4,679 4,218 11% 11% 45.8% 45.8% Hefei 4,673 4,164 12% 13% 39.4% 39.2% Kunming 3,415 3,011 13% 16% 50.0% 48.9% Nanchang 3,336 3,001 11% 15% 39.8% 38.7% Xiamen 3,018 2,817 7% 10% 51.6% 50.3% Nanning 2,804 2,503 12% 10% 47.9% 48.7% Taiyuan 2,413 2,311 4% 7% 54.8% 53.6% Urumqi 2,203 2,004 10% 13% 59.1% 57.4% Lanzhou 1,776 1,564 14% 17% 51.0% 49.5% Haikou % 12% 69.6% 68.5% Source: National Bureau of Statistics. 24
29 Exhibit 1-8 Net Inflow of Migrants in 2012 (10,000 people) Residents with household registration Permanent residents Net migrants inflow (outflow) Percent of migrants to permanent residents Shanghai 1,427 2, % Beijing 1,297 2, % Shenzhen 288 1, % Dongguan % Guangzhou 822 1, % Tianjin 993 1, % Suzhou 648 1, % Chengdu 1,173 1, % Wuhan 822 1, % Ningbo % Hangzhou % Nanjing % Xiamen % Wuxi % Zhengzhou % Qingdao % Wenzhou % Kunming % Shenyang % Dalian % Jinan % Urumqi % Harbin 994 1, % Fuzhou % Taiyuan % Xi an % Changsha % Haikou % Zhuhai % Hefei % Lanzhou % Shijiazhuang 1,005 1, % Sanya % Nanchang % Nanning (48) (7%) Chongqing 3,343 2,945 (398) (14%) Source: National Bureau of Statistics. 1 Data for Zhengzhou reflect the 2010 census. 25
30 Chongqing s property sector is expected to benefit from a growing trend in which an increasing number of its residents with household registration in Chongqing who had moved to coastal regions for job opportunities are returning to Chongqing. A developer noted, Previously, quite a lot of Chongqing people worked in the Yangtze River Delta and the Pearl River Delta. But now they are moving back to work in local factories. Chongqing s total population is 33 million: 29 million are working and living in the city, and 4 million are working and living outside of Chongqing. But this number is decreasing. A reverse migration is happening in Chongqing. The large pool of universities positions the city well for the IT and high value-added industries. The city has more than 650,000 university students the eighth largest student population in China and one notch above Beijing, which has around 600,000. Xi an (15) One of only six cities to decline in investment ratings in 2015 by 2.8 percent, Xi an moved down four places in the rankings from 11th to 15th place. Xi an also experienced a decline in development ratings by 7.5 percent and moved from the eighth down to the 14th spot in that category. Still, its investment and development ratings both remain in the fair category. The interviewees generally offered positive assessment of the city. A lender noted, Xi an is a lot better than others, indicating that he would rate the city at fifth or sixth place. According to that lender, there is not a lot of retail supply historically, and there is still some room for good Grade A retail assets in Xi an. A developer noted that as the starting point of the Silk Road, Xi an should be among the cities to benefit from the central government s One Belt One Road policy. A developer who has been studying the market noted, Xi an could be interesting. Residential prices there are quite reasonable and are not going up significantly. There is no downside risk. But we have to make sure it has enough scale for us to go there. The average price of new homes in Xi an dropped 6.6 percent year on year, among the highest declines in Tier 1 and Tier 2 cities. An investor notes that in Xi an, residential prices around IT parks in the suburbs can be higher than in downtown. Zhengzhou (16) and Ningbo (17) Zhengzhou and Ningbo both received increased investment ratings, but Zhengzhou also received an increased development rating, while Ningbo s declined. Both cities are considered fair in both categories. Zhengzhou. After Zhenzhou shot up in the ranks to 17th and 19th places in 2014 from 31st and 27th places for investment and development prospects, respectively, in 2013 the city moved up more modestly in both categories in Its investment ratings improved by 3.8 percent from 2014, moving it up one ranking position to the 26
31 16th spot. Development ratings grew by 1.1 percent, moving it to the 17th spot in that category from the 19th spot in Zhengzhou benefits from being the only major city in Henan province, a province with a population of 94 million. A developer, who is looking to enter the market, noted that the huge population of the city and the province are the main attractions. A developer headquartered in Zhengzhou noted that the majority of buyers in his residential development projects comes from migrants from other parts of Henan province. The local residents with household registration in Zhengzhou have a high home ownership rate, he said, and the upgrade demand is relatively weak. Also, he noted, the expanding subway system has been a positive factor for the local estate market. The completion of the second subway line running north and south will help office buildings along the route. The high-speed railway has a large effect on the eastern part of the city where the train station is located. The land market has been very hot, the developer said, with a high transaction volume and a rising price. He estimated that the average price of land sold in the first quarter 2015 was 20 percent to 30 percent higher than it was a year ago. Zhengzhou s strong residential market is reflected in the 38 percent increase in new home inventory in April 2015 year over year and an inventory of new homes of 10.5 months. Ningbo. Ningbo s rating for investment rose 7.1 percent in 2015, moving it up to the 17th place in the rankings from the 22nd. Its development rating, however, slipped by 4.1 percent, moving it down to the 18th from the 14th place in rankings. An investor who recently invested in a mixed-use development project noted an oversupply in the CBD. However, he noted that relatively cheap land was a must in addition to having a good location with direct access to subways and to having a reputable partner. He noted, In Ningbo, if you see the overall statistical numbers, you run away. Land price for pure residential sites, which is still very high, is not attractive on average. Now the governments are putting en bloc requirements, prohibiting strata-title sales. This is a challenge to underwriting deals. He also noted that mixed-use projects with en bloc ownership requirements made competition more manageable as pure residential developers or developers with weak balance sheets could not compete. Another developer noted, The residential market in Ningbo is tough but generally okay. There is an oversupply, and we are aware of this. Generally, an oversupply happens in every single city in the Chinese mainland. People in Ningbo are fairly affluent. The price there still makes a lot of sense. In the past year, the oversupply of new homes has been substantially reduced. The inventory months for new homes have been reduced to 16.2 months, a decline of 37 percent year on year. 27
32 Exhibit 1-9 Subway Lines in Operation and Future Development Plans City Length in 2013 (km) Length by 2015 (km) Length by 2020 (km) Beijing ,050 Shanghai Nanjing Guangzhou Shenzhen Chongqing Tianjin Chengdu Wuhan Kunming Shenyang Hangzhou Dalian Dongguan Ningbo Wuxi Qingdao Suzhou Xi an Changsha Zhengzhou Foshan Fuzhou Nanchang Nanning Harbin Shijiazhuang 242 Lanzhou 202 Hefei 181 Xiamen 75 Taiyuan 70 Urumqi 53 Jinan Sources: National Development and Reform Commission, China International Capital Corp. 28
33 Kunming (18), Nanning (19), and Sanya (20) Kunming, Nanning, and Sanya each stood out, in one way or another, for making some impressive gains in Kunming. With an increase in development rating of 8 percent, Kunming moved up seven places in the ranks in 2015, from the 23rd spot to the 16th. A more modest increase in investment rating allowed it to hold on to the 18th spot in that category. However, despite its increases, Kunming remains down in the rankings compared with 2013 and in the fair category for both investment and development in Nanning. Nanning scored the third-highest increase in investment prospects, improving 17 percent in The city also scored the fifth-highest increase in development, improving 9.2 percent. Like Kunming, Nanning is also in the fair category for both investment and development. The capital of the Guangxi Zhuang Autonomous Region, Nanning is seen as benefiting from the absorption of manufacturing companies from the nearby Guangdong province and also from closer trade with the adjacent Indochina. A research analyst noted that sales volume had been healthy, but price had not moved much. Nanning s inventory of new homes was 9.2 months, a decline of 19 percent year over year. Sanya. Sanya experienced the biggest increase in investment ratings of any city, 19.8 percent, propelling it to the 20th spot in the ranks from the 30th. Respondents also gave Sanya a development rating 17.1 percent better than last year s the second-highest increase in that category. Both of these gains pushed Sanya s rating from poor to fair in investment and development. An investor with exposure in the city said Sanya is doing better than expected, although residential sale price had dropped 10 to 15 percent, still offering a healthy margin. He noted that the high-speed railway had connected the city with the airport. Hotels in Sanya are performing better than expected as well. There is a growing trend of development in entertainment-oriented resort hotels, departing from the traditional model of luxury five-star hotels with limited entertainment options. The best known of such projects is Atlantis Resort, a development in the Haitang Bay by Fosun International Limited. The resort has an ocean theme park and other family-oriented amenities that are expected to attract more tourists to Sanya. Qingdao (21), Nanchang (22), and Changsha (23) Qingdao and Changsha were among the six cities that declined in investment ratings in Nanchang fared better, in relative terms, with improved ratings for investment and development. All three cities are rated fair in both categories. Qingdao. Qingdao s ratings fell 1.5 percent and 3.1 percent for investment and development, respectively, causing the city to fall six spots in the rankings for investment and one spot in development. 29
34 A research analyst noted, The market size is very small. Multinational corporations won t set up large offices in Qingdao. The branches in Qingdao only cover the Shandong province. Qingdao is dominated by local giants, such as Haier Group and Hisense Group. Decentralized areas in the city are under development, with the participation of those large local companies. A developer familiar with the city noted, Retail is starting to materialize. There are a lot of Japanese, South Korean, and state-owned enterprise tenants for the office market. But overall, the demand is still weak for office. For the residential market, a research analyst noted a huge volume of new supply in certain areas of Qingdao, such as Jimo in the northern part of the city. The demand for home purchase from buyers from northeast China has declined as Sanya has become more popular, the analyst noted. In April 2015, the city s inventory of new homes was 21.3 months, an increase of 12 percent year on year. Nanchang. With a 10 percent increase in investment ratings, Nanchang moved up two spots in the rankings in 2015, to 22nd place. Despite a small increase in development ratings, 1.7 percent, the city fell to 27th place in the rankings for that category, from 25th in A developer with a mixed-use development project in the city had a very positive outlook for the city. He noted a big upgrade demand from the local population because generally many of the existing buildings were of a low quality. Also, the city can now be reached from Shanghai in three hours by high-speed train. A research analyst grouped Nanchang with Hefei, Zhengzhou, Nanjing, and Jinan as cities that were slow to develop and were behind China s real estate market cycle. Changsha. Although the overall ratings for both cities declined, Changsha fared worse than Qingdao. In investment, the city lost 11 spots in the rankings and saw its ratings decline by 4.9 percent; in development, Changsha lost ten spots in the rankings and its ratings declined by 10.3 percent. The capital of Hunan province suffers from a large supply of new properties with a relatively low urbanization rate. A developer familiar with the city said, It is hard to balance supply and demand in this market. Another developer noted, Changsha is a quarter of the size of Wuhan. Investment in Changsha will not happen soon. The slowdown of Changsha s real estate market is perhaps best exemplified by the halting of land development a year ago by Franshion Properties in its Meixi Lake project in the western suburb of Changsha. Tianjin (24) and Dalian (25) Tianjin. Tianjin increased in both investment and development ratings, but while it gained four spots in the rankings for development, it fell one place in investment. Tianjin s ratings remained fair for both categories. 30
35 Tianjin is seen as suffering from an oversupply of new office buildings, especially in Yujiapu in the Binhai economic zone. A real estate consultant noted that the situation in Yijiapu might improve when the extension of the high-speed railway from Tianjin occurred in August Upon the completion of the extension, the trip between Beijing and Yujiapu will take 45 minutes. The same consultant noted a fierce competition among newly opened high-end shopping centers developed by well-known developers, such as Hang Lung Properties Limited and Kerry Properties Limited. An investor expressed his skepticism of Tianjin s retail sector: The shopping habits of Tianjin people are different. They don t want to spend. And Tianjin is too close to Beijing. People [in Tianjin] want to go to Beijing for fashion consumption. Regarding Tianjin s residential market, an economist specializing in the housing sector noted, Residential units are not selling, though the development has decelerated. Tianjin s residential market performs very badly, especially in Tanggu New Town. The residential market in downtown is okay. Dalian. Dalian fell in the rankings in investment and development because of a decline in development ratings and, like Tianjin, a too-small increase in investment ratings. Dalian s ratings remained fair in 2015 as well. Dalian s low ranking seems to be due to a combination of the slow economic growth of the northeast region and a generally weak demand. The northeast region, including Liaoning, Jilin, and Heilongjiang, is suffering economically from declining oil prices. Regarding demand for office property, a research analyst noted, Office market lacks demand, and supply is limited, especially prime supply. For retail property, he predicted a pressure on the existing dominant local department store operators, as several new shopping centers, including those by Swire Properties Limited and Hang Lung Properties Limited, entered the market. New shopping centers are seen as offering more experience-related features compared with traditional department stores. Wuxi (26) and Jinan (27) Wuxi and Jinan declined in the rankings for investment and development in 2015, but remained in the fair category overall. Wuxi. Wuxi s ratings fell considerably in The city s investment prospects fell by 6.5 percent, and development prospects fell by 10.5 percent, causing Wuxi to fall 12 and 11 spots in the rankings for each category, respectively the farthest decline in rankings out of the 36 cities for either category. Wuxi is the lowest ranked among the cities in the Yangtze River Delta region that are included in the survey. The city is seen as suffering from an oversupply of land. A developer noted that compared with Suzhou and Nanjing, Wuxi did not have as many well-paying white-collar jobs because most jobs were in manufacturing. 31
36 Nonetheless, a residential investor noted that he recently invested in a residential development project: It s on a street with two good schools and within a 15-minute walk from the high-speed railway station. It really depends on the land price at which you can invest. Wuxi s residential market appears to be improving. The inventory of new homes declined 6 percent in April 2015 year over year, and the inventory of new homes declined to 18.1 months, a drop of 30 percent year over year. Jinan. Like Dalian, Jinan saw an increase in investment ratings and a decrease in development ratings, but fell in the rankings for both categories from 25th to 27th for investment and from 22nd to 26th for development. Although it is the capital of Shandong province, Jinan has lagged Qingdao in economic development. A developer considering investing in the city cited a cheap land price as the key reason for entering the market. Lanzhou (28) and Haikou (29) Ratings for Lanzhou and Haikou improved remarkably in While their ratings remained poor for development despite their gains, their increased investment ratings pushed them above the fair threshold in that category. Lanzhou. Respondents gave Lanzhou an 18.9 percent higher investment rating and a 17.4 percent higher development rating in 2015 the second highest increase for investment, overall, and the highest for development. Lanzhou moved from 34th to 29th place in the rankings for investment and from 35th to 28th place in development. A research analyst noted that home price increased in the past few years by out-oftown developers such as Country Garden, but prices stopped rising. Also, the city is promoting the development of the Lanzhou New Area. In the analyst s view, the government promotes too many new districts. Haikou. Not improved as significantly as Lanzhou, Haikou s ratings improved percent for investment and 6.75 percent for development. The city gained three spots in the rankings for both categories. An investor familiar with Haikou and Sanya opined that Haikou was better suited for retirement communities than Sanya. She explained that with a much bigger population, Haikou had more amenities such as hospitals than did Sanya, and the temperature was more moderate than Sanya. According to a government study, Haikou has the best air quality among 76 cities in the Chinese mainland. (Sanya was not included in the study.) Haikou s residential price index decreased 2.8 percent since 2010, placing the city among the worst performing cities. Haikou is seen to suffer from an oversupply of residential units. The inventory of new homes in April 2015 was 22.1 months. 32
37 Lowest-Ranked Cities (30 to 36) All seven of the lowest-ranked cities Dongguan, Harbin, Taiyuan, Urumqi, Shijiazhuang, Wenzhou, and Shenyang were rated poor for investment and development prospects in Each of these cities were also rated poor in 2014 for both categories, but Dongguan, Harbin, Taiyuan, and Shenyang were rated fair for both in Dongguan. Dongguan s ranking near the bottom is in a stark contrast to its two better-known neighbors, Shenzhen and Guangzhou. A real estate consultant based in Guangzhou noted, As far as I know, the city is the only prefecture-level city with population over ten million in China. It has a huge migrant worker population of more than 6 million, representing around 77 percent of the permanent population, the highest in the Chinese mainland. The consultant further noted, With the rising labor cost and government industry policies [that do not value low value-added manufacturing], manufacturing companies are moving out of Dongguan. The government looks to upgrade its economic structure, clearing the cage and changing the bird. However, the cage is cleared, but the bird does not come. The city is losing its population. And the real estate sector is not doing well. An investor based in Hong Kong and familiar with the city opined that it would be challenging for Dongguan to become a vibrant satellite city of Shenzhen anytime soon. A developer in Shenzhen was more optimistic, recognizing the recent efforts of the city government to make the city better. Shijiazhuang. Shijiazhuang s drop in ratings appears to be in reaction to the limited actual improvement of the city s economy following the announcement of the integration of Beijing-Tianjin-Hebei province. A real estate agent noted, Price is hardly moving up. The government released too much land in the past as part of urban renewal initiative. He further noted, The gap between Shijiazhuang and Beijing is huge. And, the development of Beijing will restrict to some extent the development of cities in Hebei. A developer based in Shijiazhuang was more optimistic about the city s real estate market. She explained that the city had grown fast in population to more than 10 million by attracting people from surrounding areas of Hebei. Because of the central government s policy to integrate Beijing-Tianjin-Hebei, some companies have moved to Shijiazhuang from Beijing. Also, she noted a growing demand for homes in Shijiazhuang from Beijing residents. Travel now takes under 70 minutes by high-speed train between Beijing and Shijiazhuang. Shenyang. The lowest ranking for Shenyang is tied to the stagnant economy, partly caused by the recent drop in oil price. The head of a real estate agency noted, Shenyang market is bad. Housing is not selling. There is too much land supply. The development volume is huge. The number of rich people is limited. 33
38 Shenyang s residential market continues to suffer from an oversupply, with inventory months of new homes at more than 27 months in April The retail and office markets suffer from significant overinvestment. Between 2008 and 2013, the city had the highest number of investments in retail development, edging out Beijing and Shanghai, while it ranked eighth in office development. The local economy, however, is experiencing a substantially slower growth than most of Tier 1 and Tier 2 cities. The GDP grew just over 8 percent in 2013, placing Shenyang among the lowest cities of the survey. While the city s position as the financial, economic, and transportation hub for northeast China provides ingredients for the city to turn around in the long run, clear impetus is lacking for change anytime soon. 34

39 HUITU Shanghai Hongqiao Railway Station. 35
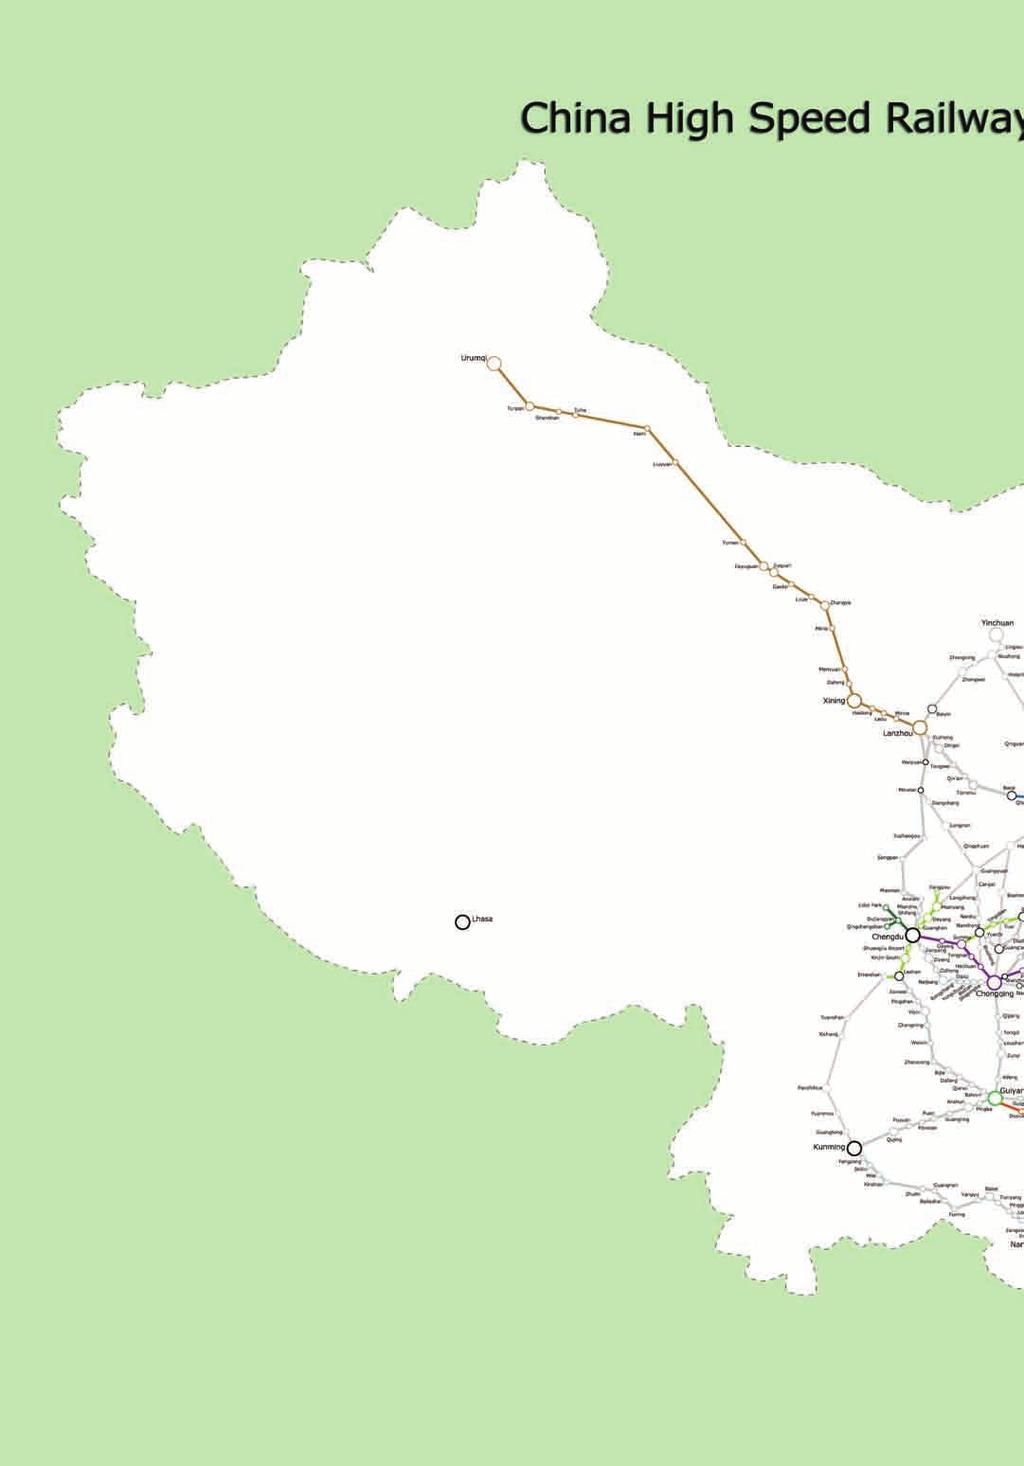
40 36 Source: TravelChinaGuide.com.
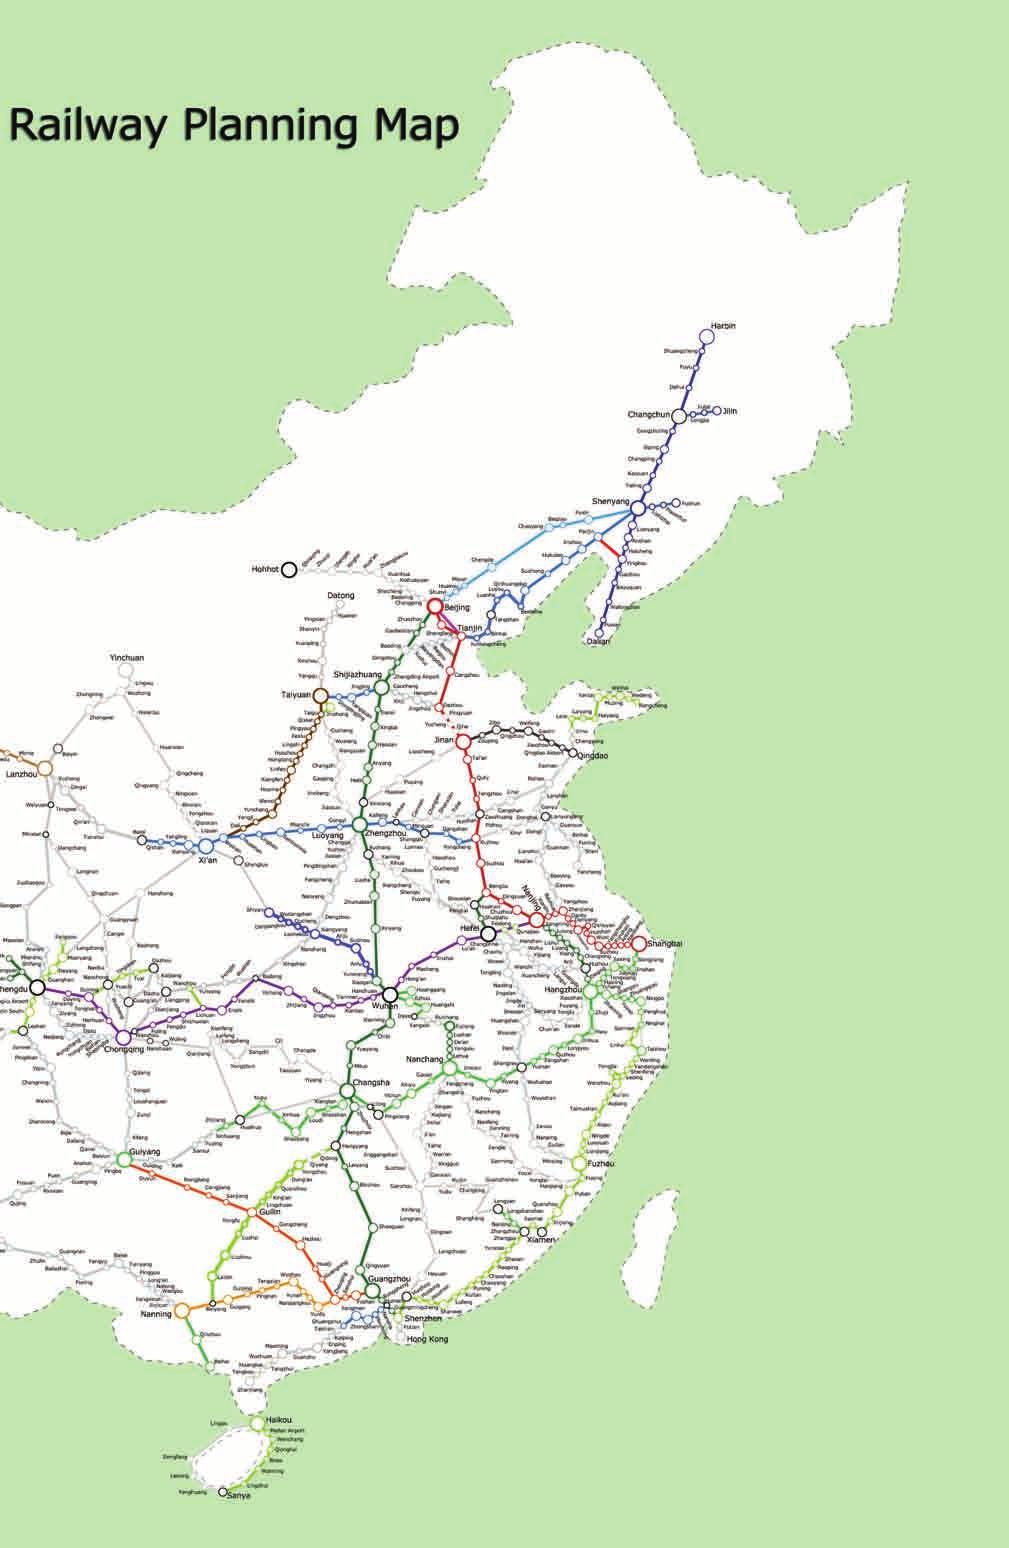
41 37
42 CHAPTER 2 Trends in Sector Engagement ollowing the general trend since this survey s inception, office and retail were by far the most popular sectors for respondents in This year proved to be a new high for involvement in the office sector, with nine of ten respondents indicating that they were currently involved in the area. Retail was down slightly from its high in 2012 and 2013 but remained the second most popular, at above 80 percent. Hotel was the third-most-popular sector, with 71 percent of respondents indicating that they were involved up from 67 percent in Midmarket and luxury residential came in at fourth and fifth, respectively, with 64 percent and 63 percent engagement down from 2014 levels by 7 percentage points each. Finally, the industrial and distribution sector trailed the rest for the fifth consecutive year, with 61 percent of the respondents involved. Exhibit 2-1 Sector Involvement by Percentage of Respondents Office Retail Hotels Residential (midmarket) Residential (luxury) Industrial/distribution 90% 88% 88% 85% 79% 82% 84% 87% 87% 83% 71% 67% 62% 63% 56% 64% 71% 68% 63% 70% 63% 61% 57% 59% 51% 43% 0% 20% 40% 60% 80% 100% Source: Chinese Mainland Real Estate Markets 2015 survey. 38
43 Overall, fewer respondents of this year s survey, as compared with last year s survey, plan to increase their involvement in the subsequent year in four of six sectors: office, retail, industrial/distribution, and midmarket residential. More respondents indicated that they would increase involvement in the hotel and luxury residential sectors compared with last year. However, those gains were relatively modest in light of the decline in the other sectors. While the percentage of respondents planning to increase involvement in the hotel and luxury residential sectors went up by two percentage points and five percentage points, respectively, expected office involvement declined by eight points; industrial/ distribution, by seven points; midmarket residential, by 16 points; and retail, by 16 points. Exhibit 2-2 Expected Change in Sector Involvement from 2015 to 2016, by Percentage of Respondents Industrial/distribution Office 49% 21% 12% 18% 35% 50% 10% 5% Retail 31% 45% 16% 8% Residential (midmarket) 28% 30% 19% 23% Residential (luxury) 28% 30% 20% 22% Hotels 21% 32% 24% 23% 0% 10% 20% 30% 40% 50% Involvement will increase Involvement will not change Involvement will decrease Not in sector at either time Source: Chinese Mainland Real Estate Markets 2015 survey. 39
44 Office Compared with last year s survey, the most visible change is the significant improvement in Shenzhen and Guangzhou s ratings. The ratings for Shanghai and Beijing improved modestly, while the ratings for most of Tier 2 cities made little improvements or declined modestly, with the exception of Xiamen, which improved from 2.71 to 3.35 and ranked fifth behind Guangzhou. The gap between Tier 1 and Tier 2 cities widened Exhibit 2-3 Sector Prospects: Office Shenzhen 4.13 Shanghai 4.03 Beijing 3.97 Guangzhou 3.84 Xiamen 3.35 Wuhan 3.15 Nanjing 3.13 Hangzhou 2.94 Zhuhai 2.88 Fuzhou 2.88 Zhengzhou 2.88 Suzhou 2.81 Nanning 2.73 Xi an 2.70 Hefei 2.69 Kunming 2.67 Ningbo 2.67 Chongqing 2.65 Nanchang 2.64 Dalian 2.63 Qingdao 2.62 Jinan 2.61 Chengdu 2.60 Changsha 2.58 Tianjin 2.58 Harbin 2.36 Wenzhou 2.36 Taiyuan 2.35 Wuxi 2.35 Dongguan 2.31 Urumqi 2.31 Lanzhou 2.23 Haikou 2.19 Shijiazhuang 2.17 Shenyang 2.10 Sanya Abysmal Poor Fair Good Excellent Source: Chinese Mainland Real Estate Markets 2015 survey. 40
45 substantially with the fourth-ranked Guangzhou receiving a rating of 3.84, versus the fifth-ranked Xiamen with 3.35 and the sixth-ranked Wuhan with Offices in Tier 1 Cities Shenzhen s highest rating, of 4.13, reflects the city s robust occupancy and rent growth during the past year. According to DTZ, the Chicago-based global real estate advisory company, Shenzhen s office sector saw the vacancy rate drop to 4.6 percent in the first quarter this year from 7.5 percent a year ago. The monthly average rent also showed a growth of more than 20 percent year on year. Shenzhen s office market has been aided by a strong growth of the tertiary industry combined with a relatively low investment in office development. The GDP from the tertiary industry grew nearly 14 percent in And, according to government statistics, Shenzhen ranked only 18th, after Shijiazhuang, in cumulative investment in office development between 2009 and During the five years between 2009 and 2013, Shenzhen had slightly more than RMB 20 billion in office property development, compared with RMB 178 billion in Beijing and RMB 128 billion in Shanghai. Going forward, Shenzhen will see a significant increase in investment in office property development, especially in Qianhai and Houhai in Nanshan District. While the expected annual supply is 1 million to 2 million square meters of gross floor area, several times the annual new supply amount in the recent years, there is a general consensus Exhibit 2-4 Office Vacancy Rate in Tier 1 Cities (Percentage) Shanghai Shenzhen Guangzhou Beijing 0 1Q Q Q Q Q Q Q 2015 Source: DTZ Research. 41
46 Exhibit 2-5 Monthly Office Rents in Tier 1 Cities (RMB per sq m) Beijing Shanghai Shenzhen 150 Guangzhou 100 1Q Q Q Q Q Q Q 2015 Source: DTZ Research. that the market will be able to absorb the new supply, given the city s strong knowledge-based economy and the growing integration of the Pearl River Delta region. Beijing s office market continues to enjoy the highest average rent of all cities in the Chinese mainland. Its average office rent was RMB 382 per month, more than 40 percent higher than that of Shanghai. However, the acute shortage of office space of two years ago, which saw the vacancy rate drop to less than 2 percent, has since been abated with the release of new buildings in the CBD and other decentralized locations. Still, the vacancy remains low at 5.4 percent, up from 3.9 percent a year ago. The tight office market situation in Beijing is attributed to a combination of the following factors: (a) robust demand growth from the government and service sectors, especially the IT industry, (b) limited pool of developable land in central locations, and (c) relatively low intensity of land use in Beijing compared with other cities. Beijing s economy has the highest percentage of GDP from tertiary industry at more than 78 percent, compared with 63 percent in Shanghai, 65 percent in Guangzhou, and 57 percent in Shenzhen. The limited pool of land that can be developed in the city s central locations, combined with a strong demand for office space has led to a growing number of conversions of centrally located retail buildings to offices, especially those in the CBD and the Finance Street area. A service apartment building on the fringe of Finance Street recently underwent office conversion. Near the CBD, the Pacific Central Place in the Sanlitun area, is currently undergoing repositioning by Gaw Capital, its new owner, which 42
47 is expected to result in a smaller retail area and more office space. Ping An Insurance Company also converted the retail podium of a mixed-use complex near the CBD for office use. In Zhongguancun, China s Silicon Valley, a number of electronics wholesale markets are going through office conversion. Also, IT incubators have recently sprung up to provide office space primarily for IT startups. Exhibit 2-6 Investment in Office Development (100 million RMB) Beijing Shanghai Hangzhou Guangzhou Chengdu Chongqing Zhengzhou Wuhan Fuzhou Qingdao Tianjin Ningbo Kunming Hefei Shijiazhuang Xiamen Xi an Shenzhen Changsha Shenyang Nanjing Jinan Dalian Taiyuan Harbin Nanning Urumqi Lanzhou Haikou Source: National Bureau of Statistics. 43
48 The tightness of the office market may be ameliorated in the next few years when buildings in the expanded area of the CBD are released to the market. Finance Street has essentially no land available for development; hence Lize, an area about 6 kilometers south of Finance Street, is being developed into another office hub to fill the unmet demand. A developer noted that buildings with better specifications will perform better in the coming years: Tenants are now becoming more sophisticated. Green buildings and good quality buildings bode well. China World Trade Center Tower 3 and the Fortune Plaza Phase III are leasing at RMB 15 per square meter, per day. They are doing very well. In comparison, strata-sold buildings in similar locations are charging RMB 10 or even less per square meter, per day. The same developer also noted, Before, strata-title sale of office in Beijing was on a unit-by-unit basis. Now, it s more on a floor-by-floor basis. Alibaba bought three floors from Greenland s office project in Wangjing. Unit by unit is more residential thinking and is carried out by small investors. Floor by floor is more of a corporate behavior. In Shanghai, the growth of decentralized office districts, most notably in the Hongqiao Transportation Hub area, has helped soften the market. In Lujiazui, the Shanghai Tower is planned to open in the second half of 2015 and will be the world s second tallest building. However, the tower is expected to have limited impact on the office market in Lujiazui because of a strong office market with the near full occupancy rate of the buildings that opened in the past few years and a strong take-up, especially from financial institutions and service-sector companies. The office market in Puxi is considered more vulnerable to the expected increase in office supply in decentralized locations, concentrated mainly in Puxi and most notably in the Hongqiao Transportation Hub area. A developer noted, For office, we prefer Beijing to Shanghai. In Shanghai, there are still concerns over the upcoming supply. The rating for Guangzhou s office sector saw a 16.5 percent increase. Guangzhou s office rent has stayed flat at around RMB 160 per month the lowest among Tier 1 cities yet, the vacancy rate has declined from 9.7 percent at the end of 2013 to 6.7 percent by the end of the first quarter of Guangzhou s economic structure, which heavily relies on manufacturing, seems to be undergoing a restructuring to increase the tertiary industry. A number of interviewees mentioned the government s ongoing effort to promote the IT industry. This effort should have a positive effect on the local office market, as seen in Beijing and Shanghai during the past five-plus years with the development of Zhongguancun in Beijing and Zhangjiang and Caohejing in Shanghai. 44
49 Exhibit 2-7 Office Development Pipeline Source: DTZ Research. 45

50 Exhibit 2-8 Office Stock and Availability Source: DTZ Research. 46
51 Offices in Tier 2 Cities Almost all interviewees expressed negative opinions on office markets in Tier 2 cities, citing a huge oversupply. It is not surprising to see cities such as Shenyang, Tianjin, Chengdu, and Chongqing, which have heavily invested in office property, at or near the bottom of this category. The worst case of office supply continues to be in Shenyang, where vacancy increased to nearly 50 percent from 21 percent a year ago with the release of several Grade A office buildings in the city center, with a limited take-up. Shenyang s office market has also been hurt by relatively weak economic growth and the local government s tendency to prohibit strata sale of office buildings in central locations, in contrast to many Tier 2 cities that are more flexible. Chongqing and Chengdu continue to have high vacancy rates, at 40 percent and 33 percent, respectively. Average monthly rent increased 7 percent from RMB 93 to RMB 99 per square meter year on year in Chongqing, and in Chengdu, rent decreased from RMB 122 to RMB 118, a modest decline of 4 percent. Nanjing and Wuhan, with vacancy rate that have remained in mid-teens during the past year, outperformed other Tier 2 cities. Nanjing and Wuhan also showed modest gains in average monthly rent of 6.1 percent and 6.8 percent year on year, respectively. Exhibit 2-9 Office Vacancy Rates in Key Tier 2 Cities (Percentage) Chengdu Nanjing Chongqing Shenyang 30 Tianjin Wuhan Hangzhou 0 1Q Q Q Q Q Q Q 2015 Source: DTZ Research. 47
52 Exhibit 2-10 Monthly Office Rents in Key Tier 2 Cities (RMB per sq m) 150 Hangzhou 120 Chengdu Tianjin Nanjing Xi an Chongqing Xiamen 90 Shenyang Wuhan Q Q Q Q Q Q Q 2015 Source: DTZ Research. An investor remarked, You see forward-contract sales of office buildings in the market. The developers want to avoid leasing risks. A lot of them are glad to provide to buyers rental-yield guarantees, which makes it easier for the buyers to obtain bank loans. In Tier 2 cities, an investor noted, We see more owners who want to sell because of financial difficulties or limited financing sources. Overall, the following key trends have been observed in the office sector, especially in Tier 1 cities, on the basis of the interviews: Growing importance of the IT industry as a user of office space: While business parks such as Zhongguancun in Beijing and Zhangjiang High-Tech Park and Caohejing High-Tech Park in Shanghai have been the preferred office locations for many IT and high-tech companies, the strong growth of the IT sector has seen a strong takeup of office space even in conventional office buildings in well-located decentralized locations such as Wangjing in Beijing. Also, office districts are developing around the headquarters buildings of leading IT companies. Emergence of decentralized office locations with a limited land available in central locations in Tier 1 cities: All Tier 1 cities, particularly Beijing and Shanghai, are running out of land in central locations. Decentralized office areas with convenient public transportation connectivity such as Hongqiao Transportation Hub, Lize in Beijing, Qianhai in Shenzhen, and Guangzhou International Finance Town in Guangzhou will be the source of much of new supply in the Tier 1 cities for the next five to ten years. 48
53 Faster maturation of new office districts with a sufficient stock of residential properties nearby: A developer with office buildings in Wangjing in Beijing credited the availability of a large stock of residential buildings in the area as a key reason for the rapid leasing and the high occupancy rate of the buildings. The presence of a 400,000-person residential community in Wangjing made it easier for companies to relocate to Wangjing because employees could find more affordable housing options in the area and could substantially reduce the time spent commuting to work. In contrast, the relative lack of residential buildings in the Hongqiao Transportation Hub area has often been mentioned as a key weakness of the area. Growing importance of subway and high-speed railway: Many interviewees mentioned subway connectivity as a requirement for office and retail development projects. The current and future expansions of subway lines in a growing number of Tier 2 and Tier 3 cities will bring about many opportunities for new development projects. Local governments have a tendency to plan for too much office space and for too little residential space in comparison. High-speed railway stations are already anchoring a number of large-scale projects such as Hongqiao Transportation Hub in Shanghai and Hangzhou East Railway Station in Hangzhou. Especially if connected to the city s central areas by subway, these areas have the potential to become major office hubs. Emergence of coworking space and incubators: Led by the real estate development company SOHO China that opened two coworking spaces in Beijing and Shanghai earlier this year, the coworking office space sector and high-tech incubators have been getting a lot of publicity and support from local governments that view them as helpful in fostering a culture of innovation and entrepreneurship in the increasingly knowledge-based economy. Retail The retail sector elicited perhaps the most animated feedback from the interviewees. Overall, the interviewees shared a concern about oversupply, the negative impact from the growing e-tailing, and limited experiences by many retail property owners. For Tier 1 cities, ratings were nearly 0.3 percentage points lower for retail property compared with office property. An investor summarized the key challenges that the retail sector is facing: Oversupply is a problem. Retail malls operated by experienced investors will outperform. Poorly managed retail malls will be sold on the market. A lot of nonperforming retail products are selling on the market. I have seen a lot of owners increase their portion in food and beverage, entertainment, and education. There is a downtrend in rental. A developer specializing in mixed-use development projects noted, There will be a consolidation in the retail sector. Retail is very project specific. Even in two neighboring shopping malls, one s performing well while the other is empty. More supply in retail is not a problem. A lot of the new shopping malls are built by inexperienced developers. Developers with management skills and operation and development capabilities will take the lead in the consolidation. 49
54 Exhibit 2-11 Sector Prospects: Retail Shenzhen 3.85 Guangzhou 3.77 Shanghai 3.65 Beijing 3.52 Wuhan 3.46 Xiamen 3.37 Nanjing 3.35 Hangzhou 3.35 Zhuhai 3.29 Suzhou 3.25 Dalian 3.10 Ningbo 3.04 Qingdao 3.04 Xi an 2.95 Jinan 2.94 Chongqing 2.92 Harbin 2.92 Chengdu 2.89 Sanya 2.89 Fuzhou 2.88 Zhengzhou 2.87 Nanning 2.86 Changsha 2.83 Kunming 2.82 Hefei 2.81 Wuxi 2.79 Nanchang 2.77 Tianjin 2.73 Lanzhou 2.67 Taiyuan 2.67 Haikou 2.50 Dongguan 2.44 Shijiazhuang 2.43 Wenzhou 2.43 Urumqi 2.42 Shenyang Abysmal Poor Fair Good Excellent Source: Chinese Mainland Real Estate Markets 2015 survey. He also explained that the recent surge in retail supply is tied to the government s restrictive policies on the residential sector and inflexible zoning that has required too much retail space. He said, Many developers are forced to go into the retail sector due to the restrictive policies and land supplies. More than 60 to 70 percent of the land put up for sale during the past three to four years have retail components. 50
55 Exhibit 2-12 Investment in Retail Property Development (100 million RMB) Shenyang Chongqing Shanghai Beijing Chengdu Wuhan Dalian Guangzhou Zhengzhou Hefei Hangzhou Tianjin Kunming Changsha Harbin Ningbo Shijiazhuang Xi an Qingdao Nanjing Fuzhou Shenzhen Jinan Xiamen Taiyuan Nanning Lanzhou Urumqi Haikou Source: National Bureau of Statistics. Another developer also faulted the relative inexperience of developers. Noting that retail development usually takes three to five years to complete, he pointed out, Developers usually fail to see the trends of next three to five years when retail malls are planned. The retail industry is so changeable; however, developers and designers don t leave much room for changes in malls that can allow for organic growth in the future. It s like writing Chinese calligraphy. You should leave some space and not make the Chinese characters look too tight. The developer continued to say that shopping malls should be able to adjust the locations of shops and the mix of its tenants on the basis of actual results. 51
56 Another developer mentioned limited differentiation among retail shopping centers both in Tier 1 and Tier 2 cities as a problem for the retail sector. Department stores have been hit the hardest by the growing e-tailing. A review of the same-store sales of five leading department store chains shows that they experienced a decline in same-store sales in 2014 for the first time, in stark contrast to a rapid double-digit growth only a few years ago. Same-store sales (sales of stores in operation for at least a year) grew more than 20 percent year on year in 2010 and 2011, but the rapid growth came to a sudden halt in 2012, when the annual growth decreased to 6 percent. In 2014, same-store sales experienced a negative growth for the first time, posting a 3.3 percent decrease year on year. Department stores are facing other challenges besides e-tailing. A developer whose company recently closed two department stores in its portfolio explained that sales had been hurt by competition from new foreign retailers and a decline in sales of prepaid store gift cards because of China s clampdown on corruption. He also noted, Because of online sales and an oversupply of retail space, there is excess stock of retail properties. Many shopping malls stay empty in Shanghai, even in good locations. Exhibit 2-13 Change in Same-Store Sales, (Percentage) Median Springland Parkson Maoye Intime Golden Eagle Source: Company reports. 52
57 Investors are generally cautious about taking on poorly performing malls. An investor noted, We are trying to buy something with good positioning. You will need to be careful when it comes to poorly performing malls. Another developer explained that in the future, if we have a mixed-use development project, unless the project is in a prime location, we will use retail as a supporting facility for office and residential in the project. Another developer noted in future mixeduse projects, his company would reduce retail space by around 40 percent and keep the shopping center component at around 50,000 to 60,000 square meters of gross floor area versus around 100,000 square meters as in the past. A number of interviewees also observed that developers now face more difficulties in strata-title sale of retail shops. For many local mixed-use developers in Tier 2 cities, strata-title sale of a certain portion of retail shops in shopping centers has traditionally been a key source of funding. However, shops sold by developers and now owned by individual investors are seen as underperforming as retailers do not generate sufficient sales relative to the rent, because of increasing online sales. One national retail developer noted that her company would be more cautious about strata-title sale of retail shops within their projects and might, in fact, buy back some of the shops that have been sold to improve operation of the shopping centers. An analyst in a real estate agency pointed out, Retailers are not expanding. Our retail team is worried about retail retailing, meaning non-food and beverage. People are not spending in the malls. For a majority of retail malls, especially community malls, sales turnovers are dropping. For high-end shopping centers, increasing overseas travels of the Chinese and the strengthening of the Chinese yuan compared with the euro are also posing a challenge. The same analyst noted, Luxury retail is not doing well because people now fly to Europe to buy luxury goods. It s cheaper in Europe. Previously, the price gap was 15 percent. With the euro depreciating, the price gap is even bigger. China does not have a mechanism to levy an import tax for buying overseas. Chinese mainland travelers often buy luxury goods on behalf of their friends, colleagues, and family members during their overseas trips. Retailers are also adjusting their plans for store openings. Rather than increasing the number of stores, they now prefer to focus their resources on a smaller number of stores, often expanding the size of the remaining stores as well as the new stores. The more selective store expansion puts small-scale retail developers at a disadvantage because retailers, especially those with good brands, prefer to work with developers with a large portfolio of shopping centers and good reputations. Some owners of retail shopping centers have opted for conversion to office use. For example, Zhongguancun Electronics Shopping Market in Beijing is being converted to office use and startup incubators. Despite the challenging environment in the retail sector, a number of interviewees mentioned successes such as Indigo, a retail shopping center along Beijing s East 4th Ring 53
58 Road developed by Swire Properties Limited, and Paradise Walk, a shopping mall in Chongqing. For Indigo, the skillful and timely change in tenant mix was cited as the key reason for a near full occupancy and a robust increase in rent. For Paradise Walk, the developer, Longfor Properties, retained the property-management rights for strata-sold units and allowed for the organic growth of an area anchored by a popular pedestrian street in the city center. Looking forward, the retail property sector will be going through a period of fundamental changes as online sales continue to grow. A successful developer of mixed-use projects predicted, E-commerce will change the landscape completely for the retail property sector. The retail property sector in most cities in the Chinese mainland also suffers from a huge supply of new shopping centers. However, there is a growing consensus that well-managed shopping centers in good locations that offer experiential shopping environments will do relatively well. In contrast, run-of-the-mill shopping centers in suburban locations or even in downtown locations will do poorly. Hotel The general sentiment for the hotel sector continued to be as lukewarm as The biggest problem for the sector remains the oversupply of five-star hotels. Another negative factor for the sector has been reduced spending by the public sector as a result of the central government s campaign against extravagant spending by the public sector. For most investors, the hotel sector is off their radar. One investor pointed out that the oversupply of five-star hotels has occurred in most markets because local city and district governments generally mandate such hotels as a condition for the sale of land for a large-scale development project. Also, limited liquidity for hotels and no clear exit mechanism makes the hotel sector unattractive. A research analyst in a real estate agency noted, Hotels are heavily affected by the anticorruption initiative. The traveling budget of government officials and state-owned enterprises has been slashed. Hotels are proactively seeking a lower rating. An investor noted, For hotels, room rates don t hold out well. There is too much supply, even in Shanghai. We are not too keen on it. The anticorruption campaign has weighed on the performance of five-star hotels. He indicated that he would be willing to look at hotels in good locations to reposition for other uses. In fact, there has been an increase in the conversion of hotels to other uses. In Shanghai, the JC Mandarin Hotel on Nanjing West Road is currently undergoing conversion to office use, and the Galaxy Hotel in Hongqiao was recently converted to office use. In Beijing, a research analyst noted that several hotels have been converted to senior housing or white collar worker apartments. However, an experienced investor sounded a more cautious note about hotel conversion for other uses. He cited the generally low ceiling height of older hotels, the less 54
59 Exhibit 2-14 Sector Prospects: Hotels Shenzhen 3.67 Guangzhou 3.54 Xiamen 3.41 Zhuhai 3.29 Shanghai 3.29 Sanya 3.28 Hangzhou 3.18 Beijing 3.16 Nanjing 3.12 Xi an 3.05 Harbin 3.00 Ningbo 3.00 Suzhou 3.00 Wuhan 3.00 Jinan 2.94 Kunming 2.94 Fuzhou 2.93 Chengdu 2.91 Dalian 2.88 Chongqing 2.87 Haikou 2.86 Changsha 2.82 Tianjin 2.81 Nanning 2.79 Qingdao 2.77 Wenzhou 2.77 Hefei 2.71 Wuxi 2.71 Zhengzhou 2.67 Nanchang 2.64 Taiyuan 2.50 Urumqi 2.50 Shenyang 2.48 Lanzhou 2.42 Dongguan 2.33 Shijiazhuang Abysmal Poor Fair Good Excellent Source: Chinese Mainland Real Estate Markets 2015 survey. than ideal floor layout, the potential design challenges, and the unpredictable nature of obtaining necessary government approvals in a timely manner as key reasons why hotel conversions are very challenging and risky. Despite the challenging environment for the hotel sector, three cities have seen a significant improvement in ratings: Shenzhen, Guangzhou, and Xiamen. The ratings for Shanghai and Beijing have stayed relatively stable. 55
60 A more optimistic view was expressed by a hotel professional, who noted that, since 2014, the number of leisure and business travelers has been increasing. Recovery came back in Tier 1 cities first 2015 will be even more positive. The occupancy is expected to increase. There are more domestic travelers. Also, the Chinese government provides preferred visa policies to people overseas, such as giving ten-year multiple visit visas, which will increase inbound travelers. According to the same hotel professional, Shanghai is always on the top of the list in terms of foreign travelers. He included the other Tier 1 cities namely Beijing, Shenzhen, and Guangzhou as well as resort or tourism destinations such as Lijiang, Sanya, and Xi an as popular travel destinations for foreign travelers. He observed, Given more international flights opened and easier visa policies, you see more family travelers during summer vacations. Another positive trend is the greater propensity for younger generations to travel versus their older counterparts. The hotel professional noted, The younger generation is willing to spend more on holidays on leisure and travelling. Mid- to upper-scale hotels will become more popular. As a result, the hotel professional thinks the sector will improve. He predicted During the coming years, downtown locations [of Tier 1 cities] will see growing demand. You have to have the right product in suburban locations. They are more to cater to costsensitive customers. Exhibit 2-15 Domestic Tourism 10,000 people 450, , , , , , , ,000 50,000 30% 25% 20% 15% 10% 5% Yearly growth E 0% Domestic travelers Yearly growth Sources: National Bureau of Statistics, China National Tourism Administration. E=estimated. 56
61 Exhibit 2-16 Foreign Tourism Number of tourists in millions Yearly growth, inbound travelers Yearly growth, outbound travelers 25% 20% 15% 10% 5% 0% Yearly growth 0-5% Inbound travelers from Hong Kong, Macau, and Taiwan Outbound travelers Inbound foreign travelers (excluding Hong Kong, Macau, and Taiwan) Sources: National Bureau of Statistics, China National Tourism Administration. The head of a company with a growing portfolio of resort hotels was also positive on the sector, although he was concerned about the new supply over the short run. He pointed out that the index measuring the number of hotel rooms per 1,000 people is only 4 in the Chinese mainland, compared with 20 in the United States and 10 in the United Kingdom. In particular, he noted there would be a strong demand for resorts from middle-class families. However, the resort hotel market has been negatively affected by the central government s austerity policy that includes a measure that prohibits government and semi-government organizations from holding events in 20 specified resort destinations. Looking forward, while the oversupply will continue to be a significant drag, the hotel sector should benefit from the growing size of the Chinese mainland s middle class and an increasing number of domestic travelers. The number of domestic travelers has consistently grown over the past ten years at a constant annual growth rate of 12.5 percent. In 2014, domestic travelers totaled 3.6 billion, three times the figure in Also, the number of outbound travelers reached 109 million in 2014, more than three times the figure in In contrast, the number of inbound foreign travelers (not including travelers from Hong Kong SAR, Macau SAR, and Taiwan) increased only 30 percent from 20 million in 2005 to 26 million in 2014, suggesting that the Chinese mainland does not have a strong pull for foreign travelers. 57
62 Residential Overall, Tier 1 cities had the largest increase in ratings for midmarket-residential and luxury-residential sectors and retained the top four spots. In particular, the ratings for the luxury-residential market for Tier 1 cities showed the largest increase. Exhibit 2-17 Sector Prospects: Midmarket Housing Shanghai 4.11 Shenzhen 4.00 Guangzhou 3.97 Beijing 3.86 Nanjing 3.86 Wuhan 3.54 Xiamen 3.53 Suzhou 3.48 Chongqing 3.48 Zhuhai 3.47 Hangzhou 3.43 Qingdao 3.42 Hefei 3.40 Zhengzhou 3.40 Ningbo 3.38 Chengdu 3.36 Xi an 3.35 Tianjin 3.31 Nanning 3.21 Fuzhou 3.20 Nanchang 3.15 Jinan 3.07 Kunming 3.06 Changsha 3.00 Haikou 3.00 Lanzhou 3.00 Taiyuan 3.00 Dalian 2.97 Wuxi 2.96 Sanya 2.94 Harbin 2.93 Urumqi 2.92 Dongguan 2.81 Shenyang 2.75 Shijiazhuang 2.65 Wenzhou Abysmal Poor Fair Good Excellent Source: Chinese Mainland Real Estate Markets 2015 survey. 58
63 Shenzhen s rating for luxury residential improved the most, to 4.04 versus 3.32 in last year s survey. Shanghai s rating, last year s number one, also improved substantially, to 3.86 versus 3.45 in 2014, followed by Guangzhou and Xiamen. For midmarket residential, Shanghai s rating improved the most, to 4.11 versus 3.75 in 2014 s survey. Shenzhen placed second with 4.00, followed by Guangzhou and Beijing Exhibit 2-18 Sector Prospects: Luxury Housing Shenzhen 4.04 Shanghai 3.86 Guangzhou 3.82 Xiamen 3.61 Beijing 3.60 Hangzhou 3.52 Sanya 3.33 Zhuhai 3.24 Nanjing 3.23 Ningbo 3.18 Suzhou 3.18 Chengdu 3.17 Wuhan 3.13 Chongqing 2.95 Tianjin 2.94 Haikou 2.93 Kunming 2.88 Fuzhou 2.87 Hefei 2.87 Zhengzhou 2.86 Qingdao 2.83 Dalian 2.81 Jinan 2.80 Harbin 2.79 Nanning 2.79 Nanchang 2.77 Xi an 2.76 Wuxi 2.70 Changsha 2.65 Dongguan 2.63 Lanzhou 2.58 Wenzhou 2.54 Taiyuan 2.50 Urumqi 2.42 Shijiazhuang 2.38 Shenyang Abysmal Poor Fair Good Excellent Source: Chinese Mainland Real Estate Markets 2015 survey. 59
64 at 3.97 and 3.86, respectively. Nanjing had the biggest increase among Tier 2 cities, moving from seventh place to fourth place, tied with Beijing. For luxury residential, Xiamen s rating improved the most to 3.61 this year versus 2.64 in 2014 and moved up in rankings to the 4th place this year from the 17th in The general sentiment among the interviewees was an improved view of Tier 1 cities; for Tier 2 cities, that view depended on local conditions. Overall, the following trends have appeared in ratings and rankings in 2015 versus 2014: The ratings for luxury-residential markets in the 36 cities surveyed significantly improved with the average rating increasing from 2.62 to 2.99, an increase of 14 percentage points, while the ratings for midmarket-residential markets improved relatively little with the average increasing from 3.11 to 3.27, an increase of 5 percentage points. The bigger improvement in ratings for luxury is primarily because of the cancellation of home-purchase restrictions in most cities, except for Tier 1 cities. Even Tier 1 cities ratings for luxury residential improved over A number of cities that had relatively slower starts in economic development and had not experienced an overheated real estate market saw their ratings improve substantially. Those cities include Nanning, Nanchang, Zhengzhou, and Lanzhou. A developer based in Shanghai noted, As for the residential market, the sales volume both month on month and year on year is declining. We don t see any growth in price in the near future. In fact, after the latest easing policy was released, the share prices of listed developers didn t increase. The real impact of such easing policies should have been heavier. However, the impact is below the market expectation, which implies that the recent policies have limited market implications. A contrasting view was expressed by a developer with residential development projects regarding the effect of the latest credit easing policies. He said that in Hangzhou sales picked up recently, and some developers started increasing selling prices, although modestly. In preferences for places to invest in, a foreign investor noted that he was keen on the economically prosperous Yangtze River Delta region for investment. He said, We see that the real estate market is bottoming out in the Yangtze River Delta, and the region is running ahead of other parts of China in terms of market recovery. Other regions will follow suit. He further explained, If you look at other countries, you will find prime areas in established and mature markets usually recover first. We don t see oversupply in Tier 3 and 4 cities in the Yangtze River Delta. But an oversupply exists in areas outside the Yangtze River Delta. In the Yangtze River Delta and Pearl River Delta, Tier 3 and 4 cities are more like satellite cities of large cities. In the case of the Yangtze River Delta, many Tier 3 and 4 cities are essentially satellite cities of Shanghai, Hangzhou, and Nanjing. But Tier 3 and 4 cities in Sichuan or Henan are another story. In the Yangtze River Delta and the Pearl River Delta, the land cost in satellite cities is still lower and the markets there are positive. 60
65 Exhibit 2-19 Primary Commodity Residential Inventory, April 2015 Total inventory 1 Months of inventory 2 City 1,000 square meters Percentage change, April 2014 April 2015 Number of months Percentage change, April 2014 April 2015 Beijing 10,060 16% % Tier 1 Tier 2 Guangzhou 9,920 23% % Shanghai 9,240 26% % Shenzhen 4,570-11% % Shenyang 27,920 9% % Qingdao 15,900-1% % Changsha 15,580 29% % Chongqing 15,370 16% 7.5-7% Wuhan 14,330 2% % Hangzhou 11,510 9% % Wuxi 8,480-6% % Suzhou 7,680 0% % Changzhou 7,160-11% % Nanjing 6,760 9% 8.5 4% Zhengzhou 5,830 38% % Ningbo 5,700 0% % Nanning 5,590-2% % Hefei 5,330 23% % Haikou 4,930 8% % Jinan 3,970-30% % Dalian 3,920-5% % Fuzhou 3,520 34% % Nanchang 3,340 21% % Xiamen 3,120 15% % Source: China Real Estate Information Corporation. 1 Inventory is for-sale units that are completed but unsold, as well as units under construction but allowed for presale. 2 Inventory months is the total inventory divided by average three-month sales volume. The investor noted, We don t really see that developers are offering preferred terms on JV [joint venture] partnership or disposal of projects. In our case, we go in at cost base. In fact, land prices are not cheaper. Land prices in established markets are actually moving up. Real estate markets there have improved. We see that in the next two quarters, markets are bottoming out. In terms of timing, it s better to go into the market. Given the credit easing policy, people s sentiments about the market are improving. An economist who specializes in the housing sector struck a more cautious note about the overall market. He predicted a potential housing-market collapse in many Tier 3 and 4 cities if the overall economy goes into a recession. Yet, he was positive about 61
66 Exhibit 2-20 Primary Commodity Residential Price Index, April 2015 Month over month (March 2015 = 100) Comparisons Year over year (April 2014 = 100) Compared with 2010 (Year 2010 = 100) Shenzhen Beijing Shanghai Wenzhou Guangzhou Hangzhou Shijiazhuang Nanjing Wuhan Nanning Xiamen Harbin Ningbo Taiyuan Tianjin Dalian Changsha Hefei Shenyang Jinan Fuzhou Nanchang Chengdu Wuxi Zhengzhou Chongqing Sanya Urumqi Xi an Kunming Qingdao Haikou Lanzhou Source: National Bureau of Statistics. Tier 1 cities. He said, Cities like Shanghai, Beijing, and Shenzhen still have a bright future, but the competition in these markets is very hot. Developers are returning to Tier 1 cities. The demand in these markets is very strong. 62
67 A real estate consultant based in Guangzhou noted a more challenging environment for smaller developers. He said, Developers are feeling pressure because of the high inventory. There is a clear differentiation between large and smaller players. For small and medium-sized developers, it s very hard to get bank financing. They don t have a strong brand. Their products are not priced high but are not selling. However, he was positive about the Guangdong province: Tier 3 and 4 cities in Guangdong province are relatively okay. The overall real estate market in Guangdong is hot. A number of interviewees expressed positive views on Zhengzhou and Nanchang, provincial capitals that saw their ratings and rankings significantly improve. In general, these cities are clearly the most economically dominant cities in their respective provinces, generally lagged in economic development in the past, and did not experience overheating of the real estate sector. In Zhengzhou, the provincial capital of Henan, a big demand is coming from migrants from other parts of the province while upgrade demand is weak, a local developer observed. He also mentioned benefits from the high-speed railway and subway system that is expanding. In the case of Nanchang, the provincial capital of Jiangxi province, a developer with a project in the city credited the strong residential market to (a) the city s slow start, (b) a low quality of the existing housing stock, and (c) the opening of a high-speed railway line to Shanghai, which has reduced the travel time to Shanghai to around three hours. Overall, the following key trends have been observed in the residential sector on the basis of the interviews: Tier 1 cities residential markets are considered safest, despite the continuing homepurchase restrictions, with strong demand coming from new residents, especially in the case of Shenzhen and Shanghai. Land sales have substantially declined in the past year while land price has generally stayed stable; yet in Tier 1 cities, land price has been increasing. Developers and investors favor the economically vibrant regions of the Yangtze River Delta and the Pearl River Delta. While home-purchase restrictions are still being enforced in Tier 1 cities, Tier 1 cities residential markets have performed well, especially in Shenzhen, and downtown locations are considered more resilient than suburban locations. Through a combination of a reduction in new construction starts and a recent pickup in sales, a number of cities such as Hangzhou and Ningbo have substantially reduced new home inventory. The cancellation of home-purchase restrictions has helped boost sales. Expansion of subway lines and high-speed railway in a growing number of Tier 2 cities and provincial capitals is creating new potentially profitable development opportunities. 63
68 Industrial/Distribution The popularity of the warehousing sector among developers and investors was tempered in this year s survey compared with last year s. A real estate agent bluntly stated, Expectation to go into logistics is fundamentally a wish list. When you understand the market, you find it is not easy to do logistics. She cited the relatively small ticket size of each investment in the warehouse sector and the difficulty of managing such a portfolio spread over a large distance. Furthermore, this sector is dominated by several large firms with big teams who possess deep market knowledge that newcomers cannot easily match. The same sentiment was echoed by an investor who noted, We are not investing more in logistics. The market is quite saturated. Everyone is trying to get a piece of the pie. He further observed, Everyone jumps into logistics. We had a similar situation four to five years ago in retail property. At this moment, you don t see any oversupplying. If you complete the construction, you are still able to get tenants. The oversupply is not going to happen in two years. But with an investment spree, there will be an oversupply in the end. Another investor noted, We tried to do logistics, but we were a bit late. It s not meaningful to have only one or two projects. The logistics need to be very well priced and require unique skills. The scale is important as well. We would like to invest in a platform with a few exiting assets out there. There are only one or two very powerful brands in the logistics sector. Same as last year, the difficulty of getting suitable land for development was cited as the main challenge facing the sector. An investor pointed out, For logistics, here are the issues: land does not generate tax revenue, and government cannot sell land for too high of a price. As a result, local governments refuse to release land. Another challenge cited in 2014 s report was the move made by local governments to reduce the land use tenure for new industrial land, most notably in Shanghai, which in the first half of 2014 decided to reduce the land tenure of industrial land to be sold by the government from 50 years to 20 years in a two-year trial program. Since the new policy went into effect, only one parcel of land for industrial use with a 20-year land tenure has been auctioned off in Shanghai by the government. A developer observed that similar to Shanghai, Nanjing and Hangzhou have also started a trial program to reduce the land tenure from 50 years to 30 years. He also noted, We don t underwrite deals for 20 to 30 years of land tenure. He said that he had been able to expand by acquiring land with longer land tenure from other developers, not from local governments. From the local government s perspective, the shorter land tenure for industrial use provides flexibility to change the land use to fit the quickly changing market environment. It remains to be seen what will happen when the twoyear trial period ends next year. 64
69 A developer active in this sector observed a disconnect between the central government and local government policies for logistics. The central government has been supportive of fostering the logistics industry while local governments have not been too willing to provide a sufficient amount of land for logistics warehouses, according to the developer. However, local governments are more receptive to selling land to leading e-commerce players and retailers, he noted, because their presence can support local industry even if it does not necessarily contribute tax revenues. Exhibit 2-21 Sector Prospects: Industrial/ Distribution Shenzhen 4.00 Guangzhou 3.97 Shanghai 3.94 Suzhou 3.61 Beijing 3.61 Tianjin 3.60 Wuhan 3.48 Nanjing 3.44 Chengdu 3.44 Chongqing 3.41 Xiamen 3.39 Hangzhou 3.39 Zhengzhou 3.33 Wuxi 3.28 Zhuhai 3.28 Xi an 3.21 Ningbo 3.09 Qingdao 3.09 Dalian 3.08 Changsha 3.00 Dongguan 3.00 Nanning 2.93 Nanchang 2.93 Kunming 2.89 Fuzhou 2.87 Hefei 2.87 Lanzhou 2.83 Jinan 2.75 Urumqi 2.75 Shenyang 2.73 Wenzhou 2.69 Shijiazhuang 2.67 Haikou 2.64 Harbin 2.54 Taiyuan 2.50 Sanya Abysmal Poor Fair Good Excellent Source: Chinese Mainland Real Estate Markets 2015 survey. 65
70 The growing scarcity of land that can be developed, especially in Tier 1 cities, has led developers to intensify land use. A developer noted, Most deals we have done are two-story facilities. We will do multistory, if height limits are approved. He was skeptical about giant e-tailers, such as Alibaba and JD.com (also known as Jingdong Mall), developing their own warehouse facilities, as this conflicts with the asset-light business model that their investors generally prefer. The developer painted a brighter outlook for the logistics sector when he said, In a grand picture, China is turning into a consumption-driven economy. At the end of the day, you cannot go from an investment-driven economy to a consumption-driven one without warehousing. He noted a substantial growth in demand from Chinese companies, who now comprise around 75 percent of revenue, up from around 50 percent two years ago. Shenzhen and Guangzhou finished first and second, as their ratings improved substantially. Shenzhen s rating improved from 3.71 to 4.00, while Guangzhou s rating improved from 3.52 to Likely the more amenable regulatory environments of these cities, compared with some other Tier 1 and Tier 2 cities, factored into the final ratings. 66
71 CHAPTER 3 Issues Affecting Development and Investment n this year s survey, respondents did not indicate that they expected any of the ten particular issues to have a substantially or even moderately negative impact. However, they also did not indicate that any of the issues would have a moderately or substantially positive impact all ten issues were rated between 2.5 and 3.5 on the five-point scale, or little/no impact. This finding is in contrast to survey respondents in 2014, who indicated a few areas of concern for (a) investment and (b) development. For the former, central government real estate tax policies and the cost and difficulty of raising external financing were the issues expected to have negative impacts; for the latter, respondents expected those same two concerns as well as the continued imposition of home-purchase restrictions to have negative impacts. The rating for two factors improved substantially: the residential and development practices of local governments, and the cost and difficulty of raising external financing. E-commerce was the only factor that saw its rating decrease, reflecting the increasingly negative impact that the increasing volume of online sales is having on shopping centers. Perhaps in 2014, survey respondents were more focused on the positive impact of e-commerce on creating demand for Grade A warehouse facilities; but in 2015, respondents focused more on the threat imposed by e-commerce on traditional shopping centers. Central Government Real Estate Tax Policies Three tax issues generated a lot of discussion from the interviewees: Announcement 7, which essentially levies a 10 percent capital gains tax for share transfer of an offshore company when the underlying asset is located in the Chinese mainland; the pending announcement and implementation of value-added tax (VAT) for real estate sales; and Circular 62, which prohibits tax rebates and other incentive policies by local governments. Circular 62, however, was significantly modified during the writing of the report as explained below. Announcement 7 was issued earlier this year. The rule regulates the reporting of the sale of overseas-registered companies that own real estate assets in the Chinese mainland. Under the new rule, both the buyer and the seller are required to report to the tax bureau, whereas in the past only the seller was required to do so. The circular is designed to impose collection of a 10 percent capital gains withholding tax in the sale of an offshore entity that owns real estate in the Chinese mainland. What makes this new rule troublesome for investors is that there is no safe harbor for past transactions. So, an investor in an overseas special purpose vehicle that owns a local real estate property would be legally responsible for the unpaid withholding taxes of previous owners, if those owners did not pay the tax. Announcement 7 looks at all transactions back to This new law also hurts investors who invested without underwriting potential capital gains tax. Also, an investor noted that an overseas initial public offering of a developer with properties in the Chinese mainland may potentially become a taxable event. 67
72 Exhibit 3-1 Impact of Various Issues on Development and Investment over the Next 12 Months over the Next 12 Months Impact on Development Local government residential development and sales practices 3.21 Central government public/low-income housing policies 3.04 Local government land release practices 2.94 Central government land release policies 2.90 Local/central government environmental policies 2.90 Impact of e-commerce on demand for real estate 2.89 Central government real estate tax policies 2.77 Outlook for the domestic economy 2.75 Continued imposition of home purchase restrictions 2.58 Cost/difficulty of raising external financing 2.50 Impact on Investment Local government residential development and sales practices 3.16 Local government land release practices 3.05 Central government public/low-income housing policies 3.03 Central government land release policies 2.99 Local/central government environmental policies 2.93 Impact of e-commerce on demand for real estate 2.89 Outlook for the domestic economy 2.79 Central government real estate tax policies 2.78 Continued imposition of home purchase restrictions 2.67 Cost/difficulty of raising external financing Substantially negative impact Little/no Moderately Impact positive impact Moderately negative impact Substantially positive impact Source: Chinese Mainland Real Estate Markets 2015 survey. For the real estate industry as a whole, the most significant change in tax laws will be the introduction of VAT to real estate. Currently, real estate developers have been paying 5.5 percent of sales value as a business tax. When VAT is introduced, developers will pay a higher rate of 11 percent on the value created, which is the difference between the selling price and the construction cost and other allowed costs. The key problem, from the developer s perspective, is that land cost will likely not be deducted in determining the taxable amount. 68
73 An investor familiar with the issue noted, VAT will be a big hit on residential developers. It s not difficult for commercial asset owners to find deductibles. And commercial asset owners are paying a high property tax already. But for residential, land price cannot be counted as deductibles. VAT will hit the Tier 1 cities more, given the land prices for residential in those cities are the highest. In Tier 1 cities and central locations of Tier 2 cities, land costs can often exceed half of the final selling price. According to a tax accountant interviewed, the new VAT could potentially reduce profit margins for around 90 percent of developers. Perhaps, the new VAT, as described above, could potentially reduce land price and encourage the fitting out of residential units rather than the selling of bare-shell homes. Also, the accountant predicted that developers would be incentivized to set up their own construction companies. Reflecting on the significant impact of the new VAT, a Hong Kong based developer with substantial holdings in the Chinese mainland noted, We had an internal study on the VAT, and we invited the big four accounting firms to give us trainings. We have a lot of projects with office buildings. We are looking at how the market norm will be and whether the tenants or the landlord will be made to bear the VAT. We want to understand how to adjust our lease contract with tenants to reflect this. Circular 62 was announced at the end of According to the circular, local governments are not allowed to pay developers rebates for land purchase and tax incentives. In addition, all land rebates and tax-incentive policies in the land sales contracts of the past years needed to be reported to the State Council by the end of March According to a developer, the circular may be part of an effort by the central government to stamp out corruption since land and tax rebates are seen to have created a lot of corruption in the past. However, this circular was replaced in May by a new circular that honors the favorable treatments stated in already executed contracts. This policy change was prompted, apparently, by negative reactions from businesses to Circular 62. In addition to the above, according to a tax accountant, developers may potentially have difficulty collecting overpaid land appreciation tax (LAT) from local governments. He noted that although LAT pre-levy is usually 1.5 to 2 percent of sales revenue, the rate can be as high as 7 percent in some cities. According to the accountant, in the current relatively poor residential market, the final LAT amount based on actual results may be less than the pre-paid LAT amount. In such a situation, he said, it s by no means that you can get the overpaid portion of LAT back from the government. The Cost and Difficulty of Raising External Financing The general consensus among the interviewees was that obtaining financing has become difficult for small and medium-sized developers in general, while large developers still have good access to debt financing. The difficult market conditions have made fundraising for real estate funds specializing in the Chinese mainland more challenging. 69
74 Exhibit 3-2 Land Sales by Tier of City, 2014 Site area put up for sale (10,000 sq m) Site area sold (10,000 sq m) Land sales revenue (RMB 100 million) Accommodation value 1 (RMB per sq m) Premium 2 Tier 1 cities Absolute value 3,665 3,401 5,068 7,705 25% Year-over-year -26% -27% -3% 41% -7 pctg pts Tier 2 cities Absolute value 52,009 43,193 10,806 1,337 8% Year-over-year -20% -23% -28% -4% -8 pctg pts Tier 3 cities Absolute value 79,985 57,438 7, % Year-over-year -26% -36% -37% -2% -4 pctg pts Source: China Real Estate Index System. 1 Accommodation value refers to the land cost per square meter of gross floor area. 2 Premium is the percentage by which the final land transaction price exceeds or falls short of an opening price set by the government in a public auction. Exhibit 3-3 Land Sales by Tier of City, First Quarter 2015 Site area put up for sale (10,000 sq m) Site area sold (10,000 sq m) Land sales revenue (RMB 100 million) Accommodation value 1 (RMB per sq m) Premium 2 Tier 1 cities Absolute value ,254 15% Year-over-Year -55% -47% -47% -4% -18 pctg pts Tier 2 cities Absolute value 7,768 6,796 1,735 1,293 8% Year-over-year -40% -43% -45% -4% -1 pctg pt Tier 3 cities Absolute value 14,196 9,779 1, % Year-over-year -30% -39% -38% 1% 0.3 pctg pt Source: China Real Estate Index System. 1 Accommodation value refers to the land cost per square meter of gross floor area. 2 Premium is the percentage by which the final land transaction price exceeds or falls short of an opening price set by the government in a public auction. The tight financing environment has meant better opportunities for investors with available money. One foreign lender noted, Foreign investors are feeling a little bit better this year. There are more trading activities in China. Some local developers who in the past were not willing to dispose of investment assets are now willing to sell, he observed. However, he also noted that more opportunities in other developed markets and difficult market conditions had combined to increase the challenges for fundraising for China-specific real estate funds. 70
75 A foreign investor noted that working with even top-tier national developers has become easier as developers want to diversify funding sources, rather than simply rely on the volatile public market. Another foreign investor noted, Banks can lend out more. However, banks are selective on borrowers. If you are Tier 1 and Tier 2 developers, you don t have real issues getting bank loans. But it s difficult for Tier 3 and Tier 4 developers. As a result, he noted, Consolidation is happening. It s a good thing that nonperforming companies go bankrupt. You will see smaller developers bought out and acquired by big players. Large developers acquire land, or project companies, or form JVs to bail out smaller players. Worried about a worsening economy, the central government has, since November 2014, reduced the People s Bank of China s (PBOC) lending rate three times. The PBOC s lending rate is currently 5.65 percent, 0.90 percent lower than the 6.55 percent rate in place from July 2012 to November 2014, when the current round of the central government s credit easing policy started. According to a developer, the lower interestrate environment does not mean more bank credit for developers necessarily. However, he noted that developers have been indirectly benefiting, as sales have started to recover because of the lower cost of borrowing. Regarding the anticipated big wave of trust loans that were to go into default but has not materialized, a number of interviewees offered explanations. One investor said, If trust companies force default on trust loans to developers, this will do no good to themselves. So trust companies roll over the trust loans. In fact, trust companies stopped lending about two years ago. Another investor noted, Most trust loans are repaid in full or rolled over. They have quite strong guarantees and have banks behind them. In the worst case, trust companies can take over the equity of the partner and find a developer partner to develop the project. A developer observed that some asset-management companies have been acquiring trust loans with the intent to renegotiate the terms of the borrowers such as converting debt to equity interests. A foreign investor noted, It s difficult to get debt financing for funds. Developers can usually provide group guarantees or have good relationship with lenders. But for funds, we can only have the project as the guarantee. It s even more difficult to get debt financing from foreign banks. They don t want to lend to local property. They cannot get the pledge onshore. Local banks want to give you more onshore money, but we want more offshore money. Local banks have money, but they don t lend for vacant buildings. We tend to work with local partners, developers who can provide guarantees or get master leases. Overall, the challenging borrowing environment has led many developers to reduce financial leverage. 71
76 Continued Imposition of Home-Purchase Restrictions As predicted by some of the interviewees in last year s survey, the central government has eased home-purchase restrictions, largely allowing local governments to make decisions. Nonetheless, restrictions still exist in Tier 1 cities. A developer noted, besides curbing the heated real estate market, home-purchase restrictions are also tied to controlling population growth. He thinks that home-purchase restrictions will not be suspended in the next three to five years in Tier 1 cities. Another developer, mainly operating in Tier 1 and Tier 2 cities pointed out that homepurchase restrictions and a high transfer tax for sale of homes owned for less than five years had substantially reduced the upgrade market. He further noted, In advanced cities, upgrade demand should be dominant. A developer with a project in Foshan, near Guangzhou, explained that the Foshan government quietly ended all home-purchase restrictions at the start of May Since then, sales volume has picked up substantially, and the company has even increased prices as a result. He noted that around half of the buyers are from the area, with the other half coming from other parts of the province. Central Government Land Release Policies In recent years, the central government has been making a concerted effort to improve land use. One policy from that effort is the reduction of land use tenure for industrial land. Since last year on a two-year trial basis Shanghai reduced the land tenure for new industrial land from 50 years to 20 years. Also, Hangzhou and Nanjing are under a trial program for reducing industrial land tenure from 50 years to 30 years. However, the reduced land use tenure has not been well received by developers and investors who find it difficult to justify the capital expenditure for new buildings on sites with the new limited land use tenure. Local Government Land Release Practices Since last year s survey, land sales volume has substantially declined nationwide. Many interviewees noted a declining land sales volume as a response to depressed real estate markets. According to data from China Real Estate Index System (CREIS) on 300 cities surveyed, site area sold in 2014 decreased 27 percent in Tier 1 cities, 23 percent in Tier 2 cities, and 36 percent in Tier 3 cities. The decrease in land sales volume escalated in the second half of While site area sold declined 10 percent and 25 percent year on year in the first and second quarters of 2014, it declined 30 percent and 50 percent in the third and fourth quarters of In the first quarter of 2015, site area sold decreased 41 percent year on year. Nonetheless, land prices have not declined. In fact, some noted that prices have started picking up in Beijing and Shanghai, as a growing number of developers try to 72
77 establish a foothold in these Tier 1 cities, even at prices that are considered high. A Beijing-based developer noted, Land prices were going up very fast in the past few years in Beijing. Now it s stabilizing. Land prices are still high compared with selling prices. Basically, state-owned enterprises are in the land market. For them, it s better to have something to do, even for a thin profit margin, than having nothing to do at all. The competition in Beijing is artificial, not a natural one. There are too many national developers looking to be in Beijing. According to CREIS, in 2014 land cost per square meter of gross floor area increased 41 percent in Tier 1 cities, while it declined 4 percent in Tier 2 cities and 2 percent in Tier 3 cities. The substantial decrease in land sales volume is largely because of the generally depressed residential market, the limited demand for new land by developers, and the local governments reluctance to release new land at reduced prices. A developer in Shanghai noted that the decline in land sales in provincial capitals is also related to declining land resources. The land resources in provincial capitals are decreasing, he observed. The growth of agriculture-use land turning to land for real estate development is decreasing, mainly impacted by changing urbanization and land transfer policies as well as the ever-strict redline guideline to enhance grain safety. The land requisition cycle for urban renewal is prolonged, and the relocation cost is rising. At the same time, the central government is trying to limit the size of local-government financing vehicles, which are the major funding source for urban-renewal projects. Moreover, with the anticorruption campaign going on, the local government becomes less efficient when it comes to urban renewal. Local Government Residential Development and Sale Practices As a result of the slowdown of the economy and the generally depressed real estate market, local governments in general are more proactively working with developers in land sale. A number of interviewees mentioned that the local government had required too much space for commercial properties, mainly office, retail, and high-end hotels in mixed-use projects. Pure residential development projects have become less common. As a result, many cities both Tier 1 and Tier 2 are experiencing an oversupply of commercial properties. A Hong Kong based developer faulted many local governments for requiring too many high-rises. The government encourages very high plot ratio in some cities, he said. You see a lot of skyscrapers. The best cities in the world don t have skyscrapers. A lot of 150-meter-tall buildings are under development in China. This creates a lot of ghettos and underutilized area. Space demand growth is not as high as GDP growth. In fact, you don t need big corridors of office buildings. There will be half-empty buildings. A number of interviewees observed that local governments were becoming more selective in choosing developers for sites for mixed-use development. Whereas price 73
78 is the primary and often the only determining factor in the sale of residential sites, good reputations and relevant experiences of the developer are among the key considerations for the sale of land for mixed-use sites that are often transit-oriented projects. Outlook for the Domestic Economy Since the late 1990s, there has been a pattern of the central government intervening in the real estate market as a way to control the overall economy. If the economy is growing too fast, then the central government would impose measures to cool down the real estate market. Such measures have included increasing interest rates, reducing liquidity for developers, restricting home purchases for existing home owners, and requiring a higher minimum downpayment ratio. If the economy is underperforming, then the central government would pump liquidity into the real estate market by lowering interest rates or reducing the minimum downpayment ratio. An investor noted, GDP growth is slowing, but the economy will still grow at 6.5 to 7.0 percent. As the government is working on the restructuring, both social and financial, it will keep the real estate sector healthy, as the real estate industry contributes 20 percent of the GDP. A bad real estate market will dampen GDP growth for sure. So the political and policy environment favor the real estate market. Among the interviewees, there was a general consensus that Tier 1 and Tier 2 cities, with more knowledge-based economies, should weather the current slowdown of the overall economy. A number of interviewees mentioned currency depreciation and the potential deflation of commodities as a potential threat. A local investor noted, Recently, the renminbi has been depreciating against the U.S. dollar. Therefore, foreign investors may decrease their activities in the Chinese mainland. A domestic investor noted the effect that the heated local stock market was having on the real estate market. She said, The development of China s stock market has great impact on the real estate market. The financing cost is on the rise. Investors are allocating their funds to the stock market this year. No trust companies are investing in real estate now. They are requested by the investors to increase the portion toward the stock market. Nonlisted companies will have higher financing cost. An investor reasoned that the combination of a slow economy and the government s easing policies make a favorable environment to invest in real estate. He said, We are in an extremely good market environment at the moment. The market is bottoming out. Sales volume is growing. Sales price will follow. Currently, sales prices are going down due to the clearing of inventory by developers. The market is in a destocking process. Lower land sales volume and easing government policies are moving things. 74
79 E-Commerce The effect of e-commerce on traditional shopping centers is most visible in the increasing number of shopping centers and retail podiums of office buildings converting to primarily office use, particularly in Beijing. While such conversion is feasible in Tier 1 cities with strong office markets, it is not a viable option in most Tier 2 and lower-tier cities that are suffering from oversupplies of both retail and office buildings. A mixed-use developer in Shanghai noted that for his projects, e-commerce s impact is relatively small at the moment. One-third [of floor space] in our malls are for retail retailers. Besides shopping, we have much more to offer. We offer experience that cannot go online. In the next phase of development, online shopping will be very much a part of our malls. We call O+O [offline + online]. People do online shopping at our shopping mall. We will have to make our mall much more efficient, much more comfortable, and much more convenient than people s homes and offices for online shopping. The developer further explained, The next area of growth will be in B2C [business to consumer], from manufacturers to consumers. This requires advanced technologies and intermediaries. Tmall is essentially B2C. The tenants are mostly manufacturers and wholesalers. The O+O initiative aims to provide a physical platform for the B2C business. Central Government Public/Low-Income Housing Policies The topic of central government public and low-income housing policies received only a limited number of comments. However, a number of interviewees pointed out that because of a high home ownership rate even for low-income local residents with household registration in the city where they live and a significant increase in housing stock in the past ten-plus years, the need for public housing had substantially declined. Exhibit 3-4 E-tailing vs. Brick-and-Mortar Retail in China RMB billion 40,000 35,000 30,000 25,000 20,000 15,000 10,000 5, E 2015E 2016E 2017E 2018E 80% 70% 60% 50% 40% 30% 20% 10% 0% Growth rate E-tailing sales E-tailing growth rate Retail sales Retail sales growth rate Sources: National Bureau of Statistics, iresearch Inc., Urban Land Institute. E=estimated. 75
80 In January 2015, the Ministry of Housing and Urban-Rural Development announced its encouragement for cities with large new-home inventory to purchase commodity housing in the market for public housing use instead of building public housing projects. A number of cities in the provinces of Sichuan, Anhui, Jiangsu, Liaoning, Guizhou, and Inner Mongolia have purchased commodity housing buildings for public housing use. In the case of Wuhu, the second largest city in Anhui province, as of November 2014, 45 percent of the approximately 13,000 families that were relocated to make room for new development were given homes acquired in the market. Local/Central Government Environmental Policies In the 2014 report, we noted the central government s declaration of war on pollution, the announced economic integration of the Beijing, Tianjin, and Hebei province, and a growing acceptance of the Green Building Design Label (3-Star rating system) and the Leadership in Energy and Environmental Design (LEED). In this year s survey, no material changes with respect to environmental policies were observed. Other: Land Tenure Extension for Commercial Properties A number of interviewees mentioned a lack of clarity on land tenure extension as a serious issue for investing in older existing buildings. An investor noted that a limited remaining land use period is a serious deterrent to investing in buildings, as it is uncertain what will happen when the land use tenure expires. Also, a lender explained that his bank would not provide debt on a property that has less than 30 years of remaining tenure. This issue is expected to hamper investment in older properties, even in good locations where they would otherwise be well suited for repositioning and retrofitting. 76
81 CHAPTER 4 What s New? What s Livable? Niche Sectors -commerce distribution centers remained in first place for investment prospects among niche sectors, followed by overseas homebuilding. "Youth" apartments ranked near the bottom last year showed the most significant improvement in rating from 2.97 to 3.30, while resorts ranked at the bottom last year showed a modest improvement from 2.81 to E-Commerce Distribution Centers It is not surprising that e-commerce distribution centers remained popular, given the continuing robust growth of e-commerce in the Chinese mainland. It is estimated that online sales represented 10.7 percent of total retail sales in 2014, and online sales portion of total retail sales is expected to reach 20 percent in the next several years. To cope with the rapid growth, online retail giants such as Alibaba and JD.com have announced big plans to develop their own warehouses; however, a logistics-facility developer Exhibit 4-1 Investment Prospects for Niche Sectors E-commerce distribution centers 4.17 Overseas homebuilding 3.63 High-tech/cyber/knowledge parks 3.61 Self-storage 3.47 Business parks 3.41 Seniors housing/retirement homes 3.40 "Youth" apartments 3.30 Public/low-income housing 3.18 Serviced apartments 3.08 Resorts 3.00 Other Abysmal Poor Fair Good Excellent Source: Chinese Mainland Real Estate Markets 2015 survey. 77
82 noted that investing in real estate properties conflicts with the light-asset model expected by the online retailers investors. Moreover, he noted that local governments are seeking ways to collect taxes from online sales, and this could have a negative impact on e-tailing. The same developer also mentioned that in smaller cities, manufacturers may bypass warehouses and deliver goods directly to end users. This poses a challenge to investing in e-commerce distribution centers in smaller cities. Overseas Homebuilding Overseas homebuilding s rating stayed the same as last year. During the past year, investment in overseas properties continued to grow. According to JLL, an international real estate agency, the Chinese mainland s investment in overseas real estate properties totaled US$16.5 billion in 2014, an increase of 46 percent over the prior year. Top-tier developers continue to favor gateway cities in the United States, Europe, and Australia. A large national developer explained, Our outbound investment focuses on global metropolitans, such as New York, San Francisco, Los Angeles, Paris, and gateway cities in Germany. The group does not have any plans to invest in secondary cities. He also noted that his firm is currently developing a condo project in Australia. An investor who has been investing in residential development projects with Chinese developers and investors noted that his company has started exploring secondary markets in the United States and Europe, as well as in Asia. A local fund manager cited the need for geographic diversification by high-net-worth investors as a key reason for investing in overseas markets. She said that her firm prefers to invest in funds managed by reputable foreign funds, instead of investing at the asset level. Smaller developers and investors, likely because of limited financial resources to compete in big markets with high land costs, have even been investing in developing countries in Asia. A small developer in Beijing explained that his company has development projects in Laos and other parts of Southeast Asia as well as a student apartment project in a second-tier city in the United States. As for reasons for going abroad, he said, Opportunities in China are limited. The market is not doing well. It s harder and harder to get land, and the price is going higher and higher. For insurance companies that have been aggressively acquiring office buildings in key markets like London and New York, an investor explained, We have talked to insurance companies. They cannot get decent yields in China. The cost of insurance money is at around 6 percent. So they need a net yield of at least 8 percent NOI [net operating income]. It s not possible to find such deals in China. But it s easier to find in, say London, and also get more financing. A few interviewees mentioned a dampening of individual investors interest in investing in overseas properties as a result of a hot local stock market that has doubled in value 78
83 in less than a year. A professional service provider noted, The investment channel for investors has broadened. The outbound investment demand from trust firms and local funds has declined. High-Tech/Cyber/Knowledge Parks and Business Parks Business parks are generally situated in suburban locations and offer a lower-cost alternative to companies that cannot afford high rents in central locations. Another important attraction is that business parks with a specific industry focus among tenants can create a cluster of companies, which can lead to the creation of significant synergies. Examples of such parks include Zhongguancun in Beijing, Zhangjiang and Caohejing in Shanghai, and Optics Valley in Wuhan. A number of business parks, especially those with a high-tech focus, are anchored by leading universities. Zhongguancun in Beijing grew around Peking University and Tsinghua University. In Shanghai, Shui On Land developed the Knowledge and Innovation Center (KIC) around Fudan University and other leading universities. However, not all business parks are alike. A real estate agent in Tianjin noted that business parks in his city have not worked well for developers and investors. According to him, private developers of buildings in business parks often compete with local stateowned developers who offer substantial rent subsidies to attract tenants. Moreover, with the office market in Tianjin even in central locations having an oversupply of new buildings, rents in suburban business parks can only reach around 30 percent of the rate of buildings in central locations. A research analyst noted that prominent IT and high-tech companies have been developing their own research-and-development campuses on a large scale, often in suburbs or satellite cities of Tier 1 cities. An example is Huawei s campus in Langfang, Hebei, just outside Beijing. These campuses can potentially become an engine for future economic growth and create more development and investment opportunities. Self-Storage Self-storage is still very much a new product in China, and self-storage facilities are primarily found in Shanghai and Beijing, which have substantial expatriate populations. However, self-storage is increasingly being used by small-scale online resellers of goods. Self-storage facilities are generally more centrally located, and though rents can be more expensive than in suburban or outside-of-city locations, they can be more economical when considering delivery costs. How fast this new product will grow will largely depend on whether the younger generation of professionals in the Chinese mainland in their 20s and 30s adopts this product, especially given that the expatriate population is no longer growing. 79
84 Housing for Seniors and Retirement Housing After many years of eager anticipation by some, a seniors housing market has not yet materialized. Clearly, China has a huge population of senior citizens: people over the age of 60 number around 170 million, or 14 percent of the Chinese mainland s population. An investor offered the following explanation for why the seniors housing market has not taken off in China: Senior living China is not there yet. There is a lack of qualified operators. People in their 50s and 60s and older folks don t have money. People who really have the money are currently in their 30s and 40s. Another reason for the slow start of the seniors housing market is that the vast majority of retirees receive support from their children. Currently, retirees in China generally have more than one child, as the one-child policy did not start until A consultant who has been involved in the senior care sector for over a decade remarked that this sector is too large to generalize. He observed that the segment that requires medical care is very much ready to take off, whereas the lifestyle segment will need to wait at least five years. Nonetheless, he acknowledged that limited financial resources or limited willingness to pay has meant that senior home care providers have had to adjust down their revenue expectations significantly. Even though seniors housing has not caught on, developers, insurance companies, and senior-care-facility operators are actively experimenting with different products and business models. A lender noted, We are seeing some scalable development projects in the seniors housing sector. Another investor noted, We are looking at senior housing in mixeduse projects with retail, normal residential, and senior housing components, where the seniors children can live in normal apartments. It s a very good combination. In addition to a substantial increase in the number of high-quality operators, affordable land for seniors housing projects was mentioned by some interviewees as necessary for the sector to grow. A number of interviewees mentioned that a wide range exists in how much support local governments provide to the seniors housing sector. Also, land designated for seniors housing use generally has requirements such as en bloc ownership and price for senior care services, and as such returns may not suffice. Youth Apartments Youth apartments refers to rental apartments that generally cater to young professionals in their 20s and early 30s, and are en bloc owned and managed by a professional manager. Based on statistics, the potential market for this product is larger than for seniors housing. People between the ages of 20 and 34 represent more than 26 percent of the total population, while those over the age of 60 represent less than 15 percent. 80
85 According to a report titled China Mobile Population Development Report 2014 published by the National Health and Family Planning Commission, the total migrant population is up to 245 million. Of those, 77 percent were born after 1980 and 72 percent are renters. Without institutionally owned and managed multifamily housing units available in the market, most of the Chinese mainland s renters rent from individual homeowners. In the past year, this niche sector saw investments by well-known investors. In November 2014, Lei Jun, the founder of Xiaomi, the smartphone manufacturer, invested RMB 100 million in a youth-apartment company that has two projects in Guangzhou. Also, Ping An invested with IDG Capital in the Mogoroom Youth Apartment Project, a development targeting white-collar office workers. Public/Low-Income Housing Public and low-income housing projects are primarily the domain of state-owned developers. Local governments set targets each year for the amount of public housing to build. This year, the public and low-income housing sector has had little impact on the commodity housing market. However, it is noted that local governments in cities with excess commodity housing inventory have started to buy commodity housing units for public housing use. Serviced Apartments Historically, serviced apartments were primarily rented by senior executives of multinational companies (MNCs) receiving the so-called expat package. Shanghai and Beijing have a disproportionately large number of serviced apartments, given that the vast majority of MNCs have their China headquarters and senior executives of their Chinese mainland business in these two cities. A number of interviewees expressed negative views on the sector primarily because of a declining demand from expatriates. A real estate agent in Shanghai noted, During the great financial crisis in 2008, many expatriates left China, and local midlevel managers were promoted. The demand went down as a result. Since 2010, expatriates have been coming back again; however, the living allowance has been slashed. Another negative factor for the sector is that serviced apartments face increasing pressure from a growing pool of high-quality strata-owned apartments that are rented. Nonetheless, the sector was seen as attractive by a number of interviewees. A developer based in Shanghai, whose company owns serviced apartments, mentioned the relatively stable cash-flow profile of serviced apartments as a key positive. He said, Revenue is too volatile for hotels. Occupancy is quite low, at 50 to 60 percent. In comparison, serviced apartments can achieve occupancy of 85 percent [even] though the average daily rent is 10 percent lower. A financial sector consultant noted, I see more investment in serviced apartments than hotels. The operating cost is much lower, and the income is more stable. There is no seasonality for serviced apartments. 81
86 Resorts Resorts made the third-biggest improvement in rating since last year s survey. A number of interviewees thought that the time may be ripe for local resorts to take off, given the already substantial pool for middle-class and upper-middle-class families. During the past year or so, perhaps the biggest resort projects have been a ski resort in Mount Changbai, being developed by Wanda Group, and a large-scale mixed-use project in the Haitang Bay area of Sanya. A resort developer noted that resorts often are not sufficiently supported by airlines or road infrastructure. For example, there is only one daily flight from Beijing to Mount Changbai, but when other developers develop additional hotels and other amenities, airlines would be persuaded to provide more flights. According to the same developer, the central government has announced a list of 20 resort cities in which government departments and state-owned companies should not hold events. This policy has dampened the resort sector. Coworking Space A quickly emerging new niche sector this year is coworking space, first championed on a large scale in the United States by WeWork, based in New York City. WeWork started in 2010 with an office in Manhattan with less than 500 square meters of floor area, but it has since expanded to 18 locations in nine cities. Though the sector started receiving wide attention when SOHO China opened its first two coworking space locations in the Jing An District of Shanghai and the Wangjing area of Beijing in February 2015, coworking spaces have existed for at least several years in Beijing and Shanghai mainly as incubators around universities in the Zhongguancun area and the Yangpu District, respectively. Traditionally, incubators tend to be small in scale, with around 1,000 to 2,000 square meters of gross floor area, and cater to IT startup companies that have a limited number of staff. The sector received more publicity when Mao Daiqing, the well-known head of China Vanke s northern China operation, resigned from the company to start a new coworking business. According to a senior executive of a coworking space provider, coworking space does more than just provide working space. It also creates a valuable community for small business enterprises through organizing events on a daily basis. According to the executive, the potential market in China is huge given the rapidly changing nature of office space requirements even for large, established companies. According to her, companies need to be flexible to respond to changing space requirements. Regarding the potential erosion of profit margin if the economy slows down and the office market softens, she thinks it could potentially provide a boost to the coworking space sector with an increase in a number of startup companies. 82
87 City Livability Overall, this year s livability rankings were similar to last year s. Hangzhou replaced Shanghai as the most livable, and Shanghai was ranked second, though its rating improved modestly. Exhibit 4-2 Livability Hangzhou 4.14 Shanghai 4.06 Xiamen 3.94 Suzhou 3.93 Chengdu 3.85 Zhuhai 3.80 Dalian 3.79 Sanya 3.79 Shenzhen 3.78 Qingdao 3.70 Kunming 3.63 Guangzhou 3.59 Nanjing 3.56 Haikou 3.37 Ningbo 3.35 Wuxi 3.32 Chongqing 3.15 Fuzhou 3.12 Wuhan 3.10 Xi an 3.09 Changsha 2.92 Hefei 2.91 Nanning 2.90 Nanchang 2.83 Wenzhou 2.75 Jinan 2.74 Zhengzhou 2.66 Harbin 2.65 Tianjin 2.64 Dongguan 2.51 Beijing 2.51 Lanzhou 2.47 Shenyang 2.46 Taiyuan 2.19 Urumqi 2.10 Shijiazhuang Abysmal Poor Fair Good Excellent Source: Chinese Mainland Real Estate Markets 2015 survey. 83
88 Exhibit 4-3 Monthly Air Quality Comprehensive Index, March 2015 City Index 1 Rank among 74 cities 2 Major pollutants Haikou PM10 Zhuhai NO 2 Xiamen PM2.5 Shenzhen PM2.5 Dongguan NO 2 Nanning PM2.5 Nanchang PM2.5 Guangzhou NO 2 Fuzhou NO 2 Kunming PM2.5 Ningbo NO 2 Changsha PM2.5 Hefei PM2.5 Wenzhou NO 2 Shanghai PM2.5 Chongqing PM2.5 Hangzhou PM2.5 Wuxi PM2.5 Qingdao PM10 Suzhou PM2.5 Nanjing PM2.5 Dalian PM2.5 Urumqi PM2.5 Wuhan PM2.5 Harbin PM2.5 Xi an PM10 Lanzhou PM10 Chengdu PM2.5 Taiyuan PM2.5 Tianjin PM10 Beijing PM2.5 Shenyang PM2.5 Jinan PM10 Shijiazhuang PM2.5 Zhengzhou PM2.5 Source: China National Environment Monitor Center (CNEMC). 1 The index takes into consideration six key pollutants, namely SO 2, NO 2, PM10, PM2.5, CO, and O 3. The higher the index, the worse the air quality. 2 The CNEMC releases a monthly air quality comprehensive index for 74 cities in China. 84
89 This year, Sanya broke into top ten, moving up from 11th place to eighth, as its rating improved from 3.48 to This may reflect the maturation of this resort city. Like last year, Beijing and the other cities in the Bohai region, except for Dalian, were ranked at or near the bottom. Shijiazhuang was again ranked at the bottom. Its rating declined from 1.96 to Beijing s ranking moved up one notch to 31st, with a modest improvement in rating from 2.32 to When asked about the impact of air pollution and the low quality of life in Beijing on the local real estate market, a developer based in Beijing responded, Livability s impact on the real estate market is not as strong as people think. The market is still job driven. Nevertheless, the same developer noted that the areas south of Chang an Avenue the main east west corridor running through the center of the city suffer from worse air quality than the areas north of Chang an Avenue. As a result, a meaningful price gap exists between southern and northern areas, though other factors also play a role. Another developer in Beijing noted that having a huge residential community in the same neighborhood has been a key factor for the emergence of Wangjing as a key business district, especially with the presence of a large number of IT companies. She noted that the gap in rent between Wangjing and the CBD has narrowed substantially during the last few years. She pointed to the limited pool of residential units especially affordable ones as a key weakness for the CBD area. A developer with projects in Shijiazhuang defended the city s livability. She said that the government has recently relocated a number of polluting factories to outside the city center with more stringent requirements and that the cost of living there is substantially cheaper compared with Beijing s. So, in her view, Shijiazhuang is more livable than in the recent years. Overall, the livability rankings correlate with the city rankings based on air pollution. The only notable exception is Dongguan. As a coastal city next to Shenzhen, Dongguan s air quality is reasonably good; however, in terms of livability, it continued to rank near the bottom, at 30th. A financial professional cited safety as a key issue for Dongguan. 85
90 APPENDIX A Recent Regulatory Changes in the Chinese Real Estate Market 2015 Alex Wang, Cindy Pan, and Felix Xu Dentons he following is a summary of the key regulatory changes in the Chinese real estate market since last year s release of the Mainland China Real Estate Markets 2014: ULI Analysis of City Investment Prospects. Lifting of Home-Purchase Restrictions Beginning in 2011, many cities in China have set restrictions on home purchases to curb the overheated real estate market. Restrictions include limitations on the number of homes that individuals may purchase, residency requirements, and higher downpayment ratios. The nation s real estate market is currently characterized by high inventory and sloping prices. In response to the cooling property market, many cities have, either formally or informally, lifted home-purchase restrictions in the past year. For instance, in September 2014, the local government of Shenyang (the capital of northeast China s Liaoning province) removed home-purchase restrictions for local residents and a requirement that nonlocal residents provide proof of tax or social insurance payments in the city before buying a home. By the end of May 2015, 41 of the 46 cities that initially introduced restrictions on home purchases had essentially removed those restrictions. Only five cities (Beijing, Shanghai, Guangzhou, Shenzhen, and Sanya) still maintain control over local home purchases. It is expected that the lifting of home-purchase restrictions will, to some extent, increase the sale of residential properties. Eased Credit and Tax Policies The Chinese government loosened credit and tax policies in September 2014 and March 2015 to prop up the country s flagging housing market. On September 29, 2014, the People s Bank of China (PBOC) and the China Banking Regulatory Commission (CBRC) jointly released a circular, 1 pursuant to which purchasers who paid off their first-home mortgage loans could still be classified as first-home buyers and would be allowed to enjoy the 30 percent minimum downpayment. Previously, those home purchasers would generally be considered second-home buyers. Second-home buyers are required to pay a minimum 50 percent to 60 percent downpayment in most cities and a 70 percent downpayment in Beijing and Shanghai. Under this announcement, commercial banks are also allowed to offer a discount of up to 30 percent on the applicable benchmark rates for first-home mortgage loans. On March 30, 2015, PBOC, CBRC, and the Ministry of Housing and Urban-Rural Development jointly issued a circular, 2 according to which a family that has not paid off its first-home mortgage loan can purchase a second-home with a minimum downpayment 86
91 of 40 percent (a reduction from the original percent minimum downpayment required in most cities). On the same date as the joint circular, the Ministry of Finance and the State Administration of Taxation (SAT) released another circular 3 that reduced the minimum house holding period from five years to two years for (a) sellers of common houses to qualify for the business tax exemption and (b) sellers of noncommon houses to qualify for a business tax reduction based on the difference between the sale price and the original purchase price of the house. The housing markets, particularly those in Tier 1 cities such as Beijing and Shanghai, have already seen a boost in sales following the launch of these new policies. However, these measures are unlikely to provide much aid in reducing the high housing inventories in China s lesser-developed cities where demand is not nearly as strong. Unified Real Property Registration System On November 24, 2014, the State Council issued the Provisional Rules of Real Estate Registration, which took effect March 1, The rules are designed to establish a unified national registration system for various types of real property rights. These rights include, among other things, ownership rights to collectively owned lands, ownership rights to buildings and constructions, mortgage rights, easement rights, and construction-related land use rights. Accompanying the new registration system is a national network of real property registration information. This network will not only simplify the registration procedure, but will also facilitate the real-time disclosure of owners real property rights across the country to government regulators. The registration information, however, will not be made public without the consent of the relevant property owners. The information collected through this system is expected to help tax authorities levy new taxes on property owners (such as property taxes and inheritance taxes). This levy will likely cause individuals who own multiple real estate properties to dispose of a portion of those properties to avoid or mitigate their potential tax liabilities. Reform of Household Registration System On July 24, 2014, the Chinese government issued an opinion 4 that it would further reform the current household registration system that has hindered people from migrating from rural areas to urban centers. The goal of this reform is to urbanize 100 million rural Chinese residents by Although the government will maintain restrictions on migration to large cities, the reforms will lower entry barriers for migrants to lower-tier cities (cities with a population of less than 1 million). This will, in the long term, result in a stronger demand for residential properties in lower-tier cities. 87
92 Reduction of Benchmark Interest Rates PBOC has cut interest rates three times in the past six months. On November 11, 2014, PBOC cut the benchmark one-year loan rate by 40 basis points. This rate cut makes borrowing cheaper for businesses. As this is the first interest-rate cut since July 2012, it indicates that China s leadership is leaning toward implementing more measures to bolster the economy. PBOC also cut the benchmark interest rates by another 25 basis points two other times in PBOC cut banks reserve requirement ratio (RRR) by 50 basis points to 19.5 percent on February 5, This action represented the first RRR cut since May PBOC subsequently cut the RRR again, this time by 100 basis points, to 18.5 percent on April 19, These cuts have lowered the amount of deposits that each bank is required to hold as reserves. The loan interest rate and RRR cuts will, to some extent, benefit real estate developers and housing loan borrowers by reducing financing costs. New Tax Rule on Indirect Transfer of Properties in China On February 3, 2015, the SAT released the Announcement concerning Several Matters relating to Corporate Income Tax on Indirect Transfer of Properties by Non-tax Resident Enterprises (Announcement [2015] No. 7, Announcement 7 ), which took effect on February 3, Announcement 7 has largely replaced previous tax rules about the tax treatment on indirect transfers of equity interests in Chinese entities by offshore investors (previous rules were provided in the Circular on Strengthening the Administration of Corporate Income Tax on Non-tax Resident Enterprises Incomes from Equity Transfers issued by the SAT in 2009 (Circular [2009] No. 698, Circular 698 ). Announcement 7 also applies to transactions that occurred before February 3, 2015, but for which the relevant PRC tax has not yet been settled. Announcement 7 significantly changes the scope of indirect transfer transactions that are subject to PRC tax as well as the reporting and withholding obligations of the parties to an indirect transfer transaction. Announcement 7 indicates the Chinese government s increased scrutiny over offshore transactions that are structured to indirectly transfer PRC property or interests. Announcement 7 could possibly increase the PRC tax liabilities of foreign investors who plan to exit from their Chinese real property investments held in an offshore special purpose vehicle (SPV). These increased tax liabilities might arise upon sale of their equity interest in the SPV. Scope of Taxable Transactions Circular 698 applies to the indirect transfer of equity interests in PRC entities. However, Announcement 7 expands the scope of application to include indirect transfers of (a) properties of an establishment or site (which is similar to the concept of a permanent establishment ) in China, (b) real property in China, and (c) equity investments in PRC-resident enterprises (collectively, Taxable Properties). As such, 88
93 Announcement 7 captures not only share or other equity transfers provided under Circular 698, but also transfers of other forms of interest. Reasonable Commercial Purpose According to Announcement 7, an indirect transfer of Taxable Properties will be considered a direct transfer of the same and, therefore, will be subject to PRC taxes if, among other things, the transfer lacks a reasonable commercial purpose. Announcement 7 requires the competent tax authority to consider all of the relevant arrangements with respect to an indirect transfer of Taxable Properties when determining whether the transfer lacks a reasonable commercial purpose. Moreover, it specifically highlights a number of factors that should be comprehensively analyzed by the tax authorities. Reporting of Transactions Under Circular 698, the seller in an indirect transfer transaction has the obligation to submit a report of the transaction to the PRC tax authorities. According to Announcement 7, however, the reporting of an indirect transfer transaction is voluntary rather than mandatory, and such a report may be submitted by the buyer, the seller, or the underlying PRC subsidiary. Given the uncertainty as to the potential tax liabilities under Announcement 7, parties to a purchase and sale transaction (particularly the buyer) may now have stronger motivations to proceed with the voluntary reporting. Moreover, the voluntary reporting is also encouraged by the PRC tax authority according to the Work Procedures concerning the Corporate Income Tax on Indirect Transfer of Properties by Non-tax Resident Enterprises (for Trial Implementation), issued by SAT on May 13, 2015, for implementing the rules of Announcement 7. Statutory Withholding Obligation Circular 698 does not specifically require the buyer to withhold any taxes payable by the seller during an indirect transfer transaction. Announcement 7, however, requires the buyer to withhold the applicable taxes payable by the seller in connection with an indirect transfer of Taxable Properties and to pay the withheld amount to the competent PRC tax authority. If the buyer fails to withhold the applicable taxes payable by the seller, the seller should report the transaction to the PRC tax authorities and pay the taxes (if applicable) within seven days following the date that the relevant equity transfer agreement takes effect and the equity transfer is completed. If the seller fails to pay the taxes in full within the seven-day period, the seller will be required to pay the relevant late payment interest. That interest will be calculated daily (a) at the benchmark rate published by PBOC if the seller has reported the transaction to the PRC tax authority within 30 days after the execution date of the relevant transaction document or (b) at the benchmark rate plus 5 percent if the seller does not report the transaction within the 30-day period. 89
94 If the buyer fails to withhold and the seller fails to pay the applicable PRC taxes for an indirect transfer of Taxable Properties, then the PRC tax authorities may penalize the buyer. These penalties generally range from 50 percent to 300 percent of the unpaid taxes. Outbound Investment Since 2014, Chinese regulators have made efforts to relax the outbound investment regime, with the aim to encourage the outflow of onshore capital to appropriate investment opportunities in foreign jurisdictions. The recent changes in the outbound investment regulations will provide domestic investors a more efficient channel to pursue outbound real estate investments. NDRC Rules In April and December 2014, the National Development and Reform Commission (NDRC) issued a set of rules 5 (collectively, the NDRC Rules) on outbound investment. The NDRC Rules require that outbound investment projects only be filed with (instead of being approved by) the NDRC or its provincial counterpart. There are two significant exceptions to this relaxed filing requirement. First, projects that involve sensitive countries/regions 6 or sensitive industries 7 are still subject to an approval by NDRC. Second, projects that involve sensitive countries/regions or sensitive industries and Exhibit A-1 NDRC Approval/Filing Requirements for Outbound Investment Projects Filing with NDRC at provincial level Projects of centrally administered enterprises N/A Projects of local enterprises Not involving sensitive countries/regions or sensitive industries Investment amount by the Chinese party(ies) < US$300 million Filing with NDRC at central level Not involving sensitive countries/regions or sensitive industries Not involving sensitive countries/regions or sensitive industries Investment amount by the Chinese party(ies) US$300 million Approval by NDRC at central level Involving sensitive countries/regions or sensitive industries Involving sensitive countries/regions or sensitive industries Approval by the State Council Involving sensitive countries/regions or sensitive industries Investment amount by the Chinese party(ies) US$2 billion Involving sensitive countries/regions or sensitive industries Investment amount by the Chinese party(ies) US$2 billion Note: N/A = not applicable; NDRC = National Development and Reform Commission. 90
95 Exhibit A-2 MOFCOM Approval/Filing Requirements for Outbound Investment Projects Filing with MOFCOM at provincial level Filing with MOFCOM at central level Approval by MOFCOM at central level Projects of centrally administered enterprises N/A Not involving sensitive countries/regions or sensitive industries Involving sensitive countries/regions or sensitive industries Applications should be submitted directly to MOFCOM. Projects of local enterprises Not involving sensitive countries/regions or sensitive industries N/A Involving sensitive countries/regions or sensitive industries Applications should be submitted to MOFCOM through its relevant provincial counterpart. Note: MOFCOM = Ministry of Commerce; N/A = not applicable. also have a total investment by Chinese parties of at least US$2 billion are escalated to the State Council for approval. The following table summarizes the requirements with respect to the filing or approval of outbound investment projects under the NDRC Rules. The MOFCOM Rule Following the NDRC s regulatory changes, the Ministry of Commerce (MOFCOM) amended the Administrative Measures for Outbound Investments (the MOFCOM Rule) on September 6, 2014, which took effect October 6, Similar to the NDRC Rules, the MOFCOM Rule has limited MOFCOM s approval authority for outbound investment projects to only those involving sensitive countries/regions 8 or sensitive industries 9 as defined under the MOFCOM Rule (which has slightly different criteria from the corresponding terms in the NDRC Rules). Outbound investment projects that do not involve sensitive countries/regions or sensitive industries now only require filing with MOFCOM at the central or provincial level. These investment projects are differentiated by the enterprise category of the applicant and are categorized independently of the total amount of investment of the project. The following table summarizes the requirements regarding the filing or approval of outbound investment projects under the MOFCOM Rule. The SAFE Rule The State Administration of Foreign Exchange (SAFE) issued a circular 10 (the SAFE Rule) on February 13, This circular repeals SAFE s approval authority in relation to the foreign exchange registration for outbound direct investments and authorizes domestic banks to deal with these registration formalities. 91
96 According to the SAFE Rule, domestic investors can now directly apply with their banks to process the foreign exchange registration for their outbound direct investment projects, after they complete the relevant NDRC and MOFCOM approval or filing procedures for those projects. The domestic investors will be able to do so without having to obtain an approval from SAFE. FTZ Rules In April 2015, the State Council approved establishing three pilot free trade zones (each an FTZ) in Guangdong, Fujian, and Tianjin. These new FTZs are in addition to the existing FTZ in Shanghai. The local governments in the three new FTZs are expected to form a set of outbound investment regulations similar to those applied in the Shanghai FTZ. These regulations likely will designate a unified government body to administrate the filing of outbound investment projects for enterprises incorporated in each FTZ. That government body will have the authority delegated by the provincial counterpart of the NDRC and MOFCOM in its respective jurisdiction. The local regulations for outbound investments in the FTZs will expedite the way domestic investors engage in outbound real estate investments. Common Structures for Outbound Real Estate Investments U.S. Example Reports indicate that Chinese investments in overseas real estate increased by 46 percent to a record $16.5 billion in This increase is a result of both China s slumping domestic property market and regulatory reforms that encourage domestic investors to seek cross-border deals. The United States is one of the most popular countries for Chinese outbound investment. A brief summary of common structures used by Chinese investors to make their outbound real estate investments in the United States is set out below. Note that the structures described are for reference only. Investors should seek advice from their legal and tax advisers to determine the appropriate structure for a specific outbound real estate investment project. The choice or design of the structure will vary depending on the details of the project (e.g., the destination jurisdiction, the type of target property, the sources of income from the project, whether a local partner can be found, the exit plan of the investment, etc.). (A) Direct Investment Structure (1) Description of the Structure Under the direct investment structure, the PRC domestic investor (PRC Investor) will generally take the following steps: The PRC Investor will establish a PRC domestic subsidiary (PRC SPV) in the form of a limited liability company (LLC). 92
97 The PRC SPV will establish a U.S. project company (solely or together with a U.S. local partner) in the form of a U.S. LLC that will elect to be treated as a tax pass-through entity for U.S. federal tax purposes (U.S. Project Company). The U.S. Project Company will directly or indirectly hold and operate the target property. (2) Tax Implications (i) Operational Taxes The U.S. Project Company is not subject to U.S. corporate income tax as a tax pass-through entity. The PRC SPV is subject to: The U.S. corporate income tax at federal (up to 35 percent), state, and local levels based on its distributive share of the U.S. Project Company s net income (allowing deductions at the level of the U.S. Project Company, including interest expenses, if any). The PRC SPV is subject to these taxes even if the income is not distributed. The U.S. withholding tax (at a preferential rate of 10 percent under the Sino- U.S. tax treaty) for interest on the loan provided by the PRC SPV to the U.S. Project Company (if any). The PRC corporate income tax (25 percent) for the income from offshore investments. (ii) Exit Taxes Sale of Equity in U.S. Project Company: The PRC SPV will be subject to a FIRPTA 11 tax of up to 35 percent. Ten percent of the sale proceeds will be withheld by the buyer to secure the collection of the FIRPTA tax. Liquidation of U.S. Project Company: The PRC SPV will not be subject to U.S. taxes provided that the U.S. Project Company no longer holds any U.S. real property interest, or USRPI. (B) Indirect Investment Structure (1) Description of the Structure Under the indirect investment structure, the PRC Investor will generally take the following steps: The PRC Investor will establish a PRC SPV. The PRC SPV will establish an offshore SPV in Hong Kong, the Cayman Islands, or the British Virgin Islands (the Foreign Blocker). 93
98 The Foreign Blocker will establish a corporation or an LLC in the United States that elects to be treated as a corporation for U.S. federal tax purposes (the U.S Blocker). The U.S. Blocker will be financed with a combination of debt and equity at a ratio of 1.5 debt to 1.0 equity. The U.S. Blocker establishes the U.S. Project Company (solely or together with a U.S. local partner). The U.S. Project Company directly or indirectly holds and operates the target property. (2) Tax Implications (i) Operational Taxes The U.S. Project Company is not subject to U.S. corporate income tax as a tax pass-through entity. The U.S. Blocker is subject to U.S. corporate income tax on its net income at federal (up to 35 percent), state, and local levels and may take deductions for interest payments on its debt funding, subject to U.S. anti-earnings stripping and transfer pricing rules. The Foreign Blocker is subject to the U.S. withholding tax (30 percent) on interest and dividends paid by the U.S. Blocker to the Foreign Blocker. The PRC SPV is not subject to withholding tax on dividends paid by the Foreign Blocker to the PRC SPV in the incorporation jurisdiction of Foreign Blocker. The PRC SPV s income is subject to PRC corporate income tax (25 percent). (ii) Exit Taxes Sale of Equity in U.S. Blocker: The Foreign Blocker will be subject to a FIRPTA tax of up to 35 percent. Ten percent of the sale proceeds will be withheld by the buyer to secure the collection of FIRPTA tax. Sale of Equity in Foreign Blocker: The PRC SPV will not be subject to U.S. taxes. The PRC SPV will be subject to PRC corporate income tax (25 percent). The PRC SPV may be subject to a stamp duty tax (if the Foreign Blocker is incorporated in Hong Kong). 94
99 Notes 1. The Circular of the People s Bank of China and the China Banking Regulatory Commission on Further Improving Financial Services for Housing Consumption. 2. The "Circular of the People s Bank of China, the Ministry of Housing and Urban-Rural Development and the China Banking Regulatory Commission on Issues concerning Individual Housing Loan Policies." 3. The "Circular on Adjusting Policies of Business Tax on Individual Transfer of Houses." 4. The "Opinions of the State Council on Further Promoting the Reform of the Household Registration System." 5. The Administrative Measures on the Approval, and Filing of Outbound Investment Projects was issued by NDRC on April 8, 2014, and became effective on May 8, NDRC issued an amendment to those measures on December 27, Under the NDRC Rules, the term sensitive countries/regions refers to the countries or regions that (a) have not established a diplomatic relation with the PRC, (b) are sanctioned by the international community, or (c) are under war or civil commotion. 7. Under the NDRC Rules, the term sensitive industries includes the following industries: (a) basic telecommunication operation, (b) cross-border development and use of water resources, (c) large-scale land development, (d) main electricity transmission lines and grids, and (e) news media. 8. Under the MOFCOM Rule, the term sensitive countries/regions refers to the countries or regions that (a) have not established a diplomatic relation with the PRC, (b) are sanctioned by the United Nations, or (c) other countries or regions as determined by MOFCOM. 9. Under the MOFCOM Rule, the term sensitive industries refers to the industries that (a) involve products or technologies restricted by the Chinese government from being exported or (b) have impact on the interest of more than one country or region. 10. The Circular on Further Simplifying and Improving the Foreign Exchange Administrative Policies for Direct Investments was issued by SAFE on February 13, 2015, and took effect June 1, The Foreign Investment in Real Property Tax Act of
100 APPENDIX B B2V Reform of the Real Estate and Construction Sectors Is Just around the Corner Alan Wu, Robert Li, and Michael Ma PwC China In Brief At the press conference for the third session of the 12th National People s Congress (NPC) held on 6 March 2015, the Minister of Finance, Mr. Lou Jiwei, mentioned that the Business Tax (BT) to Value Added Tax (VAT) Reform (the B2V reform ) should be completed within this year in accordance with the plan. In other words, indirect tax for the consumer services, financial services, real estate, and construction sectors will all be converted from BT to VAT, among which the most difficult one is the conversion of immovable properties from BT to VAT. As the pillar of China s economy, the B2V reform of the real estate and construction sectors will have widespread impacts. These sectors will face various challenges including business arrangements, accounting treatments, upstream and downstream administration, system improvement, etc. As such, real estate and construction enterprises should prepare themselves for the upcoming VAT era. In Detail Key Issues in the B2V Reform for the Real Estate and Construction Sectors In light of slow economic growth in China since 2014, the overall real estate market is in a wait-and-see mode. 1 Given the current troubled situation of the real estate sector, market players suggest that the impact of the B2V reform on the development of the industry should be considered on formulating the relevant policies and a prudent approach should be taken. B2V reform of the real estate sector is around the corner. Real estate enterprises need to consider the following key issues: VAT invoices cannot be obtained for some costs or the claiming of input VAT credit for some costs with VAT invoices can be limited. Besides land, the major costs of real estate are raw materials (e.g., brick, lime, sandstone, and earthwork, etc.) and labour force. Many suppliers of these raw materials are individuals, individual business owners, and small-scale VAT taxpayers, who do not issue VAT invoices or have difficulties in issuing VAT invoices. These suppliers are small but numerous, it would increase the difficulty in obtaining the VAT invoices from them. In addition, the competence level of employees in the procurement and finance departments of real estate enterprises in different projects are various; this would also increase the difficulty in managing and controlling the collection of such VAT invoices. There is also the challenge that the input VAT invoices have to be verified within 180 days 2 upon issuance. Projects already under construction and for sale could be heavily impacted by the B2V reform. Where a project is completed but the sale of the project units is still ongoing, if B2V reform is implemented in the real estate sector and the applicable 96
101 tax rate is increased, it would be impossible to get input VAT invoices for credit claim as most of the costs have already been incurred. Meanwhile, the presale and sale contracts have probably been signed, and it would be difficult for the real estate enterprise to pass the additional tax cost to the customers if they cannot amend the contracts. Therefore, if no appropriate transitional rules are in place, the income and profits from such kinds of projects would decline significantly. The prominent features of the real estate sector are long lifecycle and mismatch of the income and costs cycle. This could result in a timing mismatch between output VAT and input VAT when the B2V reform is implemented. Under China s VAT regime, where the input VAT exceeds the output VAT on the filing of the monthly VAT return, the excess input VAT credit generally has to be carried forward and utilised in the future filing periods and no cash refund is available. After the B2V reform, for real estate enterprises which adopt a presale model, the input VAT incurred during the construction period may not be credited against any output VAT and thus becomes sunk cost if the instalment sales proceeds received (output VAT) are ahead of the construction costs (input VAT). For real estate enterprises which start the sales only after the construction is completed, or lease out the developed property, a substantial portion of the input VAT incurred on the construction cost can only be utilised during the sales period or leasing period, which not only impacts cash flow but also increases the investment cost of the project. The construction sector and real estate sector are closely linked to each other. The main problems faced by the construction sector include difficulties in getting VAT invoices for raw materials and labour costs for claiming input credit; VAT treatments for cross-period contracts; whether the additional tax burden caused by the B2V reform can be passed on; whether materials purchased prior to the B2V reform but used afterwards are allowed to be credited against the output VAT; filing location for business operated outside the city of the construction enterprise; whether the output VAT is determined based on the progress of the project, etc. In addition, for construction enterprises going abroad, they should pay special attention to whether any VAT preferential treatments are available for overseas construction projects. Challenges to the Internal Control System of Real Estate and Construction Enterprises In addition to the above issues, the B2V reform will bring different challenges to real estate and construction enterprises, including: Increased difficulty in keeping books and records, and additional cost of tax compliance. The compliance requirement under the VAT regime is more rigorous as compared to that under the BT regime, and the relevant finance and tax information systems are faced with challenges of upgrading. It is suggested that the relevant personnel be accustomed to the BT to VAT transition as soon as possible. In addition, the B2V reform imposes a higher requirement on the other departments as well (e.g., collection of the input VAT invoices, etc.). 97
102 Impact on business operation and procedures. Enterprises may need to modify their current business models to fit into the tax policies under the B2V reform. Categorisation and administration of suppliers and clients. After the B2V reform, whether suppliers can issue VAT special invoices or whether clients are willing to accept the additional tax burden passed onto them will, to a large extent, impact the income, profit, tax burden, and cash flow of the enterprise. How to Deal with the Changes For real estate and construction enterprises, which are about to join the B2V reform, management should be mindful of the potential challenges, perform an advance study, and formulate strategies to deal with the B2V reform. In order to smoothly transit from BT to VAT, enterprises can consider taking the following three-phase approach so as to improve the tax administration systems, to mitigate the potential tax risks and the indirect tax burden. Phase I: Before the Release of the Reform Policy Enterprises should start out by reviewing their business models, sorting out the existing purchase and sales contracts, considering possible accounting changes, organising a specialised tax panel to lead the transition, providing training and update of the new policies to all departments on a regular basis, assessing the potential impact on tax and profits under the B2V reform, considering possible adjustments to the pricing strategy, modifying contract templates, formulating an internal control system on invoice management including control of invoices and procedures and time frame for forwarding the invoices to the finance department, etc., making a plan for system upgrade, etc. At the same time, keep close communication with the industry association and in-charge tax authority so that requests and queries could be raised at an earlier stage. Phase II: Short Transitional Period between the Release of the Reform Policy and Implementation Enterprises should commence implementing the transformation of the existing business procedures and system, conclude new contracts with suppliers and customers, purchase and set up tax invoice control system, get familiar with invoice-related procedures such as application, issuance, authentication, and invalidation as well as the VAT filing procedures. They should also assess whether they are eligible for any VAT preferential treatments and financial subsidy and prepare for the relevant application. Phase III: Implementation of the Reform Policy Enterprises should pay close attention to any update and development of the B2V reform policies, evaluate the implementation of internal system, accounting treatments, and internal control in order to timely identify and avoid any significant risks. Based on the experience of the B2V reform from the other sectors, implementation rules for the reform policy may need to be further clarified after the implementation of the reform policy, and the practices of the local-level tax bureaus may vary. In that respect, enter- 98
103 prises need to carefully study the B2V policies and take relevant actions to eliminate the uncertainties. The Takeaway Following the launch of the pilot program in Shanghai in 2012, the B2V reform has gone through a number of expansions. During the past two years, while the B2V reform has reduced the tax burden of a large number of enterprises in those sectors which are under the B2V reform, certain enterprises have to face increased tax burden, declined profit, and diminishing operational capability. The key issues are that these enterprises did not pay enough attention and prepare for the B2V reform in advance. As a result, they were overly occupied with the onerous VAT compliance requirements in a short period of time and had no time to attend to the business operation and procedures, pricing negotiation with suppliers and clients, etc., not to say how to achieve tax efficiency under the B2V reform. It is recommended that real estate and construction enterprises should keep a close eye on the development of B2V reform policies and proactively prepare themselves to face the potential impact brought out by the B2V reform: Enterprises should pay attention and proactively carry out an overall impact study, including a sensitivity analysis on the potential impact to income, profits, tax burden, and cash flow, etc. The assessment can be based on the currently available information on the possible B2V reform policies, together with the enterprise s own business models, components of income and cost and supplier and customer relationship, etc. Based on the result of the impact study, enterprises can consider modifying their business model, sorting out their suppliers and customers and adjusting the pricing strategies so as to minimise the negative impacts. For issues which are common to the industries and which the enterprise cannot resolve by itself, e.g., credit for land cost, mismatch between the output VAT and the input VAT, enterprises can collaborate with other enterprises and industry associations to reflect these issues to the relevant governmental departments so that policy makers will better understand the specifics of the real estate and construction sectors and take them into account when formulating the relevant tax policies. Enterprises should improve their tax administration, enhance tax risk control, in particular strengthening the administration of VAT special invoices. At the same time they need to provide further training to personnel in finance, tax, and other relevant departments. Finance personnel of the enterprises should reinforce the administration of subcontractors and other suppliers, and be fully aware of the types of input VAT invoices that could not be credited, etc. 99
104 Reprinted with the permission of PricewaterhouseCoopers Consultants (Shenzhen) Ltd., a PRC incorporated entity PricewaterhouseCoopers Consultants (Shenzhen) Ltd. All rights reserved. The information in this article, which was assembled on April 13, 2015, and based on the laws enforceable and information available at that time, is of a general nature only, and readers should obtain advice specific to their circumstances from their professional advisers. Notes 1. According to latest statistics of China s National Bureau, commercial housing sales dropped by 7.6 percent as measured by sales area, and 6.3 percent as measured by gross sales amount in 2014, compared to the previous year. 2. According to article one of Notice Issued by the SAT Extending the Deadline for Claiming Input VAT Credit (Guoshuihan [2009] No. 617), in respect of VAT special invoices, uniform invoices of road and river cargo transportation and uniform invoices of sales of motor vehicles issued after January 1, 2010, the obtaining VAT general taxpayer shall go through formalities of invoice certification with the tax authority within 180 days after the issuing day of such invoices, and shall declare for input tax deduction with the competent tax authority within the following month after the certification is passed. 100

105 HUITU Beijing Zhongguancun.
Mainland China Real Estate Markets 2014 ULI Analysis of City Investment Prospects
 Mainland China Real Estate Markets 2014 ULI Analysis of City Investment Prospects Kenneth Rhee Chief Representative, Mainland China, for the Urban Land Institute July 9, 2014 Agenda for discussion 1. Geographic
Briefing Office sector August 2015
 Savills World Research Xi'an Briefing Office sector August 2015 SUMMARY Image: Xi an Center, High-tech Zone, Xi an The Xi an Grade A office market is currently going through a period of upgrade, with an
Keppel Land in China. May 2006
 1 Keppel Land in China May 2006 Presentation Outline Introduction Market Update City Updates Shanghai Tianjin Beijing Wuxi Chengdu Residential Township Development 2 3 Introduction KLL s Steps in China
Press Release. Commercial Real Estate - Digital Opportunities in a Shifting Industry
 Commercial Real Estate - Digital Opportunities in a Shifting Industry Technology is poisoned to bring change to the Philippine real estate industry. Access to data for business decision making is one aspect
SHANGHAI GRADE A OFFICE MARKET UPDATE Q3 2018
 COLLIERS QUARTERLY Peng Jiang Senior Manager Research East China +86 21 6141 355 Peng.Jiang@colliers.com OFFICE SHANGHAI Q3 218 2 OCTOBER 218 SHANGHAI GRADE A OFFICE MARKET UPDATE Q3 218 Summary & Recommendations
INTRODUCTION AND HIGHLIGHTS FINANCIAL REVIEW BUSINESS REVIEW
 COVER 1 AGENDA INTRODUCTION AND HIGHLIGHTS FINANCIAL REVIEW BUSINESS REVIEW Highlights Financial Review Business Review http://www.crland.com.hk/ CR Land Results 2016 2 INTRODUCTION AND HIGHLIGHTS Highlights
Briefing Residential leasing August 2017
 Savills World Research Shanghai Briefing Residential leasing August 2017 SUMMARY Image: Stanford Residences Xu Hui Strata-title apartment rents increased 3.3% in /2017 to RMB187 per sq m per month, as
THE REAL ESTATE BOARD OF NEW YORK REAL ESTATE BROKER CONFIDENCE INDEX THIRD QUARTER 2016
 THE REAL ESTATE BOARD OF NEW YORK REAL ESTATE BROKER CONFIDENCE INDEX THIRD QUARTER 2016 EXECUTIVE SUMMARY REAL ESTATE BROKER CONFIDENCE INDEX THIRD QUARTER 2016 The Real Estate Board of New York s (REBNY)
Fantasia Holdings Group Announces 2010 Interim Results
 Fantasia Holdings Group Announces 2010 Interim Results Urban complexes fuel sales growth Total revenue and net profit increase 42.8% and 74.5% respectively In the first half of 2010, total sales and net
Total building purchasing activity by sector (US$mn) Q Q Q Q3 2013
 Q Q Q Q3 2013") MARKETBEAT Investment Snapshot China 2016 17 May 2016 Contents Building transactions 2 Land transactions 3 Source of capital 5 Transactions between foreign entities 5 Outlook 5 Following a record-breaking,
MARKETBEAT Investment Snapshot China 2016 17 May 2016 Contents Building transactions 2 Land transactions 3 Source of capital 5 Transactions between foreign entities 5 Outlook 5 Following a record-breaking,
STABLE OCCUPANCY DESPITE RAMPED UP SUPPLY
 COLLIERS QUARTERLY RESIDENTIAL MANILA Q3 2018 20 NOVEMBER 2018 Joey Roi Bondoc Manager Research Philippines +(632) 858 9057 Joey.Bondoc@colliers.com STABLE OCCUPANCY DESPITE RAMPED UP SUPPLY Summary &
THE ANNUAL SPRING REAL
 The Great Housing Price Showdown Last January China s central government finally introduced measures strong enough to slow housing price increases. Speculators, developers, local governments and simple
Linkages Between Chinese and Indian Economies and American Real Estate Markets
 Linkages Between Chinese and Indian Economies and American Real Estate Markets Like everything else, the real estate market is affected by global forces. ANTHONY DOWNS IN THE 2004 presidential campaign,
INLAND EMPIRE REGIONAL INTELLIGENCE REPORT. School of Business. April 2018
 INLAND EMPIRE REGIONAL INTELLIGENCE REPORT April 2018 Key economic indicators suggest that the Inland Empire s economy will continue to expand throughout the rest of 2018, building upon its recent growth.
ECONOMIC CURRENTS. Vol. 5 Issue 2 SOUTH FLORIDA ECONOMIC QUARTERLY. Key Findings, 2 nd Quarter, 2015
 ECONOMIC CURRENTS THE Introduction SOUTH FLORIDA ECONOMIC QUARTERLY Economic Currents provides an overview of the South Florida regional economy. The report presents current employment, economic and real
Company Newsletter(August 2017)
") Company Newsletter(August 2017) Stock ( September 8th, 2017): > Contracted Sales Closing Price : 52-week High/Low : Market Cap : 3.95 HK$ 2.11-4.19 HK$ 15,789 million HK$ No. of Issued Shares : 3,997 million
Company Newsletter(August 2017) Stock ( September 8th, 2017): > Contracted Sales Closing Price : 52-week High/Low : Market Cap : 3.95 HK$ 2.11-4.19 HK$ 15,789 million HK$ No. of Issued Shares : 3,997 million
Real Estate Trends in Central Ohio
 Real Estate Trends in Central Ohio Presentation by Jung Kim December 3, 2015 The National Picture: Highlights from ULI s Emerging Trends in Real Estate Prospects by real estate industry Abysmal Fair Excellent
REAL ESTATE SENTIMENT INDEX 2 nd Quarter 2018
 About Real Estate Sentiment Index (RESI) The Real Estate Sentiment Index (RESI) is jointly developed by the Real Estate Developers Association of Singapore (REDAS) and the Department of Real Estate (DRE),
3 November rd QUARTER FNB SEGMENT HOUSE PRICE REVIEW. Affordability of housing
 3 November 2011 3 rd QUARTER FNB SEGMENT HOUSE PRICE REVIEW JOHN LOOS: HOUSEHOLD AND PROPERTY SECTOR STRATEGIST 011-6490125 John.loos@fnb.co.za EWALD KELLERMAN: PROPERTY MARKET ANALYST 011-6320021 ekellerman@fnb.co.za
CHINA AND HONG KONG RESIDENTIAL MARKETS. by Knight Frank and Holdways 10 December 2014
 CHINA AND HONG KONG RESIDENTIAL MARKETS by Knight Frank and Holdways 10 December 2014 CHINA S ECONOMY, POLICIES AND IMPACT ON DEVELOPERS Presented by Helen Liu General Manager, Beijing Holdways Information
Sekisui House, Ltd. < Presentation >
 Sekisui House, Ltd. Transcript for Earnings Results Briefing for the Second Quarter of FY2018 (Telephone Conference) Date: Participants: September 6 th, 2018, Thursday 17:00 18:00 JPT Shiro Inagaki, Representative
2013 Arizona Housing Market Mid-Year Report
 2013 Arizona Housing Market Mid-Year Report This mid-year market report outlines the latest trends in Arizona real estate. The housing market hit bottom in mid to late 2011, and has been in recovery mode
Summary. Houston. Dallas. The Take Away
 Page Summary The Take Away The first quarter of 2017 was marked by continued optimism through multiple Texas metros as job growth remained positive and any negatives associated with declining oil prices
Has The Office Market Reached A Peak? Vacancy. Rental Rate. Net Absorption. Construction. *Projected $3.65 $3.50 $3.35 $3.20 $3.05 $2.90 $2.
 Research & Forecast Report OAKLAND METROPOLITAN AREA OFFICE Q1 Has The Office Market Reached A Peak? > > Vacancy remained low at 5. > > Net Absorption was positive 8,399 in the first quarter > > Gross
Grade A Office Demand Moderated but Market Remained Stable
 BEIJING Grade A Office Demand Moderated but Market Remained Stable Beijing s GDP grew by 6.9% YOY in Q1 2016, on par with 2015, according to the Beijing Statistics Bureau. The tertiary industry growth
CHANGSHA: CONSTRUCTION CENTRAL
 CHANGSHA: CONSTRUCTION CENTRAL CHANGHSA: BASIC INFORMATION World Similar Rank To Urban Area Population (2010) 2,750,000 128 Taiyuan, Rome, Dakar Projection (2025) 3,725,000 123 Berlin, Seattle, Melbourne
Soaring Demand Drives US Industrial Market to New Heights
 Soaring Demand Drives US Industrial Market to New Heights Capitas (DIFC) Limited I June Issue: 2017 THIS ISSUE COVERS: The Amazon Factor a seismic shift in the way people shop Industrial real estate hitting
iproperty Hong Kong proudly announces partnership with Shenzhen Zunhao, Guangzhou Daily and China Post
 iproperty Hong Kong proudly announces partnership with Shenzhen Zunhao, Guangzhou Daily and China Post Powerful Media Network and Innovative Marketing Solutions Facilitate Developers Step into China Market
Homestretch: Office Market Set to Finish Strong
 Research & Forecast Report RENO OFFICE Q3 2016 Homestretch: Office Market Set to Finish Strong >> Vacancy drops significantly the largest drop quarter over quarter in 2016 >> Rental rates are not increasing
CONSUMER CONFIDENCE AND REAL ESTATE MARKET PERFORMANCE GO HAND-IN-HAND
 CONSUMER CONFIDENCE AND REAL ESTATE MARKET PERFORMANCE GO HAND-IN-HAND The job market, mortgage interest rates and the migration balance are often considered to be the main determinants of real estate
Office Market Continues to Improve
 Research & Forecast Report LAS VEGAS OFFICE Q3 2016 Office Market Continues to Improve > > Southern Nevada s office market is improving at a steady rate > > Net absorption has been positive in twelve of
BRIC Spotlight Report
 China Real Estate: A Boom or a Bubble? April 2010 BRIC Spotlight Report Fast Facts W hile 2009 saw a global meltdown in property markets worldwide, the real estate sector in the Asian dragon painted an
YANLORD 2Q 2015 REVENUE SURGES 55.1% TO RMB2.340 BILLION; RECOGNITION OF PRE-SALES TO DRIVE FY 2015 PERFORMANCE
 Yanlord Land Group Limited PRESS RELEASE 2Q and 1H 2015 Financial Results YANLORD 2Q 2015 REVENUE SURGES 55.1% TO RMB2.340 BILLION; RECOGNITION OF PRE-SALES TO DRIVE FY 2015 PERFORMANCE Buoyed by positive
Las Vegas Valley Executive Summary
 ARROYO MARKET SQUARE Las Vegas Valley Executive Summary Retail Market 4th Quarter 2013 THE DISTRICT AT GREEN VALLEY RANCH January 23, 2014 Re: Commercial Real Estate Survey: 4th Quarter, 2013 Dear Reader,
NAB COMMERCIAL PROPERTY SURVEY Q4 2017
 EMBARGOED UNTIL 11.30 AM WEDNESDAY 21 FEBRUARY 2018 NAB COMMERCIAL PROPERTY SURVEY Q4 2017 Date February 2018 NAB Behavioural & Industry Economics KEY FINDINGS The NAB Commercial Property Index (a measure
Discussion: Understanding the Real Estate Market in China
 Discussion: Understanding the Real Estate Market in China Anna Wong Federal Reserve Board of Governors HKMA/PBoC/DRC Conference: China s Real Estate Market and Implications and Economic and Financial Stability
THE REAL ESTATE BOARD OF NEW YORK REAL ESTATE BROKER CONFIDENCE INDEX THIRD QUARTER 2014
 THE REAL ESTATE BOARD OF NEW YORK REAL ESTATE BROKER CONFIDENCE INDEX THIRD QUARTER 2014 EXECUTIVE SUMMARY REAL ESTATE BROKER CONFIDENCE INDEX THIRD QUARTER 2014 The Real Estate Board of New York s Real
Americas Office Trends Report
 AMERICAS OFFICE TRENDS REPORT Americas Office Trends Report Summary The overall national office market recovery slowed slightly in the first quarter of 2016 amid financial market volatility. However, as
ARLA Members Survey of the Private Rented Sector
 Prepared for The Association of Residential Letting Agents ARLA Members Survey of the Private Rented Sector Second Quarter 2014 Prepared by: O M Carey Jones 5 Henshaw Lane Yeadon Leeds LS19 7RW June, 2014
Büromarktüberblick. Market Overview. Big 7 3rd quarter
 Büromarktüberblick Office Market Overview Big 7 3rd quarter Deutschland Gesamtjahr 2017 2016 Erschieneninim Published October April 2017 2017 Will the office lettings market achieve a new record volume?
The Coldwell Banker Carlson Real Estate Market Report
 The Coldwell Banker Carlson Real Estate Market Report 2017 Year-End Stowe Area Report Our 2017 Year-End Market Report uses market-wide data, based on transactions that closed in 2017 in the Multiple Listing
The Industrial Market Cooled Off in Q1
 Research & Forecast Report Long Island industrial MARKET Q1 2016 The Industrial Market Cooled Off in Q1 Rose Liu Director of Finance & Research Long Island Takeaways > > Long Island industrial market slowed
Failed Land Sales in China Weakening Land Market Shows Rising Risks to China s Economy
 Orient Capital Research October 9, 214 Orient Capital Research Andrew Collier Hong Kong 852-953-4348 andrew@collierchina.com Shiyi Zhou, Analyst, Shanghai Failed Land Sales in China Weakening Land Market
Nothing Draws a Crowd Like a Crowd: The Outlook for Home Sales
 APRIL 2018 Nothing Draws a Crowd Like a Crowd: The Outlook for Home Sales The U.S. economy posted strong growth with fourth quarter 2017 Real Gross Domestic Product (real GDP) growth revised upwards to
New affordable housing production hits record low in 2014
 1 Falling Further Behind: Housing Production in the Twin Cities Region December 2015 Key findings Only a small percentage of added housing units were affordable to households with low and moderate incomes.
ARLA Members Survey of the Private Rented Sector
 Prepared for The Association of Residential Letting Agents & the ARLA Group of Buy to Let Mortgage Lenders ARLA Members Survey of the Private Rented Sector Fourth Quarter 2010 Prepared by: O M Carey Jones
ECONOMIC CURRENTS. Vol. 4, Issue 3. THE Introduction SOUTH FLORIDA ECONOMIC QUARTERLY
 ECONOMIC CURRENTS THE Introduction SOUTH FLORIDA ECONOMIC QUARTERLY Vol. 4, Issue 3 Economic Currents provides an overview of the South Florida regional economy. The report presents current employment,
Construction Investment Cools In Lead Up To General Election
 Phnom Penh, Q2 218 Construction Investment Cools In Lead Up To General Election Average High-end Condominium Price $3,211/SQM Prime Condominium Rent $14.3/SQM Prime Office Rent $25.5/SQM Prime Retail Mall
REGIONAL. Rental Housing in San Joaquin County
 Lodi 12 EBERHARDT SCHOOL OF BUSINESS Business Forecasting Center in partnership with San Joaquin Council of Governments 99 26 5 205 Tracy 4 Lathrop Stockton 120 Manteca Ripon Escalon REGIONAL analyst april
6 April 2018 KEY POINTS
 6 April 2018 MARKET ANALYTICS AND SCENARIO FORECASTING UNIT JOHN LOOS: HOUSEHOLD AND PROPERTY SECTOR STRATEGIST 087-328 0151 john.loos@fnb.co.za THULANI LUVUNO: STATISTICIAN 087-730 2254 thulani.luvuno@fnb.co.za
REAL ESTATE SENTIMENT INDEX 1 st Quarter 2016
 About Real Estate Sentiment Index (RESI) The Real Estate Sentiment Index (RESI) is jointly developed by the Real Estate Developers Association of Singapore (REDAS) and the Department of Real Estate (DRE),
Economy. Denmark Market Report Q Weak economic growth. Annual real GDP growth
 Denmark Market Report Q 1 Economy Weak economic growth In 13, the economic growth in Denmark ended with a modest growth of. % after a weak fourth quarter with a decrease in the activity. So Denmark is
Myth Busting: The Truth About Multifamily Renters
 Myth Busting: The Truth About Multifamily Renters Multifamily Economics and Market Research With more and more Millennials entering the workforce and forming households, as well as foreclosed homeowners
Seattle Housing Market Overview January 2019
 Seattle Housing Market Overview January 2019 A review of recent trends and thoughts about the future of the Seattle housing market. Bill King President, Chief Valuation Officer Real Info, Inc. City of
How Severe is the Housing Shortage in Hong Kong?
 (Reprinted from HKCER Letters, Vol. 42, January, 1997) How Severe is the Housing Shortage in Hong Kong? Y.C. Richard Wong Introduction Rising property prices in Hong Kong have been of great public concern
2015 First Quarter Market Report
 2015 First Quarter Market Report CAAR Member Copy Expanded Edition Charlottesville Area First Quarter 2015 Highlights: Median sales price for the region was up 5.1% over Q1-2014, rising from $244,250 to
Monthly Market Snapshot
 SEPTEMBER 2018 Vacancy continues to fall. Nearing the end of the third quarter, the vacancy rate dropped 10 basis points to 6.4%, compared to this time last month at 6.5%. Occupancy of the 1.1 million
HOME Survey. Housing Opportunities and Market Experience. June National Association of REALTORS Research Group
 HOME Survey Housing Opportunities and Market Experience June 2018 National Association of REALTORS Research Group Introduction The Housing Opportunities and Market Experience (HOME) report was created
ASIA PACIFIC OFFICE OVERVIEW April - June 2017
 ASIA PACIFIC OFFICE OVERVIEW April - June A CUSHMAN & WAKEFIELD QUARTERLY RESEARCH PUBLICATION INSIGHTS INTO ACTION ASIA PACIFIC OFFICE OVERVIEW OCCUPIER CONDITIONS INDIA Delhi-NCR GREATER CHINA Chongqing
Market Insights & Strategy Global Markets
 Market Insights & Strategy Global Markets UAE Real Estate Review 2016 Q2 Please find below a quick snapshot of the key topics covered in this note: Pricing trends - Sales In June 2016, monthly average
Domain House Price Report
 Domain House Price Report June Quarter 2016 Dr Andrew Wilson Chief Economist for Domain Key findings median house price back up over $1 million Median house prices hit new record in Melbourne, and, with
THE REAL ESTATE BOARD OF NEW YORK
 THE REAL ESTATE BOARD OF NEW YORK REAL ESTATE BROKER CONFIDENCE INDEX FIRST QUARTER 2018 EXECUTIVE SUMMARY The Real Estate Board of New York s (REBNY) Real Estate Broker Index for the first quarter of
Leasing Activity Ticked Up with A Large Upswing of Absorption
 Research & Forecast Report LONG ISLAND INDUSTRIAL MARKET Leasing Activity Ticked Up with A Large Upswing of Absorption Rose Liu Director of Finance & Research Long Island Takeaways > > The outlook of the
Monthly Market Update
 Monthly Market Update December 2015 New York City Office Outlook February 2016 M A N H A T T A N Class A Asking Rents M A N H A T T A N Class A Vacancy Rates $100.00 Jan-14 Jan-15 Jan-16 20.0% Jan-14 Jan-15
THE IMPACT OF RESIDENTIAL REAL ESTATE MARKET BY PROPERTY TAX Zhanshe Yang 1, a, Jing Shan 2,b
 THE IMPACT OF RESIDENTIAL REAL ESTATE MARKET BY PROPERTY TAX Zhanshe Yang 1, a, Jing Shan 2,b 1 School of Management, Xi'an University of Architecture and Technology, China710055 2 School of Management,
MANHATTAN OFFICE 2017
 Research Report MANHATTAN OFFICE 2017 Accelerating success. % $ ± Market Indicators Full Year 2016 Full Year 2017 Y-O-Y Change AVAILABILITY RATE 10.3% 10.0% -0.3pp AVERAGE ASKING RENT ($/SF/YR) $73.24
Research. A Capital Value production. An analysis of the Dutch residential (investment) market 2017
 market 2017") Research A Capital Value production An analysis of the Dutch residential (investment) market 2017 Summary In 2016, the development of the housing market was turbulent. Key events included a historic residential
Research A Capital Value production An analysis of the Dutch residential (investment) market 2017 Summary In 2016, the development of the housing market was turbulent. Key events included a historic residential
Vacancy Inches Higher, Despite Continued Absorption
 Research & Forecast Report GREATER PHOENIX OFFICE 1Q 2017 Vacancy Inches Higher, Despite Continued Absorption Key Takeaways > > Improving conditions in the Greater Phoenix office market took a pause in
The Improvement of the Industrial Market
 Research & Forecast Report Long Island industrial MARKET Q2 2015 The Improvement of the Industrial Market Rose Liu Research & Financial Analyst Long Island Takeaways The overall economy on Long Island
Housing & Construction Review
 GavekalDragonomics China Chartbook Housing & Construction Review November 2014 Table of contents Part 1: Fundamental outlook A maturing market Part 2: Housing policy Focus on migration and redevelopment
Summary of JREI Global Property Value/Rent Indices (No. 11, Oct. 2018)
") November 29, 2018 Japan Real Estate Institute (JREI) JREI-kenkyu-madoguchi@imail.jrei.jp Summary of JREI Global Property Value/Rent Indices (No. 11, Oct. 2018) We are pleased to release a summary of the
November 29, 2018 Japan Real Estate Institute (JREI) JREI-kenkyu-madoguchi@imail.jrei.jp Summary of JREI Global Property Value/Rent Indices (No. 11, Oct. 2018) We are pleased to release a summary of the
University of St. Thomas Minnesota Commercial Real Estate Survey
 University of St. Thomas Minnesota Commercial Real Estate Survey December 2016 Minnesota Commercial Real Estate Outlook Showing Few Changes Following Election, says University of St Thomas Minnesota Commercial
2018: embrace new opportunities
 Colliers Outlook SHENZHEN 2018 MARKET OUTLOOK 25 January, 2018 2018: embrace new opportunities Kirsten Geng Assistant Manager Research Shenzhen Shenzhen finished 2017 strong with its economic growth leading
San Francisco Bay Area to Sonoma County Housing and Economic Outlook
 San Francisco Bay Area to 2020 Sonoma County Housing and Economic Outlook Economic Forecast Summary 2017 Presented by Pacific Union International, Inc. and John Burns Real Estate Consulting, LLC On Nov.
Briefing Office and retail
 Savills China Research Dalian Briefing Office and retail August 218 Image: Labor Park, Qingniwa Area, Zhongshan District SUMMARY A lack of new supply saw rents and occupancy rates in both the Grade A office
Filling the Gaps: Active, Accessible, Diverse. Affordable and other housing markets in Johannesburg: September, 2012 DRAFT FOR REVIEW
 Affordable Land and Housing Data Centre Understanding the dynamics that shape the affordable land and housing market in South Africa. Filling the Gaps: Affordable and other housing markets in Johannesburg:
Briefing Office sector February 2018
 Savills World Research Shanghai Briefing Office sector February 2018 SUMMARY Image: Shanghai Huadian Tower, Pudong 2017 proved a turning point for the Shanghai office market, with further 2018 supply expected
September 2016 RESIDENTIAL MARKET REPORT
 September 2016 RESIDENTIAL MARKET REPORT The real estate investment market in Japan has had an abundance of capital (both domestic & foreign) over the past couple of years. This, along with the low (now
Addressing the Impact of Housing for Virginia s Economy
 Addressing the Impact of Housing for Virginia s Economy A REPORT FOR VIRGINIA S HOUSING POLICY ADVISORY COUNCIL NOVEMBER 2017 Appendix Report 2: Housing the Commonwealth's Future Workforce 2014-2024 Jeannette
ANALYSIS OF THE CENTRAL VIRGINIA AREA HOUSING MARKET 1st quarter 2013 By Lisa A. Sturtevant, PhD George Mason University Center for Regional Analysis
 ANALYSIS OF THE CENTRAL VIRGINIA AREA HOUSING MARKET 1st quarter By Lisa A. Sturtevant, PhD George Mason University Center for Regional Analysis Economic Overview Key economic factors in the first quarter
High-priced homes have a unique place in the
 Livin' Large Texas' Robust Luxury Home Market Joshua G. Roberson December 3, 218 Publication 2217 High-priced homes have a unique place in the overall housing market. Their buyer pool, home characteristics,
HOTEL Scenarios for the year ahead. Choice CEO Stephen Joyce : Ideas, insights and wishes for Is your hotel ready for the Chinese?
 HOTEL 2012 Scenarios for the year ahead Choice CEO Stephen Joyce : Ideas, insights and wishes for 2012 Is your hotel ready for the Chinese? The 2012 outlook for key hotel markets : 30 exclusive country
Residential Commentary Sydney Apartment Market
 Residential Commentary Sydney Apartment Market April 2017 Executive Summary Sydney Apartment Market: Key Indicators 14,200 units are currently under construction in Inner Sydney with completion expected
INLAND EMPIRE REGIONAL INTELLIGENCE REPORT
 INLAND EMPIRE REGIONAL INTELLIGENCE REPORT June 2016 EMPLOYMENT After a slow start to 2016, the Inland Empire s labor market returned to form, in recent job figures. Seasonally adjusted nonfarm employment
Hamilton s Housing Market and Economy
 Hamilton s Housing Market and Economy Growth Indicator Report November 2016 hamilton.govt.nz Contents 3. 4. 5. 6. 7. 7. 8. 9. 10. 11. Introduction New Residential Building Consents New Residential Sections
The Seattle MD Apartment Market Report
 The Seattle MD Apartment Market Report Volume 16 Issue 2, December 2016 The Nation s Crane Capital Seattle continues to experience an apartment boom which requires constant construction of new units. At
San Francisco Bay Area to Napa County Housing and Economic Outlook
 San Francisco Bay Area to 019 Napa County Housing and Economic Outlook Bay Area Economic Forecast Summary Presented by Pacific Union International, Inc. and John Burns Real Estate Consulting, LLC On Nov.
Land markets, property led growth and local economic development: lessons from China
 Land markets, property led growth and local economic development: lessons from China J Albert Cao Ramin Keivani Department of Real Estate and Construction Oxford Brookes University Oxford, UK Based on
Heterogeneous Responses of Chinese Cities Housing Prices to Monetary Policies
 Commun. Theor. Phys. 56 (2011) 791 796 Vol. 56, No. 4, October 15, 2011 Heterogeneous Responses of Chinese Cities Housing Prices to Monetary Policies YAN Yan ( ), 1 WANG Yan-Ting ( ), 2 and ZHU Xiao-Wu
Office Stays Positive
 Q2 2014 OFFICE LAS VEGAS NEVADA RESEARCH & FORECAST REPORT Office Stays Positive While it may not always be pretty, Southern Nevada s office market continues to improve. Net absorption increased in the
San Francisco Housing Market Update
 San Francisco Housing Market Update California Economic and Housing Market Outlook The national economy maintained a healthy growth rate in the first quarter of 2005 and appeared to be settling in for
MANHATTAN MARKET REPORT
 MANHATTAN MARKET REPORT Q1 MANHATTAN MARKET REPORT 1Q 2017 Manhattan s residential market is showing signs of improvement after a period of uncertainty leading up to the Presidential election, as it does
PRESS RELEASE Yanlord and Ho Bee acquire 387,597 sqm GFA prime residential site in Tangshan
 PRESS RELEASE Yanlord and Ho Bee acquire 387,597 sqm GFA prime residential site in Tangshan YANLORD AND HO BEE CAPITALISE ON RAPID DEVELOPMENT OF BOHAI ECONOMIC REGION THROUGH ACQUISITION OF A 387,597
Austin-area home prices set August record, outpace household income growth in August 2015
 Austin-area home prices set August record, outpace household income growth in August 2015 Market Reports Austin Board of REALTORS releases real estate statistics for August 2015 AUSTIN, Texas September
Research. A Capital Value production. An analysis of the Dutch residential (investment) market 2018
 market 2018") Research A Capital Value production An analysis of the Dutch residential (investment) market 2018 Summary Never before has so much capital been invested in Dutch rented housing. In 2017, a total of 5.5
Research A Capital Value production An analysis of the Dutch residential (investment) market 2018 Summary Never before has so much capital been invested in Dutch rented housing. In 2017, a total of 5.5
Caution: Vacancy Increases Ahead
 MARKET REPORT DISTRICT OF COLUMBIA OFFICE Fourth Quarter 2016 Caution: Vacancy Increases Ahead Market Indicators Q4 2016 2017 (Projected) NET Despite year-to-date negative absorption, the Washington, DC
RESEARCH & FORECAST REPORT
 Q2 2012 OFFICE LAS VEGAS NEVADA RESEARCH & FORECAST REPORT Recovery Without Job Growth? Despite office employment still trending downwards, Southern Nevada s office market posted positive net absorption
Ying Li International Real Estate Limited 1Q2015 Financial Results 15 May 2015
 New Beijing Centre. Tongzhou Beijing Artist s Impression Ying Li International Real Estate Limited 1Q2015 Financial Results 15 May 2015 Ying Li International Financial Centre, Chonqging Disclaimer This
SELF-STORAGE REPORT VIEWPOINT 2017 / COMMERCIAL REAL ESTATE TRENDS. By: Steven J. Johnson, MAI, Senior Managing Director, IRR-Metro LA. irr.
 SELF-STORAGE REPORT VIEWPOINT 2017 / COMMERCIAL REAL ESTATE TRENDS By: Steven J. Johnson, MAI, Senior Managing Director, IRR-Metro LA The Self Storage Story The self-storage sector has been enjoying solid
ECONOMIC CURRENTS. Vol. 3, Issue 1. THE SOUTH FLORIDA ECONOMIC QUARTERLY Introduction
 ECONOMIC CURRENTS THE SOUTH FLORIDA ECONOMIC QUARTERLY Introduction Economic Currents provides an overview of the South Florida regional economy. The report contains current employment, economic and real