ARLA Members Survey of the Private Rented Sector
|
|
|
- Tabitha Banks
- 5 years ago
- Views:
Transcription
1 Prepared for The Association of Residential Letting Agents & the ARLA Group of Buy to Let Mortgage Lenders ARLA Members Survey of the Private Rented Sector Fourth Quarter 2010 Prepared by: O M Carey Jones 5 Henshaw Lane Yeadon Leeds LS19 7RW December, 2010
2 CONTENTS Page 1. INTRODUCTION & BACKGROUND 3 2. METHODOLOGY 4 3. SUMMARY 5 4. RESULTS 7 Page 2
3 1. INTRODUCTION & BACKGROUND The mortgage lenders who make up the ARLA group of buy to let mortgage lenders are keen to ensure that the service they provide to ARLA members is relevant to their needs and takes account of the specific and unique requirements of residential letting agents and their investor landlords. In order to help achieve this, ARLA has commissioned research to ensure that the ARLA group of buy to let mortgage lenders are kept up to date with agents requirements and concerns as they change with economic conditions, hopes and fears. The research is conducted by Owen Carey Jones who specialises in the UK mortgage market and currently conducts several regular quarterly surveys of residential landlords and financial advisers on behalf of a number of clients. Page 3
4 2. METHODOLOGY ARLA members were ed during November with the URL for the on-line survey and asked to go on-line to complete the survey and by the closing date 554 members had completed the survey on-line. These responses were analysed and tables of data produced on which this report is based. Page 4
5 3. SUMMARY Compared with three months ago, average weighted rental returns for houses are unchanged at 5.0% whilst those for flats are down from 5.1% to 5.0% but this change merely reverses the change seen three months ago. On balance ARLA members report increased achievable rent levels over the last six months on all types of rented property but the average proportion of respondents across all property types now saying they think achievable rent levels have increased over the last six months has, for the first time in more than a year, not risen but remained steady at 55%. The overall average capital asset value of rented houses has fallen by 4.1% over the last three months, mainly as a result of a fall of 7.5% for those managing properties in Prime Central London. For those in the Rest of the South East, the average value of a rented house fell marginally by 0.5% whilst for those in the Rest of the UK, it rose by 3.3%. Contrastingly, over the same period the average value of rented flats throughout the country rose by 1.8% as a result of rises of 2.4% for those managing properties in Prime Central London and 2.3% for those in the Rest of the South East. On the other hand, for those in the Rest of the UK, the average value of rented flats fell marginally by 0.5%. During the last three months there has been some weakening of demand in the rented residential property sector with the overall proportion of respondents saying that there are more tenants than properties available for them falling, for the first time in more than a year, from 73% to 72% as a result of a fall from 81% to 73% in the Rest of the South East and a fall from 67% to 64% in the Rest of the UK. These falls outweighed an increase from 73% to 83% for those managing properties in Prime Central London.. The gap between the proportion of ARLA members who think that landlords are currently selling properties and those who think they are currently buying properties has closed over the last three months as there has been virtually no change in the proportion saying landlords are now buying with the figure remaining steady at 11.4% whilst the proportion saying landlords are now selling has fallen from 17.0% to 11.6%. Compared with three months ago, the average void period has risen, for the first time in eighteen months, increasing from 2.9 weeks (20 days) to 3.1 weeks (22 days) whilst the average number of new tenancies signed up in the preceding three months fell from 38 to 36. The average proportion of ARLA members offices portfolios which are made up of investment property has fallen a little from 54.1% to 53.4% and the average number of purely investment properties which are managed by ARLA members offices has fallen from 131 to 124 Page 5
6 properties over the same period. Both these changes merely partially reverse the changes seen in the third quarter of the year. On average, ARLA members say that tenants remain in the same property for a period of 18.2 months, a figure which is up from 17.8 months in the third quarter of the year. For the second time in succession, a substantially increased proportion of ARLA members offices (59%, up from 34% in the third quarter and 19% in the second quarter) believe that they are seeing an increase in rental property coming onto the market because it cannot be sold. There has been an increase, from 36% three months ago to 40% now, in the proportion of ARLA members offices saying that they have seen an increase in the number of tenants struggling to meet rental payments in the last six months and this is the first increase in this figure since the question was first asked 18 months ago. Reflecting this, there has also been the first increase (from 45% to 47%) in the proportion saying that they have seen an increase in tenants haggling with landlords over rents in the last six months. There has been an increase in the proportion of ARLA members offices saying that they are aware of an increase in tenants asking lenders for references on potential landlords to ensure they are financially viable with the figure rising from 10% to 12%, reversing the change seen three months ago. More than half of ARLA members offices (51%, down from 53% three months ago) say that none of their potential or existing tenant clients ask them if they are licensed, a figure which falls to less than four out of ten (37%, down from 40% three months ago) when it relates to potential or existing landlord clients. Nevertheless, a small minority (1.3% and 5.8% respectively) say that most or all of their potential and existing tenant and landlord clients ask this question. Less than one in ten ARLA members offices (9%, up from 8% three months ago) think that the proportion of potential or existing clients asking if they are licensed has increased over the last 12 months. More than four out of ten ARLA members offices (42%) think that the current buoyancy in the rental market will last for between one and two years but more than a further quarter (26%) think it will last longer than this with only less than one in eight (12%) thinking it will last less than a year. The majority of ARLA members offices (59%) believe that demand for rental property will continue to outstrip supply in 2011 with more than a quarter (27%) believing supply and demand will be in balance and just 6% believing that supply will begin to outstrip demand. More than six out of ten ARLA members offices (61%) think that the quality of rental property will remain the same in 2011 but a minority of more than a quarter (26%) think the quality will improve with only a few (8%) saying they think it will decline. Page 6
7 Almost four out of ten ARLA members offices (39%) think that more private landlords will enter the market during 2011 with only one in seven (14%) saying they think more will leave the market. However, almost a third of respondents (33%) think there will be no change in the number of private landlords entering and leaving the market. Page 7
8 4. RESULTS The following sections detail the results of the survey for the fourth quarter of The results have been broken down into three broad geographic areas which are Prime Central London (comprising London & South East based respondents who manage properties in Prime Central London), the Rest of the South East and the Rest of the UK. Data has also been included for each of the regions making up the UK as shown in the table below but it should be remembered that the number of respondents from some regions is relatively small and data for these regions should therefore be treated with a degree of caution as it will tend to vary quarter by quarter quite independently of any actual changes which may have taken place. For this reason, for the first time in this report, we have been able to include for some questions, comparative data averaged over three quarters. This is known as a three quarter moving average and helps to iron out any temporary fluctuations occurring quarter by quarter because of relatively small sample sizes. Page 8
 and the South West (12%), were the regions with the most respondents. Geographic Percent of Respondents (%) Region Q2.10 Q3.10 Q4.10 Central London 12.5 12.")
9 4.1 Geographic Location (Q.1) The South East, including London, was the region with the highest proportion of ARLA member offices responding, accounting for nearly six out of ten respondents (58%). After the South East, the Midlands (12%) and the South West (12%), were the regions with the most respondents. Geographic Percent of Respondents (%) Region Q2.10 Q3.10 Q4.10 Central London Rest of London (inside M25) South East (excl. London) South West Midlands North West North East Scotland/Wales/NI Base: All respondents (570) (454) (554) Compared with the third quarter survey, the main change is that there were noticeably more respondents from the Rest of the South East at the expense of Central London, the Rest of London and Scotland, Wales & Northern Ireland. Page 9
 More than eight out of ten respondents (81%) said that more than a quarter of their portfolio is investment property with a quarter (25%) saying that more than three quarters of theirs is")
10 4.2 Proportion of Portfolio Made Up of Investment Property (Q.3) More than eight out of ten respondents (81%) said that more than a quarter of their portfolio is investment property with a quarter (25%) saying that more than three quarters of theirs is investment property. Investment properties comprise a tenth or less of their portfolio for little more than one in twenty offices (6%). Analysis of the responses to this question reveals that, on average, investment properties account for 53% of ARLA member offices portfolios. Proportion Percent of Respondents (%) of Portfolio Prime Rest Rest All London of SE of UK Regions None Up to 10% % to 25% % to 50% % to 75% Over 75% Not stated Base: All respondents (111) (210) (233) (554) For offices in the Rest of the South East, investment properties appear to make up a slightly smaller proportion of their portfolios with the average being 52% compared with 53% for offices managing properties in Prime Central London and 55% for those in the Rest of the UK. Compared with the last survey in the third quarter of the year, the average proportion of portfolios which are in the form of investment property is down marginally from 54.1% to 53.4% as a result of the decreases in Prime Central London and the Rest of the South East. The average for the Rest of the UK was almost unchanged compared with three months ago. Page 10

11 Geographic Average Proportion of Portfolio (%) Area Q1.10 Q2.10 Q3.10 Q4.10 Prime Central London South East Rest of UK All Regions Base: All respondents (531) (570) (454) (554) As can be seen from the chart below, the proportion of respondents portfolios which is made up of investment property, having levelled off for a period of a year from mid-2002 to mid-2003, rose sharply between mid-2003 and mid At the end of 2004 the figure levelled off again before slowly reducing during the first half of However, both surveys for the second half of 2005 showed the figure was on the increase again and during 2006 this upward trend continued. Surveys for the first two quarters of 2007 saw falls in the average figure but overall, until the first quarter of 2008, the figure was fairly steady at between 50% and 53%. After that there were two consecutive falls taking the figure down to its lowest level for 5 years before it bounced back sharply and the results from the last eighteen months show that the trend is now upwards although the fall seen on this occasion may herald a change to that. Page 11
12 Regional Analysis Three quarter moving average proportions for each of the regions of the UK are shown in the table below from which it can be seen that there is not a great deal of difference between the regions on this question although, for offices in Central London and the North of England, investment properties do form a higher proportion of their investment portfolios. Geographic Average Proportion of Portfolio (%) Region (three quarter moving average) Q3.10 Q4.10 Central London Rest of London Rest of South East South West Midlands North West North East Scotland/Wales/NI Base: All respondents (454) (554) Compared with the three survey moving average from three months ago, there has been very little change. Page 12
 By and large, ARLA offices manage substantial numbers of purely investment properties with more than four out of ten (41%) saying that they manage over a hundred properties and more than eight out")
13 4.3 Number of Purely Investment Properties Managed (Q.4) By and large, ARLA offices manage substantial numbers of purely investment properties with more than four out of ten (41%) saying that they manage over a hundred properties and more than eight out of ten (81%) manage in excess of 20 properties. Analysis of these responses shows that the average number of purely investment properties managed by ARLA offices is currently 124. Number of Percent of Respondents (%) Properties Prime Rest Rest All London of SE of UK Regions Up to to to to to Over Not stated Base: All respondents (111) (210) (233) (554) Offices managing properties in Prime Central London tend to manage considerably fewer properties on average than their counterparts elsewhere in the country with the average numbers being 72 for Prime Central London, 121 for the Rest of the South East and 158 for the Rest of the UK. Compared with the third quarter, the average number of properties managed is down from 131 to 124, partially reversing the increase seen then, as a result of declines for Prime Central London and the Rest of the UK with the average for the Rest of the South East being little changed. Page 13

14 Geographic Average Number of Properties Area Q1.10 Q2.10 Q3.10 Q4.10 Prime Central London South East Rest of UK All Regions Base: All respondents (531) (570) (454) (554) As can be seen from the chart below, the average number of properties managed by ARLA members in the Rest of the UK, having risen rapidly during 2002 and 2003, stayed in the range 130 to 150 properties until mid 2007 after which it hit a rising trend but during 2009 it levelled off again and has fluctuated wildly during The average for the Rest of the South East evidenced a slight rising trend until the beginning of 2006, after which it declined although each decline was followed by a period of recovery. After mid 2007, the average rose fairly steadily but fluctuated quite wildly during 2009 whilst overall maintaining its level at around 110 properties. As with the Rest of the UK, the Rest of the South East has exhibited some fluctuations during For Prime Central London the figure has been relatively steady at an average of between 60 and 70 properties for some time despite occasionally moving outside this range although there was a trend for the figure to increase from mid 2006 until the beginning of 2008 when it levelled off and started to fall. During 2009, the figure rose steadily to reach a figure only marginally below its all time high and the results from the survey three months ago took the figure to its highest ever level. However, the results from this quarter have eroded half of the increase seen then. Page 14
 being found in the North West and the lowest number (53) in Central London.")
15 Regional Analysis Looking at the results for the individual regions of the UK reveals that the three quarter moving average number of purely investment properties managed by respondents offices appears to be higher in the northern half of the country with the highest number (70) being found in the North West and the lowest number (53) in Central London. Geographic Region Average Number of Properties (three quarter moving average) Q3.10 Q4.10 Central London Rest of London Rest of South East South West Midlands North West North East Scotland/Wales/NI Base: All respondents (454) (554) Compared with the results from the third quarter 2010 survey, the main changes are a reduction in the three quarter moving average number of properties managed in the North East and in Scotland, Wales & Northern Ireland. Averages for all the other regions were little changed. Page 15
 say the average is below 100,000 but for more than one in twenty respondents (6%), the average in their area is in excess of 1 million.")
16 4.4 Average Value of Rented Residential Properties (Q.5) Houses Nearly half of respondents (48%) say that the average value of a rented house in their area is between 150,000 and 350,000. Only less than one in thirty offices (2.9%) say the average is below 100,000 but for more than one in twenty respondents (6%), the average in their area is in excess of 1 million. Analysis of these figures gives an overall weighted average value for a rented house of 401,400. Average Percent of Respondents (%) Value of Houses Prime Rest Rest All London of SE of UK Regions Up to 100, ,001 to 150, ,001 to 200, ,001 to 350, ,001 to 500, ,001 to 750, ,001 to 1 Million Over 1 Million Not stated Base: All respondents (111) (210) (233) (554) There are big differences between the values of rented houses in the different geographical areas with the average for those managing properties in Prime Central London being 800,700 compared with 323,800 in the Rest of the South East and 222,000 in the Rest of the UK. Page 16
17 Compared with the last survey, the overall weighted average value of rented houses has fallen by 4.1% from 414,900 to 401,400, the second fall in succession. Geographic Average Value of Rented Houses (000s) Area Q1.10 Q2.10 Q3.10 Q4.10 Prime Central London South East Rest of UK All Regions (weighted) Base: All respondents (531) (570) (454) (554) Within this overall change, the average price of a rented house in Prime Central London has fallen by 7.5% since the last survey but the average for the Rest of the South East has fallen only marginally, by 0.5%, whilst the average for the Rest of the UK has risen by 3.3%. As can be seen from the chart below, between May 2003 and August 2004 the average value of a rented house increased by 16% from 306,100 to 353,800 and, after stabilising for a couple of years, continued rising until the summer of 2007 when it peaked at 442,600. After that, the average fell by 16% before stabilising during 2008 but then fell sharply in mid 2009 to reach a three year low before bouncing back equally sharply in the following two quarters. The results from the surveys in the first half of 2010 confirmed that these increases were not temporary blips but, in the second half of 2010, the average value has turned down, ending the upward trend which had run from mid 2009 to mid Page 17

18 Regional Analysis Data relating to individual regions of the UK shows that, not unexpectedly, by and large the further north rented houses are located, the lower is their average value although, from the chart below showing the three quarter moving average, the low point appears to be the Midlands with average prices rising a little as one moves further north. Geographic Region Average Value of Rented Houses (000s) (three quarter moving average) Q3.10 Q4.10 Central London 1,163 1,142 Rest of London Rest of South East South West Midlands North West North East Scotland/Wales/NI Base: All respondents (454) (554) Compared with three months ago, there have been falls in the three quarter moving average values of houses in Central London and the North East with all the other regions experiencing rises in their three quarter moving averages. Page 18
, say the average value of a rented flat in their area is below 100,000 compared with less than one in forty (2.")
19 Flats Getting on for half of respondents (45%) say that the average value of a rented flat in their area is between 100,000 and 200,000. However, one in six respondents (16%), say the average value of a rented flat in their area is below 100,000 compared with less than one in forty (2.3%) who say the average value is in excess of 1 million. Analysis of these figures gives an overall weighted average value for a rented flat of 258,500. Average Percent of Respondents (%) Value of Flats Prime Rest Rest All London of SE of UK Regions Up to 100, ,001 to 150, ,001 to 200, ,001 to 350, ,001 to 500, ,001 to 750, ,001 to 1 Million Over 1 Million Not stated Base: All respondents (111) (210) (233) (554) As with rented houses, there are big differences between the values of rented flats in the different geographical areas with the average for Prime Central London being more than half a million pounds ( 522,500) compared with 205,400 in the Rest of South East and 142,200 in the Rest of the UK. Compared with the third quarter survey, in contrast to the average value of a rented houses, the overall weighted average value of a rented flat has risen by 1.8% from 253,900 to 258,500. Page 19
20 Within that overall change, however, the average value of rented flats in the Rest of the UK fell marginally by 0.5% whilst that for Prime Central London rose by 2.4% and that for the Rest of the South East rose by 2.3%. Geographic Average Value of Rented Flats (000s) Area Q1.10 Q2.10 Q3.10 Q4.10 Prime Central London South East Rest of UK All Regions (weighted) Base: All respondents (531) (570) (454) (554) As can be seen from the chart below, between 2003 and 2007, the average value of a rented flat increased by 46% from 189,100 in the second quarter of 2003 to 275,800 in the third quarter of 2007 despite the occasional temporary downturn. However, after that, average values of flats fell by 15%, reaching a three year low of 234,900 fifteen months ago before bouncing back sharply. The first three quarters of 2010, however, saw small falls in the average value of rented flats but, despite these declines, the figure remained at about the same level as a year earlier and the increase seen this quarter suggests that the average values of rented flats are currently fairly stable. Page 20

21 Regional Analysis As was the case for prices of rented houses, results for individual regions of the UK show that, not unexpectedly, by and large the further north rented flats are located, the lower is their average value although, again, the lowest average value is in fact to be found in the Midlands. The chart below showing the three quarter moving averages shows this quite clearly. Geographic Region Average Value of Rented Flats (000s) (three quarter moving average) Q3.10 Q4.10 Central London Rest of London Rest of South East South West Midlands North West North East Scotland/Wales/NI Base: All respondents (454) (554) Compared with three months ago, there have been increases in the three quarter moving average values of rented flats in all regions with the exception of the North East which saw a small decrease. Page 21

22 Summary As was to be expected, average values of rented houses are much higher than those of rented flats with the smallest difference being seen by those managing properties in Prime Central London where the average figure for houses is now 53% higher than that for flats. The differences between the values of houses and flats in the Rest of the South East and in the Rest of the UK are similar but higher than that for Prime Central London with the respective figures being 58% and 56% respectively. Geographic Average Value of Properties (000s) Area Houses Flats Prime Central London Rest of the South East Rest of the UK All Regions (weighted) Base: All respondents (554) Compared with the third quarter of the year, there has been a fall in the overall value of houses but, in the case of flats, there has been an increase in the overall value. With regard to the broad geographic areas, there has been little consistency with each area reporting either a rise for houses and a fall for flats or vice-versa. Regional Analysis Looking at average prices of rented houses compared with average prices of rented flats within individual regions confirms, not surprisingly, that across all regions, houses command higher prices than flats. Page 22
 and much less marked in the north of England (rented house prices are between 32% and 49% higher than rented flat prices).")
23 However, more interestingly, the data for the three quarter moving average shows that the relative difference is much more marked in the south of the England and in Scotland, Wales & Northern Ireland (rented house prices are between 61% and 69% higher than rented flat prices) and much less marked in the north of England (rented house prices are between 32% and 49% higher than rented flat prices). Geographic Region Average Value of Properties (000s) (three quarter moving average) Houses Flats Central London 1, Rest of London Rest of South East South West Midlands North West North East Scotland/Wales/NI Base: All respondents (554) Page 23
24 4.5 Average Rental Return on Rented Residential Property (Q.6) Houses According to ARLA members offices, a rental return of between 4% and 5% is the norm for rented houses with almost half of respondents (49%) saying that this applies to their area. Analysis of these results reveals a weighted average rental return on rented houses of 5.0%. Average Percent of Respondents (%) Return Prime Rest Rest All London of SE of UK Regions Less than 4% % to 5% % % % % to 10% % to 12% % to 15% Over 15% Not stated Base: All respondents (111) (210) (233) (554) There is some difference in rates of return between the three broad geographic areas with the average for those managing properties in Prime Central London being the lowest at 4.7% compared with 4.9% for the Rest of the South East and 5.3% for the Rest of the UK. Geographic Average Rental Return (%) Area Q1.10 Q2.10 Q3.10 Q4.10 Prime Central London South East Rest of UK All Regions (weighted) Base: All respondents (531) (570) (454) (554) Compared with the third quarter of 2010, the overall average weighted rental return on houses is unchanged at 5.0%. Within this overall position, the average rental return on houses in Prime Central London is up again, this time from 4.5% to 4.7% whilst the average rental return on houses in the Rest of the South East is down from 5.0% to 4.9% and that for the Rest of the UK is unchanged at 5.3%. Page 24
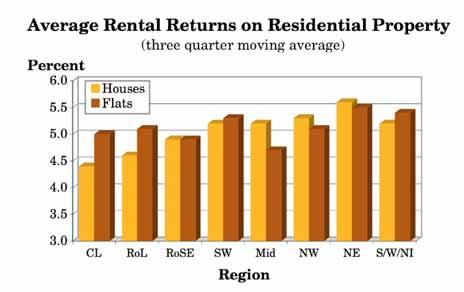
25 Regional Analysis Results for individual regions of the UK show that by and large the further away from London rented houses are located, the higher is the average rental return earned from them with the lowest three quarter moving average rental return (4.4%) to be found in Central London and the highest (5.6%) to be found in the North East. Geographic Average Rental Return on Houses (%) Region (three quarter moving average) Q3.10 Q4.10 Central London Rest of London Rest of South East South West Midlands North West North East Scotland/Wales/NI Base: All respondents (454) (554) Compared with three months ago, there have been noticeable reductions in the three quarter moving average rental returns earned on houses in the Midlands and in Scotland, Wales & Northern Ireland and noticeable increases in Central London and the Rest of the South East with all the other regions having unchanged three quarter moving averages. Page 25
26 Flats A rental return of between 4% and 5% also appears to be the norm for rented flats with more than half of respondents (51%) saying that this applies to their area. Analysis of these results reveals a weighted average rental return on rented flats of 5.0%. Average Percent of Respondents (%) Return Prime Rest Rest All London of SE of UK Regions Less than 4% % to 5% % % % % to 10% % to 12% % to 15% Over 15% Not stated Base: All respondents (111) (210) (233) (554) As was the case with rented houses, there is some difference in the rental rates of return for rented flats between the different geographical areas, with the average for those managing properties in Prime Central London being 4.8% compared with 5.1% both for those in the Rest of the South East and for those in the Rest of the UK. Geographic Average Rental Return (%) Area Q1.10 Q2.10 Q3.10 Q4.10 Prime Central London South East Rest of UK All Regions (weighted) Base: All respondents (531) (570) (454) (554) Compared with the last survey in the third quarter of 2010, the overall weighted average rental return on flats is down a little from 5.1% to 5.0%, yet again reversing the change seen three months earlier. Within this overall slight decrease, the average for Prime Central London has fallen from 5.1% to 4.8% and the average for the Rest of the UK has fallen from 5.2% to 5.1%. However, the average for the Rest of the South East rose from 5.0% to 5.1%. Page 26
 being obtained in the North East and the lowest (4.7%) in the Midlands.")
27 Regional Analysis Contrary to what was found to be the case with rental returns on houses, results for individual regions of the UK show that rental returns on flats in each region exhibit no pattern related to where they are located with the highest three quarter moving average rental return (5.5%) being obtained in the North East and the lowest (4.7%) in the Midlands. Geographic Average Rental Return on Flats (%) Region (three quarter moving average) Q3.10 Q4.10 Central London Rest of London Rest of South East South West Midlands North West North East Scotland/Wales/NI Base: All respondents (454) (554) Compared with three months ago, there have been some changes in the three quarter moving average rental returns for flats with a noticeable reduction being seen in the North West (down from 5.4% to 5.1%) and a noticeable increase in the North East (up from 5.2% to 5.5%). Summary The lowest average rental returns are currently being earned on houses in Prime Central London (4.7%) with the highest returns being earned on houses in the Rest of the UK (5.3%). Page 27
 Overall flats and houses now seem to achieve similar average rental rates of return.")
28 Geographic Average Rental Return (%) Area Houses Flats Prime Central London Rest of the South East Rest of the UK All Regions (weighted) Base: All respondents (554) Overall flats and houses now seem to achieve similar average rental rates of return. However, in Prime Central London and the Rest of the South East flats appear to achieve higher rental returns whereas, in the Rest of the UK houses appear to do better than flats. Regional Analysis As can be seen from the table and chart below which show the three quarter moving average of rental returns, flats tend to outperform houses on rental return in the south of the country and vice versa although Scotland, Wales & Northern Ireland is an exception to this. Geographic Average Rental Return Region Three Quarter Moving Average (%) Houses Flats Central London Rest of London Rest of South East South West Midlands North West North East Scotland/Wales/NI Base: All respondents (554) Page 28
29 Page 29
30 Average Rents The table below shows the average rents being received by landlords based on the average rental returns and average property values quoted above. Average Rents Q4.10 Geographic HOUSES FLATS Area Week Month Year Week Month Year ( ) ( ) ( 000) ( ) ( ) ( 000) Prime Central London 724 3, , Rest of the South East 305 1, Rest of the UK Whole Country 377 1, , Base: All respondents (554) In the case of the Rest of the UK, the average rent for a house is 62% more than that for a flat. For those managing properties in Prime Central London the difference is smaller at 50% with that for the Rest of the South East falling between these two extremes at 52%. Compared with the last survey, weighted average rents for houses are down by 1.8% as a result of falls of 3.3% for those managing properties in Prime Central London and 2.5% for those in the Rest of the South East. Average rents for those in the Rest of the UK were up by 3.3%. Average rents for flats also fell overall (by 0.7%), as a result of falls of 3.7% for those managing properties in Prime Central London and 2.4% for those in the Rest of the UK with those in the Rest of the South East reporting an increase of 4.3% on average. Page 30
31 Average Rents Q3.10 Geographic HOUSES FLATS Area Week Month Year Week Month Year ( ) ( ) ( 000) ( ) ( ) ( 000) Prime Central London 749 3, , Rest of the South East 313 1, Rest of the UK Whole Country 384 1, , Base: All respondents (454) Regional Analysis Further analysis of the responses to this question enables average rents to be derived for each of the geographic regions included in the survey and these are shown for this quarter and last quarter in the tables below. However, it should be noted that the number of respondents for some of the regions is relatively small with the smallest number (29) being for the Scotland, Wales & Northern Ireland. Average Rents Q4.10 Geographic HOUSES FLATS Region Week Month Year Week Month Year ( ) ( ) ( 000) ( ) ( ) ( 000) Prime Central London 724 3, , Rest of London 356 1, , Rest of South East 293 1, South West 300 1, Midlands North West North East Scotland/Wales/NI Base: All respondents (554) Compared with three months ago, there appear to have been quite wide variations with regard to changes in average rents which seem to have little to do with where the region concerned is located within the UK. Average Rents Q3.10 Geographic HOUSES FLATS Region Week Month Year Week Month Year ( ) ( ) ( 000) ( ) ( ) ( 000) Prime Central London 749 3, , Rest of London 446 1, , Rest of South East 272 1, South West 303 1, Midlands North West North East Scotland/Wales/NI 244 1, Base: All respondents (454) Page 31
 Average void periods for rented residential properties tend to be quite short with almost eight out of ten ARLA members offices (79%) reporting averages of 4 weeks or less per year and, in")
32 4.6 Average Void Period Per Year (Q.7) Average void periods for rented residential properties tend to be quite short with almost eight out of ten ARLA members offices (79%) reporting averages of 4 weeks or less per year and, in addition, nearly a further one in seven (15%) saying the average is between 5 and 6 weeks. These figures indicate an overall average void period of 3.1 weeks (22 days) per year. Average Percent of Respondents (%) Void Period Prime Rest Rest All London of SE of UK Regions Less than 2 weeks to 4 weeks to 6 weeks to 8 weeks More than 8 weeks Don't know Not stated Base: All respondents (111) (210) (233) (554) Respondents from the Rest of the UK experience the highest average void period at 3.4 weeks (24 days) compared with 2.8 weeks (20 days) for both Prime Central London and the Rest of the South East. Compared with the third quarter, the average void period for the whole country is up from 2.9 weeks (20 days) to 3.1 weeks (22 days), the first increase for more than a year. Average void periods have increased in the Rest of the South East (from 2.5 weeks to 2.8 weeks) and the Rest of the UK (from 3.3 weeks to 3.4 weeks) but for those managing properties in Prime Central London the average void period is unchanged at 2.8 weeks. Page 32

33 Geographic Average Void Period (weeks) Area Q1.10 Q2.10 Q3.10 Q4.10 Prime Central London South East Rest of UK Whole Country Base: All respondents (531) (570) (454) (554) As can be seen from the chart below, until mid-2008 the average void period had been declining for some time and had fallen by a quarter from a high of 4.4 weeks (31 days) per year in the winter of 2003/2004 to 3.2 weeks (22 days) nearly two years ago. The rapid rise in average void periods that followed took the figure to 4.3 weeks (31 days) close to its all-time high. However, the figure then fell rapidly between mid 2009 and mid 2010, reaching its lowest level since these surveys began ten years ago. The results from this survey have halted this decline with the increase seen this quarter being the first for more than a year. Regional Analysis As can be seen from the table below, showing figures for each region of the UK, the three quarter moving average void period is lower in the Rest of London (2.5 weeks) than anywhere else in the country with the averages tending to increase as one goes north. The main exceptions to this are the North East and Scotland, Wales & Northern Ireland although even in these regions, the average void Page 33
 (three quarter moving average) Q3.10 Q4.10 Central London 3.4 3.1 Rest of London 2.6 2.6 Rest of South East 3.0 2.8 South West 3.2 3.0 Midlands 3.7 3.")
34 period tends to be substantially higher than it is in the south of the country, especially if Central London is excluded. Geographic Region Average Void Period (weeks) (three quarter moving average) Q3.10 Q4.10 Central London Rest of London Rest of South East South West Midlands North West North East Scotland/Wales/NI Base: All respondents (454) (554) Compared with three months ago, the figures for the three quarter moving average void periods have decreased in every region with the exception of the Rest of London where the figures is unchanged. Whilst these figures may seem to contradict the increase reported above for the country as a whole, it should be remembered that the figures here for individual regions are three quarter moving averages which are intended to iron out temporary fluctuations and reveal the underlying longer term trend. Page 34
 Nearly eight out of ten ARLA members offices (78%) have signed up more than 10 new tenancies (other than renewals) in the last three months with almost six out of ten (59%) having signed up more")
35 4.7 Number of New Tenancies (Not Renewals) Signed Up in the Last Three Months (Q.8) Nearly eight out of ten ARLA members offices (78%) have signed up more than 10 new tenancies (other than renewals) in the last three months with almost six out of ten (59%) having signed up more than 20 and more than a quarter (26%) more than 50. Analysis of these results reveals that, on average, ARLA members offices have each signed up 36 new tenancies in the last three months. Number of Percent of Respondents (%) Tenancies Prime Rest Rest All London of SE of UK Regions None Up to to to to Over Not stated Base: All respondents (111) (210) (233) (554) Those in the Rest of the UK have fared better than those in the Rest of the South East and those managing properties in Prime Central London with the average figures being 33 for Prime Central London, 35 for the Rest of the South East and 38 for the Rest of the UK. Compared with the last survey, there has been a decline in the average number of new tenancies signed up in the preceding three months from 38 to 36. Within this overall position, respondents in the Rest of the UK saw their average fall from 42 to 38 new tenancies and those managing properties in Prime Central London saw theirs fall from 35 to 33 whilst the average for those in the Rest of the South East was unchanged at 35 new tenancies. Page 35
 (570) (454) (554) As can be seen from the chart below, the fall seen this quarter is in line with the seasonal trend over the last three years with the fourth quarter")

36 Geographic Number of New Tenancies Area Q1.10 Q2.10 Q3.10 Q4.10 Prime Central London South East Rest of UK All Regions Base: All respondents (531) (570) (454) (554) As can be seen from the chart below, the fall seen this quarter is in line with the seasonal trend over the last three years with the fourth quarter normally seeing a fall in the average number of new tenancies. Looking past these seasonal variations, as can be seen in the graph of the three quarter moving average below, the trend over most of the last seven years has been for the average number of new tenancies being signed up to increase although there does appear to have been some levelling off of the figure over the last two years. Page 36

37 Historically, the fourth quarter has shown an increase in the average number of new tenancies compared with the third quarter but this is something which appears to have changed with the onset of the recession. Regional Analysis The number of new tenancies signed up in the three months preceding the survey tends to be higher in the north than in the south of the country with the smallest three quarter moving average figure (33) being in Central London and the largest (45) being in North West. Geographic Region Number of New Tenancies (three quarter moving average) Q3.10 Q4.10 Central London Rest of London Rest of South East South West Midlands North West North East Scotland/Wales/NI Base: All respondents (454) (554) Compared with the results from the last quarter, the three quarter moving average number of new tenancies is up for every region with the sole exception of the Midlands, where it is unchanged. Page 37
38 4.8 Balance of Supply & Demand in Rented Residential Property Sector (Q.9) More than seven out of ten ARLA members offices (71%) say that there are currently more tenants than there are properties available for them. This compares with only one in seven (14%) who now believe that there are more residential properties available for rent than there are tenants to fill them. However, nearly another one in seven (13%) believe that supply of and demand for rented residential properties is in balance. These figures suggest that, overall, the supply of rented residential properties is currently insufficient to meet demand for them with demand being strongest in Prime Central London where only 11% of respondents say there are more properties than tenants compared with 83% saying there are more tenants than properties. The Rest of the South East shows the second strongest level of demand with 10% saying there are more properties than tenants compared with 73% saying there are more tenants than properties. For those in the Rest of the UK the situation is the least positive for landlords with 21% saying there are more properties than tenants and 64% saying there are more tenants than properties. Balance of Percent of Respondents (%) Supply and Prime Rest Rest All Demand London of SE of UK Regions Lot more props than tenants Few more props than tenants Equal nos of props & tenants Lot more tenants than props Few more tenants than props Not stated Base: All respondents (111) (210) (233) (554) Page 38

39 Compared with the third quarter, there has been a small decline in the balance of supply and demand with the overall proportion who now say there are more tenants than properties falling from 73% to 72%. This decline is reflected in the Rest of the South East and the Rest of the UK but not in Prime Central London where, contrastingly, the proportion saying that there are more tenants than properties has risen quite sharply from 73% to 83%. Proportion Saying There Are Geographic More Tenants than Properties (%) Area Q1.10 Q2.10 Q3.10 Q4.10 Prime Central London South East Rest of UK All Regions Base: All respondents (531) (570) (454) (554) As the chart below shows, the large decline during 2008 in the proportion of respondents saying that there are more tenants than properties bottomed out during the first half of 2009 before bouncing back strongly to reach its highest ever level three months ago. However, the decline seen this time, the first for more than a year, may mark the beginning of a change to this trend. Looking at changes for each of the broad geographic areas over the last six years, as can be seen from the chart below, the most dramatic changes have taken place in Prime Central London where the proportion of respondents saying that there are more tenants than there are properties available for them rose massively, from a low of 6% in the last quarter of 2002 to 72% in the second quarter of 2007 after which it fell back even more dramatically to 6% in the last quarter of 2008 before Page 39

40 starting to rise again and it has now reached its highest ever figure at 83%. In the Rest of the South East, the figure also rose, though not as dramatically, growing nearly sixfold from a low of 10% in the last quarter of 2003 to a high of 59% in the Spring of The huge fall during the second half of 2008 placed the Rest of the South East in a similar situation to the rest of the country where it remained until six months ago when it again took the lead. However, the reduction seen this quarter now puts it in second place behind Prime Central London. In the Rest of the UK, whilst the figure remained relatively steady at between 30% and 40% for most of the period between 2002 and 2008, it too declined sharply in the second half of 2008 before bouncing back in 2009 and proceeding to reach a new high each quarter until this quarter when it declined for the first time in more than a year. Given the mixed fortunes seen with the results from this quarter, it is difficult to be certain but it may be that the strong upward trend seen over the last year and a half may have come to an end. Regional Analysis The balance of supply and demand in terms of the percentage of respondents saying there are more tenants than there are properties for them is clearly tilted much more in favour of residential landlords in the south of the country, particularly in the South East (excluding Central London). This is evident from the chart below which shows the three quarter moving average proportion of respondents saying there are more Page 40
 Region (three quarter moving average) Q3.10 Q4.10 Central London 66.3 70.3 Rest of London 76.4 82.6 Rest of South East 72.8 76.")
41 tenants than properties although Central London does appear to be an exception to the rule. Proportion Saying There Are Geographic More Tenants than Properties (%) Region (three quarter moving average) Q3.10 Q4.10 Central London Rest of London Rest of South East South West Midlands North West North East Scotland/Wales/NI Base: All respondents (454) (554) Compared with the three quarter moving average figures from three months ago, there has clearly been a strengthening of demand from prospective tenants for rented properties across the whole country with increases in the figures for every region. Page 41
 More than seven out of ten respondents (71%) say that the average length of a tenancy is between 13 and 24 months with the largest proportion (42%) saying it is between 13 and 18 months.")
42 4.9 Average Length of Continuous Stay in Property (Q.10) More than seven out of ten respondents (71%) say that the average length of a tenancy is between 13 and 24 months with the largest proportion (42%) saying it is between 13 and 18 months. Based on these figures, tenants tend to stay in the same property for an average of 18.2 months. Average Length of Percent of Respondents (%) Continuous Stay Prime Rest Rest All London of SE of UK Regions 6 to 9 months to 12 months to 18 months to 24 months More than 24 months Don't know Not stated Base: All respondents (111) (210) (233) (554) The average time a tenant stays in the same property is longest for Prime Central London at 19.2 months compared with 18.6 months for the Rest of the South East and 17.4 months for the Rest of the UK. Geographic Average Continuous Stay (months) Area Q1.10 Q2.10 Q3.10 Q4.10 Prime Central London South East Rest of UK All Regions Base: All respondents (531) (570) (454) (554) Page 42
 and this is reflected in the figures for those managing properties in Prime Central London (up from 18.2 to 19.2 months) and the Rest of the UK (up from 16.8 to 17.")
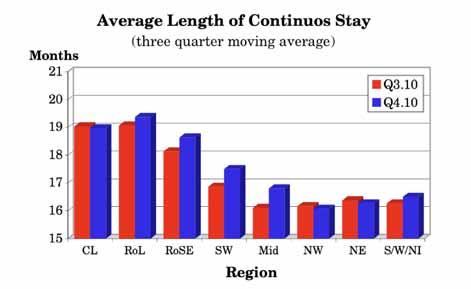
43 Compared with the last survey, there has been an increase in the average length of a tenancy (up from 17.8 to 18.2 months) and this is reflected in the figures for those managing properties in Prime Central London (up from 18.2 to 19.2 months) and the Rest of the UK (up from 16.8 to 17.4 months) but the average for the Rest of the South East was unchanged at 18.6 months. As can be seen from the chart below, the overall average length of stay in a property has been on a gently rising long term trend for some time with the increase seen this quarter correcting the fall seen three months ago and taking the figure to its highest ever level. Regional Analysis As with most of the other regional analysis of results from this survey, there is a clear progression as one moves away from London. In this case, looking at the three quarter moving average figures, the progression is from relatively long continuous stays of 19 months in Central London and the Rest of London to a relatively short stay of 16 months in the North East, the North West and Scotland, Wales & Northern Ireland. Geographic Region Page 43 Average Continuous Stay (months) (three quarter moving average) Q3.10 Q4.10 Central London Rest of London Rest of South East South West Midlands North West North East Scotland/Wales/NI Base: All respondents (454) (554)
44 Page 44
45 4.10 Change in Achievable Rent Levels Over Last 6 Months (Q.11) Whole Country In the case of each of the listed property types, between 46% and 60% of ARLA members offices believe that achievable rent levels have increased over the last six months whilst only between 7% and 10% believe they have fallen. Percent of Respondents (%) Response Det Semi Terr Conv PB Studio House House House Flat Flat Flat Increased a lot Increased a little Stayed the same Decreased a little Decreased a lot Don't know Not stated Base: All respondents (554) These figures tend to suggest that, on average, achievable rent levels have increased significantly over the past six months. Prime Central London Within the overall figures, the situation in Prime Central London is a little stronger than average with between 47% and 83% saying that achievable rent levels for each type of property have risen. The proportions who think achievable rent levels in Prime Central London have decreased are a little lower than those for the whole country with only between 2% and 6% saying they think this is the case. Percent of Respondents (%) Response Det Semi Terr Conv PB Studio House House House Flat Flat Flat Increased a lot Increased a little Stayed the same Decreased a little Decreased a lot Don't know Not stated Base: All respondents (111) It would appear from these figures that, on average, achievable rent levels in Prime Central London have also increased significantly over the past six months. Page 45
46 Rest of the South East With regard to the Rest of the South East, the picture is similar to that for the whole country with between 50% and 67% of respondents saying that achievable rent levels have increased compared with between 3% and 8% saying they have decreased. Percent of Respondents (%) Response Det Semi Terr Conv PB Studio House House House Flat Flat Flat Increased a lot Increased a little Stayed the same Decreased a little Decreased a lot Don't know Not stated Base: All respondents (210) These figures tend to suggest that achievable rent levels in the South East have increased significantly in the last six months. Rest of the UK For the Rest of the UK, the position is less favourable than that for the whole country with between 31% and 56% of offices say that achievable rent levels for each type of property have increased compared with between 9% and 17% saying rent levels have decreased over the last six months. Percent of Respondents (%) Response Det Semi Terr Conv PB Studio House House House Flat Flat Flat Increased a lot Increased a little Stayed the same Decreased a little Decreased a lot Don't know Not stated Base: All respondents (233) Nevertheless, it appears from these figures that achievable rent levels in the Rest of the UK have increased considerably over the last six months. Page 46
 Area Det Semi Terr Conv PB Studio House House House Flat Flat Flat Prime Central London 46.8 55.9 67.6 77.5 82.")
47 Summary The table and chart below show the proportion of ARLA members offices from each geographical area who say they believe achievable rent levels have increased over the last six months for each type of property. Percent Saying Achievable Rents Levels Geographic Have Increased (%) Area Det Semi Terr Conv PB Studio House House House Flat Flat Flat Prime Central London Rest of the South East Rest of the UK Whole country Base: All respondents (554) Compared with three months ago, the average proportion of respondents saying achievable rents across all property types have increased has changed little falling only marginally from 55.1% to 54.7%. Percent Saying Achievable Rents Geographic Have Increased (%) Area Q1.10 Q2.10 Q3.10 Q4.10 Prime Central London Rest of the South East Rest of the UK All regions Base: All respondents (531) (570) (454) (554) As between the broad geographic areas, the average proportion of respondents managing properties in Prime Central London who say achievable rent levels across all property types have increased is up from 63% to 66% but the average for the Rest of the South East is down from 64% to 61%, whilst that for the Rest of the UK has remained constant at 44%. Page 47

48 Having been fairly settled at around 32% until the last quarter of 2005, the figure for the overall average proportion of respondents saying that achievable rent levels have risen increased steadily during 2006 and 2007 and into early However, the proportion of respondents in the second quarter of 2008 saying that achievable rent levels had increased fell from 56% to 53% and this was followed by three successive big declines with another smaller decline in the following quarter. As a result, between the first quarter of 2008 and the second quarter of 2009, the figure fell from 56% to 7%. From mid 2009, however, the figure rose steadily to reach 55% three months ago before levelling off with the results from this survey. Regional Analysis Looking at the three quarter moving averages for each region within the UK, the proportion of respondents saying that achievable rent levels in their region have increased is highest for respondents in Central London (65%) and lowest for the those in the Midlands (35%). As can be seen quite clearly from the chart below, the proportion of respondents saying that achievable rent levels have increased declines as one moves away from London but seems to rise again a little as one moves north of the Midlands. Page 48

49 Percent Saying Achievable Rents Geographic Have Increased (%) Region (three quarter moving average) Q3.10 Q4.10 Central London Rest of London Rest of South East South West Midlands North West North East Scotland/Wales/NI Base: All respondents (454) (554) Compared with the second quarter survey, there has clearly been a further strong improvement in achievable rent levels across all regions with the improvement seeming to be strongest in the south of the country. Page 49
 Almost six out of ten ARLA members offices (59%) said that they had seen an increase in rental property coming onto the market because it could not be sold.")
50 4.11 Are You Seeing an Increase in Rental Property Coming Onto the Market Because It Cannot Be Sold? (Q.12) Almost six out of ten ARLA members offices (59%) said that they had seen an increase in rental property coming onto the market because it could not be sold. Percent of Respondents (%) Response Prime Rest Rest All London of SE of UK Regions Yes No Don't know Not stated Base: All respondents (111) (210) (233) (554) There were big differences between the broad geographic areas on this question with those managing properties in Prime Central London being the least likely to say they are seeing an increase in rental property coming onto the market because it cannot be sold (45%) and those in the Rest of the UK being the most likely to (67%) with those in the Rest of the South East falling between these two extremes (58%). Response Percent of Respondents (%) Q1.10 Q2.10 Q3.10 Q4.10 Yes No Don't know Not stated Base: All respondents (531) (570) (454) (554) Compared with the third quarter, there has been a further huge increase (from 34% to 59%) in the proportion saying they have seen an increase in rental property coming onto the market because it cannot be sold and a new upward trend is clearly becoming established. Page 50
.")
51 Regional Analysis The three quarter moving average figures for the individual regions making up the UK show that the North East is the region with the largest proportion of respondents (61%) saying that they are seeing an increase in rental property coming onto the market because it cannot be sold with Central London having the smallest proportion (20%). There appears to be a bias towards a higher proportion of respondents believing this to be the case the further away from London they are although the figures for Scotland, Wales & Northern Ireland are an exception to this. Geographic Percent of Respondents (%) Region (three quarter moving average) Q3.10 Q4.10 Central London Rest of London Rest of South East South West Midlands North West North East Scotland/Wales/NI Base: All respondents (454) (554) Compared with three months ago, a higher proportion of respondents in every region except the North West said that they had seen an increase in rental property coming onto the market because it cannot be sold. Page 51
52 4.12 For Which Types of property Are You Seeing an Increase in Rental Properties Coming Onto the Market Because They Cannot Be Sold? (Q.13) For those respondents who said they were seeing an increase in property coming onto the rental market because it could not be sold, the type of property which the highest proportion thought were increasingly coming onto the rental market because they could not be sold were detached houses (61%). These were followed by semi-detached houses (59%), terraced houses (49%) and purpose built flats/maisonettes (46%) with converted flats (34%) lagging some way behind but not as much as studio flats (16%) which respondents did not think were coming onto the rental market for this reason anything like as much as other property types. Type of Percent of Respondents (%) Property Prime Rest Rest All London of SE of UK Regions Detached houses Semi-detached houses Terraced houses Flats/maisonettes (conv) Flats/maisonettes (PB) Studio flats Base: All seeing increase (50) (122) (156) (328) There are some big differences in responses to this question as between each of the three broad geographic areas with respondents from offices managing properties in Prime Central London much less likely to think there has been an increase in houses of any description coming onto the rental market because they cannot be sold. When it comes to flats, however, there was more consistency across the broad geographic areas although there were still some quite marked differences. Type of Percent of Respondents (%) Property Q1.10 Q2.10 Q3.10 Q4.10 Detached houses Semi-detached houses Terraced houses Flats/maisonettes (conv) Flats/maisonettes (PB) Studio flats Base: All seeing increase (142) (107) (154) (328) Compared with the last survey in the third quarter of the year, the main changes are that this time noticeably higher proportions said they thought there had been an increase in terraced houses and converted Page 52

53 flats coming onto the market because they could not be sold and noticeably lower proportions said they thought semi-detached houses and purpose built flats were coming onto the market for this reason. Page 53
 Four out of ten ARLA members offices (40%) said that they had seen an increase in the number of tenants struggling to meet rental payments in the last six months.")
54 4.13 Have You Seen an Increase in the Number of Tenants Struggling to Meet Rental Payments in the Last 6 Months? (Q.14) Four out of ten ARLA members offices (40%) said that they had seen an increase in the number of tenants struggling to meet rental payments in the last six months. Percent of Respondents (%) Response Prime Rest Rest All London of SE of UK Regions Yes No Not stated Base: All respondents (111) (210) (233) (554) There was considerable difference between each of the three broad geographical areas on this question with respondents from offices which manage properties in Prime Central London being the least likely to think this was the case (28%) and those in the Rest of the UK being the most likely to do so (46%). Those from the Rest of the South East fell between the two but were close to the top end of the range (41%). Response Percent of Respondents (%) Q1.10 Q2.10 Q3.10 Q4.10 Yes No Not stated Base: All respondents (531) (570) (454) (554) Compared with the third quarter, there has been a rise (from 36% to 40%) in the proportion saying they have seen an increase in the number of tenants struggling to meet rental payments in the last six months and this is the first increase in the figure since the question was first asked eighteen months ago. Page 54
55 Regional Analysis With three exceptions all regions had broadly similar three quarter moving average proportions (between 38% and 44%) saying they had seen an increase in tenants struggling to meet rental payments in their area in the last six months. The exceptions were Central London where the three quarter moving average was 15% and, at the other end of the scale, the Midlands (56%) and the North East (57%). Geographic Percent of Respondents (%) Region (three quarter moving average) Q3.10 Q4.10 Central London Rest of London Rest of South East South West Midlands North West North East Scotland/Wales/NI Base: All respondents (454) (554) Compared with three months ago, all regions showed a lower proportion of respondents saying that they had seen an increase in the number of tenants struggling to meet rental payments in the last 6 months. Whilst these figures may seem to contradict the increase reported above for the country as a whole, it should be remembered that the figures here for individual regions are three quarter moving averages which are intended to iron out temporary fluctuations and reveal the underlying longer term trend. Page 55
 Less than one in eight ARLA members offices (12%) said that they were aware of an increase in tenants asking lenders for references on potential landlords to ensure they were financially viable.")
56 4.14 Are You Aware of an Increase in Tenants Asking Lenders for References on Potential Landlords to Ensure They Are Financially Viable? (Q.15) Less than one in eight ARLA members offices (12%) said that they were aware of an increase in tenants asking lenders for references on potential landlords to ensure they were financially viable. Percent of Respondents (%) Response Prime Rest Rest All London of SE of UK Regions Yes No Not stated Base: All respondents (111) (210) (233) (554) Respondents from offices which manage properties in Prime Central London were the most likely to have been aware of such an increase (15% compared with 10% for the Rest of the South East and 12% for the Rest of the UK). Response Percent of Respondents (%) Q1.10 Q2.10 Q3.10 Q4.10 Yes No Not stated Base: All respondents (531) (570) (454) (554) Compared with the last survey, there has been an increase in the proportion saying they are aware of an increase in tenants asking lenders for references on potential landlords with the figure rising from 10% to 12% and reversing the change seen then. Page 56

57 Regional Analysis There was a lot of variation between regions on this question and it bore little relation to how far away from London the region was. Nevertheless, the region with the highest three quarter moving average proportion of respondents aware of an increase in tenants asking for references on landlords was the North West (15.9%) whilst the region with the lowest proportion was Scotland, Wales & Northern Ireland (7.9%). The other regions varied quite widely between these two extremes. Percent Aware of Increase in Tenants Geographic Asking for References on Landlords (%) Region (three quarter moving average) Q3.10 Q4.10 Central London Rest of London Rest of South East South West Midlands North West North East Scotland/Wales/NI Base: All respondents (454) (554) Compared with the results from the last survey in the third quarter of the year, the main changes in the three quarter moving averages were increases for Central London (up from 11.5% to 13.8%), the South West (up from 9.0% to 11.5%) and the Midlands (up from 7.7% to 9.1%) and decreases for the North West (down from 18.8% to 15.6%) and Scotland, Wales & Northern Ireland (down from 10.2% to 7.9%). Page 57
58 4.15 Have You Seen an Increase in Tenants Haggling With Landlords Over Rents in the Last 6 Months? (Q.16) Nearly half of ARLA members offices (47%) said that they had seen an increase in tenants haggling with landlords over rents in the last six months. Percent of Respondents (%) Response Prime Rest Rest All London of SE of UK Regions Yes No Not stated Base: All respondents (111) (210) (233) (554) There was considerable difference between the broad geographic areas on this question with offices managing properties in Prime Central London being least likely to have encountered tenants haggling over the rent (40%, compared with 43% for the Rest of the South East and 55% for the Rest of the UK). Response Percent of Respondents (%) Q1.10 Q2.10 Q3.10 Q4.10 Yes No Not stated Base: All respondents (531) (570) (454) (554) Compared with the last survey, there has been an increase in the proportion of respondents saying they had seen an increase in tenants haggling with landlords over rents in the last six months with the figure rising from 45% to 47%. This is the first increase in the figure for more than a year. Page 58
 and the region with the lowest proportion was Central London (30%).")
59 Regional Analysis The region with the highest three quarter moving average proportion of respondents saying they had seen an increase in tenants haggling with landlords over rents in the preceding six months was the North East (64%) and the region with the lowest proportion was Central London (30%). The other regions varied between these two extremes with a tendency to increase with distance from London. Percent Who Have Seen an Increase in Tenants Geographic Haggling With Landlords Over Rents (%) Region (three quarter moving average) Q3.10 Q4.10 Central London Rest of London Rest of South East South West Midlands North West North East Scotland/Wales/NI Base: All respondents (454) (554) Compared with the three quarter moving average figures from the last survey, in all regions, a lower proportion said they had seen an increase in tenants haggling over rents in the preceding six months. Page 59
60 4.17 What Proportion of Potential/Existing Landlord & Tenant Clients Ask If You Are Licensed? (Q.17) Landlords More than a quarter of ARLA members offices (27%) said that at least some of their potential and existing landlord clients ask them if they are licensed with 6% saying that all or most of them do. However, a higher proportion, amounting to nearly four out of ten (37%), said that none of theirs do and more than a further third (35%) said that hardly any of theirs do. Percent of Respondents (%) Proportion Prime Rest Rest All London of SE of UK Regions All Most Some Hardly any None Not stated Base: All respondents (111) (210) (233) (554) There was little difference between the broad geographic areas on this question. Tenants When it comes to their potential or existing tenants, even fewer respondents said that theirs asked them if they were licensed with only a little more than one in eight (13%) saying that at least some of their potential and existing tenant clients ask them if they are licensed and only 1.3% saying that all or most of them do. Conversely, more than half (51%) said that none of theirs do and more than a further third (35%) said that hardly any of theirs do. Percent of Respondents (%) Proportion Prime Rest Rest All London of SE of UK Regions All Most Some Hardly any None Not stated Base: All respondents (111) (210) (233) (554) Again, as with the question about landlords, there was little difference between the broad geographic areas on this question. Page 60
 Landlords Tenants All 0.4 0.2 Most 5.4 1.1 Some 21.7 11.6 Hardly any 35.4 34.8 None 36.8 50.9 Not stated 0.")
61 Summary It would appear that few respondents potential and existing landlord and tenant clients ask them if they are licensed and whilst some clearly do ask this question, for the majority of respondents it comes up only very rarely, if at all. Proportion Percent of Respondents (%) Landlords Tenants All Most Some Hardly any None Not stated Base: All respondents (554) Looking at differences between landlords and tenants, it seems that landlord clients are more likely to ask the question with 27% of respondents saying at least some of them do compared with only half as many respondents (13%) saying that at least some of their tenant clients ask them this question. Compared with three months ago, as can be seen from the table and chart below showing the average for both landlords and tenants, there has been very little change. Proportion Average For Landlords & Tenants (%) Q2.10 Q3.10 Q4.10 All Most Some Hardly any None Not stated Base: All respondents (570) (454) (554) Page 61
 and the region with the lowest proportion was the South West (20%). The other regions varied between these two extremes.")
62 Regional Analysis The region with the highest proportion of respondents saying that at least some of their potential or existing landlord clients ask them if they are licensed was the North East (40%) and the region with the lowest proportion was the South West (20%). The other regions varied between these two extremes. With regard to potential or existing tenant clients, despite far fewer respondents saying that at least some of theirs ask the question, the highest proportion was in Scotland, Wales & Northern Ireland (21%) and the lowest in the Midlands (10%) Geographic Region Percent of Respondents Saying At Least Some Clients(%) Landlords Tenants Central London Rest of London Rest of South East South West Midlands North West North East Scotland/Wales/NI Base: All Respondents (554) The region showing the greatest difference between the proportion of landlords asking if respondents are licensed and the proportion of tenants doing so is the North East (40% compared with 17%) and the region showing the least difference is Scotland, Wales & Northern Ireland (28% compared with 21%). Page 62


63 Compared with three months ago, looking at the average for both landlords and tenants, there have been changes for all of the regions in the UK with some showing increases and some showing decreases but there does not appear to be any pattern to these changes. Geographic Percent of Respondents Saying Region At Least Some Clients (%) (Average for Landlords & tenants) Q2.10 Q3.10 Q4.10 Central London Rest of London Rest of South East South West Midlands North West North East Scotland/Wales/NI Base: All respondents (570) (454) (554) Page 63
64 4.18 Have You Seen an Increase in the Last 12 Months in the Proportion of Potential/Existing Landlord and Tenant Clients Asking if You Are Licensed? (Q.18) Less than one in ten ARLA members offices (9%) said that they had seen an increase in the proportion of landlord and tenant clients asking them if they are licensed in the last twelve months with the majority (81%) saying they had not. Percent of Respondents (%) Response Prime Rest Rest All London of SE of UK Regions Yes No Don't know/not sure Not stated Base: All respondents (111) (210) (233) (554) There was very little difference between the broad geographic regions on this question. Compared with three months ago, slightly more respondents said they had seen an increase in landlords and tenants asking if they are licensed with the figure rising from 8% to 9%, partially reversing the change seen then. Response Percent of Respondents (%) Q2.10 Q3.10 Q4.10 Yes No Don't know/not sure Not stated Base: All respondents (570) (454) (554) Regional Analysis Looking at differences between individual regions on this question, the region with the highest proportion saying they had seen an increase in the last 12 months of landlords and tenants are asking if they are licensed was Scotland, Wales & Northern Ireland (17%) and the regions with the lowest proportions were the Midlands, the South West and the North East (4%, 6% and 7% respectively). Page 64

65 Geographic Percent Who Have Seen an Increase in Landlords/ Region Tenants Asking if They Are Licensed (%) Q2.10 Q3.10 Q4.10 Central London Rest of London Rest of South East South West Midlands North West North East Scotland/Wales/NI Base: All respondents (570) (454) (554) Compared with three months ago, there have been some substantial changes, most notably, a decrease from 13% to 7% for the North East, a decrease from 10% to 6% for the South West, an increase from 6% to 9% for the Rest of the South East and a big increase, from 6% to 17% in Scotland, Wales & Northern Ireland. Page 65
 More than three quarters of ARLA members offices (76%) think that residential landlords are currently marking time with regard to their net investment in residential property.")
66 4.19 How Are Landlords Currently Acting Over Their NET Investment in Residential Property (Q.19) More than three quarters of ARLA members offices (76%) think that residential landlords are currently marking time with regard to their net investment in residential property. Whilst more than one in ten (11%) think landlords are increasing their net investment by buying more properties, just as many think landlords are decreasing their net investment by selling properties. How Landlords Percent of Respondents (%) Are Currently Prime Rest Rest All Acting London of SE of UK Regions Buying Marking time Selling Not stated Base: All respondents (111) (210) (233) (554) Looking at the broad geographic areas there are some differences with more of those in the Rest of the UK believing that landlords are buying than believe they are selling (13% saying they are buying compared with 10% saying they are selling). Compared with this, for those managing properties in Prime Central London, a higher proportion believe that landlords are selling than think they are buying (only 11% say they are buying compared with 15% saying they are selling). The distribution of responses for those in the Rest of the South East falls between these two extremes with a slightly higher proportion saying landlords are selling than say they are buying (10% say landlords are buying compared with 11% saying they are selling). Page 66

67 How Currently Percent of Respondents (%) Acting Q1.10 Q2.10 Q3.10 Q4.10 Buying Marking time Selling Not stated Base: All respondents (531) (570) (454) (554) Compared with three months ago, there has been little change in the proportion saying landlords are buying but the proportion saying landlords are selling properties has fallen quite sharply from 17% to 12% with a consequent increase in the proportion saying they are making time (up from 70% to 76%). As the graph below shows, during the autumn of 2005, the relationship between the proportion believing that landlords are buying properties and the proportion believing they are selling properties reversed. However, in the second quarter of 2007, this reversed again with a higher proportion of respondents saying landlords were selling properties than said they were buying properties. At the beginning of 2009, the relationship between these figures reversed again and the changed relationship was maintained for the rest of However, the results from the first quarter 2010 survey closed the gap and whilst the results from the following survey saw the proportion selling outstripping the proportion buying by quite a large margin, the results from the last two surveys have moved the situation back to a more balanced picture. Regional Analysis There was quite a wide variation between the regions on this question with those showing the greatest difference between the proportion Page 67
 Region Buying Selling Central London 8.2 9.8 Rest of London 7.4 16.")
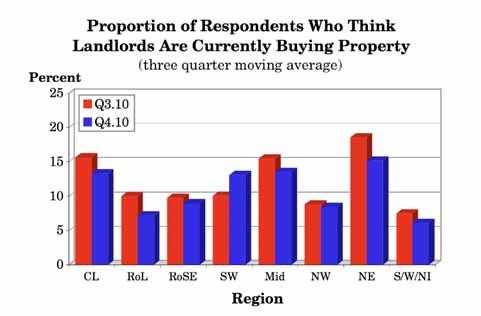
68 saying landlords are buying and those saying they are selling being the Rest of London, where 7% said landlords were buying but 16% said they were selling and, in the opposite direction, the North East, where 17% said landlords were buying with only 3% said they were selling. Geographic Percent of Respondents Q4.10 (%) Region Buying Selling Central London Rest of London Rest of South East South West Midlands North West North East Scotland/Wales/NI Base: All respondents (554) Compared with three months ago, it would appear that in all regions of the country with the exception of the South West, fewer respondents now think landlords are currently buying properties. Percent Saying Landlords Geographic Are Currently Buying (%) Region (three quarter moving average) Q3.10 Q4.10 Central London Rest of London Rest of South East South West Midlands North West North East Scotland/Wales/NI Base: All respondents (454) (554) Page 68
69 Page 69
 More than four out of ten ARLA members offices (42%) think that the current buoyancy in the rental market will last for between one and two years but more than a further quarter (26%) think it")
70 4.20 How Long Will the Current Buoyancy in the Rental Market Continue (Q.20) More than four out of ten ARLA members offices (42%) think that the current buoyancy in the rental market will last for between one and two years but more than a further quarter (26%) think it will last longer than this with only less than one in eight (12%) thinking it will last less than a year. Analysing the response to this question produces an overall average length of time during which the current buoyancy in the market is expected to continue of 1.8 years. Percent of Respondents (%) How Long Prime Rest Rest All London of SE of UK Regions Less than 1 year Between 1 and 2 years More than 2 years Don't know/not sure Not stated Base: All respondents (111) (210) (233) (554) Looking at the broad geographic areas there are considerable differences with those in Prime Central London being most likely to think that the current buoyancy in the market will last less than a year (18% compared with 14% in the Rest of the South East and 8% in the Rest of the UK) and least likely to think it will last more than two years (14% compared with 22% in the Rest of the South East and 36% in the Rest of the UK). Averages calculated from these figures are 1.5 years for Prime Central London, 1.8 years the Rest of the South East and 2.0 years for the Rest of the UK. Page 70
 Central London 1.4 Rest of London 1.5 Rest of South East 1.8 South West 1.9 Midlands 2.1 North West 2.")
71 Regional Analysis There was quite a wide variation between the regions on this question with the average length of time for which the current buoyancy in the market is expected to continue tending to rise as one moves away from London. Geographic Region Q4.10 Average Length of Time (years) Central London 1.4 Rest of London 1.5 Rest of South East 1.8 South West 1.9 Midlands 2.1 North West 2.3 North East 2.1 Scotland/Wales/NI 2.0 Base: All respondents (544) Page 71
72 4.21 What Will Happen to Supply of, and Demand for Rental Property in 2011 (Q.21) Almost six out of ten ARLA members offices (59%) think that demand for rental property will continue to outstrip supply during 2011 with most of the rest (27%) saying that they think supply and demand will become more balanced. Only a few respondents (6%) said they thought that supply would begin to outstrip demand in Expected Percent of Respondents (%) Outcome Prime Rest Rest All London of SE of UK Regions Demand continue to outstrip supply Supply and demand more balanced Supply will begin to outstrip demand Don't know/not sure Not stated Base: All respondents (111) (210) (233) (554) Looking at the broad geographic areas, there was little difference between those managing properties in Prime Central London and those in the Rest of the South East with 63% and 61%, respectively, saying they thought demand would continue to outstrip supply. However, those in the Rest of the UK were considerably less likely to think this would be the case with only 54% saying they thought demand would continue to outstrip supply. Regional Analysis There was not a great deal of variation between the regions on this question with most regions having between 50% and 60% of respondents saying they thought demand would continue to outstrip supply in Page 72
 Q4.10 Central London 55.7 Rest of London 73.5 Rest of South East 59.9 South West 54.5 Midlands 52.9 North West 52.")
73 There was however, one exception in the form of the Rest of the South East where almost three quarters of respondents (74%) said they thought this would be the case. Geographic Percent of Respondents Saying Region Demand Will Outstrip Supply (%) Q4.10 Central London 55.7 Rest of London 73.5 Rest of South East 59.9 South West 54.5 Midlands 52.9 North West 52.5 North East 50.0 Scotland/Wales/NI 58.6 Base: All respondents (544) Page 73
 More than six out of ten ARLA members offices (61%) think that the quality of rental property will remain the same in 2011 but a substantial minority of more than a quarter (26%) said they")
74 4.22 How Will Quality of Rental Property Change in 2011 (Q.22) More than six out of ten ARLA members offices (61%) think that the quality of rental property will remain the same in 2011 but a substantial minority of more than a quarter (26%) said they thought the quality would improve with only a few (8%) saying they thought it would decline. How Percent of Respondents (%) Quality Will Prime Rest Rest All Change London of SE of UK Regions Improve Remain the same Decline Don't know/not sure Not stated Base: All respondents (111) (210) (233) (554) Looking at the broad geographic areas, the main difference is between the Rest of the UK and the other two areas with more of those in the Rest of the UK believing that the quality of rental property will improve in 2011 (31% compared with 23% in the Rest of the South East and 22% for Prime Central London). Regional Analysis With one exception, there was a fairly clear divide between the regions on this question with those in the north of the country all having a similarly high proportion of respondents saying they thought the quality of rental property would improve in 2011 (between 33% and 38%) and those in the south having a similarly low proportion (between 22% and 25%). The exception was the South West, which fell between the two Page 74
75 groups with 30% saying they thought the quality of rental property would improve in Geographic Percent of Respondents Saying Region Quality will Improve (%) Q4.10 Central London 23.0 Rest of London 22.1 Rest of South East 22.9 South West 30.3 Midlands 25.0 North West 37.5 North East 33.3 Scotland/Wales/NI 34.5 Base: All respondents (544) Page 75
 Almost four out of ten ARLA members offices (39%) think that more private landlords will enter the market during 2011 with only one in seven (14%) saying they think there will be an increased")
76 4.23 How Will the Number of Private Landlords Entering and Leaving the Market Change in 2011 (Q.23) Almost four out of ten ARLA members offices (39%) think that more private landlords will enter the market during 2011 with only one in seven (14%) saying they think there will be an increased number of private landlords leaving the market. However, almost a third of respondents felt that there would be no change in the number of private landlords entering and leaving the market (33%). Change in No. Percent of Respondents (%) Entering & Prime Rest Rest All Leaving Market London of SE of UK Regions More will enter More will leave No change Don't know/not sure Not stated Base: All respondents (111) (210) (233) (554) Looking at the broad geographic areas there are some differences with those in the Rest of the UK being most likely to believe that more private landlords will enter the market in 2011 (42% compared with 39% in the Rest of the South East and 35% in Prime Central London). Regional Analysis There was quite a wide variation between the regions on this question but they did not follow any clearly defined pattern. The regions with the Page 76
, Central London (33%) and the Midlands (35%).")
77 highest proportions of respondents saying they thought more private landlords would be entering the market in 2011 were the South West (49%) and the North West (45%) whilst those with the lowest proportions were the Rest of London (32%), Central London (33%) and the Midlands (35%). Geographic Percent of Respondents Saying Region More Landlords Will Enter the Market (%) (Average for Landlords & tenants) Q4.10 Central London 32.8 Rest of London 32.4 Rest of South East 40.6 South West 48.5 Midlands 35.3 North West 45.0 North East 40.0 Scotland/Wales/NI 41.4 Base: All respondents (544) Page 77
ARLA Members Survey of the Private Rented Sector
 Prepared for The Association of Residential Letting Agents ARLA Members Survey of the Private Rented Sector Second Quarter 2014 Prepared by: O M Carey Jones 5 Henshaw Lane Yeadon Leeds LS19 7RW June, 2014
ARLA Survey of Residential Investment Landlords
 Prepared for The Association of Residential Letting Agents & the ARLA Group of Buy to Let Mortgage Lenders ARLA Survey of Residential Investment Landlords March 2010 Prepared by O M Carey Jones 5 Henshaw
ASSOCIATION OF RESIDENTIAL LETTING AGENTS PRIVATE RENTED SECTOR REPORT
 ASSOCIATION OF RESIDENTIAL LETTING AGENTS PRIVATE RENTED SECTOR REPORT August 2015 For further information: Association of Residential Letting Agents Press Office 020 7566 9777 propertyprofessionals@lansons.com
LANDLORDS AND LENDERS ADAPT THEIR APPROACH
 John Heron Managing Director Mortgages, Paragon HIGHLIGHTS Landlords resize property portfolios Portfolio gearing falls to all-time low Specialist lenders take on growing role LANDLORDS AND LENDERS ADAPT
REAL ESTATE MARKET OVERVIEW 1 st Half of 2015
 REAL ESTATE MARKET OVERVIEW 1 st Half of 2015 With Comparisons to the 2 nd Half of 2014 September 4, 2015 Prepared for: First Bank of Wyoming Prepared by: Ken Markert, AICP MMI Planning 2319 Davidson Ave.
LANDLORDS CAUTIOUS AHEAD OF TAX CHANGES
 FEBRUARY 2017 Q4 2016 LANDLORDS CAUTIOUS AHEAD OF TAX CHANGES Despite turbulence in the Private Rented Sector (PRS) dating back to the Government s 2015 Summer Budget, Paragon Mortgages latest PRS Trends
Private Rented Sector Report
 Private Rented Sector Report March 2018 March 2018 PRS Report RENTAL SECTOR HOLDS STEADY IN MARCH Key Findings Demand from prospective tenants increased by eight per cent in March Supply of rental properties
Performance of the Private Rental Market in Northern Ireland
 Summary Research Report July - December Performance of the Private Rental Market in Northern Ireland Research Report July - December 1 Northern Ireland Rental Index: Issue No. 8 Disclaimer This report
Residential Planning & The NPPF
 Residential Planning & The NPPF Special Report May 2014 Prepared by Glenigan Established in 1973, Glenigan currently invests 3.1million and makes over a million research telephone calls per year to provide
Landlords Report. Changes, trends and perspectives on the student rental market.
 Landlords Report Changes, trends and perspectives on the student rental market. Summer 2015 2 Landlords Report Executive Summary 3 Letting Success 5 Rent price & portfolio changes 9 Attitudes about the
Housing Market Affordability in Northern Ireland
 Housing Market Affordability in Northern Ireland A report commissioned by the Northern Ireland Housing Executive and Chartered Institute of Housing from Professor Steve Wilcox, University of York The Regional
Rental Index. December 2017 (Q4 17)
") Rental Index December 2017 (Q4 17) Contents National rental trends 3 Data from offices trading over nine years 3 Data including new Belvoir offices 3 Summary for England 4 Summary for Scotland 5 Summary
Rental Index December 2017 (Q4 17) Contents National rental trends 3 Data from offices trading over nine years 3 Data including new Belvoir offices 3 Summary for England 4 Summary for Scotland 5 Summary
The Profile for Residential Building Approvals by Type and Geography
 The Profile for Residential Building Approvals by Type and Geography Key Points: ABS Building Approvals for Australia peaked back in October 2015. As we have frequently highlighted, approvals have subsequently
FACT INDEX Q INDEX SCORE Q
 The Financial Adviser Confidence Tracking () Index has been tracking financial adviser sentiment since 1995 based on the number of mortgages introduced to borrowers over the previous quarter. This figure
ASSOCIATION OF RESIDENTIAL LETTING AGENTS PRIVATE RENTED SECTOR REPORT
 ASSOCIATION OF RESIDENTIAL LETTING AGENTS PRIVATE RENTED SECTOR REPORT June 2016 For further information: Association of Residential Letting Agents Press Office 020 7566 9777 propertyprofessionals@lansons.com
A matter of choice? RSL rents and home ownership: a comparison of costs
 sector study 2 A matter of choice? RSL rents and home ownership: a comparison of costs Key findings and implications Registered social landlords (RSLs) across the country should monitor their rents in
House prices in the latest three months (March 2014 May 2014) were 2.0% higher than in the preceding three months (December February2014).
 were 2.0% higher than in the preceding three months (December February2014).") PROPERTY REPORT JULY 2014 House Prices Rightmove Not a huge jump this month according to Rightmove. Key points New seller asking prices at virtual standstill, up by just 0.1% (+ 272) this month More regions
PROPERTY REPORT JULY 2014 House Prices Rightmove Not a huge jump this month according to Rightmove. Key points New seller asking prices at virtual standstill, up by just 0.1% (+ 272) this month More regions
LANDLORDS DOWNBEAT DESPITE STRONG RENTAL MARKET
 John Heron Managing Director Mortgages, Paragon HIGHLIGHTS Rental market fundamentals strong Fewer landlords optimistic about portfolio prospects Buying intentions at lowest level ever LANDLORDS DOWNBEAT
Trends in Scottish Residential Lettings
 The Citylets Report Issue 1 Spring 2007 Trends in Scottish Residential tings A Tale of Three Cities Introduction citylets.co.uk is Scotland s original residential lettings portal advertising over 45,000
Rental Index. September 2018 (Q3 18)
") Rental Index September 2018 (Q3 18) Contents National rental trends 3 Data from offices trading over 10 years 3 Data including new Belvoir offices 3 Summary for England 4 Summary for Scotland 5 Summary
Rental Index September 2018 (Q3 18) Contents National rental trends 3 Data from offices trading over 10 years 3 Data including new Belvoir offices 3 Summary for England 4 Summary for Scotland 5 Summary
The road to recovery
 The road to recovery Belvoir Lettings releases five-year rental index report and reveals nationwide impact of credit crunch Belvoir Lettings, one of the UK s largest specialist residential lettings agencies,
nd Quarter Market Report
 2015 2 nd Quarter Market Report The voice of real estate in Central Virginia CAAR Member Copy Expanded Edition Charlottesville Area 2 nd Quarter 2015 Highlights: Closed sales in the Greater Charlottesville
Single Family Sales Maine: Units
 Maine Home Connection 19 Commercial St Portland, Maine 04101 MaineHomeConnection.com Office: (207) 517-3100 Email: Info@MaineHomeConnection.com For the fourth consecutive year, Maine home sales set a new
Private Rented Sector Report
 Private Rented Sector Report July 2018 July 2018 PRS Report RENTAL DEMAND AT THE HIGHEST LEVEL THIS YEAR Key Findings Demand from prospective tenants increased in July, to the highest level this year so
Landlord Survey. Changes, trends and perspectives on the student rental market.
 Landlord Survey Changes, trends and perspectives on the student rental market. vember 2016 2 Landlord Survey Summary 3 Letting success 6 Forecast 7 Market confidence 9 Student tenants 11 Rental arrears
ASSOCIATION OF RESIDENTIAL LETTING AGENTS PRIVATE RENTED SECTOR REPORT
 ASSOCIATION OF RESIDENTIAL LETTING AGENTS PRIVATE RENTED SECTOR REPORT November 2016 For further information: Association of Residential Letting Agents Press Office 020 7566 9777 propertyprofessionals@lansons.com
Contents SEPTEMBER 2009
 Contents Two Tier Market:...1 Overview & Commentary: The National Picture...2 Overview & Commentary: The Regional Picture...3 Overview & Commentary: Supply...3 Property Prices (National)...4 National Bedroom
Rental Index. March 2018 (Q1 18)
") Rental Index March 2018 (Q1 18) Contents National rental trends 3 Data from offices trading over 10 years 3 Data including new Belvoir offices 3 Summary for England 4 Summary for Scotland 5 Summary for
Rental Index March 2018 (Q1 18) Contents National rental trends 3 Data from offices trading over 10 years 3 Data including new Belvoir offices 3 Summary for England 4 Summary for Scotland 5 Summary for
Thames Gateway South Essex
 Thames Gateway South Essex Housing Market Trends Quarterly Report April 2010 House Prices, Affordability & Market Indicators Housing Market Trends Quarterly Report April 2010 Introduction This report monitors
UK OCCUPANCY SURVEY FOR SERVICED ACCOMMODATION JANUARY 2011
 Occupancy () UK OCCUPANCY SURVEY FOR SERVICED ACCOMMODATION Commissioned by the National Tourist Boards of England, Northern Ireland and Scotland and by Visit Wales (part of the Welsh Assembly Government)
TMW Rental Income Analysis Q4 2017
 TMW Rental Income Analysis Q4 2017 1 Gross Rental Income Analysis Q4 2017 - Methodology We asked landlords to self-select their annual gross rental income. This report outlines the results along with rental
NEW HOUSING PIPELINE Q REPORT. Published April Analysis of market conditions and prospects prepared by Glenigan.
 NEW HOUSING PIPELINE Q4 2016 REPORT Published April 2017 Analysis of market conditions and prospects prepared by Glenigan. NEW HOUSING PIPELINE Residential planning approvals increased during the fourth
Shadow inventory in Texas
 With the national and local real estate markets turning positive, questions remain about the shadow inventory that was supposed to be holding down the market. Concerns over shadow inventory re-entering
HomeLet Rental Index
 HomeLet Rental Index HomeLet is the UK s largest supplier of tenant referencing to the lettings industry. The HomeLet Rental Index shows agreed rental prices, from over 3,000 letting agents each month,
High Level Summary of Statistics Housing and Regeneration
 High Level Summary of Statistics Housing and Regeneration Housing market... 2 Tenure... 2 New housing supply... 3 House prices... 5 Quality... 7 Dampness, condensation and the Scottish Housing Quality
LSL New Build Index. The market indicator for New Builds March Political events
 LSL New Build Index The market indicator for New Builds March 2018 In the year to end February 2018 new build house prices rose on average by 9.7% across the UK which is up on last year s figure of 5.3%
PORTFOLIO VALUES PEAK
 John Heron Managing Director Mortgages, Paragon HIGHLIGHTS Average market value of property portfolio reaches 1.7 million Average portfolio now 6% higher than pre-crisis peak Landlords expect portfolio
RESIDENTIAL MARKET ANALYSIS
 RESIDENTIAL MARKET ANALYSIS CLANCY TERRY RMLS Student Fellow Master of Real Estate Development Candidate Oregon and national housing markets both demonstrated shifting trends in the first quarter of 2015
LSL New Build Index. The market indicator for New Builds September The New Build Housing Market
 LSL New Build Index The market indicator for New Builds September 2018 In the year to end Aug 2018 new build house prices rose on average by 5.1% across the UK which is down on last year s figure of 9.8%
2015 First Quarter Market Report
 2015 First Quarter Market Report CAAR Member Copy Expanded Edition Charlottesville Area First Quarter 2015 Highlights: Median sales price for the region was up 5.1% over Q1-2014, rising from $244,250 to
The Seattle MD Apartment Market Report
 The Seattle MD Apartment Market Report Volume 16 Issue 2, December 2016 The Nation s Crane Capital Seattle continues to experience an apartment boom which requires constant construction of new units. At
UNITED KINGDOM OCCUPANCY SURVEY. Serviced Accommodation Annual Report May the research solution
 UNITED KINGDOM OCCUPANCY SURVEY Serviced Accommodation Annual Report 2016 May 2017 the research solution INTRODUCTION This report presents a summary of the main findings from the UK Occupancy Survey for
Multifamily Market Commentary February 2017
 Multifamily Market Commentary February 2017 Affordable Multifamily Outlook Incremental Improvement Expected in 2017 We expect momentum in the overall multifamily sector to slow in 2017 due to elevated
Volume Title: Well Worth Saving: How the New Deal Safeguarded Home Ownership
 This PDF is a selection from a published volume from the National Bureau of Economic Research Volume Title: Well Worth Saving: How the New Deal Safeguarded Home Ownership Volume Author/Editor: Price V.
17 th January 2014 RENT RISES SLOW BY HALF OVER COURSE OF 2013
 17 th January 2014 RENT RISES SLOW BY HALF OVER COURSE OF 2013 Rents rise 1.5% annually, down from 3.2% rise twelve months ago After a 1% monthly fall, average rent in England and Wales now stands at 745
PROPERTY BAROMETER Residential Property Affordability Review The recently improving Housing Affordability trend stalled in the 1 st quarter of 2017
 21 June 2017 MARKET ANALYTICS AND SCENARIO FORECASTING UNIT JOHN LOOS: HOUSEHOLD AND PROPERTY SECTOR STRATEGIST FNB HOME LOANS 087-328 0151 john.loos@fnb.co.za LIZE ERASMUS: STATISTICIAN 087-335 6664 lize.erasmus@@fnb.co.za
3 November rd QUARTER FNB SEGMENT HOUSE PRICE REVIEW. Affordability of housing
 3 November 2011 3 rd QUARTER FNB SEGMENT HOUSE PRICE REVIEW JOHN LOOS: HOUSEHOLD AND PROPERTY SECTOR STRATEGIST 011-6490125 John.loos@fnb.co.za EWALD KELLERMAN: PROPERTY MARKET ANALYST 011-6320021 ekellerman@fnb.co.za
Data Note 1/2018 Private sector rents in UK cities: analysis of Zoopla rental listings data
 Data Note 1/2018 Private sector rents in UK cities: analysis of Zoopla rental listings data Mark Livingston, Nick Bailey and Christina Boididou UBDC April 2018 Introduction The private rental sector (PRS)
The Corcoran Report 4Q16 MANHATTAN
 The Corcoran Report 4Q16 MANHATTAN Contents Fourth Quarter 2016 4/7 12/23 3 Overview 8 9 10 Market Wide 11 Luxury 24 2 Sales / Days on Market 3 Inventory / Months of Supply 4 5 Market Share Resale Co-ops
CONSUMER CONFIDENCE AND REAL ESTATE MARKET PERFORMANCE GO HAND-IN-HAND
 CONSUMER CONFIDENCE AND REAL ESTATE MARKET PERFORMANCE GO HAND-IN-HAND The job market, mortgage interest rates and the migration balance are often considered to be the main determinants of real estate
Characteristics of Recent Home Buyers
 Characteristics of Recent Home Buyers Special Studies, February 1, 2019 By Carmel Ford Economics and Housing Policy National Association of Home Builders Introduction To analyze home buyers NAHB uses the
Australian home size hits 22-year low
 Australian home size hits 22-year low CommSec Home Size Trends Report Economics November 16 2018 The average floor size of an Australian home (houses and apartments) has fallen to a 22-year low. Data commissioned
2017 Q1 PROPERTY MARKET REPORT
 2017 Q1 PROPERTY MARKET REPORT OVERVIEW Whilst Q1 of 2016 was a strong start, the forecast for Q1 of 2017 was a little different. Initial predictions suggested 2017 would bring uncertainty caused by the
Buy-to-Let Index Scotland
 Buy-to-Let Index Scotland Under embargo until 00:01 Wednesday 24 th February 2016 January 2016 Scotland s tenants move back into the black Six-month low for late rent, with only 11.1% of January rent falling
UNITED KINGDOM OCCUPANCY SURVEY. Serviced Accommodation Summary Report March the research solution
 UNITED KINGDOM OCCUPANCY SURVEY Serviced Accommodation Summary Report March 2014 the research solution UK OCCUPANCY SURVEY This study has been commissioned by the National Boards of England, and Scotland
The Impact of Market Rate Vacancy Increases Eleven-Year Report
 The Impact of Market Rate Vacancy Increases Eleven-Year Report January 1, 1999 - December 31, 2009 Santa Monica Rent Control Board April 2010 TABLE OF CONTENTS Summary 1 Vacancy Decontrol s Effects on
Luxury Residences Report First Half 2017
 Luxury Residences Report First Half 2017 YEAR XIV n. 1 October 2017 1 Luxury Residences Report: First Half 2017 Introduction Introduction and methodology 2 Luxury Residences Report: First Half 2017 Introduction
Summary. Houston. Dallas. The Take Away
 Page Summary The Take Away The first quarter of 2017 was marked by continued optimism through multiple Texas metros as job growth remained positive and any negatives associated with declining oil prices
Cost of owning and running a home at highest level since 2008
 This is the annual Halifax review of the cost of owning and running a home. The review is compiled using a range of official statistics, including the ONS Family Spending Survey, DCLG and Halifax's own
1 February FNB House Price Index - Real and Nominal Growth
 1 February 2017 MARKET ANALYTICS AND SCENARIO FORECASTING UNIT JOHN LOOS: HOUSEHOLD AND PROPERTY SECTOR STRATEGIST 087-328 0151 john.loos@fnb.co.za THEO SWANEPOEL: PROPERTY MARKET ANALYST 087-328 0157
Housing and Construction Quarterly
 New Zealand Housing and Construction Quarterly March 2015 Contents 2 Quarterly Highlights Housing Market 3 House Values by Region 4 Rents by Region 5 Rents by Bedroom and Region 6 Price and Rent Comparisons
Asking Price Index Released 12/02/16 February 2016
 EMBARGOED UNTIL 12/02/16 HOME.CO UK ASKING PRICE INDEX February 2016 Released: 12/02/2016 1 of 6 Asking Price Index Released 12/02/16 February 2016 England Prices Take a Spring Leap Headlines England prices
Impact of welfare reforms on housing associations: Early effects and responses by landlords and tenants
 Impact of welfare reforms on housing associations: Early effects and responses by landlords and tenants For the National Housing Federation February 2014 Legal notice 2014 Ipsos MORI all rights reserved.
The impact of the bedroom tax on stock management by social landlords March 2014
 The impact of the bedroom tax on stock management by social landlords March 2014 www.cihscotland.org If you have any questions about this survey please contact david.bookbinder@cih.org Tel: 0131 225 4544
Planning and Development Department Building and Development Permit Summary Report
 Planning and Development Department 21 Building and Development Permit Summary Report February 22, 21 2 21 Building and Development Permit Summary Table of Contents Introduction... 3 Building Permits...
CITI HABITATS. Manhattan Residential Sales Market Report
 Manhattan Residential Sales Market Report Contents 4/7 12/17 3 8 9 10 Market Wide 4 Sales / Days on Market 5 / Months of Supply 6 7 Market Share Resale Co-ops Resale Condos New Developments 11 Luxury Neighborhoods
Hamilton Heights Manhattan. Morningside Heights Harlem
 Sutton Area TriBeCa Upper East Side Upper West Side Washington Heights West Village The Corcoran Report Battery Park City Beekman Carnegie Hill Central Park South Chelsea Flatiron Clinton East Harlem East
Asking Price Index Released 14/03/17 March 2017
 EMBARGOED UNTIL 14/03/17 HOME.CO UK ASKING PRICE INDEX March 2017 Released: 14/03/2017 1 of 6 Asking Price Index Released 14/03/17 March 2017 Demand Heads North as London Slumps Headlines A dose of spring
San Francisco Housing Market Update
 San Francisco Housing Market Update California Economic and Housing Market Outlook The national economy maintained a healthy growth rate in the first quarter of 2005 and appeared to be settling in for
August 2012 Design by Anderson Norton Design
 August 2012 Design by Anderson Norton Design 020 7336 6992 Property Data Report 2012 Introduction 1 Commercial property by comparison UK commercial property s value in 2011 reached 717 billion, helped
ESDS 31 st October 2011 Professor Paddy Gray and Ursula Mc Anulty University of Ulster
 ESDS 31 st October 2011 Professor Paddy Gray and Ursula Mc Anulty University of Ulster Twentieth century largely a period of decline rent controls, growth of owner occupation and large scale redevelopment
Volume II Edition III Mid Summer update
 The Realtors Canadians Trust www.arizonaforcanadians.com Volume II Edition III Mid Summer update In This Edition What is happening in the market today? Where is the market heading? The Buying Process Our
Volume II Edition I Why This is a Once in a Lifetime Opportunity for Investors
 www.arizonaforcanadians.com Volume II Edition I Why This is a Once in a Lifetime Opportunity for Investors In This Edition How to make great investment returns in a soft market U.S. Financing for Canadians
Complex Buy to Let Index Q2 2017
 Complex Buy to Let Index Q2 2017 This quarterly industry index tracks mortgage transaction data for Vanilla Buy to Let, Houses in Multiple Occupation (HMO), Multi-unit Freehold Blocks (MUFB) and Semi-Commercial
Seattle Housing Market Overview January 2019
 Seattle Housing Market Overview January 2019 A review of recent trends and thoughts about the future of the Seattle housing market. Bill King President, Chief Valuation Officer Real Info, Inc. City of
Twentieth century trends in farmland values
 Twentieth century trends in farmland values Farmland values have exhibited unprecedented increases in recent years. Nationwide, the compound annual rate of increase in farmland prices has been on the order
ANALYSIS OF THE CENTRAL VIRGINIA AREA HOUSING MARKET 1st quarter 2013 By Lisa A. Sturtevant, PhD George Mason University Center for Regional Analysis
 ANALYSIS OF THE CENTRAL VIRGINIA AREA HOUSING MARKET 1st quarter By Lisa A. Sturtevant, PhD George Mason University Center for Regional Analysis Economic Overview Key economic factors in the first quarter
Private Rented Sector Report
 Private Rented Sector Report January 2018 January 2018 PRS Report RENTAL MARKET STARTS 2018 ON THE BACK FOOT Key Findings The supply of rental properties fell by eight per cent from December to January,
Multifamily Market Commentary December 2018
 Multifamily Market Commentary December 218 Small Multifamily a Big Deal in Los Angeles Small multifamily properties those with five- to 5-units are getting more attention as an important source of affordable
THE TREND OF REAL ESTATE TAXATION IN KANSAS, 1910 TO 1942¹
 THE TREND OF REAL ESTATE TAXATION IN KANSAS, 1910 TO 1942¹ HAROLD HOWE². INTRODUCTION The purpose of this study is to show the trends of taxes on farm and city real estate in Kansas from 1910 to 1942 and
The buy-to-let market
 The buy-to-let market 16.1 Introduction...1 Fig 1: Buy-to-let & first time buyer mortgages, UK 2000-2006...1 16.2 Buy-to-let investors...2 Table 1: Number of buy-to-let sales, Cambridge sub-region (estimates),
SARETSKY. month in review j u ly re al es tate
 SARETSKY re al es tate month in review j u ly 2 0 1 8 It s more than just a summer heat wave impacting the prized Vancouver Real Estate market. A rough first half of 2018, which witnessed sales sink to
TOTAL VALUE OF UK HOUSING STOCK PASSES 6 TRILLION MARK
 NOT FOR BROADCAST OR PUBLICATION BEFORE 00.01 HRS ON WEDNESDAY 29 NOVEMBER 2017 In this review of the the UK Private Stock, Halifax tracks the value of private residential housing stock in the decade since
The Coldwell Banker Carlson Real Estate Market Report
 The Coldwell Banker Carlson Real Estate Market Report 2017 Year-End Stowe Area Report Our 2017 Year-End Market Report uses market-wide data, based on transactions that closed in 2017 in the Multiple Listing
Washington Market Highlights: Third Quarter 2018
 Washington State s Housing Market 3rd Quarter 2018 Washington Market Highlights: Third Quarter 2018 Existing home sales rose in the third quarter by 0.1 percent to a seasonally adjusted annual rate of
RISK REPORT. Rental Market. Research by Tenant Referencing and Insurance Agency, Landlord Secure September 2017
 Rental Market RISK REPORT Research by Tenant Referencing and Insurance Agency, Landlord Secure September 2017 Research conducted with 1,000 rental tenants and 1,000 landlords in the UK Introduction The
Economy. Denmark Market Report Q Weak economic growth. Annual real GDP growth
 Denmark Market Report Q 1 Economy Weak economic growth In 13, the economic growth in Denmark ended with a modest growth of. % after a weak fourth quarter with a decrease in the activity. So Denmark is
Up-to-date national trends in property prices and transactions
 Up-to-date national trends in property prices and transactions ***FOR IMMEDIATE RELEASE*** haart s National Housing Market Monitor May 2016 Sellers need to be realistic in setting prices in order to sustain
2011 Census Snapshot: Housing
 Update 2012-06 2011 Census Snapshot: Housing December 2012 Introduction On the 11 th December 2012, the Office for National Statistics released 2011 Census Key Statistics tables at Local Authority level.
Washington Market Highlights: Fourth Quarter 2018
 Washington State s Housing Market 4th Quarter 2018 Washington Market Highlights: Fourth Quarter 2018 Existing home sales fell in the fourth quarter by 2.7 percent to a seasonally adjusted annual rate of
Final 2011 Residential Property Owner Customer Survey
 TOP-LINE REPORT Final 2011 Residential Property Owner Customer Survey Prepared for: Prepared by: Malatest & Associates Ltd. CONTENTS SECTION 1: INTRODUCTION...3 1.1 Project Background... 3 1.2 Survey Objectives...
New Housing Pipeline. Quarterly report. December Analysis of market conditions and prospects prepared by Glenigan.
 New Housing Pipeline Quarterly report December 2010 Analysis of market conditions and prospects prepared by Glenigan. New Housing Pipeline December 2010 New Housing Pipeline A modest pick-up in the number
Our Housing Market Turns the Corner
 Our Housing Market Turns the Corner OUR HOUSING MARKET TURNS THE CORNER After a very difficult half decade characterized by falling sales and prices, a surge in foreclosures and many underwater homeowners,
MANHATTAN MARKET REPORT
 MANHATTAN MARKET REPORT Q1 MANHATTAN MARKET REPORT 1Q 2017 Manhattan s residential market is showing signs of improvement after a period of uncertainty leading up to the Presidential election, as it does
A review of average house prices and market size for Wirral postcodes from 2005 to Wirral Residential Property Market Report
 A review of average house prices and market size for Wirral postcodes from 2005 to 2015. Wirral Residential Property Market Report You won t have to look very far to find information about the property
Manhattan Rental Market Report Year End 2010
 Manhattan Rental Market Report Year End 2010 Table of Contents Introduction 3 A Quick Look 4 Mean Manhattan Rental Prices 5 Notable Trends 7 Manhattan Price Trends 7 Neighborhood Price Trends Upper West
2013 Year-End Market Report
 2013 Year-End Market Report The voice of real estate in Central Virginia CAAR Member Copy Expanded Edition Charlottesville Area Year-End 2013 Highlights: Yearly home sales in Greater Charlottesville were
The Corcoran Report 2Q 2018 MANHATTAN
 The Corcoran Report 2Q 218 MANHATTAN 2Q218 MANHATTAN 2 Overview Closed Sales 3,193-14 YEAR OVER YEAR +26 QUARTER OVER QUARTER Closed sales declined 14 annually versus Second Quarter 217. All product types
Profile of International Home Buyers in Florida
 Profile of International Home Buyers in Florida Research Division National Association of REALTORS 2009 Prepared for the Florida Association of REALTORS 2009 National Association of REALTORS Profile of
Housing Indicators in Tennessee
 Housing Indicators in l l l By Joe Speer, Megan Morgeson, Bettie Teasley and Ceagus Clark Introduction Looking at general housing-related indicators across the state of, substantial variation emerges but