LAND AND HOUSING SUPPLY. Douglas Fairgray, Director, Market Economics Ltd
|
|
|
- Jack Jackson
- 5 years ago
- Views:
Transcription

1 LAND AND HOUSING SUPPLY Douglas Fairgray, Director, Market Economics Ltd This paper addresses Land and Housing Supply, in the general context of what happens next in an economic down turn after an extended period of strong growth. There are several influences on short and longer term supply and demand, and I address four here: 1. The outlook for housing demand - short, medium and long term. 2. The geography of housing demand, which will drive supply issues and responses. 3. Auckland Case Study - Finding Enough Capacity for Growth. 4. Public sector involvement - affordable housing policies and development contributions. Issue #1 Outlook for Housing short, medium and long term. Macro economic factors the New Zealand housing market is driven by the mix of long term demography and economic growth, medium term structural shifts in society, and short-medium term trends and fluctuations, especially in economic conditions. Our perceptions tend to be dominated by the present, which places focus on the short-medium term shifts, and especially the current economic trough. This economic downturn has seen a fall in house prices, a drop in the value of the residential property estate (Figure 1), and a decline in housing market activity. FIGURE 1: HOUSE PRICES & VALUE OF HOUSING STOCK Source: Reserve Bank, Key Graphs April 2009/ 1
2 The number of new dwelling consents has fallen substantially (Figure 2), by May 2009 total volume was down 46% compared with the average of the period. FIGURE 2: NEW DWELLING CONSENTS ,000 30,000 25,000 UNITS 20,000 15,000 10,000 5,000 Apartments Other Dwellings YEAR ENDING MAY Source: Statistics NZ: / /building-consents-issued-may09-hotp.htm; and may07-hotp.htm At the same time, there has been a significant decrease in mortgage interest rates 1 and while the market remains conservative and slow, after several years of decline housing affordability has turned upward in the last 12 months. We have not yet seen a quantum shift in price expectations 2, and I do not expect such a shift. Rather, I would expect the market to remain slow, with some further easing of prices and not much change in interest rates over the next months the housing market will largely reflect the general economy, though with probably a greater fall in housing value from the peak in early 2008, as 10-12% may be knocked off prices 3. On the supply side, this slowness in the market will have three main effects: i. available land supply will not be taken up as quickly. However, the lower holding costs (finance) will help relieve pressure on land prices, such that substantial further falls in land prices are unlikely; 1 RBNZ figures show 6.44% for May 2009, compared with 10.7% in May 2008 and 9.9% in May QV.co.nz Housing Survey June 2009 indicated a net 21% of respondents expected further decline in values, while a net 38% consider now is a good time to buy. 3 RBNZ figures show a decline of 7.8% in the value of housing between Q and Q4 2008, while QVNZ data indicate a further drop of around 2.4% between October 2008 and April
3 ii. iii. the supply of new dwellings will remain below recent historic supply levels in the short term, with consequences for the construction sector in terms of employment, and especially downward pressure on prices; there may be more opportunities for brownfield development in main urban areas, as the rate of commercial development also remains relatively slow, and there is less competition for redevelopment sites. When the market does pick up again, there will be some pent-up demand, but likely a more conservative mindset about investment and willingness to pay, which will persist for some time after the economic fundamentals improve. There is likely to be also a longer term structural gain for first home buyers entering the market in the next 2-3 years, as the combination of lower prices and lower interest rates will see them pick up a relatively large slice of short term capital gains. The medium and long term fundamental drivers are unlikely to shift significantly. Even though new annual consents have fallen substantially to 2009, average dwelling size and value per sqm have continued to increase. The key demographic trend is obviously the ageing population and the advance of the baby boomers, together with the current/impending surge in household formation by the children of those boomers. Delaying that surge is the structural shift in demand arising from the introduction of tertiary education debt, which has delayed household formation and purchase of the first dwelling for many now in the workforce. Nevertheless, I do not expect that the current economic downturn will result in substantial changes to the underlying, long term trends in demand, or supply, apart from slowing activity in the short term. The long term trend is for steady demand growth, driven by the demographic fundamentals of population growth, household formation, and regular shifts by households to progress within the property market. Household projections indicate around 21-22,000 new households annually over the next decade, which implies underlying demand for around 22-24,000 additional dwellings annually, as well as replacements of existing stock. Predominantly, this will be demand for separate dwellings, in the larger urban areas. 3
4 Issue #2 The geography of housing demand. Given this, it is important to address the question of where this demand will be manifest, since this obviously will determine where supply issues are most likely to arise, and what those market responses are likely to be. Housing demand is heavily concentrated in the main urban areas, especially Auckland and Christchurch. Auckland accounts for around 46% of total national demand growth over the next decade with about 100,000 additional dwellings required in total, or about 10,000 dwellings annually. Canterbury is next, with 12% of the national total, somewhat over 26,000 additional dwellings over the decade, or about 2,600-2,800 annually. The other main areas of demand are Wellington (9%, 2,000 dwellings a year), Waikato (8.7%, 1,900-2,000 dwellings a year) and Bay of Plenty (7.1%, 1,500-1,600 dwellings each year), shown in Table 1. Simply, the largest 5 regions account for nearly 83% of total demand (Figure 1). Region TABLE 1: HOUSEHOLD GROWTH BY REGION Households (Medium) Share % Cumulative Share % Auckland 100, % 45.7% Canterbury 26, % 57.8% Wellington 19, % 66.8% Waikato 18, % 75.5% Bay of Plenty 15, % 82.6% Northland 7, % 86.3% Manawatu-Wanganui 7, % 89.5% Otago 6, % 92.6% Hawke's Bay 4, % 94.9% Taranaki 2, % 96.0% Tasman 2, % 97.0% Marlborough 1, % 97.9% Nelson 1, % 98.7% Gisborne 1, % 99.3% Southland % 99.7% West Coast % 100.0% TOTAL 218,730 Source: Statistics NZ Medium Population Projection (see Note 6) 4
5 FIGURE 3: PROJECTED HOUSEHOLD GROWTH BY REGION Auckland Canterbury Wellington Waikato Bay of Plenty Northland Manawatu-Wanganui Otago Hawke's Bay Taranaki Tasman Marlborough Nelson Gisborne Southland West Coast Source: Statistics NZ Medium Population Projection (see Note 6) Unsurprisingly, most of this demand is in the main urban areas. Growth is expected throughout the Auckland region, but with 8-9,000 dwellings annually in the four cities (Auckland, Manukau, North Shore and Waitakere), soon to be one SupaCiti. Much of this growth is targeted to be within the metropolitan urban limits or MUL. Canterbury s growth is predominantly in Greater Christchurch as defined in the Urban Development Strategy (UDS) with two thirds of the growth (16,000 dwellings) in Christchurch City, and one-third (8,000) on the urban fringe and towns (Rangiora, Kaiapoi). Wellington s growth is intended to be mostly in Wellington City (10,000), but also significant shares in Kapiti Coast and Lower Hutt (3,000 each). Similarly, for the Waikato read mostly in Hamilton urban area (8,000 dwellings) through outward expansion, and with some in surrounding towns (Cambridge, Te Awamutu) and rural areas. And in Tauranga and Western Bay of Plenty, most of the 12,000 or so dwellings will be accommodated through outward growth to the east (Papamoa), west (Omokoroa) and south (Tauriko). The largest 25 TAs account for 87% of total demand growth (Figure 2, see Appendix 1 Table 2). 5
6 TA TABLE 2: HOUSEHOLD GROWTH BY REGION AND TA Region Households (Medium) Share % Cumulative Share % Auckland City Auckland 30, % 14.1% Manukau City Auckland 26, % 26.4% North Shore City Auckland 13, % 32.7% Waitakere City Auckland 13, % 38.9% Rodney District Auckland 8, % 42.6% Franklin District Auckland 5, % 45.0% Papakura District Auckland 3, % 46.4% Christchurch City Canterbury 16, % 7.4% Waimakariri District Canterbury 4, % 9.2% Selwyn District Canterbury 3, % 10.8% Wellington City Wellington 9, % 4.5% Kapiti Coast District Wellington 3, % 6.0% Lower Hutt City Wellington 2, % 7.3% Hamilton City Waikato 8, % 3.7% Waikato District Waikato 3, % 5.1% Waipa District Waikato 2, % 6.1% Tauranga City Bay of Plenty 9, % 4.2% Western Bay of Plenty District Bay of Plenty 2, % 5.6% Rotorua District Bay of Plenty 2, % 6.6% Whangarei District Northland 4, % 2.1% Far North District Northland 2, % 3.4% Palmerston North City Manawatu-Wanganui 3, % 1.7% Dunedin City Otago 3, % 1.5% Hastings District Hawke's Bay 3, % 1.4% Queenstown-Lakes District Otago 2, % Source: Statistics NZ Medium Population Projection (see Note 6) 1.3% FIGURE 4: PROJECTED HOUSEHOLD GROWTH IN MAIN URBAN AREAS , ,000 80,000 FRINGE 60,000 40,000 20,000 URBAN - AUCKLAND CHRISTCHURCH WELLINGTON HAMILTON TAURANGA WHANGAREI PALMERSTON NTH DUNEDIN 6
7 Source: Statistics NZ Medium Population Projection (see Note 6) There is an important difference between the major urban areas Auckland, Christchurch, Wellington and the other regional cities. The regional cities like Hamilton and Tauranga are planning to accommodate their growth predominantly through outward expansion, with greenfield development on the existing urban fringes, and residential land taking over mainly farmland and rural lots. However, in Auckland, Christchurch and Wellington, the growth strategies are focussing on residential intensification within the existing metropolitan limits, with limited outward expansion, and a lower share of development in greenfield areas. This implies two substantial changes in the land market in those cities. One is a progressive shift in the nature of demand, toward a wider range of dwelling styles and especially toward medium and high density dwelling styles. Obviously, the drive for higher density means smaller private land area per household and per person, complicated by the parallel trend toward greater dwelling and indoor living space per person. The aim for the efficiencies of compact cities means a shift away from separate dwellings, toward multi-unit dwellings, and much greater built intensity on the land. This is consistent, to some degree, with declining average household sizes as the population ages. The second is a shift in how the land supply market will operate. A progressively smaller share of supply will come from relatively large greenfield reserves, while a progressively larger share of supply will come through the intensification process, and brownfield development. Intensification comes from a set of more complex processes. One is through decisions by individual residential property owners to subdivide an existing section, to fit on a second dwelling, or to sell it so that someone else can build. Another is also by individual property owners decisions to re-develop, and build themselves a new dwelling while also adding one or a few more dwellings, which usually involves a change from one separate house to 2-4 town houses or units. A key feature of these processes is that they occur at a small scale and arise from many individual ad hoc decisions. They are not usually part of an integrated or planned process, and are difficult to forecast in other than aggregate terms (eg assume 5% of existing developed residential properties in this area will add another dwelling over the next decade). A third process is re-development of business land to residential uses, which typically involves medium or high intensity residential because of the higher value of business land, and the higher costs involved in redevelopment as distinct from greenfield growth. Related to this is the process of 7
8 combining commercial and residential capacity on a single site, usually with apartments on the upper levels above offices. This combination of activities requires that both commercial and residential markets are sufficiently attractive to invest, especially the commercial which commonly accounts for the major part of mixed development. Residential development on business land typically involves a medium scale of residential capacity (apart from CBD apartments from office-block conversions). And these developments also tend to occur in an ad hoc manner as opportunity arises, rather than through comprehensive redevelopment over substantial areas 4. This means the delivery of residential supply in the two major centres of growth Auckland and Christchurch, accounting for close to 58% of total national demand is likely to be at progressively smaller scale and based on many individual decisions, as distinct from the typically larger scale which has characterised greenfield developments on the urban edge, in the past. Nevertheless, in the regional cities such as Tauranga and Hamilton, the pattern of incremental outward expansion through greenfield development, with comprehensive structure plans, staging and the like, will account for most residential growth into the medium term. 4 Notwithstanding some larger scale developments do occur where substantial land tracts have become available, such as the previous Ceramco site in New Lynn. 8
9 Issue #3 Auckland Case Study - Finding Enough Capacity for Growth. Auckland is where the main issues are expected in providing adequate land and housing supply. Market Economics and Harrison Grierson Ltd undertook a study in 2008 for the Department of Housing and Building 5 to address the question of the adequacy of Auckland Region s Residential Land Supply. The study addressed four questions: i. How does the land-supply process work? ii. iii. iv. How much vacant land is available for residential housing, where is it located, who owns it? Is there an adequate supply of land suitable for residential housing development? Are there rigidities or blockages in the land supply process that may be contributing to an inefficient use, allocation and rate of release of land, particularly for the development of higher density housing? Q1 - How does the land-supply process work? Land supply is governed by the overarching Growth Concept in the Auckland Regional Growth Strategy, which is based around the idea of a Compact City form, where growth is focused in and around centres and along transport corridors, and there is limited expansion at the urban borders. Auckland is constrained by the Metropolitan Urban Limit (MUL) divide between urban and rural uses, to protect the Region s natural and heritage resources. Implementation is through the LGAAA (2004) and RPS, with the Regional Growth Forum delivering the Growth Concept through the Northern, Central and Southern Sector Agreements. Extensions to the MUL are governed by a framework within the RPS. Extensions are limited so as not to compromise objectives for intensification and a compact city, and in practice are complex, difficult and take about 5 years to work through the consent process. Otherwise, within the MUL market forces of demand and supply operate. By constraining the total quantity of land supply, the MUL provides incentive for more efficient urban land use. There is evidence that as land supply is becoming increasingly constrained, this is likely to result in higher residential land prices throughout the city, and will potentially impact on housing affordability. The study concluded that regional and local authorities are facing increasingly difficult and complex challenges in achieving the goal of a compact city, and noted that: Adequate land supply implies a careful balancing act between constraining urban land supply, through the application of the MUL or similar regulation, on the one hand and a 5 Adequacy of the Auckland Region s Residential Land Supply / 9
10 measured approach to urban expansion on the other hand to avoid sharp spikes in land prices. (p2) It also noted the potential for market power to accrue to a limited number of land owners if they held back land from development to maintain prices at high levels. Q2 - How much vacant land is available for residential housing, where is it located, who owns it? As at June 2008, under current zoning regulations, development practices and market preferences, there is capacity for some 188,690 dwellings within the Auckland region (Figure 5). Vacant land accounts for only 13.4% (25,270 units) of Auckland s total available residential capacity. The Structure Plan areas have capacity for 34,200 units, 18.1% of total capacity, and much of this land is held by major land owners and developers, for a range of reasons. Capacity through infill and redevelopment of established residential areas accounts for 23,400 units (12.4%). The balance is in business areas (75,260 units or 39.9%) and rural areas (30,570, or 16.2%). FIGURE 5: AUCKLAND RESIDENTIAL CAPACITY BY SOURCE, ,000 DWELLING CAPACITY 60,000 50,000 40,000 30,000 20,000 10,000 Rural Business Areas Infill/ Redevelopment Structure Plan 0 Rodney North Shore Waitakere Auckland Manukau Papakura Franklin Vacant & Vacant Potential LOCAL AUTHORITY If the urban TAs focus on limiting infill and driving redevelopment, then greater capacity could be realised, to around 199,000 units or more if site aggregation and comprehensive redevelopment is facilitated. However, the estimate includes significant capacity in rural parts of the region which may not become available for general urban growth, due to market preferences and council policy response. Removal of the rural capacity would see regional total capacity at ,000 units. Moreover, while 77% of overall capacity is within the MUL, only 51% of capacity at conventional density (ie standalone houses on 400sqm or more of land) is within the MUL. Overall, conventional 10
11 density accounts for just over one-third of estimated capacity (35.7%), while medium density accounts for 19.2%, and high density a large share, at 45.1% (Table 3). TABLE 3: AUCKLAND DWELLING CAPACITY BY DENSITY CATEGORY AND LOCATION 2008 Location Conventional Medium Density High Density TOTAL Within MUL 34,300 33,300 78, ,600 Outside MUL 33,000 3,000 7,100 43,100 TOTAL 67,300 36,300 85, ,700 Within MUL 18.2% 17.6% 41.3% 77.2% Outside MUL 17.5% 1.6% 3.8% 22.8% TOTAL 35.7% 19.2% 45.1% 100.0% Source: DBH Adequacy of Auckland Region s Residential Land Supply, Table 3.10 p33 The distribution of capacity for conventional (400 sqm+ land area per unit), medium density ( sqm) and high density (<200 sqm) across the local authority areas is shown in Figure 6. FIGURE 6: AUCKLAND RESIDENTIAL CAPACITY BY DENSITY CATEGORY and TA 2008 DWELLING CAPACITY 60,000 50,000 40,000 30,000 20,000 10,000 0 High Density Medium Density Rodney North Shore Waitakere Auckland Manukau Papakura Franklin Rodney North Shore Waitakere Auckland Manukau Papakura Franklin Conventional Within MUL Outside MUL Source: DBH Adequacy of Auckland Region s Residential Land Supply, Table 3.10 p33 These figures indicate substantial pressure on residential growth in the Auckland region. Without a significant increase in capacity at conventional density (such as extension to the MUL), there needs to be significant change in market preferences towards intensive residential in order for the region s limited supply to be able to accommodate projected future growth. If all or some of the assumed rural capacity (30,570 units, including 49% of conventional capacity) does not become available, then the pressures on residential land supply within the MUL will be greater, and occur earlier. 11
12 Further, a high proportion of capacity (40%) lies within business areas. This is a second risk to residential supply, because of likely strong competition by commercial uses, and because it is generally higher density. To date, the higher density living environments have not been favoured by families with children, because of limited amenity and restricted housing style choices. Currently around 12% of the region s households reside within business areas, and this share would need to increase significantly for the region to achieve its Compact City goals. Q3 - Is there an adequate supply of land suitable for residential housing development? The medium population growth scenario sees some 210,600 additional households in the Auckland region by 2031 (or by 2025 under a high scenario) 6. Depending on the supply scenario chosen, this represents a supply shortfall of between 12,000 and 43,000 in 2031, with the most likely shortfall being around 22,000. Based on current zonings, the residential supply capacity will not meet the region s growth needs over the next 25 years. This raises concern about the quantum and composition of capacity. In Auckland, conventional density is the traditional housing choice. However, the Base Case scenario suggests that capacity for additional conventional density housing is likely to be exhausted by the early 2020s. In Auckland, North Shore and Manukau cities, land capacity for conventional density housing would be exhausted between 2015 and 2016, or in 7 to 8 years time. If there is no additional capacity for conventional housing provided on rural land, or population growth is faster than assumed, then the urban capacity would be consumed sooner than that. The implication is that significant changes in householders dwelling preferences - in favour of more intensive living and/or an increased supply of greenfield land - would be required in order to avoid shortfalls of conventional housing capacity in Auckland. Conventional economic thinking suggests that constrained land supply will raise prices and force the uptake of alternative housing choices, or alternative living locations. Either outcome has potentially significant economic and social consequences, which would need to be carefully assessed in relation to the supply limitations and changes to housing styles implicit in the current policy environment. To illustrate the potential outcomes in the medium term, I have examined three time periods, to , and , to indicate how location and housing preferences would need to change for Auckland to be able to accommodate projected growth. Figure 7 shows the situation for each local authority area in Auckland in the period. The left bar for each TA shows the underlying demand for additional households to reside in that TA, 6 Statistics NZ Medium Projection and High Projection
13 expressed in terms of conventional, medium density and higher density housing. The right bar for each TA shows the expected outcome, taking into account the capacity in every TA for each housing type, and allowing for households to switch between TAs if their first preference (TA/housing type combination) is not met. Thus, TAs such as Auckland City have an uptake which is less than underlying demand, because of capacity constraints. Others, such as Rodney District, show an uptake which is greater than underlying demand, as they accommodate growth whose preferences could not be met in other locations. FIGURE 7: AUCKLAND HOUSING DEMAND & UPTAKE ,000 14,000 12,000 High Density Medium Density Conventional 10,000 8,000 6,000 4,000 2,000 0 DWELLINGS Rodney North Shore Waitakere Auckland Manukau Papkura Franklin Source: DBH Adequacy of Auckland Region s Residential Land Supply, Table 5.5, p49 The main feature of Figure 7 is that the demand and uptake figures are reasonably close. This indicates that the underlying demand is reasonably well met, in terms of both TA location and housing type. Figure 8 shows the demand and uptake situation for the period. The pattern is quite different, because of supply constraints. 13
14 FIGURE 8: AUCKLAND HOUSING DEMAND & UPTAKE ,000 14,000 12,000 High Density Medium Density Conventional 10,000 8,000 6,000 4,000 2,000 0 DWELLINGS Rodney North Shore Waitakere Auckland Manukau Papkura Franklin Source: DBH Adequacy of Auckland Region s Residential Land Supply, Table 5.5, p49 In particular, the uptake is very much lower than underlying demand in Auckland City, as well as Manukau City and North Shore City. Auckland City accommodates the underlying demand for high density housing, but its demand for conventional and medium density housing is re-directed to other TAs which have remaining capacity for those housing types, notably Rodney District, but also Waitakere City, and Papakura and Franklin Districts. Quite simply, housing demand is unsatisfied, and demand is re-directed assuming in this instance that people prefer to meet their preferences for housing type, above their preference for location. Figure 9 shows the demand and uptake situation for the period. The pattern is again quite different, and again because of supply constraints. However, there is less disparity between underlying demand and eventual uptake in each TA, because there is reduced opportunity to satisfy housing type preferences in another location. In this situation, the market prefers to satisfy its locational preference, and take up a less preferred housing type. The overall outcome is that the supply constraint imposes a significant shift in the uptake of housing types. 14
15 FIGURE 9: AUCKLAND HOUSING DEMAND & UPTAKE ,000 16,000 14,000 High Density Medium Density Conventional 12,000 DWELLINGS 10,000 8,000 6,000 4,000 2,000 0 RDC NSC WCC ACC MCC PDC FDC Source: DBH Adequacy of Auckland Region s Residential Land Supply, Table 5.5, p49 Figure 10 shows the overall demand and uptake outcomes across the period. FIGURE 10: AUCKLAND HOUSING DEMAND & UPTAKE ,000 60,000 High Density Medium Density Conventional 50,000 DWELLINGS 40,000 30,000 20,000 10,000 0 Rodney North Shore Waitakere Auckland Manukau Papkura Franklin Source: DBH Adequacy of Auckland Region s Residential Land Supply, Table 5.5, p49 15
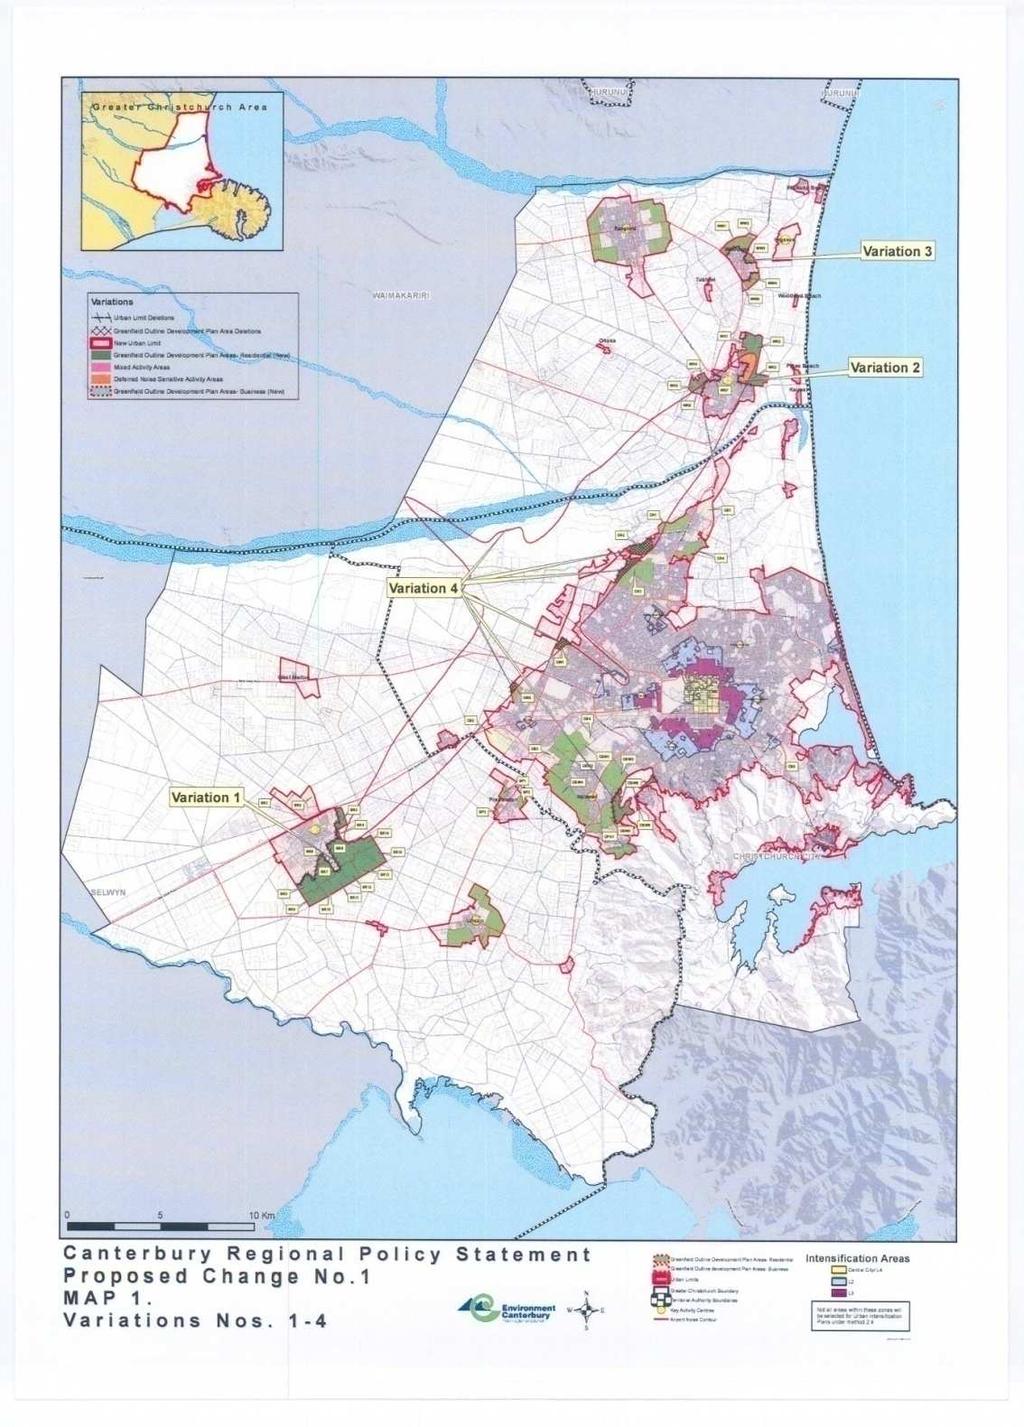
16 While over time, the uptake for each TA area is reasonably in line with underlying demand, this is only achieved through a substantial shift in housing type, whether from change in actual preferences or simply unavailability of the preferred housing type in the region. Either way, the constrained supply situation is likely to bring about significant shifts in the nation s largest housing market, in the medium term. Issue #3b Christchurch Situation Parallels? In Christchurch, the Urban Development Strategy currently being implemented through PC1 to the RPS has a comparable focus on achieving a compact city, albeit with a still substantial share of growth in neighbouring towns, and the rural hinterland. TABLE 4: CHRISTCHURCH UDS HOUSING GROWTH LOCATION Change Change % Share % Intensification Areas City Centre 17,640 20,640 24,640 31,630 13,990 79% 26% Rest of City 18,060 23,560 30,060 37,560 19, % 37% Ongoing Infill 93,620 93,620 93,620 93,620-0% 0% Total Intensification 129, , , ,810 33,490 26% 63% Christchurch City Greenfield - 6,510 14,100 19,680 19,680 na 37% Christchurch City TOTAL 129, , , ,490 53,170 41% 100% Source: Environment Canterbury Proposed Plan Change 1 Officer s Report 2009, p17. A feature of the UDS is that within Christchurch City, the major share of growth (63%) will be through intensification, in and around the central city (Table 4) with a lesser share (37%) through greenfield expansion. The UDS would see the population in the Christchurch city centre increase by nearly 80%, and that in the inner suburbs more than double by At the same time, greenfield expansion would be limited to some 19,680 dwellings. The proposed distribution of growth to 2041 is shown in the RPS Map (below), with the major shares of growth planned for the city centre (yellow on the map), and the surrounding inner suburbs (shaded light blue and maroon), together with the greenfield areas on the fringe (shaded green). In Christchurch, as in Auckland, a key issue is the likely response of the housing market (development sector and consumers) to the growth strategy, particularly the degree to which market preferences may change to take up the capacity at the significantly higher densities implied around the central city, while the balance of the city is at conventional densities. 16
17 17
18 Issue #4 Public Sector Involvement DCPs and Affordable Housing Finally, I wish to touch briefly on two areas where local authorities are involved in the housing and residential property markets, through Development Contributions Policies (under the LGA) and Affordable Housing policies. Both areas have potential to affect housing supply, and especially the cost of new housing. Development Contributions Policies. Many councils have introduced Development Contribution Policies under the LGA, with the aim of ensuring that growth households (mainly new dwellings) contribute to the costs of infrastructure required to service them. The plus side of development contributions is that good policies can act to share the funding load equitably across the community, and send accurate price signals to the residential property market, and other property markets. The negative side is that if development contributions policies are not well thought through and implemented accurately, then they can load a disproportionately high share of infrastructure costs on to growth, and effectively subsidise the existing residential estate, and distort the market. The general effect of this is to make new dwellings more expensive than they should be, and so act to dampen the supply side, and reduce affordability. A number of the DC policies which I have examined I consider do act to load disproportionately high costs on to growth, and so tend to artificially dampen new housing supply. The most common faults are that DCPs fail to take account of the funding contribution made by growth ratepayers to the costs of infrastructure provided for existing ratepayers, notably renewals and expenditure to improve levels of service. As a consequence, growth ratepayers end up subsidising existing ratepayers. This shows up through examination of the total amounts which growth and existing ratepayers each contribute to the costs of infrastructure over time. I note that the conventional wisdom in local authorities is that existing ratepayers subsidise growth, and the view that the cross-subsidy may be the other way is seldom popular, especially when it means that a more efficient outcome in terms of economic and social wellbeing would mean lower development contributions, and higher rates. Nevertheless, a built-in distortion likely to penalise the new housing market is not a desirable situation. Affordable Housing Policies 18
19 Finally, there is potential for local authorities to becoming directly involved in the housing market, through the introduction of policies to require provision of affordable housing, under the Affordable Housing: Enabling Territorial Authorities Act (2008). The Act enables direct, fundamental and long term involvement by territorial authorities in the New Zealand housing market. To date, there is considerable uncertainty as to the nature and level of territorial authority involvement under the Act, and whether affordability objectives are likely to be achieved through disparate policies at TA level often involving limited need for affordable housing. I believe one of the key issues is the capability of local authorities to develop and implement efficient and equitable affordable housing policies, given TAs lack of direct experience and often limited expertise in the overall operation of the housing market, and the commercial property development sector which would likely be required to contribute to affordable housing objectives. This does raise the prospect of poorly thought out policies having unintended and negative outcomes on the residential property market, especially where the costs to pay for affordable housing are loaded on to the construction and development sectors, and passed on to the customers of those sectors notably, purchasers of new dwellings. That could act to dampen the supply side, both through artificially raising the cost of new dwellings, and discouraging construction and development sector activity. In 2008, I presented evidence to the Queenstown Lakes District Council hearing on their proposed PC24 Affordable Housing, which was promulgated under the RMA, and is now is subject to appeal. I note that one of my key concerns is a basic premise underlying the plan change is that fully 35% of the total market growth in Queenstown over the next two decades will require affordable housing. I consider that a policy based on assuming that such a high share of the total market will require affordable housing is likely to place a very heavy impost on new property development, including the residential market and the commercial property sector. The key point in mentioning these aspects is that the prospect of such distortions having a negative effect on housing supply should not be ignored. Conclusions In summary, a number of challenges face housing and land supply. These arise predominantly from the fundamental drivers in the market especially the concentration of demand in Auckland and other major centres coupled with the underlying expectations of steady improvement in the quality of the living environment and some threats of unintended market distortion at the TA policy level, rather than the slowdown and readjustment caused by the global economic dip. Douglas Fairgray 19
20 8 July REFERENCES 1. Figure 1 p1 - Source: Reserve Bank, Key Graphs April 2009/ Fig4.html 2. Figure 2 p2 - Source: Statistics NZ: / and may07- hotp.htm 3. Ref 1 p2 - RBNZ figures show 6.44% for May 2009, compared with 10.7% in May 2008 and 9.9% in May / 3_MORTGAGE 4. Ref 2 p2 - QV.co.nz Housing Survey June 2009 indicated a net 21% of respondents expected further decline in values, while a net 38% consider now is a good time to buy / 5. Ref 3 p2 - RBNZ figures show a decline of 7.8% in the value of housing between Q and Q (/ 4_HOUSING); QVNZ data indicate a further drop of around 2.4% between October 2008 and April 2009 (QV Online Reports and Statistics, July / propertyvaluemap.htm) 6. Tables 1,2 and Appendix; Figures 3 & 4. TA Household projections derived from: i. Statistics NZ s Subnational Population Projections 2006 (base)-2031 (released on 3 December 2007) and Area Unit Population Projections 2006 (base)-2031 (released progressively in mid-2008); ii. Average population per household (at CAU level) projections from population and household projections ( Subnational Family and Household Projections 2001 (base) (released in October 2005) is the last time household projections were published. iii. Population per household from projections applied to new 2006-base population projections to give household projections. This assumes pop/household follows the same patterns as from the 2005 SNZ data. 7. Figures 5-10, Table 3. Department of Building and Housing, Adequacy of Auckland Region s Residential Land Supply, Harrison Grierson and Market Economics, September Table 4, Map 1. Environment Canterbury Proposed Plan Change 1 Officer s Report Queenstown Lakes District Council, Proposed Plan Change 24, Community and Affordable Housing; / 24-community-and-affordable-housing/ 20
21 APPENDIX 1 TABLE 1 : HOUSEHOLD GROWTH BY REGION Region Households Share % Cumulative Share % Auckland Region 100, % 45.7% Canterbury Region 26, % 57.8% Wellington Region 19, % 66.8% Waikato Region 18, % 75.5% Bay of Plenty Region 15, % 82.6% Northland Region 7, % 86.3% Manawatu-Wanganui Region 7, % 89.5% Otago Region 6, % 92.6% Hawke's Bay Region 4, % 94.9% Taranaki Region 2, % 96.0% Tasman Region 2, % 97.0% Marlborough Region 1, % 97.9% Nelson Region 1, % 98.7% Gisborne Region 1, % 99.3% Southland Region % 99.7% West Coast Region % 100.0% TOTAL 218,730 TABLE 2 : HOUSEHOLD GROWTH BY TERRITORIAL AUTHORITY TA Region Households Share % Cumulative Share % Auckland City Auckland Region 30, % 14.1% Manukau City Auckland Region 26, % 26.4% Christchurch City Canterbury Region 16, % 33.8% North Shore City Auckland Region 13, % 40.1% Waitakere City Auckland Region 13, % 46.3% Wellington City Wellington Region 9, % 50.8% Tauranga City Bay of Plenty Region 9, % 55.0% Rodney District Auckland Region 8, % 58.7% Hamilton City Waikato Region 8, % 62.4% Franklin District Auckland Region 5, % 64.7% Whangarei District Northland Region 4, % 66.8% Waimakariri District Canterbury Region 4, % 68.6% Palmerston North City Manawatu-Wanganui Region 3, % 70.3% Selwyn District Canterbury Region 3, % 72.0% Papakura District Auckland Region 3, % 73.4% Kapiti Coast District Wellington Region 3, % 74.9% Dunedin City Otago Region 3, % 76.3% Hastings District Hawke's Bay Region 3, % 77.8% Waikato District Waikato Region 3, % 79.2% Western Bay of Plenty Distri Bay of Plenty Region 2, % 80.5% Far North District Northland Region 2, % 81.9% Lower Hutt City Wellington Region 2, % 83.2% Queenstown-Lakes District Otago Region 2, % 84.5% Tasman District Tasman Region 2, % 85.6% Rotorua District Bay of Plenty Region 2, % 86.6% New Plymouth District Taranaki Region 2, % 87.6% Waipa District Waikato Region 2, % 88.6% Marlborough District Marlborough Region 1, % 89.5% Porirua City Wellington Region 1, % 90.3% Nelson City Nelson Region 1, % 91.1% 21
22 Source: Statistics NZ Medium Population Projection (see Note 6) 22
NZ house price index relative to peak
 Media release 11 th July 2011 Nationwide property values edge upwards The QV residential property index shows that nationwide values increased in June, driven largely by the Auckland market. Nationwide
Housing and Construction Quarterly
 New Zealand Housing and Construction Quarterly March 2015 Contents 2 Quarterly Highlights Housing Market 3 House Values by Region 4 Rents by Region 5 Rents by Bedroom and Region 6 Price and Rent Comparisons
National Policy Statement on Urban Development Capacity Price efficiency indicators technical report: Price-cost ratios
 National Policy Statement on Urban Development Capacity Price efficiency indicators technical report: Price-cost ratios Acknowledgements: SensePartners is acknowledged for the development of this technical
New Zealand Property Report. June
 New Zealand Property Report June 2016 The Overview Scarcity of houses for sale nationally creates sellers market. Realestate.co.nz statistics show demand and prices up, supply down. The average asking
Housing and. Construction. Quarterly. Contents 2 Quarterly Highlights. New Zealand. June Key Issues. A Tale of Two Housing Markets.
 New Zealand Housing and Construction Quarterly June 2014 Contents 2 Quarterly Highlights Housing Market 3 House Values by Region 4 Rents by Region 5 Rents by Bedroom and Price by TA 6 Price and Rent Comparisons
Report ER5 Can Work, Cannot Afford to Buy the Intermediate Housing Market
 External Research Report Issue Date: 31/08/2015 ISSN: 2423-0839 Report ER5 Can Work, Cannot Afford to Buy the Intermediate Housing Market Ian Mitchell Project LR0484 Livingston and Associates Ltd funded
New House Owners Satisfaction Survey
 Study Report SR374 [2017] New House Owners Satisfaction Survey Matthew Curtis 1222 Moonshine Rd RD1, Porirua 5381 Private Bag 50 908 Porirua 5240 New Zealand branz.nz The work reported here was funded
CHRANZ housing reports : A summary of the CHRANZ Reports in relation to the Auckland region
 CHRANZ housing reports 2003 2007: A summary of the CHRANZ Reports in relation to the Auckland region Prepared by Leilani Hall For the Social and Economic Research and Monitoring Team Auckland Regional
Housing and Construction Quarterly
 New Zealand Housing and Construction Quarterly September 2014 Contents Housing Market 2 House Values by Region 3 Rents by Region 4 Rents by Bedroom and Region 5 Price and Rent Comparisons 6 Housing Affordability
AND STATEMENT OF EVIDENCE OF DR JAMES DOUGLAS MARSHALL FAIRGRAY ON BEHALF OF CHRISTCHURCH CITY COUNCIL RESIDENTIAL INTENSIFICATION
 obefore THE CHRISTCHURCH REPLACEMENT DISTRICT PLAN INDEPENDENT HEARINGS PANEL IN THE MATTER of the Resource Management Act 1991 and the Canterbury Earthquake (Christchurch Replacement District Plan) Order
Social Housing (IRRS) Purchasing Intentions 15 April 2015
 Purchasing Intentions 15 April 2015") Social Housing (IRRS) Purchasing Intentions 15 April 2015 Social Housing Purchasing Intentions Page 1 Introduction The Social Housing Reform Programme is a cross-agency approach to improve the provision
Social Housing (IRRS) Purchasing Intentions 15 April 2015 Social Housing Purchasing Intentions Page 1 Introduction The Social Housing Reform Programme is a cross-agency approach to improve the provision
National Construction Pipeline Report 3 July 2015
 National Construction Pipeline Report 3 July 2015 Prepared by Table of contents 1 Introduction 6 1.1 How to read the graphs 7 2 Key findings 8 2.1 Unprecedented levels of construction activity are still
Regulatory Impact Statement
 Regulatory Impact Statement Establishing one new special housing area in Queenstown under the Housing Accords and Special Housing Areas Act 2013. Agency Disclosure Statement 1 This Regulatory Impact Statement
New House Owners Satisfaction Survey 2017
 Study Report SR395 [2018] New House Owners Satisfaction Survey 2017 Nick Brunsdon and Caleb Magan 1222 Moonshine Rd, RD1, Porirua 5381 Private Bag 50 908, Porirua 5240 New Zealand branz.nz BRANZ 2018 ISSN:
National Policy Statement on Urban Development Capacity Price efficiency indicators technical report: Land concentration control indicators
 National Policy Statement on Urban Development Capacity Price efficiency indicators technical report: Land concentration control indicators Published in June 2018 by the Ministry of Business, Innovation
Defence Force Superannuation Scheme (DFSS) Category A & C Determination for Previous Home Owner/Current Home Owner being posted elsewhere
 Category A & C Determination for Previous Home Owner/Current Home Owner being posted elsewhere") INDIVIDUAL APPLICATION FORM FOR: Defence Force Superannuation Scheme (DFSS) Category A & C Determination for Previous Home Owner/Current Home Owner being posted elsewhere All sections (A, B, C and D) to
INDIVIDUAL APPLICATION FORM FOR: Defence Force Superannuation Scheme (DFSS) Category A & C Determination for Previous Home Owner/Current Home Owner being posted elsewhere All sections (A, B, C and D) to
Inventory of unsold houses drops to 6 year low
 1st July 2013 Inventory of unsold houses drops to 6 year low New listings stall After witnessing a surge of fresh listings in May, June saw listings stall, with just 9,082 listings coming to the market.
Local Government and Affordable Housing
 Local Government and Affordable Housing PREPARED BY CRESA / Public Policy & Research FOR THE Centre for Housing Research, Aotearoa New Zealand AUGUST 2007 ACKNOWLEDGEMENTS This report was produced for
SAMPLE REPORT CORELOGIC NEW ZEALAND MONTHLY PROPERTY MARKET & ECONOMIC UPDATE
 CORELOGIC NEW ZEALAND MONTHLY PROPERTY MARKET & ECONOMIC UPDATE JANUARY FEBRUARY 2017 About CoreLogic 4 CoreLogic Data and Analytics 6 Legal Disclaimer 7 Macro Economic and Demographic Indicators 8 New
report New Zealand property
 report New Zealand property April 2018 issued 1 May 2018 overview A rise in new property listings nationally is strongly underpinned by the Canterbury and Wellington regions Real-time data from realestate.co.nz
Adequacy of the Auckland Region s Residential Land Supply
 Adequacy of the Auckland Region s Supply Prepared for September 2008 Status: Final Report Table of Contents EXECUTIVE SUMMARY... 1 1 INTRODUCTION... 5 1.1 Research Background...5 1.2 Objectives...5 1.3
report New Zealand property
 report New Zealand property January 2018 issued 1 February 2018 overview New Zealand property market in major centres stays cool over hot summer, while regions are pumping Real-time statistics from realestate.co.nz
Record house prices an early Christmas present to vendors, says REINZ
 14 December 2018 For immediate release Record house prices an early Christmas present to vendors, says REINZ Vendors from around the country have been delivered an early Christmas present with record median
The costs and benefits of urban development
 The costs and benefits of urban development Peter Nunns, Principal Economist 19 May 2017 Contents Who we are and what we do Propositions about urban planning A pricing rule for urban planning Three case
Table of Contents. Appendix...22
 Table Contents 1. Background 3 1.1 Purpose.3 1.2 Data Sources 3 1.3 Data Aggregation...4 1.4 Principles Methodology.. 5 2. Existing Population, Dwelling Units and Employment 6 2.1 Population.6 2.1.1 Distribution
REINZ statistics: Auckland price growth slowing, regional strong growth continues
 13 July 2017 For immediate release REINZ statistics: price growth slowing, regional strong growth continues New Zealand s property market is showing all the signs of being a two-tier market with median
Strong end to 2017, with house prices up 5.8% in December says REINZ
 18 January 2018 Strong end to 2017, with house prices up 5.8% in December says REINZ Median house prices across New Zealand rose by 5.8% year-on-year to $550,000 up from $520,000 in December 2016 and median
report New Zealand property
 report New Zealand property June 2018 issued 3 July 2018 overview New property listings drop significantly in June, while asking prices and buyer interest hold steady. The Auckland region records a fall
BNZ-REINZ Residential Market Survey ISSN
 ISSN 2253-3656 13 2012 Mission Statement To help Kiwi businesspeople and householders make informed financial decisions by discussing the economy in a language they can understand. Market Strength Continues
report New Zealand property
 report New Zealand property February 2018 issued 1 March 2018 Lifestyle property a potential option in a relatively static housing market A surge in the number of lifestyle properties listed for sale nationally
$27k price increase sees NZ hit new record median price in May says REINZ
 14 June 2018 For immediate release $27k price increase sees NZ hit new record median price in May says REINZ A year-on-year price increase of $27,000 has seen New Zealand achieve a new record median house
Funding Auckland s greenfield infrastructure
 Funding Auckland s greenfield infrastructure Efficiency, fairness, affordability and incentives Presented by Harshal Chitale Senior Economist, Auckland Council NZPI Conference, 21 March 2018 Disclaimer
New Plymouth District Council 1 of 23
 New Plymouth District Council 1 of 23 Contents Executive Summary... 4 Introduction... 4 Purpose of this Quarterly Report... 4 First Quarterly Report... 5 New Plymouth District... 5 New Plymouth District
New challenges for urban renewal... Patrick Fensham Principal SGS Economics and Planning
 New challenges for urban renewal... Patrick Fensham Principal SGS Economics and Planning 27 March 2013 Housing supply a problem... The housing shortfall (gap) increased by 28,000 dwellings over the year
Auckland property cools further as summer rolls on
 Media Release 22 February 2017 Auckland property cools further as summer rolls on The Auckland property market continues to cool, with the Trade Me Property Price Index reporting the average asking price
report New Zealand property
 report New Zealand property July 2018 issued 1 August 2018 overview Interest in homes for sale warms in July. Search for properties back to summertime levels. Searches for properties in July on realestate.co.nz
10 Appendices. Appendix A: Results Capacity for Growth Study Appendix B: Results Appendix C: Background Information 83
 1 Appendices Appendix A: Results for Growth Study 28 71 Appendix B: Results 1996-8 Appendix C: Background Information 83 Appendix D: Maps 86 Map 1 Rodney District () :... 86 Map 2 North Shore City :...
Changes in the Structure of the New Zealand Housing Market Executive Summary
 Changes in the Structure of the New Zealand Housing Market Executive Summary PREPARED BY DTZ New Zealand FOR THE Centre for Housing Research, Aotearoa New Zealand MAY 2004 ISBN 0-9582553-0-X ACKNOWLEDGEMENTS
POPULATION FORECASTS
 POPULATION FORECASTS Between 2015 and 2045, the total population is projected to increase by 373,125 residents to reach 2.2 million. Some areas will see major increases, while other areas will see very
Renters in Auckland $12,500 p.a better off than homeowners
 Media Release 19 November 2015 Renters in Auckland $12,500 p.a better off than homeowners It is cheaper to rent a house than buy a house across New Zealand, but the disparity is most pronounced in Auckland
First Experiences under the Tauranga Housing Accord
 First Experiences under the Tauranga Housing Accord Richard Coles Boffa Miskell, Tauranga - Richardc@boffamiskell.co.nz Paul Taylor Classic Builders/PMP Developments, Bay of Plenty/Waikato - Paul.taylor@classicbuilders.co.nz
Sellers set a new record high asking price, as inventory drops to near record low
 1st May 2013 Sellers set a new record high asking price, as inventory drops to near record low Asking prices reach new high The seasonally adjusted asking price rose in April to a new record high of $447,275
House prices rise 6.9% across New Zealand according to latest REINZ figures
 14 March 2018 For immediate release House prices rise 6.9% across New Zealand according to latest REINZ figures The median house price for New Zealand rose 6.9% in February to $530,000 up from $496,000
Hamilton s Housing Market and Economy
 Hamilton s Housing Market and Economy Growth Indicator Report November 2016 hamilton.govt.nz Contents 3. 4. 5. 6. 7. 7. 8. 9. 10. 11. Introduction New Residential Building Consents New Residential Sections
UNDERSTANDING DEVELOPER S DECISION- MAKING IN THE REGION OF WATERLOO
 UNDERSTANDING DEVELOPER S DECISION- MAKING IN THE REGION OF WATERLOO SUMMARY OF RESULTS J. Tran PURPOSE OF RESEARCH To analyze the behaviours and decision-making of developers in the Region of Waterloo
The South Australian Housing Trust Triennial Review to
 The South Australian Housing Trust Triennial Review 2013-14 to 2016-17 Purpose of the review The review of the South Australian Housing Trust (SAHT) reflects on the activities and performance of the SAHT
MICRO-POCKETS OF GROWTH
 MICRO-POCKETS OF GROWTH (AND HOW TO FIND THEM) The Auckland Effect Over the past few years, the Auckland real estate market has been splashed across national (and even global) headlines and for good reason.
Record Supply Still Not Enough
 Market Indicators Report Second Half 2017 AUCKLAND RESIDENTIAL DEVELOPMENT REPORT Record Supply Still Not Enough SOTO Meadowbank, Auckland Architect: Monk Mackenzie Developer: Southside Group Accelerating
Real estate industry sees highest annual volume increase in 23 months
 11 May 2018 For immediate release Real estate industry sees highest annual volume increase in 23 months The number of properties sold in April 2018 across New Zealand increased by 6.6% compared to the
Myth Busting: The Truth About Multifamily Renters
 Myth Busting: The Truth About Multifamily Renters Multifamily Economics and Market Research With more and more Millennials entering the workforce and forming households, as well as foreclosed homeowners
Wellington Housing Accord Monitoring Report 4
 Wellington Housing Accord Monitoring Report 4 July 215 to June 216 Based on: building consent data to month ended June 216 new section data to month ended June 216 Executive Summary This monitoring report
Suburban Sprawl: Exposing Hidden Costs, Identifying Innovations. Summary
 : Exposing Hidden Costs, Identifying Innovations Summary October 2013 Suburban sprawl is spreading across Canada as cities expand outwards to accommodate the growing demand for lower cost houses. But it
Lowest sales volumes in 8 months a result of extremely low listings in July says REINZ
 11 October 2018 For immediate release Lowest sales volumes in 8 months a result of extremely low listings in July says REINZ The low number of new listings in July has meant that the number of houses sold
Residential Intensification in Established Neighbourhoods Study (RIENS)
") Residential Intensification in Established Neighbourhoods Study (RIENS) EXECUTIVE SUMMARY In December 2015, the City of Kitchener retained Meridian Planning Consultants to undertake the Residential Intensification
Residential Intensification in Established Neighbourhoods Study (RIENS) EXECUTIVE SUMMARY In December 2015, the City of Kitchener retained Meridian Planning Consultants to undertake the Residential Intensification
Housing affordability
 Background Housing affordability A paper prepared by the PPTA executive For the 2008 Annual Conference, the Auckland region prepared a paper on the issue of housing affordability, calling for a taskforce
Appendix 1: Gisborne District Quarterly Market Indicators Report April National Policy Statement on Urban Development Capacity
 Appendix 1: Gisborne District Quarterly Market Indicators Report April 2018 National Policy Statement on Urban Development Capacity Quarterly Market Indicators Report April 2018 1 Executive Summary This
The cost of increasing social and affordable housing supply in New South Wales
 The cost of increasing social and affordable housing supply in New South Wales Prepared for Shelter NSW Date December 2014 Prepared by Emilio Ferrer 0412 2512 701 eferrer@sphere.com.au 1 Contents 1 Background
Presentation to the Real Estate Institute of New Zealand 28 October 2016
 Presentation to the Real Estate Institute of New Zealand 28 October 2016 Disclaimer This presentation provides a high level overview of specific parts of the Proposed Auckland Unitary Plan Decisions Version
Residential Commentary - Perth Apartment Market
 Residential Commentary - Perth Apartment Market March 2016 Executive Summary The Greater Perth apartment market has attracted considerable interest from local and offshore developers. Projects under construction
Auckland Housing Accord FinalReport for Second Accord Year
 Auckland Housing Accord FinalReport for Second Accord Year October 2014 to September 2015 Based on: City-wide building consent data to month ended 30 September 2015 City-wide new sections data to month
Auckland rents kick back into gear
 Media Release 24 May 2016 Auckland rents kick back into gear The New Zealand rental market kicked back into gear in April as the median weekly asking rent increased by $10 according to the latest Trade
Table of Contents. Title Page # Title Page # List of Tables ii 6.7 Rental Market - Townhome and Apart ment Rents
 RESIDENTIAL MONITORING REPORT 2013 Table of Contents Title Page # Title Page # List of Tables ii 6.7 Rental Market - Townhome and Apart ment Rents 21 List of Figures iii 7.0 Other Housing Demands and Trends
Housing for the Region s Future
 Housing for the Region s Future Executive Summary North Texas is growing, by millions over the next 40 years. Where will they live? What will tomorrow s neighborhoods look like? How will they function
High Level Summary of Statistics Housing and Regeneration
 High Level Summary of Statistics Housing and Regeneration Housing market... 2 Tenure... 2 New housing supply... 3 House prices... 5 Quality... 7 Dampness, condensation and the Scottish Housing Quality
DCLG consultation on proposed changes to national planning policy
 Summary DCLG consultation on proposed changes to national planning policy January 2016 1. Introduction DCLG is proposing changes to the national planning policy framework (NPPF) specifically on: Broadening
Focus article: Metropolitan and rural housing market developments
 Focus article: Metropolitan and rural housing market developments Introduction The upswing in the South African residential property market which started around was driven by a wide range of economic,
Research & Forecast Report New Zealand Workplace Report. Occupational trends across New Zealand. Accelerating success.
 Research & Forecast Report New Zealand 14 Workplace Report Occupational trends across New Zealand Accelerating success. Introduction In the seventh edition of our biennial CBD office workplace report,
Housing affordability inquiry
 Housing affordability inquiry Summary version of report March 2012 The Productivity Commission aims to provide insightful, well-informed and accessible advice that leads to the best possible improvement
Residential Commentary Sydney Apartment Market
 Residential Commentary Sydney Apartment Market April 2017 Executive Summary Sydney Apartment Market: Key Indicators 14,200 units are currently under construction in Inner Sydney with completion expected
STAGE 3 - SECTION 32 CHAPTER 17 RURAL - CRANFORD BASIN APPENDIX 7 - CRANFORD BASIN PROPERTY ECONOMICS REPORT
 STAGE 3 - SECTION 32 CHAPTER 17 RURAL - CRANFORD BASIN APPENDIX 7 - CRANFORD BASIN PROPERTY ECONOMICS REPORT Notified 25 July 2015 MARCH 2015 CRANFORD BASIN CHRISTCHURCH COMMERCIAL POTENTIAL OVERVIEW CHRISTCHURCH
14 September 2015 MARKET ANALYTICS AND SCENARIO FORECASTING UNIT. JOHN LOOS: HOUSEHOLD AND PROPERTY SECTOR STRATEGIST
 14 September 2015 MARKET ANALYTICS AND SCENARIO FORECASTING UNIT JOHN LOOS: HOUSEHOLD AND PROPERTY SECTOR STRATEGIST 087-328 0151 john.loos@fnb.co.za THEO SWANEPOEL: PROPERTY MARKET ANALYST 087-328 0157
THE REAL ESTATE BOARD OF NEW YORK REAL ESTATE BROKER CONFIDENCE INDEX THIRD QUARTER 2016
 THE REAL ESTATE BOARD OF NEW YORK REAL ESTATE BROKER CONFIDENCE INDEX THIRD QUARTER 2016 EXECUTIVE SUMMARY REAL ESTATE BROKER CONFIDENCE INDEX THIRD QUARTER 2016 The Real Estate Board of New York s (REBNY)
NEW ZEALAND PROPERTY SURVEY SEPTEMBER 2015
 NEW ZEALAND PROPERTY SURVEY SEPTEMBER 2015 We asked New Zealanders what they really thought about property. What challenges Kiwis faced when selling or buying and how they felt about the property market.
CASEY PLANNING SCHEME AMENDMENT C219
 Who is the planning authority? Planning and Environment Act 1987 CASEY PLANNING SCHEME AMENDMENT C219 EXPLANATORY REPORT This amendment has been prepared by the, which is the planning authority for this
Fiscal Impact Analysis Evergreen Community
 Evergreen Community July 16, 2015 Evergreen Community Prepared for: Evergreen Community (Burlington) Ltd. Prepared by: 33 Yonge Street Toronto Ontario M5E 1G4 Phone: (416) 641-9500 Fax: (416) 641-9501
Signals of Under-Capacity: the practicalities of monitoring Price Signals under the National Policy Statement on Urban Development Capacity
 Final Report 25 October 2016 Signals of Under-Capacity: the practicalities of monitoring Price Signals under the National Policy Statement on Urban Development Capacity Prepared for Ministry of Business,
3 November rd QUARTER FNB SEGMENT HOUSE PRICE REVIEW. Affordability of housing
 3 November 2011 3 rd QUARTER FNB SEGMENT HOUSE PRICE REVIEW JOHN LOOS: HOUSEHOLD AND PROPERTY SECTOR STRATEGIST 011-6490125 John.loos@fnb.co.za EWALD KELLERMAN: PROPERTY MARKET ANALYST 011-6320021 ekellerman@fnb.co.za
Multifamily Supply: Too Much or Not Enough
 Multifamily Supply: Too Much or Not Enough A BERKSHIRE RESEARCH VIEWPOINT October 2016 1 Multifamily Supply: Too Much or Not Enough A BERKSHIRE RESEARCH VIEWPOINT October 2016 SUMMARY With an expected
Housing affordability inquiry
 Housing affordability inquiry Draft report December 2011 T F A R D The Productivity Commission aims to provide insightful, well-informed and accessible advice that leads to the best possible improvement
The Profile for Residential Building Approvals by Type and Geography
 The Profile for Residential Building Approvals by Type and Geography Key Points: ABS Building Approvals for Australia peaked back in October 2015. As we have frequently highlighted, approvals have subsequently
THE ROLE OF LOCAL GOVERNMENT IN THE PROVISION OF AFFORDABLE HOUSING
 THE ROLE OF LOCAL GOVERNMENT IN THE PROVISION OF AFFORDABLE HOUSING A report prepared for Local Government New Zealand, Dunedin, Wellington and North Shore City Councils and New Plymouth and Western Bay
Auckland Housing Accord Second Report for Accord Year 2
 Auckland Housing Accord Second Report for Accord Year 2 October 2014 to March 2015 Based on: building consent data to month ended 31 March 2015 new sections data to month ended 31 March 2015 Housing Project
Auckland Council Quarterly Monitoring Report
 Auckland Council Quarterly Monitoring Report for the National Policy Statement on Urban Development Capacity June 2018 2018 Auckland Council Prepared by the Land Use, Infrastructure Research and Evaluation
South East Queensland Growth Management Program
 South East Queensland Growth Management Program Acknowledgements Office of Economic and Statistical Research, Demography and Planning Australian Bureau of Statistics Urban Land Development Authority Brisbane
QUEENSTOWN-LAKES DISTRICT HOUSING ACCORD
 QUEENSTOWN-LAKES DISTRICT HOUSING ACCORD Queenstown-Lakes Housing Accord 1. The Queenstown-Lakes Housing Accord (the Accord) between Queenstown-Lakes District Council (the Council) and the Government is
Performance of the Private Rental Market in Northern Ireland
 Summary Research Report July - December Performance of the Private Rental Market in Northern Ireland Research Report July - December 1 Northern Ireland Rental Index: Issue No. 8 Disclaimer This report
Rents Up, Occupancy Steady
 Rents Up, Steady Kansas City s apartment market closed 2014 with a significant increase in rents compared to the prior year. The average per-square-foot rent was $0.88. At the end of 2013 it had been $0.85.
NSW Affordable Housing Guidelines. August 2012
 August 2012 NSW AFFORDABLE HOUSING GUIDELINES TABLE OF CONTENTS 1.0 INTRODUCTION... 1 2.0 DEFINITION OF KEY TERMS... 1 3.0 APPLICATION OF GUIDELINES... 2 4.0 PRINCIPLES... 2 4.1 Relationships and partnerships...
Dense housing and urban sustainable development
 The Sustainable City VI 443 Dense housing and urban sustainable development B. Su School of Architecture, Unitec Institute of Technology, New Zealand Abstract There are close relationships between urban
West Surrey Strategic Housing Market Assessment
 West Surrey Strategic Housing Market Assessment Guildford Summary Report October 2015 Prepared by GL Hearn Limited 280 High Holborn London WC1V 7EE T +44 (0)20 7851 4900 glhearn.com Contents Section Page
Economy. Denmark Market Report Q Weak economic growth. Annual real GDP growth
 Denmark Market Report Q 1 Economy Weak economic growth In 13, the economic growth in Denmark ended with a modest growth of. % after a weak fourth quarter with a decrease in the activity. So Denmark is
HOUSING AFFORDABILITY
 HOUSING AFFORDABILITY (RENTAL) 2016 A study for the Perth metropolitan area Research and analysis conducted by: In association with industry experts: And supported by: Contents 1. Introduction...3 2. Executive
HM Treasury consultation: Investment in the UK private rented sector: CIH Consultation Response
 HM Treasury Investment in the UK private rented sector: CIH consultation response This consultation response is one of a series published by CIH. Further consultation responses to key housing developments
CONSUMER CONFIDENCE AND REAL ESTATE MARKET PERFORMANCE GO HAND-IN-HAND
 CONSUMER CONFIDENCE AND REAL ESTATE MARKET PERFORMANCE GO HAND-IN-HAND The job market, mortgage interest rates and the migration balance are often considered to be the main determinants of real estate
Context Briefing 2 Progress with housing and regeneration interventions
 Context Briefing 2 Progress with housing and regeneration interventions Ade Kearns March 2014 GoWell is a collaborative partnership between the Glasgow Centre for Population Health, the University of Glasgow
Composition of Australia s Housing
 The Changing Composition of Australia s New Housing Mix Background It is well known that the predominant form of residential dwelling in Australia has historically been detached housing. Detached houses
Filling the Gaps: Stable, Available, Affordable. Affordable and other housing markets in Ekurhuleni: September, 2012 DRAFT FOR REVIEW
 Affordable Land and Housing Data Centre Understanding the dynamics that shape the affordable land and housing market in South Africa. Filling the Gaps: Affordable and other housing markets in Ekurhuleni:
KiwiBuild eligibility criteria
 In Confidence Office of the Minister of Housing and Urban Development Chair, Economic Development Committee KiwiBuild eligibility criteria 1 This paper describes the first home buyers expected to participate
Proposed Variation to Stage 1 Proposed District Plan VISITOR ACCOMMODATION DRAFT
 Proposed Variation to Stage 1 Proposed District Plan VISITOR ACCOMMODATION Prepared by Ian Johnson, Mitchell Daysh Ltd For Bookabach Ltd Version 0.4 Residential Visitor Accommodation The Variation Alternative
Commentary. Regional Summary Asking Price
 Inventory recovers slightly as national asking prices ease Asking prices ease Nationally average asking prices of new listings eased in April. The seasonally adjusted asking price fell by 1.4% to $477,460,