$27k price increase sees NZ hit new record median price in May says REINZ
|
|
|
- Primrose Rhoda Carpenter
- 5 years ago
- Views:
Transcription
, source of the most complete and accurate real estate data in New Zealand.")
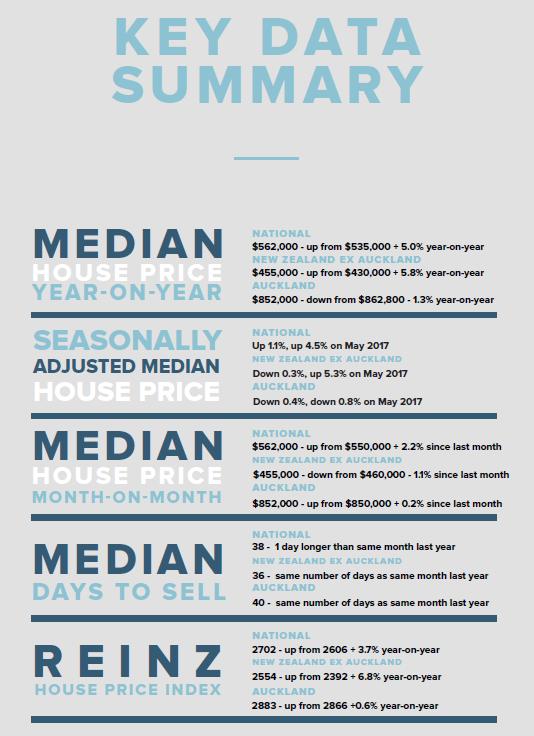
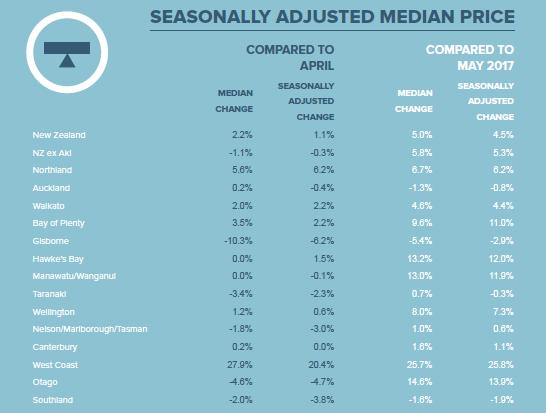
1 14 June 2018 For immediate release $27k price increase sees NZ hit new record median price in May says REINZ A year-on-year price increase of $27,000 has seen New Zealand achieve a new record median house price of $562,000 a 5.0% increase according to the latest data from the Real Estate Institute of New Zealand (REINZ), source of the most complete and accurate real estate data in New Zealand. Median prices for New Zealand excluding Auckland increased by 5.8% annually to $455,000, up from $430,000. However, Auckland s median price decreased 1.3% from the same time last year, with May 2018 seeing a price of $852,000 (down from $862,800 in May 2017). Three regions achieved record prices in May: Northland up 6.7% year-on-year resulting in a median of $475,000 (up from $445,000) Tasman up 16.2% year-on-year resulting in a median of $612,000. This is the first time the median price for Tasman has gone over $600,000 Manawatu/Wanganui had a record equal median price of $305,500 - the same as the median price in April Other regions that saw a strong increase in price from May 2017 to May 2018 were the West Coast (+25.7% to $220,000 the highest price in 7 months), Otago (+14.6% to $440,000) and Hawke s Bay (+13.2% to $430,000). Bindi Norwell, Chief Executive at REINZ says: The record price for New Zealand of $562,000 continues to highlight the buoyancy of the housing market across the country. Of the 16 regions in New Zealand 13 saw an annual price increase 5 of which were double digit increases showing that the demand for good property continues unabated. Only three regions saw a year-on-year price decrease Auckland, Gisborne and Southland. The record median price achieved in Tasman has seen the region skip both Wellington and the Bay of Plenty to become the second most expensive region in New Zealand in just a single month highlighting just how popular the region continues to be even as we head into winter. It s staggering to think that a region of 51,000 people has more expensive property than a region of nearly 514,000* people, continues Norwell. Looking at Auckland, it seems like the market has found a middle ground around the $850,000 mark, as 3 out of the past 5 months have seen a median price in this range. This suggests that the standoff between buyers wanting a bargain and sellers wanting an unrealistic price is coming to an end, she continues. Despite the year-on-year decrease, Auckland s median price of $852,000 is actually up $2,000 on April Putting the year-on-year figure into perspective, the REINZ HPI for Auckland increased 0.6% year-on-year, highlighting that despite a decrease in median price that the market is actually
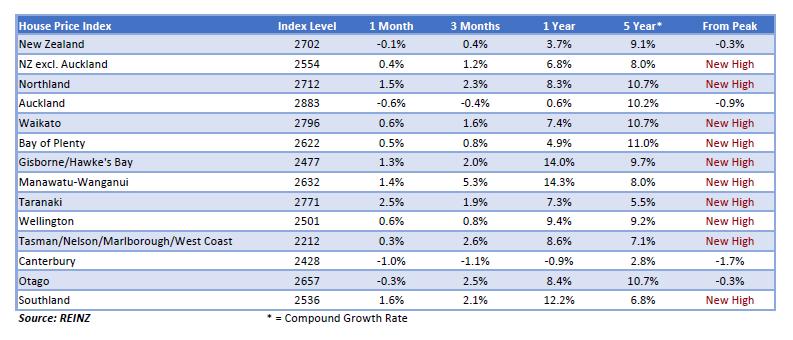
2 not in decline it s just a result of a decrease in $1 million plus properties year-on-year, points out Norwell. Volumes up The number of houses sold in May 2018 across New Zealand increased by 1.3% (to 7,578 up from 7,482) when compared to the same time last year. However, the number of properties sold in New Zealand excluding Auckland decreased 0.5% year-on-year to 5,247 down from 5,271 in May The number of houses sold in Auckland increased 5.4% year-on-year, from 2,211 in May 2017 to 2,331 in May Regions with the largest increases in sales year-on-year were: Nelson up 25.3% from 83 sales to 104 West Coast up 20.9% from 43 to 52 the highest sales count in 6 years Gisborne up 15.8% from 57 to 66 Hawke s Bay up 12.5% from 248 to the highest sales count in 14 months. Regions with the biggest decreases year-on-year were Tasman (-16.9% - the lowest number of properties sold for the month of May for 9 years), Marlborough (-10.4%), Otago (-7.4%) and Northland (-6.6%). With 2017 seeing only year-on-year volume decreases for New Zealand, it s positive to see the number of properties sold having increased year-on-year for 4 out of the first 5 months of Further supporting this positive outlook is that across the country is that 9 out of 16 regions saw a year-on-year increase in the number of properties sold, with 4 of those regions experiencing doubledigit growth, says Norwell. There have been some stand out results for some of the regions too, with the West Coast having seen the highest number of properties sold in 6 years since May The Bay of Plenty, Hawke s Bay and Manawatu/Wanganui all had the highest sales count since March 2017 and Canterbury and Otago had the highest sales count in 6 months, says Norwell. REINZ House Price Index (HPI) The REINZ House Price Index for New Zealand, which measures the changing value of property in the market, increased 3.7% year-on-year to 2,702. The HPI for New Zealand excluding Auckland increased 6.8% from May 2017 to a new record high of 2,554. The REINZ HPI showed that 11 out of 12 regions experienced an increase in their HPI over the past 12 months, highlighting the continued strength of the property market. Again, the only region not to experience an increase was Canterbury, which experienced a decrease of 0.9% year-on-year nothing for the region to be concerned about. The Manawatu/Wanganui region had the highest annual growth rate at +14.3%, followed by Gisborne/Hawke s Bay in second place (+14.0%) and Southland in third place (+12.2%) highlighting the strength of these regions. Days to sell The median number of days to sell a property nationally increased by 1 day from 37 days in May 2017 to 38 days in May This is 2 days more to sell a property than it took in April this year.
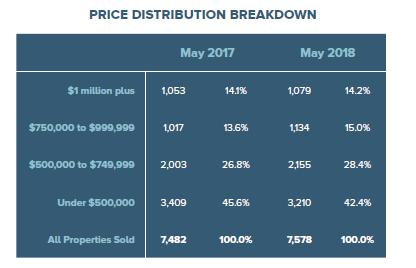
3 Auckland saw the median number of days to sell a property remain flat at 40 days, but it increased by 3 days on April Regions with the biggest decrease in the median number of days to sell were West Coast (-50 from 148 to 98), Taranaki (-5 days from 42 to 37) and Nelson (-3 from 35 to 32). Regions with the biggest increase in the median number of days to sell were Gisborne (+12 from 32 to 44), Tasman (+8 from 29 to 37), Bay of Plenty (+7 from 38 to 45) and Northland (+6 from 41 to 47). Auctions Auctions were used in 12.7% of all sales across the country in May, with 961 properties selling under the hammer this is down slightly from May 2017, when 13.3% of properties (996) were sold via auction. For the fourth month in a row, Gisborne had the highest percentage of auctions across the country with just shy of a third of properties (30.3% or 20 properties) in the region sold under the hammer down from 40.4% (23 properties) in May Auckland saw the second largest percentage of auctions on 21.1% (492 properties) down from 24.3% in May 2017 (539 properties) and the Bay of Plenty on 16.8% (91 properties) down from 19.4% (98 properties) in May Inventory The number of properties available for sale nationally increased by 1.0% from 24,229 to 24,477 an increase of just 248 properties compared to 12 months ago. For the third month in a row the New Zealand figure has been buoyed by inventory increases in Nelson (+29.3% - an additional 96 properties the largest annual inventory growth on record), Hawke s Bay (+8.9% - an additional 41 properties) and Waikato (+8.8% - an additional 140 properties). The New Zealand excluding Auckland inventory level fell by 1.0% from 15,607 in May 2017 to 15,455 in May Auckland s annual inventory increased by 4.6% (from 8,622 to 9,022 - an additional 400 properties). Regions with the biggest falls in inventory were: Southland down 20.1% Gisborne down 19.2% West Coast down 16.8% Manawatu/Wanganui down 13.7%. Again, the Wellington region has had the lowest number of weeks inventory across the whole country with only 8 weeks inventory available to those looking to purchase in the area. The Hawke s Bay has seen a slight increase from 8 to 10 weeks inventory year-on-year. Similarly, Otago is also sitting on 10 weeks inventory, but this is down from 11.3 weeks inventory when compared to May Price Bands The number of homes sold for less than $500,000 across New Zealand fell from 45.6% of the market (3,409 properties) in May 2017 to 42.4% of the market (3,210 properties) in May 2018 which is reflected by the overall increasing median price.
4 The number of properties sold in the $500,000 to $750,000 bracket increased from 26.8% in May 2017 (2,003 properties) to 28.4% in May 2018 (2,155 properties). At the top end of the market, properties sold for more than $1 million increased marginally from 14.1% of the market in May 2017 (1,053 houses) to 14.2% of the market this year (1,079 houses). ENDS Notes to Editors * Statistics New Zealand Estimated resident population 2017 figures: opulationestimates_mratjun17.aspx The monthly REINZ residential sales reports remain the most recent, complete and accurate statistics on house prices and sales in New Zealand. They are based on actual sales reported by real estate agents. These sales are taken as of the date that a transaction becomes unconditional, up to 5:00pm on the last business day of the month. Other surveys of the residential property market are based on information from Territorial Authorities regarding settlement and the receipt of documents by the relevant Territorial Authority from a solicitor. As such, this information involves a lag of four to six weeks before the sale is recorded. For further information, please contact Dee Crooks, Head of Communications at REINZ, on or
5
6
7
Real estate industry sees highest annual volume increase in 23 months
 11 May 2018 For immediate release Real estate industry sees highest annual volume increase in 23 months The number of properties sold in April 2018 across New Zealand increased by 6.6% compared to the
House prices rise 6.9% across New Zealand according to latest REINZ figures
 14 March 2018 For immediate release House prices rise 6.9% across New Zealand according to latest REINZ figures The median house price for New Zealand rose 6.9% in February to $530,000 up from $496,000
Record house prices an early Christmas present to vendors, says REINZ
 14 December 2018 For immediate release Record house prices an early Christmas present to vendors, says REINZ Vendors from around the country have been delivered an early Christmas present with record median
Lowest sales volumes in 8 months a result of extremely low listings in July says REINZ
 11 October 2018 For immediate release Lowest sales volumes in 8 months a result of extremely low listings in July says REINZ The low number of new listings in July has meant that the number of houses sold
Strong end to 2017, with house prices up 5.8% in December says REINZ
 18 January 2018 Strong end to 2017, with house prices up 5.8% in December says REINZ Median house prices across New Zealand rose by 5.8% year-on-year to $550,000 up from $520,000 in December 2016 and median
REINZ statistics: Auckland price growth slowing, regional strong growth continues
 13 July 2017 For immediate release REINZ statistics: price growth slowing, regional strong growth continues New Zealand s property market is showing all the signs of being a two-tier market with median
Sales volumes see seasonal drop in January as Auckland & National median house prices rise year-on-year
 REINZ Real Estate Institute of New Zealand February 2017 Sales volumes see seasonal drop in January as & median house prices rise year-on-year Bindi Norwell, REINZ CEO ers are once again starting to put
report New Zealand property
 report New Zealand property July 2018 issued 1 August 2018 overview Interest in homes for sale warms in July. Search for properties back to summertime levels. Searches for properties in July on realestate.co.nz
Inventory of unsold houses drops to 6 year low
 1st July 2013 Inventory of unsold houses drops to 6 year low New listings stall After witnessing a surge of fresh listings in May, June saw listings stall, with just 9,082 listings coming to the market.
report New Zealand property
 report New Zealand property June 2018 issued 3 July 2018 overview New property listings drop significantly in June, while asking prices and buyer interest hold steady. The Auckland region records a fall
Sellers set a new record high asking price, as inventory drops to near record low
 1st May 2013 Sellers set a new record high asking price, as inventory drops to near record low Asking prices reach new high The seasonally adjusted asking price rose in April to a new record high of $447,275
report New Zealand property
 report New Zealand property January 2018 issued 1 February 2018 overview New Zealand property market in major centres stays cool over hot summer, while regions are pumping Real-time statistics from realestate.co.nz
report New Zealand property
 report New Zealand property April 2018 issued 1 May 2018 overview A rise in new property listings nationally is strongly underpinned by the Canterbury and Wellington regions Real-time data from realestate.co.nz
New Zealand Property Report. June
 New Zealand Property Report June 2016 The Overview Scarcity of houses for sale nationally creates sellers market. Realestate.co.nz statistics show demand and prices up, supply down. The average asking
report New Zealand property
 report New Zealand property February 2018 issued 1 March 2018 Lifestyle property a potential option in a relatively static housing market A surge in the number of lifestyle properties listed for sale nationally
MONTHLY HOUSE PRICE INDEX REPORT
 MONTHLY HOUSE PRICE INDEX REPORT 1 4 J U N E 2018 REINZ Real Estate Institute of New Zealand REINZ HOUSE PRICE INDEX (HPI) As one of the country s foremost authorities on real estate data, we are proud
Commentary. Regional Summary Asking Price
 Inventory recovers slightly as national asking prices ease Asking prices ease Nationally average asking prices of new listings eased in April. The seasonally adjusted asking price fell by 1.4% to $477,460,
Auckland rents kick back into gear
 Media Release 24 May 2016 Auckland rents kick back into gear The New Zealand rental market kicked back into gear in April as the median weekly asking rent increased by $10 according to the latest Trade
MONTHLY HOUSE PRICE INDEX REPORT
 MONTHLY HOUSE PRICE INDEX REPORT 1 2 O C T O B E R 2017 REINZ Real Estate Institute of New Zealand INTRODUCING REINZ HOUSE PRICE INDEX (HPI) As one the country s foremost authorities on real estate data,
BNZ-REINZ Residential Market Survey ISSN
 ISSN 2253-3656 13 2012 Mission Statement To help Kiwi businesspeople and householders make informed financial decisions by discussing the economy in a language they can understand. Market Strength Continues
Rents leap to end 2016 on a record high
 Media Release 16 January 2017 Rents leap to end 2016 on a record high December was another tough month for tenants in New Zealand with the national median weekly rent jumping to a record $450, according
14 N O V E M B E R
 14 N O V E M B E R 2 0 1 8 REINZ HOUSE PRICE INDEX (HPI) As one of the country s foremost authorities on real estate data, we are proud to bring you the REINZ HPI (House Price Index). It provides a level
Housing and Construction Quarterly
 New Zealand Housing and Construction Quarterly September 2014 Contents Housing Market 2 House Values by Region 3 Rents by Region 4 Rents by Bedroom and Region 5 Price and Rent Comparisons 6 Housing Affordability
Housing and Construction Quarterly
 New Zealand Housing and Construction Quarterly March 2015 Contents 2 Quarterly Highlights Housing Market 3 House Values by Region 4 Rents by Region 5 Rents by Bedroom and Region 6 Price and Rent Comparisons
Auckland property cools further as summer rolls on
 Media Release 22 February 2017 Auckland property cools further as summer rolls on The Auckland property market continues to cool, with the Trade Me Property Price Index reporting the average asking price
Renters in Auckland $12,500 p.a better off than homeowners
 Media Release 19 November 2015 Renters in Auckland $12,500 p.a better off than homeowners It is cheaper to rent a house than buy a house across New Zealand, but the disparity is most pronounced in Auckland
Queenstown-Lakes Data REINZ SLIDE 1
 Queenstown-Lakes Data REINZ SLIDE 1 OTAGO REGION SCORECARD Net Migration (year to) Unemployment (Q3) Weekly Earnings (Median) House Prices (Median) Sep 16: 1,954 Q3 2016: 3.7% 2016: $1,054 YE Sep 16: $337k
2015 First Quarter Market Report
 2015 First Quarter Market Report CAAR Member Copy Expanded Edition Charlottesville Area First Quarter 2015 Highlights: Median sales price for the region was up 5.1% over Q1-2014, rising from $244,250 to
nd Quarter Market Report
 2015 2 nd Quarter Market Report The voice of real estate in Central Virginia CAAR Member Copy Expanded Edition Charlottesville Area 2 nd Quarter 2015 Highlights: Closed sales in the Greater Charlottesville
Housing affordability
 Background Housing affordability A paper prepared by the PPTA executive For the 2008 Annual Conference, the Auckland region prepared a paper on the issue of housing affordability, calling for a taskforce
Auckland Monthly Housing Update. December 2018
 Auckland Monthly Housing Update December 2018 Table of contents 1. Summary... 3 2. Highlights... 4 3. Dwellings consented... 5 4. Dwellings consented by type... 6 5. Dwellings consented inside 2010 MUL...
2013 Year-End Market Report
 2013 Year-End Market Report The voice of real estate in Central Virginia CAAR Member Copy Expanded Edition Charlottesville Area Year-End 2013 Highlights: Yearly home sales in Greater Charlottesville were
Building plans put to work
 Crown copyright See Copyright and terms of use for our copyright, attribution, and liability statements. Citation Stats NZ (2017). Building plans put to work. Retrieved from www.stats.govt.nz. ISBN 978-0-9941463-2-8
Defence Force Superannuation Scheme (DFSS) Category A & C Determination for Previous Home Owner/Current Home Owner being posted elsewhere
 Category A & C Determination for Previous Home Owner/Current Home Owner being posted elsewhere") INDIVIDUAL APPLICATION FORM FOR: Defence Force Superannuation Scheme (DFSS) Category A & C Determination for Previous Home Owner/Current Home Owner being posted elsewhere All sections (A, B, C and D) to
INDIVIDUAL APPLICATION FORM FOR: Defence Force Superannuation Scheme (DFSS) Category A & C Determination for Previous Home Owner/Current Home Owner being posted elsewhere All sections (A, B, C and D) to
Weekly Market Activity Report A RESEARCH TOOL FROM MINNEAPOLIS AREA REALTORS
 Weekly Market Report A RESEARCH TOOL FROM MINNEAPOLIS AREA REALTORS For Week Ending November 3, 2018 Publish Date: November 12, 2018 All comparisons are to 2017 According to Freddie Mac, the 30-year fixed
Housing and. Construction. Quarterly. Contents 2 Quarterly Highlights. New Zealand. June Key Issues. A Tale of Two Housing Markets.
 New Zealand Housing and Construction Quarterly June 2014 Contents 2 Quarterly Highlights Housing Market 3 House Values by Region 4 Rents by Region 5 Rents by Bedroom and Price by TA 6 Price and Rent Comparisons
Single Family Sales Maine: Units
 Maine Home Connection 19 Commercial St Portland, Maine 04101 MaineHomeConnection.com Office: (207) 517-3100 Email: Info@MaineHomeConnection.com For the fourth consecutive year, Maine home sales set a new
The Canadian Real Estate Association News Release
 According to statistics 1 released today by The Canadian Real Estate Association (CREA), national home sales posted their third monthly increase and broke all previous monthly records. Highlights: The
rd Quarter Market Report
 2012 3 rd Quarter Market Report The voice of real estate in Central Virginia CAAR Member Copy Expanded Edition Charlottesville Area 3 rd Quarter 2012 Highlights: Overall sales in Greater Charlottesville
mymarket Report How is the market?
 mymarket Report How is the market? Lower North Island Autumn 2016 The latest property market update for the Lower North Island region. Helping you with your property decisions. mymarket Report Median property
Report ER5 Can Work, Cannot Afford to Buy the Intermediate Housing Market
 External Research Report Issue Date: 31/08/2015 ISSN: 2423-0839 Report ER5 Can Work, Cannot Afford to Buy the Intermediate Housing Market Ian Mitchell Project LR0484 Livingston and Associates Ltd funded
San Francisco Housing Market Update
 San Francisco Housing Market Update California Economic and Housing Market Outlook The national economy maintained a healthy growth rate in the first quarter of 2005 and appeared to be settling in for
mymarket Report How is the market?
 mymarket Report How is the market? Lower North Island Autumn 2016 The latest property market update for the Lower North Island region. Helping you with your property decisions. mymarket Report Median property
Auckland Housing Accord Second Report for Accord Year 2
 Auckland Housing Accord Second Report for Accord Year 2 October 2014 to March 2015 Based on: building consent data to month ended 31 March 2015 new sections data to month ended 31 March 2015 Housing Project
ARLA Members Survey of the Private Rented Sector
 Prepared for The Association of Residential Letting Agents ARLA Members Survey of the Private Rented Sector Second Quarter 2014 Prepared by: O M Carey Jones 5 Henshaw Lane Yeadon Leeds LS19 7RW June, 2014
Weekly Market Activity Report
 Weekly Market Report A RESEARCH TOOL FROM THE MINNEAPOLIS AREA ASSOCIATION OF REALTORS BROUGHT TO YOU BY THE UNIQUE DATA-SHARING TRADITIONS OF THE REALTOR COMMUNITY For Week Ending February 24, 2018 Publish
SAMPLE REPORT CORELOGIC NEW ZEALAND MONTHLY PROPERTY MARKET & ECONOMIC UPDATE
 CORELOGIC NEW ZEALAND MONTHLY PROPERTY MARKET & ECONOMIC UPDATE JANUARY FEBRUARY 2017 About CoreLogic 4 CoreLogic Data and Analytics 6 Legal Disclaimer 7 Macro Economic and Demographic Indicators 8 New
mymarket Report How is the market?
 mymarket Report How is the market? Lower North Island Spring 2016 The latest property market update for the Lower North Island region. Helping you with your property decisions. mymarket Report The Lower
New House Owners Satisfaction Survey
 Study Report SR374 [2017] New House Owners Satisfaction Survey Matthew Curtis 1222 Moonshine Rd RD1, Porirua 5381 Private Bag 50 908 Porirua 5240 New Zealand branz.nz The work reported here was funded
The Coldwell Banker Carlson Real Estate Market Report
 The Coldwell Banker Carlson Real Estate Market Report 2017 Year-End Stowe Area Report Our 2017 Year-End Market Report uses market-wide data, based on transactions that closed in 2017 in the Multiple Listing
The Desert Housing Report. Coachella Valley Median Detached Home Price March March 2019 $392,000 $415,000
 Median Price $450,000 $400,000 $350,000 $300,000 $250,000 $200,000 $150,000 Coachella Valley Median Detached Home Price March 2002 - $392,000 $415,000 CV Detached Median Price Summary 4% Growth Curve The
California Housing Market Update. Monthly Sales and Price Statistics September 2018
 California Housing Market Update Monthly Sales and Price Statistics September 2018 Sales Had the Largest Decline since March 2014 California, September 2018 Sales: 382,550 Units, -3.3% YTD, -12.4% YTY
1 Q M A NH AT TA N M A R K E T R E P O R T
 1Q2018 MANHATTAN M A R K E T R E P O R T INTRODUCTION M A N H A T T A N S A L E S R E P O R T Q 1 2 0 1 8 : THE NECESSITY OF BALANCE The first quarter of 2018 was a balancing act supported by declines
Housing Price Forecasts. Illinois and Chicago PMSA, April 2018
 Housing Price Forecasts Illinois and Chicago PMSA, April 2018 Presented To Illinois Realtors From R E A L Regional Economics Applications Laboratory, Institute of Government and Public Affairs University
Housing Price Forecasts. Illinois and Chicago PMSA, January 2018
 Housing Price Forecasts Illinois and Chicago PMSA, January 2018 Presented To Illinois Realtors From R E A L Regional Economics Applications Laboratory, Institute of Government and Public Affairs University
Coachella Valley Median Detached Home Price Jan Jan 2017
 The Desert Housing Report Median Price $450,000 Coachella Valley Median Detached Home Price Jan 2002 - Jan 2017 $400,000 $350,000 $300,000 $250,000 $335,000 $340,000 $200,000 $150,000 CV Detached Median
Auckland Housing Accord Third Quarterly Report for the Fourth Accord Year 1 April to 30 June 2017
 Auckland Housing Accord Third Quarterly Report for the Fourth Accord Year 1 April to 30 June 2017 Based on data to 30 June 2017 for: City-wide building consents and completions (Auckland Council and Statistics
Year to Date (thru June)
") CAAR Market Report 2009 Mid-Year Published by the Charlottesville Area Association of REALTORS Where Are We Now? The pace of home purchases in the Charlottesville area continues to improve from the dismal
CAAR Market Report 2009 Mid-Year Published by the Charlottesville Area Association of REALTORS Where Are We Now? The pace of home purchases in the Charlottesville area continues to improve from the dismal
ASSOCIATION OF REGINA REALTORS INC.
 ASSOCIATION OF REGINA REALTORS INC. 1854 McIntyre Street Regina, Sask. S4P P9 Ph: 791-7 Fax: 781-794 www.reginarealtors.com For immediate release November 5, OCTOBER RESIDENTIAL SALES YIELD MIXED RESULTS
NZ house price index relative to peak
 Media release 11 th July 2011 Nationwide property values edge upwards The QV residential property index shows that nationwide values increased in June, driven largely by the Auckland market. Nationwide
Auckland Monthly Housing Update. March 2018
 Auckland Monthly Housing Update March 2018 Table of contents 1. Summary... 3 2. Highlights... 4 3. Dwellings consented... 5 4. Dwellings consented by type... 6 5. Dwellings consented inside 2010 MUL...
INTRODUCTION SUMMER SLIDE
 3 Q 2 0 1 8 M A NH AT TA N M A R K E T R E P O R T INTRODUCTION M A N H A T T A N S A L E S R E P O R T Q 3 2 0 1 8 : SUMMER SLIDE It s common knowledge that Manhattan property sales typically take a dip
Housing Price Forecasts. Illinois and Chicago PMSA, January 2019
 Housing Price Forecasts Illinois and Chicago PMSA, January 2019 Presented To Illinois Realtors From R E A L Regional Economics Applications Laboratory, Institute of Government and Public Affairs University
ECONOMIC CURRENTS. Vol. 5 Issue 2 SOUTH FLORIDA ECONOMIC QUARTERLY. Key Findings, 2 nd Quarter, 2015
 ECONOMIC CURRENTS THE Introduction SOUTH FLORIDA ECONOMIC QUARTERLY Economic Currents provides an overview of the South Florida regional economy. The report presents current employment, economic and real
Residential Real Estate Market Overview: April 2017 Data
 Residential Real Estate Market Overview: April 2017 Data 2017 Mark A. Melikian Chief Valuation Officer mark.melikian@summitvaluations.com 2800 River Road, Suite 460 The following is a market data summary
The Corcoran Report 4Q16 MANHATTAN
 The Corcoran Report 4Q16 MANHATTAN Contents Fourth Quarter 2016 4/7 12/23 3 Overview 8 9 10 Market Wide 11 Luxury 24 2 Sales / Days on Market 3 Inventory / Months of Supply 4 5 Market Share Resale Co-ops
Housing Price Forecasts. Illinois and Chicago PMSA, June 2012
 Housing Price Forecasts Illinois and Chicago PMSA, June 2012 Presented To Illinois Association of REALTORS From R E A L Regional Economics Applications Laboratory, Institute of Government and Public Affairs
Auckland. Regional roundup
 Auckland Regional roundup 18 August 2016 Summary New Zealand continues to enjoy a relatively buoyant period of economic growth overall, as highlighted in our last two ly Economic Overview reports.¹ However,
DATA FOR MAY Published June 23, Sales are up +11.3% month-over-month. The year-over-year comparison shows an increase of +11.1%.
 Permission is granted only to ARMLS Subscribers for reproduction with attribution on to ARMLS COPYRIGHT 2017. For questions regarding this publication contact Brand@ARMLS.com. DATA FOR MAY 2017 - Published
mymarket Report How is the market?
 mymarket How is the market?, Rotorua, & Putaruru Summer 2017 The latest property market update for the Central North Island region. Helping you with your property decisions. mymarket After more than 7
Key Findings on the Affordability of Rental Housing from New York City s Housing and Vacancy Survey 2008
 Furman Center for real estate & urban policy New York University school of law n wagner school of public service 110 West 3rd Street, Suite 209, New York, NY 10012 n Tel: (212) 998-6713 n www.furmancenter.org
WISCONSIN HOUSING MARKETPLACE
 WISCONSIN REALTORS ASSOCIATION WISCONSIN HOUSING MARKETPLACE Date: 2/16/06 For Release: Immediately For More Information Contact: David E. Clark, Economist C3 Statistical Solutions Inc. Office phone: 414-803-6537
News Release. Canadian home sales up in May Ottawa, ON, June 16, The Canadian Real Estate Association
 Canadian home sales up in May Ottawa, ON, June 16, 2014 According to statistics 1 released today by The Canadian Real Estate Association (CREA), national home sales activity posted a sizeable month-over-month
Housing Price Forecasts. Illinois and Chicago PMSA, May 2018
 Housing Price Forecasts Illinois and Chicago PMSA, May 2018 Presented To Illinois Realtors From R E A L Regional Economics Applications Laboratory, Institute of Government and Public Affairs University
May 2016 Washington, DC Market Trends Report Listings continue to move quickly as sales climb nearly 14 percent
 FOR IMMEDIATE RELEASE Contact: Bobette Banks 301-590-8764 Director of Communications Greater Capital Area Association of REALTORS bbanks@gcaar.com May 2016 Washington, DC Market Trends Report Listings
mymarket Report How is the market?
 mymarket Report How is the market? Lower North Island Summer 2015 The latest property market update for the Lower North Island region. Helping you with your property decisions. mymarket Report Values in
The Corcoran Report 3Q17 MANHATTAN
 The Corcoran Report 3Q17 MANHATTAN Contents Third Quarter 2017 4/7 12/23 3 Overview 8 9 10 Market Wide 11 Luxury 24 4 Sales / Days on Market 5 Inventory / Months of Supply 6 7 Market Share Resale Co-ops
Hamilton Heights Manhattan. Morningside Heights Harlem
 Sutton Area TriBeCa Upper East Side Upper West Side Washington Heights West Village The Corcoran Report Battery Park City Beekman Carnegie Hill Central Park South Chelsea Flatiron Clinton East Harlem East
Weekly Market Activity Report
 Weekly Market Report A RESEARCH TOOL FROM THE MINNEAPOLIS AREA ASSOCIATION OF REALTORS BROUGHT TO YOU BY THE UNIQUE DATA-SHARING TRADITIONS OF THE REALTOR COMMUNITY For Week Ending July 8, 2017 Publish
Quick Facts. For Week Ending October 27, 2018 Publish Date: November 5, 2018 All comparisons are to % - 9.1% - 1.
 Weekly Market Report A RESEARCH TOOL FROM THE SAINT PAUL AREA ASSOCIATION OF REALTORS. BROUGHT TO YOU BY THE UNIQUE DATA-SHARING TRADITIONS OF THE REALTOR COMMUNITY For Week Ending October 27, 2018 Publish
ASSOCIATION OF REGINA REALTORS INC.
 ASSOCIATION OF REGINA REALTORS INC. 1854 McIntyre Street Regina, Sask. S4P P9 Ph: 791-7 Fax: 781-794 www.reginarealtors.com For immediate release April 3, 18 RESIDENTIAL SALES SLIDE MARKS END OF 1 ST QUARTER
Housing Price Forecasts. Illinois and Chicago PMSA, October 2014
 Housing Price Forecasts Illinois and Chicago PMSA, October 2014 Presented To Illinois Association of Realtors From R E A L Regional Economics Applications Laboratory, Institute of Government and Public
Housing Price Forecasts. Illinois and Chicago PMSA, March 2018
 Housing Price Forecasts Illinois and Chicago PMSA, March 2018 Presented To Illinois Realtors From R E A L Regional Economics Applications Laboratory, Institute of Government and Public Affairs University
Auckland Monthly Housing Update. Feburary 2018
 Auckland Monthly Housing Update Feburary 2018 Table of contents 1. Summary... 3 2. Highlights... 4 3. Dwellings consented... 5 4. Dwellings consented by type... 6 5. Dwellings consented inside 2010 MUL...
NZ property report OCTOBER 2016
 NZ property report OCTOBER 2016 Report Definitions Sales by registration type; rolling three month, year-on-year growth This data set provides an insight into who is active in the market compared to the
ASSOCIATION OF RESIDENTIAL LETTING AGENTS PRIVATE RENTED SECTOR REPORT
 ASSOCIATION OF RESIDENTIAL LETTING AGENTS PRIVATE RENTED SECTOR REPORT August 2015 For further information: Association of Residential Letting Agents Press Office 020 7566 9777 propertyprofessionals@lansons.com
Monthly Indicators % % - 2.5% Activity Overview New Listings Pending Sales. Closed Sales. Days on Market Until Sale. Median Sales Price
 Monthly Indicators 2019 It is worthwhile to mention the weather when discussing residential real estate for the state of New York for 2019, because this month has turned in some impressively cold and snowy
MANHATTAN MARKET REPORT
 MANHATTAN MARKET REPORT Q1 MANHATTAN MARKET REPORT 1Q 2017 Manhattan s residential market is showing signs of improvement after a period of uncertainty leading up to the Presidential election, as it does
See Full Corridor Study Volumes I and II as separate attachments.
 See Full Corridor Study Volumes I and II as separate attachments. See Housing Values 2000-2010 and 2000-2013 as separate attachments. 2013 2 nd Quarter and Mid-Year Market Report The voice of real estate
2008 Mid-Year CAAR Market Report Real Estate Market is as Hot as ANWR
 2008 Mid-Year CAAR Market Report Real Estate Market is as Hot as ANWR By Dave Phillips, CEO Charlottesville Area Association of REALTORS Just about everything in life is relative to your perspective. Based
MONTGOMERY COUNTY JULY 2018
 STATPAK MONTGOMERY COUNTY JULY 2018 McEnearney.com MARKET IN A MINUTE A SUMMARY OF MARKET CONDITIONS FOR JUNE & FIRST HALF 2018 Contract activity in June 2018 was up 1.2% from June 2017, solely because
Weekly Market Activity Report
 Weekly Market Report A RESEARCH TOOL FROM THE MINNEAPOLIS AREA ASSOCIATION OF REALTORS BROUGHT TO YOU BY THE UNIQUE DATA-SHARING TRADITIONS OF THE REALTOR COMMUNITY For Week Ending July 7, 2018 Publish
Performance of the Private Rental Market in Northern Ireland
 Summary Research Report July - December Performance of the Private Rental Market in Northern Ireland Research Report July - December 1 Northern Ireland Rental Index: Issue No. 8 Disclaimer This report
October sales were 28.5 per cent below the 10-year October sales average of 2,700.
 News Release Housing market sees slight changes in Vancouver, B.C. November 2, The Greater Vancouver housing market saw a slight increase in the number home sales, a slight reduction in the number listings,
CITI HABITATS. Manhattan Residential Sales Market Report
 Manhattan Residential Sales Market Report Contents 4/7 12/17 3 8 9 10 Market Wide 4 Sales / Days on Market 5 / Months of Supply 6 7 Market Share Resale Co-ops Resale Condos New Developments 11 Luxury Neighborhoods
FOR IMMEDIATE RELEASE Contact: Bobette Banks Director of Communications Greater Capital Area Association of REALTORS
 FOR IMMEDIATE RELEASE Contact: Bobette Banks 301-590-8764 Director of Communications Greater Capital Area Association of REALTORS bbanks@gcaar.com April 2016 Washington, DC Market Trends Report Sales and
mymarket Report How is the market?
 How is the market?,, Tokoroa & Autumn 2016 The latest property market update for the Central North Island region. Helping you with your property decisions. The market is picking up in Central North Island
Q B O S T O N M A R K E T R E P O R T
 Q 3 2 1 7 B O S T O N M A R K E T R E P O R T Introducing the Compass Q3 217 Greater Boston Market Report Page 2 Page 3 Page 5 Page 7 Page 8 Map of Coverage Area Single Family Overview Condo Overview Time
Housing Price Forecasts. Illinois and Chicago PMSA, March 2019
 Housing Price Forecasts Illinois and Chicago PMSA, March 2019 Presented To Illinois Realtors From R E A L Regional Economics Applications Laboratory, Institute of Government and Public Affairs University
Volume II Edition III Mid Summer update
 The Realtors Canadians Trust www.arizonaforcanadians.com Volume II Edition III Mid Summer update In This Edition What is happening in the market today? Where is the market heading? The Buying Process Our