Table of Contents. Appendix...22
|
|
|
- Jason Allison
- 5 years ago
- Views:
Transcription
1
2 Table Contents 1. Background Purpose Data Sources Data Aggregation Principles Methodology Existing Population, Dwelling Units and Employment Population Distribution by Area Municipality Distribution by Policy Area Housing Housing Mix Distribution by Area Municipality Distribution by Policy Area Number Persons per Unit Employment Employment Mix Distribution by Area Municipality Distribution by Policy Area Forecasted Demand Residential Distribution by Area Municipality Distribution by Policy Area Employment Distribution by Area Municipality Distribution by Policy Area Regional Employment Land Budget Assumptions Analysis 2031 Supply Residential Housing Mix Distribution by Area Municipality Distribution by Policy Area Number Persons per Unit Employment Employment Mix Distribution by Area Municipality Distribution by Policy Area Density Analysis Methodology Environmental Exclusions Non-Environmental Exclusions Municipal Densities Policy Areas Designated Greenfield Area Urban Growth Centres Intensification Target Summary..21 Appendix
3 1. Background On April 22, 2010 Peel Regional Council adopted Regional Official Plan Amendment Number 24 (ROPA 24). This amendment addresses the Region s conformity with the Growth Plan for the Greater Golden Horseshoe (Growth Plan) in the area growth management. Adoption ROPA 24 followed an extensive consultation process that was documented in two Council reports dated March 12, 2010 and June 23, In addition, a discussion paper Places to Prosper Managing Growth in Peel Region was produced and posted on the Regional web site in September 2009 (see This discussion paper contains all background information related to growth management in Peel Region available at that time. Upon the adoption ROPA 24, the amendment with all required documentation was submitted to the Ministry Municipal Affairs and Housing (MMAH) for its approval. On October 27, 2010 the MMAH issued a draft decision containing 110 proposed modifications and two non-decision items. However, MMAH indicated in its letter that it is open to further discussions to address its proposed modifications. One the non-decision items was related to the allocation growth to the area municipalities, particularly Caledon and Brampton. 1.1 Purpose This technical report has been developed to document the background information behind the population and employment forecasts and policies and address two non-decision items included in the Province s draft decision. It documents the basis for the allocation growth to the area municipal level. It also demonstrates the Region s ability to achieve the Growth Plan targets including intensification and density targets. In addition, it describes and documents data sources, assumptions and calculations used to develop the land budget. This report includes some data that were either not available (e.g. detailed 2006 Census data) or not considered before the adoption ROPA 24. For these reasons the report also serves as an update to all previously published documents and council reports in particular the September 2009 discussion paper Places to Prosper Managing Growth in Peel Region. The Region, in cooperation with the area municipalities, will monitor the pace growth and the remaining land supply. In the future, when a new Regional Official Plan amendment to update the forecasts is considered, this report will be updated to reflect the trends documented by monitoring. 1.2 Data Sources The Growth Plan forecasts provide the framework for Peel Region s land budget analysis. The 2031 population and employment targets in Schedule 3 the Growth Plan determine the Region s residential and employment demand even though more recent forecasts have been developed by each area municipality. 1 The area municipal forecasts have been adjusted and consolidated to determine Regional housing demand, allocation to the area municipalities and policy areas. The purpose the consolidation was to ensure that all Growth Plan targets are planned to be achieved or exceeded. The Growth Plan forecasts used the 2001 Census as the source data for the base year. Since more recent and detailed data from the 2006 Census and municipal employment surveys 1 Brampton City-Wide Population and Employment Forecasts, Planning, Design and Development Committee Report, May 4, Long-Range Forecasts, City Of Mississauga , Hemson Consulting Ltd., December Population and Employment Forecasts and Allocations, Town Caledon, June
4 are now available now, this land budget uses 2006 as a base year. However, for consistency with the Growth Plan forecasts, the 2001 Census undercount 4.2% was applied to population figures. This undercount was also applied to all calculations including persons per unit (PPU). The 2006 Census is a source all existing (2006) population and housing figures including housing mix. The data for the policy areas, including the built-up area, urban growth centres and the designated greenfield area, were compiled using a custom 2006 Census data order by Peel s specific geography called Small Geographic Unit (SGU). The SGUs can easily be aggregated to the policy areas used for the land budget. The 2006 employment figures were established using a combination sources including the 2006 Census, municipal surveys as well as the area municipal and Regional employment studies. 2 Additional consultations with the area municipalities were undertaken to ensure data consistency and accuracy. As mentioned earlier, each area municipality prepared its own forecasts and corresponding analysis land supply. These data were available at the municipal level as well as at the policy area level. In cooperation with the area municipalities and in consultation with the stakeholders, Regional staff developed an adjustment methodology that reduces the municipal forecasts to create Regional forecasts consistent with the Growth Plan forecasts Data Aggregation The land budget was prepared to address different levels geography. In addition to aggregation data at the Regional level, the land budget also includes distributions to the area municipalities and policy areas. The land budget is based on the Regional and area municipal boundaries as they existed on December 31, This means that the Ninth Line Lands are not included in this analysis as they were part Halton Region until January 1, For the purpose comparability, the overall Regional and Caledon densities include only the Rural Service Centres and rural settlements in Caledon as defined in the Regional Official Plan. One the objectives this report is to demonstrate that the Region is planning to achieve specific intensification and density targets established by the Growth Plan. For this reason the land budget also distributes the data to specific policy areas including the built-up area (BUPA), the designated greenfield area (DGA) and urban growth centres (UGC). For the purpose compatibility with the area municipal and Regional totals, a category named Rural Area has been established to account for all lands outside the 2031 urban boundary as well as outside the present limits the Rural Service Centres and rural settlements in Caledon. This category includes the Greenbelt lands, most the Prime Agricultural Area and the Palgrave Estate Residential Community (PERC). It does not include the Ninth Line Lands. As stated previously, these lands are outside the scope this report. 2 Employment and Employment Lands in the Region Peel, Metropolitan Knowledge International, August Employment Land Review Study City Mississauga, Hemson Consulting Ltd., June Employment Land Strategy - City Of Brampton, Analysis and Strategic Directions, Hemson Consulting Ltd., November Employment Land Needs Study Town Caledon, Watson & Associates Economists Ltd., September 2007, (amended February 2010). 3 Description adjustment is presented in the discussion paper Places to Prosper Managing Growth in Peel Region September The Ninth Line Lands were not part the Region Peel when the Growth Plan forecasts were allocated. These lands are not within the 2031 Regional urban boundary. 4
5 The Growth Plan identifies the built-up area as lands that were generally within the developed area as date the release the Growth Plan in June The limits this area are delineated by a built boundary that the Province has established for the Greater Golden Horseshoe (GGH). In addition to the areas delineated by the built boundary, the Province has identified a number undelineated areas, which are predominantly villages and hamlets that were considered to be built-up as June Growth in the undelineated areas also counts as intensification. Both delineated and undelineated built-up areas are captured under Built- Up Area (BUPA) in the land budget. The final built-up area in Peel includes the built portions the urban system, the three Rural Service Centres (Bolton, Caledon East and Mayfield West) and Caledon Village. The Palgrave Estate Residential Community has been excluded from this category because it is a special policy area that is not fully serviced and is not designated for significant growth. The delineated built-up area has a total area approximately 48,778 ha, which 787 ha comprises the two urban growth centres. In addition, the villages and hamlets identified as undelineated built-up area occupy 1,328 ha. The land budget presented in this report includes a total area 50,106 ha under a category Built-Up Area which includes both delineated and undelineated areas. Urban growth centres (UGC) are identified by the Growth Plan as primary areas for intensification. The Growth Plan has identified two UGCs in Peel - one around Mississauga s City Centre and the other around Brampton s downtown and Queen Street corridor. The detailed boundaries each growth centre were established by the area municipalities in their ficial plans and are shown on revised Figure 16 the ROPA 24. Both urban growth centres are identified as major components Peel s regional structure and are shown conceptually on Schedule D the ROP. The UGCs in Peel are within the built-up area. Designated greenfield areas (DGA) are lands, as defined by the Province, that were not urbanized in 2006 but are designated for future urban development in the Regional Official Plan. These lands are within the 2031 urban boundary or other settlements but outside the built boundary. The total area the designated greenfield area in Peel is approximately 9,956 ha. This area includes undeveloped lands within Mississauga s Churchill Meadows planning district, most undeveloped lands within Brampton (with exception 434 ha the Greenbelt) and designated but undeveloped lands within Caledon s three Rural Service Centres (Bolton, Caledon East and Mayfield West). Potential settlement expansions for the purpose accommodating allocated growth can be designated in the future subject to municipal comprehensive review requirements the Provincial Policy Statement, the Growth Plan and the ROP. The land budget identifies these potential settlement expansions as part the unallocated category. All the policy areas described above are shown on revised Figure 16 ROPA 24 (attached). 1.4 Principles Methodology Peel Region s land budget analysis is based on the Region s 2031 population, household and employment forecasts that are consistent with the Growth Plan forecasts. The Regional forecasts also include the population and employment forecasts by area municipality. By 2031, the Region is anticipated to accommodate 1,640,000 people, 518,000 households and 870,000 jobs. These figures reflect a growth 429,000 people, 159,000 households and 268,000 jobs between 2006 and The land budget is based on a comprehensive demand/supply analysis for residential and employment growth undertaken by each area municipality and the Regional consolidation and 5
6 adjustment the area municipal work performed to assure conformity with the Growth Plan. It must be emphasized that the Regional consolidation took into account not only the principles and policies the Growth Plan but also considered the growth management objectives each area municipality. The resulting land budget demonstrates that the Region is planning to: accommodate the Growth Plan population and employment forecasts; exceed the Growth Plan residential intensification target 40%; achieve the Growth Plan greenfield density target 50 residents and jobs per hectare; exceed the Growth Plan urban growth centre density target 200 residents and jobs per hectare; and justify the need for settlement expansions. The land budget also demonstrates that the growth management objectives the area municipalities are not jeopardized and each area municipality contributes suitably to the achievement the Regional targets. The methodology utilized to achieve the above is detailed later in this report. 2. Existing Population, Dwelling Units and Employment The base year for the Growth Plan forecasts is In general, pre-2001 trends have continued after 2001 with the following two exceptions. First, Peel experienced significant residential growth between 2002 and Almost 14,000 dwelling units were built in the Region annually. Second, a significant global economic slowdown started around The slowdown reduced both residential and employment growth. The 2006 Census results reflect this impact. For this reason, the land budget described in this report uses 2006 as the base year. 2.1 Population Peel, similar to the entire Greater Toronto Area (GTA), has experienced rapid population growth between 1996 and The Growth Plan forecasts, which were based on the 2001 Census, partly reflected this trend. However, the growth between 2001 and 2006 was higher than the assumptions used for the Growth Plan forecasts. The 2006 Census reported that there were 1,159,405 people living in Peel in May For consistency with the Growth Plan, this figure was adjusted by the 2001 Census undercount 4.2%. In addition, the adjusted figure was rounded to the nearest 1,000 and matched with the total similarly derived figures for the three area municipalities. This figure is used in the land budget to represent the mid-year total population Peel. As a result, the 2006 total population Peel was established as 1,211,000. This figure is used for all land budget calculations Distribution by Area Municipality The total number residents for each area municipality was established the same way as the Regional figure. As expected, most people - 698,000 - lived in Mississauga in Mississauga s share Peel s population was almost 58% in Mississauga grew by almost 130,000 residents between 1996 and 2006 however its growth is slowing down. On the other hand, Brampton s growth is increasing. Between 1996 and 2006 Brampton s population increased by over 170,000, reaching a total 453,000 residents. Brampton s population accounted for just over 37% the Regional total in Although Caledon s growth has been 6
7 steady in recent years, its still comprises only about 5% to the Regional population figure in Caledon s total population was 60,000 in Its growth between 1996 and 2006 was about 18,000 residents Distribution by Policy Area As mentioned in chapter 1, the 2006 population for each policy area was established using Peel s custom order the 2006 Census data by SGU. SGUs represent a very detailed level geography and their boundaries match the Growth Plan policy areas. By aggregating them, the 2006 Census figures for each policy area were established. To be consistent with the 2006 Regional and municipal figures, adjustments adding the 4.2% census undercount and rounding to the nearest 1,000 were made to establish the total figures for each policy area. As expected, almost the entire population the Region (97.6%) resided within the built-up area. In 2006, only small fractions Peel s population 0.7% and 1.7% - resided in the designated greenfield area and in the rural area respectively. The presence population in the designated greenfield area is due to the general nature the built boundary. In 2006, there were still pockets vacant land within the built-up area as well as pockets new development outside the built boundary. In addition, the designated greenfield area still contained some older, rural development that also was accounted for by the 2006 Census. 2.2 Housing In order to better understand the relationship between the existing housing supply and population in Peel, the land budget uses the occupied dwelling units captured by the 2006 Census and rounded to the nearest 1,000. In 2006 Peel s housing stock consisted 359,000 dwelling units. This figure resulted from the growth 50,000 units between 2001 and The land budget presents different dimensions the 2006 housing supply in Peel. Table 1 presents the housing mix at both the Regional and municipal scales. This table also includes distributions to the area municipalities and policy areas. In addition, the land budget includes an analysis unit capacity measured by the number people per unit (PPU). Table 7 contains the details PPUs in Peel Housing Mix The land budget divides Peel s 2006 housing stock into four main housing types: single detached, semi-detached, rows (townhouses) and apartments. The apartment category includes both low-rise and high-rise apartment units, as well as duplex units. The single detached category also includes movable dwellings and links (detached houses linked by foundation). Most the 2006 housing supply was ground-related including 48.2% singles, 13.0% semis and 13.3% rows. Apartments accounted only for 25.5% Peel s total units in The share apartments in 2006 was about the same as in However, the shares semis and townhouses slightly increased from 12.4% and 12.2% respectively in On the other hand, the share singles slightly decreased in 2006 compared to These trends are expected to continue in the future Distribution by Area Municipality In 2006, the Regional housing stock was distributed among all three area municipalities. Mississauga contributed 215,000 dwelling units to the Regional total in This figure represents almost 60% the Regional total dwelling units. Mississauga s housing stock was relatively well balanced in Each housing type had a significant share in the total stock. Single detached units accounted for about 43% the total municipal figure. Apartments were 7
8 also well represented by a share 28.7%. The other two housing types semi-detached and row dwellings accounted for 28.5% Mississauga s housing stock in Brampton had 126,000 dwelling units in Brampton s share the Regional total in 2006 was just over 35%. Single detached houses accounted for 52.1% the total dwellings in Brampton in Apartments were the second most common type in this municipality accounting for 23.2% the total dwellings. Semi-detached houses and rows had the shares 13.5% and 11.2% respectively. Caledon s housing stock in 2006 included 18,000 dwelling units. This figure represents just over 5% the Regional stock. Single detached houses dominated Caledon s stock accounting for almost 86%. The shares the other three types were similar: 5.5% semis, 4.4% rows and 4.2% apartments Distribution by Policy Area Since the built boundary defines the extent development existing in 2006, almost the entire Regional housing stock (97.6%) is located within the built-up area. Only small fractions Peel s dwelling units 0.7% and 1.7% - were located in the designated greenfield area and in the rural area respectively. As explained in section 2.1.2, there were a few pockets new development outside the built boundary in In addition, the designated greenfield area still contained some older, rural developments that were captured by the 2006 Census. The rural area in Peel is very large (65,336 ha) and has mostly rural types development including the Palgrave Estate Residential Community. In 2006, 6,000 dwelling units were located within the rural area Number Persons per Unit Household composition is a very important factor affecting demand for housing units. In general, with the aging the population, changing family structure and improving quality life, the average number persons per dwelling unit (PPU) has been decreasing. This trend is expected to continue, however, there are significant variations across the GTA and even within Peel. The impact population aging on the PPU is somewhat fset by in-migrations young families that settle in Peel because a relatively large supply housing. The other significant factor affecting PPUs in Peel is related to a large number international immigrants coming to Peel. For economic and cultural reasons, recent immigrants tend to form larger households, including multi-generational households. Table 7 presents the 2006 average PPUs for the Region as well as for all three area municipalities. This table also includes a breakdown by four housing types including single detached, semi-detached, row and apartment dwellings. The total population and occupied unit figures were used to calculate all figures in this table. The figures are provided to demonstrate differences in PPUs within Peel and among housing types. In 2006, the Regional average PPU was 3.37 persons per unit. Brampton had the highest average PPU 3.60 persons per unit while Mississauga and Caledon had an average PPU 3.25 and 3.33 persons per unit respectively. There were significant variations among the four housing types. Single detached dwellings had the highest (3.70 persons per unit) Regional PPU all four types. Semi-detached dwellings had a just slightly lower PPU 3.61 at the Regional scale. The lowest average PPU was observed among apartments. This type had an average Regional PPU 2.69 persons per unit in 2006 while row housing s PPU was 3.25 persons per unit. There were also variations by housing type within each area municipality. The details are also presented in Table 7. 8
9 2.3 Employment Between 1996 and 2006 Peel Region experienced economic prosperity that resulted in significant employment growth. In spite the slow-down at the end this period, Peel still reached 602,000 jobs in Employment in Peel had a specific mix employment types as well as distribution to the municipal level and policy areas. To some extent, the characteristics Peel s employment were typical for a suburban municipality, however, there were also signs typical mature urban communities Employment Mix Peel s employment was dominated by employment lands jobs in This type employment accounted for 53.1% all jobs in the Region. This share was 320,000 jobs. On the other hand, the share major fice employment was the lowest the three employment categories - just 16.4% the total jobs in At the same time, the share population related jobs was 30.5%. This composition employment was somewhat typical for a suburban municipality going through a period rapid development. The area municipalities differ from each other with respect to employment mix. Of the three municipalities in 2006, the highest share major fice employment (21.1% total municipal employment) was in Mississauga. Caledon did not have any major fice employment, while in Brampton, this type employment accounted only for 5.9% all jobs. Mississauga had also the highest share employment lands jobs (54.2%) out the three area municipalities. In Brampton, employment lands jobs accounted for just over a half the total employment. On the other hand Caledon had the lowest share employment lands jobs 46.7% the Town s employment. Population related employment in both Brampton and Caledon had relatively high shares the total employment. In Caledon this share was 53.3% while in Brampton 43.3% the total employment in the City. On the other hand, population related jobs accounted only for about 25% total employment in Mississauga. The details employment mix in 2006 are presented in Table Distribution by Area Municipality In 2006, the geographic distribution jobs reflected the population distribution in Peel. Most the jobs were concentrated in the south the Region. There were 425,000 jobs located in Mississauga in This figure represented 70.6% all jobs in Peel. In spite the increasing roles Brampton and Caledon in the Regional economy, these two municipalities combined for 29.4% the Regional employment. In 2006, there were 156,000 jobs located in Brampton. This is 26% Peel s employment. Caledon contributed 21,000 jobs to the Regional total in In spite more than doubling its employment, Caledon s share the Regional employment was just 3.5% in Distribution by Policy Area As it was the case with residential development, almost all jobs in Peel were located within the built-up area in There were 589,500 jobs accommodated within this area. This figure represented almost 98% Peel s employment. Only small fractions the Region s jobs 1.1% and 1% - were located in the designated greenfield area and the rural area respectively. As explained in the previous sections (i.e and 2.2.3), there were already pockets new development outside the built boundary in 2006 as well as existing agricultural employment. In addition, the designated greenfield area still contained some older, rural developments that were captured by the 2006 Census. As a result, a total 6,500 jobs was located within this area in On the other hand, the rural area in Peel is very large and has mostly a rural 9
10 character. However, it accommodated agricultural and resource employment as well as many establishments serving the needs rural communities. In 2006, this area contributed 6,000 jobs to the Regional economy. The details the 2006 employment distribution can be found in Table Forecasted Demand The land budget analysis includes the forecasted demand for residential and employment categories. The residential component is based on the Region s forecasted population growth from 2006 to 2031 and its formation into households. The employment component this budget is established using the overall Growth Plan forecast 870,000 jobs and the 2006 base year data. 3.1 Residential Population growth is one the major drivers for the provision new infrastructure within the GGH, particularly within greenfield areas. Peel Region is expected to accommodate a population 1.64 million people in Overall, from 2006 to 2031, with a total population growth 429,000, Peel is expected to be the second-fastest growing upper- or single-tier municipality within the GGH. Only York Region is forecasted to grow more rapidly during this period. More rapid growth is expected at the beginning the forecasting period and slower growth is expected towards the end the forecasting period. The Region s average annual population growth from 2006 to 2031 is expected to be just over 17,000 residents. Forecasted population growth generates demand for housing. The growth 429,000 residents generates a demand for 159,000 additional dwelling units at the Regional scale by This total forecasted growth dwelling units is divided into four dwelling types: single detached, semi-detached, rows (townhouses), and apartments. The apartment category includes both lowrise and high-rise apartment units, as well as duplex units. Single detached dwellings will account for the largest share growth (35%). However, it is forecasted that apartment units will have a share just slightly lower at 33.4%. Row and semi-detached units will contribute 19.4% and 12.2% respectively to the overall housing growth in Peel. Regional growth patterns differ by the area municipality and policy area (refer to Table 2 for details) Distribution by Area Municipality Of the three area municipalities, Brampton is forecasted to accommodate the most growth. Between 2006 and 2031 Brampton s population will grow by 274,000 residents. This growth will require 88,500 additional dwelling units by Brampton s housing growth will account for 55.7% the total Regional growth. Demand for housing in Brampton will be distributed among all four housing types. Single detached dwelling units will still be the leading housing type representing 47.6% the total municipal growth between 2006 and 2031 but other housing types will have significant shares. Future population growth will also be housed in apartments 16.9% Brampton s new units; row houses 17% and semi-detached 18.5%. Most Brampton s housing growth (70%) will be provided within the designated greenfield area while 30% the dwelling units are forecasted to be built within the built-up area. 10
11 Mississauga is forecasted to grow by 107,000 residents from 2006 to This forecasted growth represents about 25% the total population growth in Peel. Mississauga s population growth will generate demand for 55,000 additional dwelling units by 2031 that corresponds to about 34.6% the total unit growth in the Region. The forecast demand for housing types in Mississauga is dominated by apartments and rows (townhouses). These two housing types will account for 88.8% the new dwellings forecasted to be built in Mississauga between 2006 and Single and semi-detached units will be a minority among the new units in Mississauga. These types will account only for 7.8% and 3.4% Mississauga s new units respectively. Since almost the entire area Mississauga is within the built boundary, most its residential growth will be achieved through intensification. It is forecasted that at least 52,000 dwelling units will be built within the built-up area. This represents almost 95% the total Mississauga s unit growth between 2006 and The designated greenfield area in Mississauga occupies only 188 hectares and will soon be fully developed. Its share Mississauga s unit growth will be just over 5%. Caledon is, and for the next 20 years will be, predominantly a rural municipality. Its population growth is forecasted to be 48,000 residents between 2006 and This expected population growth will generate a demand for 15,500 additional dwelling units. Caledon s share the Regional growth will be about 10%. The forecasted demand for housing types in Caledon is predominantly for ground-related housing. It is forecasted that singles will account for 59.5% Caledon s new units. Apartment and row dwelling units will represent 12.9% and 20% Town s housing growth respectively. Semi-detached dwellings will only account for 7.6% the total municipal growth. Caledon s ability to accommodate the forecasted demand has some limitations within the current settlement boundaries. Due to its rural character, the Town s intensification potential is very limited. It is forecasted that Caledon will be able to accommodate 1,500 units through intensification. This figure represents 9.7% Caledon s new units. Greenfield residential capacities currently exist only in Mayfield West and Caledon East. It is forecasted that both these Rural Service Centres will accommodate 18,500 residents housed in 6,000 additional units between 2006 and This unit growth represents 38.7% the total new units to be accommodated in Caledon. The rural area is expected to accommodate only 1,000 new units. Residential supply in the built-up area, in the designated greenfield area and in the rural area in Caledon does not meet the 2031 forecast demand. To meet this demand, 7,000 units will need to be accommodated in Caledon through future settlement area expansions. Since there are no specific land designations, the land budget identifies this category as unallocated. The unallocated category accounts for 45.2% Caledon s housing growth. The details the allocation residential growth to the area municipalities are shown in Table Distribution by Policy Area The residential growth forecasts are also distributed into the three policy areas including the built-up area, the designated greenfield area and the rural area based on a demand/supply analysis that considers: the forecast demand; the area municipal growth management objectives; the potential supply required within the built-up area to achieve the 40% and 50% Regional intensification targets; the potential supply in the vacant designated greenfield area; 11
12 the achievement the minimum density 50 residents and jobs per hectare within the designated greenfield area; and the additional population and units required to meet the forecast demand. It is forecasted that Peel s built-up area will account for over 50% total housing unit growth between 2006 and This share growth is equivalent to 80,000 units. Mississauga will contribute at least 52,000 units to the Regional intensification while Brampton and Caledon at least 26,500 and 1,500 units respectively. This will allow reaching the Regional intensification target 40% by 2015 and 50% by Most the forecasted new units within the built-up area will be apartments or rows (60.3% and 17.2%). All forecasted units to be built within the built-up area will house about 150,000 people. A significant portion residential growth in Peel will still be accommodated within the designated greenfield area. The 2031 allocation to this area is 71,000 units, which is about 45% the total unit growth between 2006 and Since the rural area is not planned to accommodate any significant growth (just 0.6% total unit growth), there will be a need to accommodate 21,500 people housed in 7,000 units on lands that will be future settlement area expansions. This unallocated growth will account for only 4.4% the total unit growth in the Region. This growth will be part the future designated greenfield area and will be required to achieve the minimum density 53.4 residents and jobs per hectare. This in turn will help to achieve the Regional greenfield density target 50 residents and jobs per hectare. The details the forecasted residential growth are included in Table Employment The Growth Plan also establishes growth targets for employment (jobs) to ensure that a balance population and jobs is achieved and maintained. It is forecasted that Peel Region will reach a level 870,000 jobs in This represents an increase 268,000 jobs from Similar to population growth trends, Peel is expected to experience faster employment growth at the beginning the forecasting period followed by slower growth towards the end the period. The Region s average annual employment growth between 2006 and 2031 is forecasted to be about 11,000 jobs. Table 5 shows employment growth by municipality, type and policy area. Employment lands employment is forecasted to account for the largest share Peel s growth between 2006 and Its share will be 41.6%. Major Office and population related categories are expected to have similar growth shares 29.9% and 28.5% Distribution by Area Municipality The Region s employment growth is distributed to the three area municipalities. Brampton is forecasted to absorb the largest share (59%) this growth. This share represents 158,000 new jobs. Over 54% Brampton s growth will be employment lands employment. Population related employment will constitute 28.3% new jobs while major fice employment will account for just over 17% the total job growth within the City. It is forecasted that 85,000 new jobs will be created within Mississauga between 2006 and This figure represents almost 32% the Regional employment growth. Most Mississauga s new jobs (62.1%) will be in the major fice category. Population related jobs will account for 27.4% City s new growth while employment lands jobs will account for only 10.5%. Caledon will contribute the least number jobs to the Regional total. The Town s 25,000 new jobs represent 9.3% the Regional growth. Most new jobs (66.3%) in Caledon will be employment lands employment. Population related jobs will account for 33.7% Caledon s new jobs. There will be no new major fice jobs in Caledon. 12
13 3.2.2 Distribution by Policy Area Peel s employment growth will take place in both the built-up area (142,500 jobs) and designated greenfield area (125,000 jobs). Almost 99% the Mississauga s job growth will be within the built-up area while only a small fraction will occur in the designated greenfield area. In Mississauga almost all lands are within the built-up area. In Brampton and Caledon, greenfield areas will accommodate most the employment growth. In Brampton, 65.2% new jobs will be accommodated within the designated greenfield area as opposed to 34.8% within the built-up area. Caledon s currently designated greenfield area will accommodate 40% Town s total growth. In addition, 44% the new jobs will need to be accommodated within greenfield areas that will be designated in the future. The built-up area will accommodate 14% the employment growth in Caledon. A very small portion will also be accommodated within the rural area. It is important to note that these allocations include all employment, both jobs to be created on employment lands in industrial areas and business parks and jobs to be created as part residential communities Regional Employment Land Budget Assumptions In calculating the regional employment land needs, a net-to-gross factor is applied by the Region s consultant, Metropolitan Knowledge International (MKI) and the Region to account for land that will be used in the future for roads and storm water management facilities when development occurs, and therefore will not be available for development. The Brampton and Caledon employment land studies report their existing employment land inventory in net developable terms and no additional net-to-gross factor was applied by MKI. In Mississauga, 10% was deducted from the vacant supply to allow for roads and storm water management facilities, as the City s employment land inventory figures do not already account for this factor. A lower than usual factor 10% was used for Mississauga rather than the usual 20% because Mississauga's remaining employment land supply does not contain a high proportion large parcels that will require internal roads and stormwater facilities. Gross employment land needs were calculated from the net land need figures for Caledon and Brampton. Gross land need is calculated by dividing the net land need by 80%. The 80% is the net useable portion the vacant land supply in Brampton and Caledon after land for roads and storm water management is accounted for. 4. Analysis 2031 Supply The Growth Plan forecasted that in 2031 Peel Region will reach 1,640,000 residents and 870,000 jobs. The Region in cooperation with the area municipalities is planning to accommodate this growth. Proper planning at both the Regional and area municipal levels will allow the targets and objectives the Growth Plan to be achieved. The growth that will happen between 2006 and 2031 will change the housing stock and employment composition within the Region. 4.1 Residential The growth 429,000 residents between 2006 and 2031 will generate demand for 159,000 additional dwelling units in the Region. As a result, the Regional housing stock is expected to be composed 518,000 dwelling units in Since a significant portion growth will be accommodated through intensification, the future housing stock in Peel will differ from the existing supply. The differences will be reflected in housing mix, distribution and unit density. 13
14 4.1.1 Housing Mix In 2031 the share single detached dwellings in Peel will decrease from 48.2% in 2006 to 44.3% in The share semi-detached dwellings will also decline slightly from 13% to 12.7% during the same time period. On the other hand, the shares both row houses and apartments will increase. In 2031, the apartment units will make up almost 28% Peel s housing stock. This represents a significant increase compared to 25.5% in Similarly, the share row housing units will increase from 13.2% in 2006 to 15.1% in The Regional housing mix in 2031 will be more balanced than in The area municipalities are also forecasted to experience changes in housing composition. In general, municipal trends will be similar to the Regional changes. However, there will be differences among particular municipalities. The details housing mix are presented in Tables 1, 2 and Distribution by Area Municipality In 2031, the majority the Regional housing stock will still be located in Mississauga. It is forecasted that Mississauga will have 270,000 dwelling units in Mississauga s share will account for just over 52% all units in Peel in Mississauga s housing stock will be the most evenly distributed among dwelling unit types among all three municipalities. For the first time, apartments will be the most represented type with a share 36.2% Mississauga s housing stock. The share single detached units will decrease and account for 35.7% the total municipal figure in The other two housing types semi-detached and row dwellings will account for 11.3% and 16.8% Mississauga s housing stock respectively. Brampton s role in the Regional housing stock will become more significant by Its share the Regional total will increase from 35% in 2006 to 41.4% by Brampton will have 214,500 dwelling units in Single detached houses will account for 50.2% the total dwellings in the City in This represents a slight decrease compared to Apartments will still be the second most common type in this municipality accounting for 20.6% the total dwellings. It is forecasted that the shares both semi-detached houses and row houses will increase from 13.5% and 11.2% in 2006 to 15.6% and 13.6% in 2031 respectively. By 2031 Caledon s housing stock will increase from 18,000 dwelling units in 2006 to 33,500 units by The 2031 figure will represent 6.5% the Regional stock. Single detached houses will still dominate Caledon s housing stock in 2031 accounting for almost 74% but this share is lower compared to the 2006 share almost 86%. The shares the other three housing types will increase, reaching the following values by 2031: 6.5% semis, 11.5% rows and 8.2% apartments. This represents a relatively significant increase compared to the following 2006 values: 5.5% semis, 4.4% rows and 4.2% apartments Distribution by Policy Area In 2006, almost the entire Regional housing stock (97.6%) was located within the built-up area but a small fraction Peel s dwelling units existed outside it. Significant development is forecasted to occur within both the built-up area and the designated greenfield area between 2006 and This development is planned to meet the intensification and density targets as well as the other objectives the Growth Plan. As a result, the built-up area will reach 430,500 dwelling units while the designated greenfield area will reach 80,500 units by This means that in 2031 the majority Peel s housing stock (83.1%) will be located within the built-up area. This housing stock will provide accommodation for 1,330,000 residents. The housing stock located in the designated greenfield area will only account for 15.5% the Regional housing stock in This portion the Regional housing stock will accommodate 286,000 residents. 14
15 The Rural Area, including the Palgrave Estate Residential Community, will only contribute about 1.4% the Regional housing stock in The details Regional housing stock by policy area are presented in Table 3. This table also includes distributions by policy area within each area municipality Number Persons per Unit As mentioned in chapter 2, the average number persons per dwelling unit (PPU) is expected to decrease over the next 20 years. Table 7 presents the forecasted 2031 average PPUs for the Region as well as for all three area municipalities. This table also contains the details for four housing types including single detached, semi-detached, row and apartment dwellings. Similar to the 2006 PPUs, the total population and occupied unit figures were used to calculate all PPU values in this table. In 2031, the Regional average PPU is forecasted to be 3.17 persons per unit down from 3.37 persons per unit in Brampton is expected to have the highest average PPU 3.39 persons per unit while Mississauga will have the lowest (2.98 persons per unit). Caledon s average PPU will be 3.22 persons per unit in There will be significant variations among the four housing types. Single detached dwellings are expected to have the highest (3.52 persons per unit) Regional PPU all four housing types. Semi-detached dwellings will have slightly lower PPU at the Regional scale. The lowest average PPU is forecasted to be among apartments. This type will have an average Regional PPU 2.54 persons per unit in 2031 while row houses will have a PPU 3.08 persons per unit. There will also be variations by housing type within each area municipality. 4.2 Employment Peel Region will reach a level 870,000 jobs by 2031 as required by the Growth Plan. Similar to residential growth, Peel s forecasted employment growth is expected to occur in a managed manner, implementing objectives and targets the Growth Plan. It is planned to be accommodated within both the built-up area and the designated greenfield area. As a result, the prile Peel s employment will be different in 2031 than in Employment Mix In 2031, Peel s employment will be more intensive. Intensification will have an impact on the Region s employment composition. The share employment lands employment will decrease from 53.1% the total employment in 2006 to 49.6% in On the other hand, the share major fice employment will increase from 16.4% the total jobs in 2006 to 20.5% in The share population related jobs will stay at about the same level 30% in The highest share major fice employment (28.1% total municipal employment) will be in Mississauga in In Brampton, the share major fice jobs will be just over 17% while Caledon will still not have any employment this type. In both Brampton and Caledon, employment lands jobs will account for more than a half the total employment. In Mississauga, this share will be less than 50%. Population related employment in both Mississauga and Brampton will stay relatively stable at just below 30% the total employment each municipality. In Caledon, this share will be much higher 42.3% the total municipal employment. It can be concluded that in the next 20 years the Region s employment mix will become more evenly distributed by type by accommodating more major fice jobs. 15
16 4.2.2 Distribution by Area Municipality In spite the increasing roles Brampton and Caledon in the Regional economy, Mississauga will still accommodate the most jobs (510,000) the three area municipalities in Mississauga s share will account for 58.6% the total jobs in the Region. However, this share is lower compared to over 70% in The shares both Brampton and Caledon will be higher than in Brampton s total number jobs will be 314,000 in This figure is equivalent to 36.1% the Regional employment. It is a significant increase when compared with 25.9% in Caledon is forecasted to accommodate 46,000 jobs by It will be 25,000 more jobs than in In spite more than doubling its employment, Caledon s share the Regional employment will be just 5.3% in Distribution by Policy Area Similar to housing, most Peel s jobs (over 84%) will also be located within the built-up area in The designated greenfield area the Region is forecasted to accommodate 131,500 jobs by This figure is equivalent to just over 15% total Regional employment in A small fraction about 1% Peel s employment will be located within the rural area the Region. Almost all Mississauga s jobs will be accommodated within the built-up area. The built-up area will also account for the largest share employment in Brampton. In 2031 Brampton s portion the built-up area will accommodate 65.3% the City s total employment. In Caledon this share will be only 39.1%. The designated greenfield area will have the largest share employment in Caledon. It will account for almost 46.9% the Town s employment. In spite its marginal growth, the rural area will still accommodate 14.1% Caledon s jobs in In Brampton, the greenfields share jobs will be 34.7% the City s total employment in A significant growth employment within Brampton s designated greenfield area will not be enough to achieve a balance between the two policy areas in Brampton as employment in the built-up area will exceed employment in the designated greenfield area. The details the 2031 employment distribution can be found in Table Density Analysis The density analysis presented in this paper addresses the requirements the Growth Plan to focus growth in policy areas such as the designated greenfield area and Urban Growth Centres. The Growth Plan also emphasizes the importance the combined density residents and jobs. For these reasons, the main objective this report is to present the existing and planned combined residential and employment densities for the above two policy areas. In addition, for reference and comparison purposes, the report includes gross Regional and municipal densities. For consistency with the Growth Plan, the densities within the Urban Growth Centres are measured for gross lands while the densities within the designated greenfield area exclude major environmental features and infrastructure. This report also serves as an update to the density analysis included in the Places to Prosper Managing Growth in Peel Region discussion paper. 5.1 Methodology All densities presented in this report reflect a combined number both residents and jobs within a specific geography. Average Regional and municipal densities are calculated over the entire area the Region or a particular area municipality. These values represent gross densities. 16
17 Similarly, the UGC s densities are measured at the gross level. This is consistent with the Growth Plan. In the case the designated greenfield area, the Growth Plan provides for netting out major environmental features (take-outs). During the approval process, the Province engaged in more detailed discussions with municipalities regarding additional take-outs. This resulted in revisions to the take-outs in Peel. Peel s land budget includes existing major infrastructure such as 400-series freeways, hydro corridors, major transmission stations, gas pipelines and railways as take-outs. In addition, some existing uses such as cemeteries, grave yards, burial grounds as well as water and wastewater facilities are also excluded Environmental Exclusions Peel s environmental exclusions were originally described in the Places to Prosper growth management discussion paper. Subsequently, refinements were made as a result the comments received during the consultation process on ROPA 24. A final list excluded features is included below. Environmental Exclusions wetlands woodlands valleylands areas natural and scientific interest environmentally sensitive or significant areas waterbodies/fish habitat wildlife habitat (currently no data for this exclusion) habitat endangered and threatened species (currently no data for this exclusion) Oak Ridges Moraine Conservation Plan (ORMCP) Exclusions key natural heritage features hydrologically sensitive features Environmental feature take outs would be applicable when features are identified in an ficial plan or provincial plan and the applicable provincial plan or policy prohibits development in the features. Data sources include: all Core Areas the Greenlands System as shown on the Region Peel Official Plan Schedule A; the Natural Core Areas and Natural Corridors components the Caledon Ecosystem Framework which are designated as Environmental Policy in the Caledon Official Plan.; all Natural Heritage Features and Areas identified on Schedule D to the City Brampton Official Plan; and all Natural Heritage System features categorized as Significant Natural Sites, Natural Sites and Natural Greenspace as identified on Schedule A to the City Mississauga Official Plan. Environmental exclusions were calculated using more detailed secondary plan information where data exists (e.g. Bram West, Countryside Villages, Mount Pleasant, Mayfield West and Caledon East). Environmental exclusions also include an additional 10 m buffer from all natural features within the City Brampton. The additional 10 m buffer was not applied to the Mount Pleasant Secondary Plan Natural Heritage System which already incorporates buffers within the NHS. Vegetation protection zones specified in the ORMCP are applied to all key natural heritage features and hydrologically sensitive features within the ORMCP Area Non-Environmental Exclusions The following non-environmental features were considered as exclusions in the land budget: Infrastructure Exclusions existing hydro transmission corridors (includes entire ROW using current parcel fabric); 17
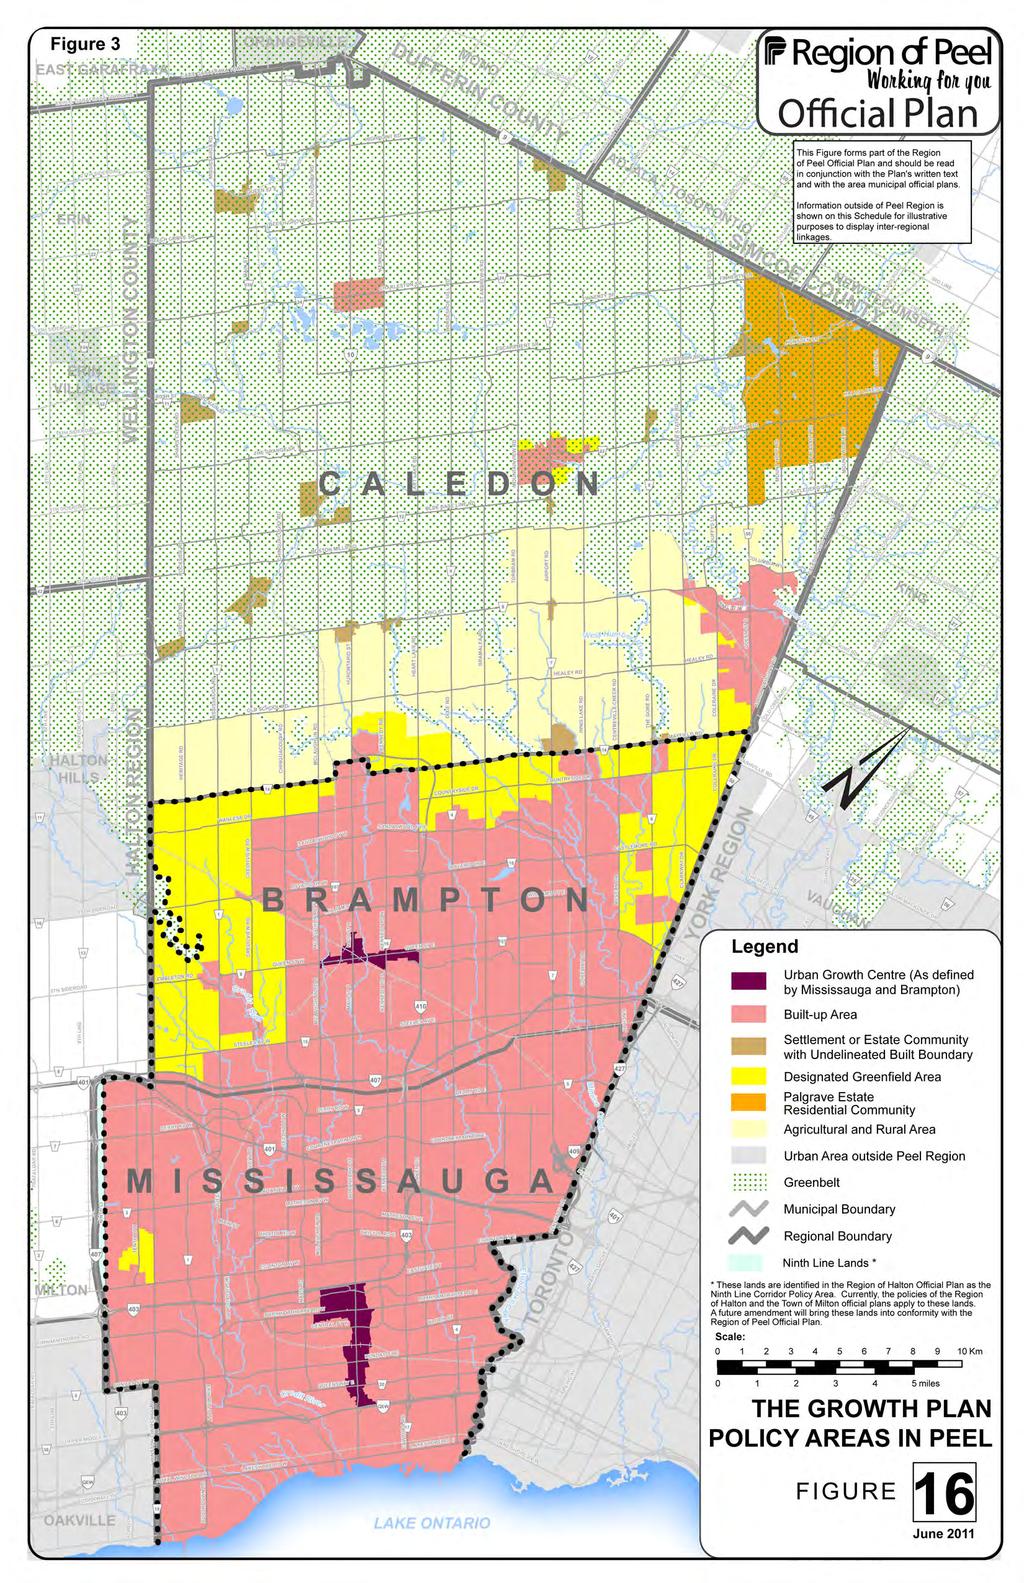
18 existing water and wastewater facilities; existing rail lines (includes entire ROW using current parcel fabric); TransCanada pipeline ROW (20 m ROW width) existing 400 Series Highways (Highway entire ROW based on current parcel fabric) Existing Uses Exclusions cemeteries, graveyards and burial grounds Maple Lodge Farms sewage lagoons Table 12 includes the details as to the amount non-environmental lands that were excluded from the calculations greenfield densities at the Regional scale as well as at the area municipal level. In addition Figure 4 displays the extent both categories exclusions. 5.2 Municipal Densities Municipal densities included in Table 14 are only provided for information. The figures represent gross values and are applicable to all policy areas within the area municipalities including the built-up area and the designated greenfield area. In the case Caledon, the densities apply only to Rural Service Centres and rural settlement areas. In 2006, Peel s average gross density was about 30 residents and jobs per hectare. Mississauga had the highest gross density almost 39 residents and jobs per hectare. On the other hand Caledon, because its character, had the lowest density at 12 residents and jobs per hectare while Brampton s density was about 23 residents and jobs per hectare. The gross densities will be significantly higher at the 2031 built-out. The Region is expected to reach an overall average gross density almost 41 residents and jobs per hectare. On average, Mississauga will still continue to be the densest municipality with almost 46 residents and jobs per hectare. Brampton s average gross density will significantly increase to almost 39 residents and jobs per hectare. Caledon s density (in the Rural Service Centres and rural settlement areas only) will also grow reaching 24 residents and jobs per hectare in Policy Areas This report analyses densities within the two policy areas that have the targets established by the Growth Plan the designated greenfield area and Urban Growth Centres. The designated greenfield area in Peel, as originally defined in the Provincial technical paper 5, included undeveloped lands within the 2031 urban boundary and the three rural service centres (Bolton, Caledon East and Mayfield West) and the Palgrave Estate Residential Community and covered 11,995 hectares as indicated in the Places to Prosper discussion paper. Subsequently, after consultation on draft ROPA 24, Palgrave Estates greenfield lands were excluded from the Regional designated greenfield area. This change reduced Peel s gross greenfield land area to 10,190 hectares. The 2031 urban boundary is proposed to be adjusted to exclude the Greenbelt area in Brampton. This change results in the reduction the designated greenfield area in Peel to 9,956 hectares. The detailed boundaries each Urban Growth Centre are defined in the respective area municipal ficial plans. As defined by the City Mississauga, its Urban Growth Centre covers 568 hectares. Brampton s UGC is smaller and encompasses only 219 hectares gross lands. 5 Built Boundary for the Growth Plan for the Greater Golden Horseshoe, 2006, Ministry Public Infrastructure and Renewal, April 2,
19 Figure 3 shows the extents each policy area while Table 11 the details land area Designated Greenfield Area The Growth Plan requires planning for a minimum combined density 50 residents and jobs per hectare within designated greenfield areas by The land budget presented here includes detailed calculations the combined residential and employment density within the designated greenfield area. Tables 13 and 14 present these details as well as the contributions the area municipalities to Peel s greenfield density target. By 2031, Peel s designated greenfield area is expected to be almost fully developed. It has been documented in Table 13 that the Region Peel is planning to achieve a minimum combined density 50 residents and jobs per hectare within its designated greenfield area. It can be concluded from Table 13 that Mississauga will significantly exceed the Growth Plan target 50 residents and jobs per hectare on existing greenfields. However, should the Ninth Line Lands be added to the designated greenfield area, the density target for Mississauga will be revised in anticipation the considerable environmental and infrastructure constraints on these lands and the types development (e.g. employment, recreational) that may be appropriate for all or a portion these lands. The Regional target will primarily be shaped by Brampton and Caledon s greenfield growth. Brampton s greenfield development is forecasted to exceed the Growth Plan target 50 residents and jobs per hectare. Caledon s greenfield density is forecasted to be lower than within Brampton and Mississauga but will still provide a significant contribution to the Regional target taking into account the character this municipality and the fact that committed secondary plans include extensive employment areas at very low densities. Caledon s average greenfield density is expected to reach a level 42 residents and jobs per hectare. This level can only be reached with the contribution future settlement area expansions approximately 609 ha that should be planned to achieve at least 53.4 residents and jobs per hectare. The proposed land budget also demonstrates that, notwithstanding the increased emphasis on intensification, the Region will meet the greenfield density target 50 residents and jobs per hectare. This density could be higher with an intensification rate that just meets the required Growth Plan minimum. However, the Region plans to exceed the minimum 40% target after Municipal Comprehensive Review will be used to ensure that the Regional greenfield density will not be lower than 50 residents and jobs per hectare. Table 13 includes the detailed calculations that result from the take-out methodology presented in this chapter Urban Growth Centres In addition to the designated greenfield area, the Growth Plan also established a specific density target for the urban growth centres. The Growth Plan requires planning for a minimum combined density 200 residents and jobs per hectare within each the two growth centres in Peel. A density target for the urban growth centres represents a gross density. In 2006, both Peel s UGCs were only partly developed. Development within Mississauga s UGC was more advanced than within Brampton s UGC. In 2006, Mississauga s UGC had a density about 171 residents and jobs per hectare. Brampton s UGC was 84 residents and jobs per hectare. However, both centres are planned to exceed the Growth Plan minimum density 200 residents and jobs per hectare. It is forecasted that Brampton s UGC will reach 215 residents and jobs per hectare by By 2031, Mississauga s UGC is expected to have a density 19
20 about 273 residents and jobs per hectare. It is important to indicate that Mississauga s UGC has the potential to achieve the density residents and jobs per hectare at full buildout. 6. Intensification Target The residential intensification rate is calculated as a percentage the total growth that will be occurring annually within the built-up area (both delineated and undelineated portions). In implementing the Growth Plan, Regional staff gave priority to accommodating significant growth through intensification as opposed to increasing greenfield densities with the view that achieving intensification represents good planning and contributes to the development complete communities by optimizing the use under-utilized lands and existing and planned infrastructure. Figure 2 shows the rate intensification over the entire forecasting period. The figure illustrates that Peel s intensification rate is initially above the 40% level due to development continuing to occur on both sides the built boundary. Peel is expected to meet the Growth Plan s requirement achieving a minimum 40% level intensification by The average intensification rate from will be well above 40%. Post-2021, the intensification rate gradually increases reaching 50% in 2026 and staying above 50% until In total, 80,000 additional dwelling units are expected to be accommodated within the built-up area the Region between 2006 and Mississauga will be a major contributor to intensification in Peel because by 2015, the remaining portion designated greenfield areas in Mississauga will be fully developed such that all annual growth will contribute towards the intensification targets. There remains the possibility that the current trend high growth in Mississauga s City Centre will be maintained and possibly spread in some form to other areas. New Regional and municipal growth management policies will help to maintain this trend. It is forecasted that 52,000 dwelling units will be built within Mississauga s portion the built-up area between 2006 and Although Mississauga brings a strong contribution to intensification in Peel, it should be noted that Brampton has an increasing contribution to intensification in Peel as a result increased high density residential activity in Downtown Brampton and the Queen Street Corridor. Within the same period, a minimum 26,500 dwelling units are planned to be accommodated within the built-up area in Brampton. Caledon s contribution to the Regional intensification is limited by its mostly rural character. It is estimated that between 2006 and 2031 the Town will accommodate 1,500 dwellings within its portion the built-up area and within the settlements with the undelineated built boundary. The proposed intensification rates provide a good balance between intensification and greenfield development and exceed the minimum requirements the Growth Plan. It is important to highlight that by planning to exceed the Growth Plan minimum intensification target 40%, an additional 7,500 dwelling units have been allocated to the built-up area over the minimum requirements the Growth Plan. Figures 1 and 2 demonstrate both the absolute and relative surplus intensification units in relation to this target in Peel. 20
21 7. Summary The land budget presented in this report clearly demonstrates that the Region Peel in cooperation with the area municipalities has planned: for 1,640,000 residents and 870,000 jobs by 2031; to meet 200 residents & jobs per hectare within the urban growth centres (both UGCs have been planned to exceed this target); to meet the 50 residents and jobs per hectare greenfield density target within the designated greenfield area with the contribution future settlement area expansions approximately 609 ha that should be planned to achieve at least 53.4 residents and jobs per hectare; to meet the intensification target (40%) and exceed it after 2025 (50%); and as a result, for 7,500 more than the required minimum number dwelling units to be accommodated within the built-up area. The above targets were able to be planned for while respecting the growth management objectives each area municipality. 21
22 Appendix The growth targets in this document (specifically in Tables 1-15 this appendix) have been derived from the forecasts developed by the area municipalities which have been adjusted to conform to all the targets the Growth Plan and the Regional Official Plan. The area municipal forecasts have been reduced to meet the Region Peel forecasts and targets in the Growth Plan. The area municipalities can accommodate additional growth, including additional intensification, but such growth cannot occur within the established Growth Plan forecasts for the Region Peel. The area municipalities can use their forecasts for long-term infrastructure planning as expressed in policy that states:...forecasts beyond the 2031 planning horizon may be used for long-term infrastructure planning, as well as community planning within the urban boundary, undertaken by the Region and/or Area Municipalities, as long as they maintain consistency with the objectives and intent the provincial Growth Plan and the Regional Official Plan. It is anticipated that the Province will be releasing new Growth Plan forecasts in the future at which time a further distribution to the area municipalities will be undertaken through an Official Plan Amendment. 22
23 Table 1: 2006 Housing Mix by Municipality and Policy Area Policy Area/Municipality Dwelling Units Brampton Caledon Mississauga Peel 126,000 18, , ,000 Singles 52.1% 85.9% 42.8% 48.2% Entire Municipality Percentage Semis 13.5% 5.5% 13.3% 13.0% Towns 11.2% 4.4% 15.2% 13.3% Apartments 23.2% 4.2% 28.7% 25.5% 124,500 12, , ,500 Built-up Area Designated Greenfield Area Rural Area Percentage Percentage Percentage Singles 51.7% 83.3% 42.8% 47.4% Semis 13.6% 6.8% 13.2% 13.1% Towns 11.3% 5.8% 15.2% 13.5% Apartments 23.4% 4.1% 28.8% 26.0% 1, ,000 2,500 Singles 89.1% 0.0% 47.1% 72.3% Semis 3.7% 0.0% 29.8% 14.1% Towns 2.2% 0.0% 23.1% 10.6% Apartments 5.0% 0.0% 0.0% 3.0% 0 6,000 NA 6,000 Singles % NA 92.5% Semis 0 2.7% NA 2.7% Towns 0 1.3% NA 1.3% Apartments 0 3.5% NA 3.5% Sources: 2011 Census. Brampton City-Wide Population and Employment Forecasts, Planning, Design and Development Committee Report, May 4, Long-Range Forecasts, City Of Mississauga , Hemson Consulting Ltd., December Population and Employment Forecasts and Allocations, Town Caledon, June 2006.
24 Table 2: Housing Growth by Type, Municipality and Policy Area Policy Area/Municipality Dwelling Units Brampton Caledon Mississauga Peel 88,500 15,500 55, ,000 Singles 47.6% 59.5% 7.8% 35.0% Entire Municipality Percentage Semis 18.5% 7.6% 3.4% 12.2% Towns 17.0% 20.0% 23.1% 19.4% Apartments 16.9% 12.9% 65.7% 33.4% 26,500 1,500 52,000 80,000 Built-up Area Designated Greenfield Area Total Unallocated Rural Area Percentage Percentage Percentage Percentage Singles 32.5% 52.9% 7.0% 16.6% Semis 12.7% 1.8% 3.0% 6.2% Towns 8.1% 7.4% 22.1% 17.2% Apartments 46.7% 37.9% 67.9% 60.3% 62,000 6,000 3,000 71,000 Singles 54.0% 58.2% 21.2% 52.9% Semis 21.0% 10.0% 9.6% 19.6% Towns 20.8% 25.8% 40.8% 22.1% Apartments 4.2% 6.0% 28.4% 5.4% NA 7,000 NA 7,000 Singles NA 58.2% NA 58.2% Semis NA 10.0% NA 10.0% Towns NA 25.8% NA 25.8% Apartments NA 6.0% NA 6.0% 0 1,000 NA 1,000 Singles 0.0% 100.0% NA 100.0% Semis 0.0% 0.0% NA 0.0% Towns 0.0% 0.0% NA 0.0% Apartments 0.0% 0.0% NA 0.0% For more details please see the following studies: Brampton City-Wide Population and Employment Forecasts, Planning, Design and Development Committee Report, May 4, Long-Range Forecasts, City Of Mississauga , Hemson Consulting Ltd., December Population and Employment Forecasts and Allocations, Town Caledon, June Discussion paper Places to Prosper Managing Growth in Peel Region September 2009
25 Table 3: 2031 Housing Mix by Municipality and Policy Area Policy Area/Municipality Dwelling Units Brampton Caledon Mississauga Peel 214,500 33, , ,000 Singles 50.2% 73.8% 35.7% 44.3% Entire Municipality Percentage Semis 15.6% 6.5% 11.3% 12.7% Towns 13.6% 11.5% 16.8% 15.1% Apartments 20.6% 8.2% 36.2% 27.9% Built-up Area Designated Greenfield Area¹ Rural Area Percentage Percentage Percentage 151,000 13, , ,500 Singles 47.9% 79.3% 35.7% 41.7% Semis 13.4% 6.1% 11.2% 11.8% Towns 10.7% 6.0% 16.6% 14.2% Apartments 28.0% 8.6% 36.5% 32.3% 63,500 13,000 4,000 80,500 Singles 54.7% 58.2% 25.2% 54.0% Semis 20.7% 10.0% 12.8% 18.5% Towns 20.4% 25.8% 38.0% 22.1% Apartments 4.2% 6.0% 24.0% 5.4% 0 7,000 NA 7,000 Singles % NA 93.1% Semis 0 2.5% NA 2.5% Towns 0 1.2% NA 1.2% Apartments 0 3.2% NA 3.2% ¹ - Includes 7,000 units allocated to Caledon that will be accommodated through future settlement expansions. For more details please see the following studies: Brampton City-Wide Population and Employment Forecasts, Planning, Design and Development Committee Report, May 4, Long-Range Forecasts, City Of Mississauga , Hemson Consulting Ltd., December Population and Employment Forecasts and Allocations, Town Caledon, June Discussion paper Places to Prosper Managing Growth in Peel Region September 2009
26 Table 4: 2006 Employment Mix by Municipality and Policy Area Policy Area/Municipality Jobs Brampton Caledon Mississauga Peel 156,000 21, , ,000 Population 43.3% 53.3% 24.7% 30.5% Related Entire Municipality Percentage Major Office 5.9% 0.0% 21.1% 16.4% Employment 50.8% 46.7% 54.2% 53.1% Lands 150,000 14, , ,500 Population 43.0% 32.4% 24.7% 29.5% Related Built-up Area Percentage Major Office 6.2% 0.0% 21.1% 16.8% Employment 50.8% 67.6% 54.2% 53.7% Lands 6, ,500 Population 48.8% 100.0% 0.0% 52.7% Designated Greenfield Related Percentage Area Major Office 0.0% 0.0% 0.0% 0.0% Employment 51.2% 0.0% 0.0% 47.3% Lands 0 6,000 NA 6,000 Population 0.0% 100.0% NA 100.0% Related Rural Area Percentage Major Office 0.0% 0.0% NA 0.0% Employment 0.0% 0.0% NA 0.0% Lands Notes: Population Related Employment is employment that exists in response to a resident population that is primarily not located in employment areas or major fice jobs. City Brampton Employment Land Strategy Hemson Consulting, November 2008 Major Office Employment is generally defined as freestanding fice buildings 10,000 m2 or greater, or with 500 jobs or more. Growth Plan for the Greater Golden Horseshoe, 2006 Ministry Public Infrastructure and Renewal, 2006 Employment Land Employment is generally defined as clusters business and economic activities including, but not limited to, manufacturing, warehousing, fices, and associated retail and ancillary facilities. Peel Region Official Plan Amendment number 24, Region Peel, 2010
27 Table 5: Employment Growth by Type, Municipality and Policy Area Policy Area/Municipality Jobs Brampton Caledon Mississauga Peel 158,000 25,000 85, ,000 Population Related 28.3% 33.7% 27.4% 28.5% Entire Municipality Percentage Major Office 17.3% 0.0% 62.1% 29.9% Employment Lands 54.4% 66.3% 10.5% 41.6% 55,000 3,500 84, ,500 Built-up Area Designated Greenfield Area Total Unallocated Rural Area Percentage Percentage Percentage Percentage Population Related 29.1% 79.1% 26.5% 28.8% Major Office 29.2% 0.0% 62.9% 48.3% Employment Lands 41.7% 20.9% 10.6% 22.9% 103,000 10,000 1, ,000 Population Related 27.9% 11.5% 2.1% 26.2% Major Office 9.9% 0.0% 0.0% 9.0% Employment Lands 62.2% 88.5% 97.9% 64.8% NA 11,000 NA 11,000 Population Related NA 36.0% NA 36.0% Major Office NA 0.0% NA 0.0% Employment Lands NA 64.0% NA 64.0% NA 500 Population Related 0.0% 100.0% NA 100.0% Major Office 0.0% 0.0% NA 0.0% Employment Lands 0.0% 0.0% NA 0.0% Notes: Population Related Employment is employment that exists in response to a resident population that is primarily not located in employment areas or major fice jobs. City Brampton Employment Land Strategy Hemson Consulting, November 2008 Major Office Employment is generally defined as freestanding fice buildings 10,000 m2 or greater, or with 500 jobs or more. Growth Plan for the Greater Golden Horseshoe, 2006 Ministry Public Infrastructure and Renewal, 2006 Employment Land Employment is generally defined as clusters business and economic activities including, but not limited to, manufacturing, warehousing, fices, and associated retail and ancillary facilities. Peel Region Official Plan Amendment number 24, Region Peel, 2010
28 Table 6: 2031 Employment Mix by Municipality and Policy Area Policy Area/Municipality Jobs Brampton Caledon Mississauga Peel 314,000 46, , ,000 Population 28.3% 42.3% 25.2% 29.9% Related Entire Municipality Percentage Major Office 17.3% 0.0% 28.1% 20.5% Employment 54.4% 57.7% 46.7% 49.6% Lands 205,000 18, , ,000 Population 29.1% 41.5% 25.0% 29.4% Related Built-up Area Percentage Major Office 29.2% 0.0% 28.2% 22.9% Employment 41.7% 58.5% 46.8% 47.7% Lands 109,000 21,500 1, ,500 Population 27.9% 27.0% 98.0% 28.5% Designated Greenfield Related Percentage Area¹ Major Office 9.9% 0.0% 0.0% 7.6% Employment 62.2% 73.0% 2.0% 63.9% Lands 0 6,500 NA 6,500 Population 0.0% 100.0% NA 100.0% Related Rural Area Percentage Major Office 0.0% 0.0% NA 0.0% Employment 0.0% 0.0% NA 0.0% Lands Notes: ¹ - Includes 11,000 jobs allocated to Caledon that will be accommodated through future settlement expansions. Population Related Employment is employment that exists in response to a resident population that is primarily not located in employment areas or major fice jobs. City Brampton Employment Land Strategy Hemson Consulting, November 2008 Major Office Employment is generally defined as freestanding fice buildings 10,000 m2 or greater, or with 500 jobs or more. Growth Plan for the Greater Golden Horseshoe, 2006 Ministry Public Infrastructure and Renewal, 2006 Employment Land Employment is generally defined as clusters business and economic activities including, but not limited to, manufacturing, warehousing, fices, and associated retail and ancillary facilities. Peel Region Official Plan Amendment number 24, Region Peel, 2010
29 Table 7: Number Persons per Unit (PPU)* in 2006 and 2031 Year Municipality Housing Type Singles Semis Rows Apts Total 4 types Brampton Caledon Mississauga Peel Brampton Caledon Mississauga Peel * - PPU reflect population with undercount Note: This is a "gross" ppu which includes household population, non-household population and the net undercoverage. The "gross" ppu is about 5% higher than the actual household population per occupied unit.
30 Table 8: 2006 Population and Employment by Municipality and Policy Area Category Policy Area/Municipality Brampton Caledon Mississauga² Peel Total 453,000 60, ,000 1,211,000 BUPA¹ 447,500 40, ,000 1,182,500 Population UGC 6, ,000 71,500 DGA 5, ,000 8,500 Rural Area 0 20,000 NA 20,000 Total 156,000 21, , ,000 BUPA¹ 150,000 14, , ,500 Jobs UGC 12, ,000 44,000 DGA 6, ,500 Rural Area 0 6,000 NA 6,000 Table 9: 2031 Population and Employment by Municipality and Policy Area Population Jobs Municipality Brampton Caledon Mississauga² Peel Total 727, , ,000 1,640,000 BUPA¹ 494,000 44, ,000 1,330,000 UGC 26, , ,000 DGA 233,000 40,000 13, ,000 Rural Area 0 24,000 NA 24,000 Total 314,000 46, , ,000 BUPA¹ 205,000 18, , ,000 UGC 21, ,000 68,000 DGA 109,000 21,500 1, ,500 Rural Area 0 6,500 NA 6,500 Table 10: Population Growth by Municipality and Policy Area Population Municipality Brampton Caledon Mississauga² Peel Total 274,000 48, , ,000 BUPA¹ 46,500 4,000 97, ,500 UGC 19,500 NA 43,000 62,500 DGA 227,500 40,000 10, ,500 Rural Area 0 4,000 NA 4,000 Notes: BUPA - Built-Up Area DGA - Designated Greenfield Area UGC - Urban Growth Centre ¹ - BUPA includes also population and jobs located within UGC ² - Mississauga's figures do not include population and jobs within the Ninth Line Lands
31 Table 11: Land (ha) by Municipality and Policy Area for Density Calculations Municipal Policy Area Municipality Density DGA Total Area BUPA UGC Rural Area Area Gross Developable Brampton¹ 26,946 26,712 17, ,745 6,768 Caledon² 69,599 4,497 3, ,102 1, Mississauga³ 29,211 28,853 28, NA Peel 125,756 60,062 50, ,336 9,956 7,815 Notes: BUPA - Built-Up Area DGA - Designated Greenfield Area UGC - Urban Growth Centre ¹ - Brampton's total area includes 234 ha the Greenbelt but density area does not. ² - Caledon's gross area includes only lands within Rural Service Centres, villages and hamlets. Assumption, that additional 609 hectares will be added through future expansions, is made to calculate 2031 density. ³ - Mississauga's total area includes 358 ha the Ninth Line Lands but density area does not. Table 12: Non-Environmental Exclusions within DGA (ha)¹ Category/Municipality Total Existing Freeways Existing Railways Existing Hydro Corridors TransCanada Pipeline ROW Cemeteries, Graveyards and Burial Grounds Maple Lodge Farms Sewage Lagoons Water & Wastewater Facilities Brampton Caledon Mississauga Peel Note: ¹ - Only portions that do not overlap with major environmental features and with each other.
32 Table 13: Calculation Density within Designated Greenfield Area Municipality DGA Residents Jobs Gross Major Env. Features DGA Lands (ha) Major Infrastructu re and Existing Uses¹ Total Exclusions Developable Lands Brampton 233, ,000 8,745 1, ,977 6, Caledon 18,500 10,500 1, Mississauga 13,000 1, Current DGA in Peel 264, ,500 9,956 1, ,141 7, Unallocated Caledon 21,500 11,000 NA Caledon with Unallocated 40,000 21,500 NA 1, DGA in Peel 286, ,500 NA 8, Note: ¹ - Only portions that do not overlap with major environmental features and with each other. P2G Density Table 14: Combined Densities by Municipality and Policy Area (residents and jobs per hectare) Municipality Entire Entire BUPAº UGCº DGA¹ Mun.º Mun.º BUPAº UGCº DGA¹ Brampton² Caledon² NA NA 42 Mississauga³ Peel Notes: BUPA - Built-Up Area DGA - Designated Greenfield Area UGC - Urban Growth Centre º - gross density ¹ - P2G density (environmental features and major infrastructure netted out) ² - In Caledon densities apply only to Rural Service Centres, villages and hamlets while in Brampton calculations exclude a small portion (234 ha.) the Greenbelt ³ - Mississauga's density does not apply to the Ninth Line Lands
33 Table 15 : Revised Table 3 ROP Table 3: Population, Household and Employment Forecasts for Peel¹ Municipality Population² Households Employment Population² Households Employment Brampton 635, , , , , ,000 Caledon 87,000 28,000 40, ,000 33,500 46,000 Mississauga 768, , , , , ,000 Peel 1,490, , ,000 1,640, , ,000 Notes: ¹ The Province is reviewing the forecasts included in Schedule 3 the Growth Plan. After Schedule 3 is amended, Table 3 will also need to be amended. ² Population figures include the 2001 Census undercount 4.2%.
34 Figure 1: Surplus Intensification in Peel Number Units Note: represent actual units based on the building permit data while the forecasted Adopted Scenario 40% Scenario
35 Figure 2: Intensification Rate in Peel Note: represent actual units based on the building permit data while Adopted Scenario 40% Scenario
36
Table of Contents. Title Page # Title Page # List of Tables ii 6.7 Rental Market - Townhome and Apart ment Rents
 RESIDENTIAL MONITORING REPORT 2013 Table of Contents Title Page # Title Page # List of Tables ii 6.7 Rental Market - Townhome and Apart ment Rents 21 List of Figures iii 7.0 Other Housing Demands and Trends
SHAPING NINTH LINE GROWTH MANAGEMENT ANALYSIS FINAL REPORT. HEMSON C o n s u l t i n g L t d.
 SHAPING NINTH LINE GROWTH MANAGEMENT ANALYSIS FINAL REPORT HEMSON C o n s u l t i n g L t d. May 16, 2017 EXECUTIVE SUMMARY Hemson Consulting Ltd. has been engaged to provide supporting analysis and documentation
Development Charges Update
 Development Charges Update Growth Management Committee April 30, 2015 Agenda Background Growth Management Program Growth Forecasts Preliminary DC Rate Changes DC Policy Considerations Stakeholder Engagement
2019 DC Study External Stakeholder Committee Minutes
 Date / Time: October 10 th, 2017 1:30pm 3:30pm Location: Committee Room #1, 2 nd Floor City Hall 2019 DC Study External Stakeholder Committee Minutes Attended: George Kotsifas (Chair), Lois Langdon, Sandy
Our Focus: Your Future 2007 YEAR END HOUSING MONITORING AND SUBDIVISION STATUS REPORTS
 Town of Fort Erie Community & Development Services Our Focus: Your Future Prepared for Council-in-Committee Report No. CDS-011-08 Agenda Date February 4,2008 File No. 350204/350308 Subject 2007 YEAR END
2006 YEAR END HOUSING MONITORING AND SUBDIVISION STATUS REPORTS
 Town of Fort Erie Community & Development Services Our Focus: Your Future Prepared for: Council-in-Committee Report No.: CDS-022-07 Agenda Date: March 5, 2007 File No.: 350204/350308 Subject: 2006 YEAR
ANALYSIS OF INTENSIFICATION OPPORTUNITIES IN THE CITY OF BRANTFORD. Final Report Prepared for:
 ANALYSIS OF INTENSIFICATION OPPORTUNITIES IN THE CITY OF BRANTFORD Final Report Prepared for: February 2012 TABLE OF CONTENTS I INTRODUCTION... 1 A. Purpose of this Report... 1 B. Types of Intensification
Community & Infrastructure Services Committee
 REPORT TO: DATE OF MEETING: September 12, 2016 Community & Infrastructure Services Committee SUBMITTED BY: Alain Pinard, Director of Planning, 519-741-2200 ext. 7319 PREPARED BY: Natalie Goss, Senior Planner,
Corporate Services Planning and Economic Development. Memorandum
 Corporate Services Planning and Economic Development Memorandum TO: FROM: Committee of the Whole Paul Freeman, Chief Planner DATE: June 21, 2018 RE: York Region C omments on Draft Provinci al Guidance
Residential Land Strategy for Ottawa
 DOCUMENT 8b Residential Land Strategy for Ottawa 2006-2031 February 2009 Publication # 9-23 ottawa.ca 2008081067.indd Page intentionally left blank Residential Land Strategy for Ottawa 2006-2031 City of
Housing & Residential Intensification Study Discussion Paper Township of King
 Housing & Residential Intensification Study Discussion Paper Prepared by Planning Department January 2011 1.0 Background 1.1 Provincial Policies (Greenbelt and Growth Plan) Since 2001, the Province of
ATTACHMENT NO Growth and Staging of Development Report
 ATTACHMENT NO. 1 2016 Growth and Staging of Development Report This page intentionally left blank. Table of Contents Introduction... 2 Section 1: Provincial Policy Statement (2014) and Provincial Growth
Residential Land Strategy for Ottawa
 Residential Land Strategy for Ottawa 2006-2031 City of Ottawa Department of Infrastructure Services and Community Sustainability Planning Branch Research and Forecasting Section Feb 2009 Publication #
Terms of Reference for Town of Caledon Housing Study
 1.0 Introduction Terms of Reference for Town of Caledon Housing Study The Town of Caledon is soliciting proposals for a comprehensive Housing Study. Results of this Housing Study will serve as a guiding
2016 Census Bulletin Changing Composition of the Housing Stock
 Metro Vancouver s Role Every five years, the Census of Canada provides benchmark data that is instrumental in analyzing and evaluating local government planning policies and services. Representing member
Document under Separate Cover Refer to LPS State of Housing
 Document under Separate Cover Refer to LPS5-17 216 State of Housing Contents Housing in Halton 1 Overview The Housing Continuum Halton s Housing Model 3 216 Income & Housing Costs 216 Indicator of Housing
Fiscal Impact Analysis Evergreen Community
 Evergreen Community July 16, 2015 Evergreen Community Prepared for: Evergreen Community (Burlington) Ltd. Prepared by: 33 Yonge Street Toronto Ontario M5E 1G4 Phone: (416) 641-9500 Fax: (416) 641-9501
VACANT URBAN RESIDENTIAL LAND SURVEY 2010 UPDATE
 1. INTRODUCTION VACANT URBAN RESIDENTIAL LAND SURVEY 2010 UPDATE The Vacant Urban Residential Land Survey (VURLS) has, since 1982, monitored the supply of vacant land in Ottawa s urban area to assess whether
Table of Contents CITY OF BRANTFORD
 RESIDENTIAL MONITORING REPORT 2011 Table of Contents Title Page # Title Page # List of Tables I 7.0 Other Housing Demands and Trends 21 List of Figures II 7.1 Affordable Housing 22-23 List of Appendices
AMENDMENT NUMBER 38 TO THE OFFICIAL PLAN OF THE TOWNSHIP OF WEST LINCOLN (COMPLIANCE)
") AMENDMENT NUMBER 38 TO THE OFFICIAL PLAN OF THE TOWNSHIP OF WEST LINCOLN (COMPLIANCE) 2013 AMENDMENT NUMBER 38 TO THE OFFICIAL PLAN OF THE TOWNSHIP OF WEST LINCOLN PART 1 - THE PREAMBLE 1.1 TITLE This
AMENDMENT NUMBER 38 TO THE OFFICIAL PLAN OF THE TOWNSHIP OF WEST LINCOLN (COMPLIANCE) 2013 AMENDMENT NUMBER 38 TO THE OFFICIAL PLAN OF THE TOWNSHIP OF WEST LINCOLN PART 1 - THE PREAMBLE 1.1 TITLE This
POPULATION FORECASTS
 POPULATION FORECASTS Between 2015 and 2045, the total population is projected to increase by 373,125 residents to reach 2.2 million. Some areas will see major increases, while other areas will see very
THE CORPORATION OF THE TOWNSHIP OF WELLESLEY EMPLOYMENT LANDS STRATEGY
 THE CORPORATION OF THE TOWNSHIP OF WELLESLEY EMPLOYMENT LANDS STRATEGY February 2017 TABLE OF CONTENTS Contents 1.0 INTRODUCTION... 4 2.0 PURPOSE OF REPORT... 5 3.0 PLANNING POLICIES... 5 3.1 Provincial
How Does the City Grow?
 This bulletin summarizes information from the City of Toronto s Land Use Information System II, providing an overview of the development projects received by the City Planning Division between January
HOUSING NEEDS ASSSESSMENT
 HOUSING NEEDS ASSSESSMENT June 2018 TABLE OF CONTENTS EXECUTIVE SUMMARY... 2 INTRODUCTION... 3 VALUE IN PARTNERSHIPS... 4 DETERMINING AFFORDABILITY... 5 CURRENT HOUSING CONTEXT... 7 HOUSING PROVIDERS...
Mississauga Growth Forecast
 Mississauga Growth Forecast Housing 2008-2031 July 2010 The City of Mississauga Growth Forecast provides population, housing and employment forecasts for the years 2008 to 2031. This forecast is based
2014 Plan of Conservation and Development
 The Town of Hebron Section 1 2014 Plan of Conservation and Development Community Profile Introduction (Final: 8/29/13) The Community Profile section of the Plan of Conservation and Development is intended
CITY OF HAMILTON PLANNING AND ECONOMIC DEVELOPMENT DEPARTMENT Economic Development Division
 CITY OF HAMILTON PLANNING AND ECONOMIC DEVELOPMENT DEPARTMENT Economic Development Division TO: Mayor and Members General Issues Committee COMMITTEE DATE: January 18, 2017 SUBJECT/REPORT NO: WARD(S) AFFECTED:
Mississauga Growth Forecast
 Mississauga Growth Forecast Housing 2008-2031 July 2010 The City of Mississauga growth forecast completed in 2008 provides population, housing and employment forecasts from the year 2008 to 2031. This
CHAPTER 2 VACANT AND REDEVELOPABLE LAND INVENTORY
 CHAPTER 2 VACANT AND REDEVELOPABLE LAND INVENTORY CHAPTER 2: VACANT AND REDEVELOPABLE LAND INVENTORY INTRODUCTION One of the initial tasks of the Regional Land Use Study was to evaluate whether there is
AUBURN BANKSTOWN BLACKTOWN HOLROYD PARRAMATTA THE HILLS. West Central District Demographic & Economic Characteristics
 AUBURN BANKSTOWN BLACKTOWN HOLROYD PARRAMATTA THE HILLS West Central District Demographic & Economic Characteristics Contents The West Central District 3 People 4 Population 4 Age Profile 6 Households
Chapter 12 Changes Since This is just a brief and cursory comparison. More analysis will be done at a later date.
 Chapter 12 Changes Since 1986 This approach to Fiscal Analysis was first done in 1986 for the City of Anoka. It was the first of its kind and was recognized by the National Science Foundation (NSF). Geographic
4.0. Residential. 4.1 Context
 4. 0Residential 4.1 Context In 1986, around the time of Burnaby s last Official Community Plan, the City had a population of 145,000 living in 58,300 residential units. By 1996, there were 179,000 people
MINTO COMMUNITIES INC. AVALON WEST STAGE 4 PLANNING RATIONALE. July Prepared for:
 MINTO COMMUNITIES INC. AVALON WEST STAGE 4 PLANNING RATIONALE July 2015 Prepared for: MINTO COMMUNITIES INC. 200 180 Kent Street Ottawa, Ontario K1P 0B6 Prepared by: J.L. RICHARDS & ASSOCIATES LIMITED
Annual (2013) Review of the Surrey Official Community Plan
 Review of the Surrey Official Community Plan") CORPORATE REPORT NO: R118 COUNCIL DATE: JUNE 23, 2014 REGULAR COUNCIL TO: Mayor & Council DATE: June 23, 2014 FROM: General Manager, Planning and Development FILE: 6440-01 SUBJECT: Annual (2013) Review
CORPORATE REPORT NO: R118 COUNCIL DATE: JUNE 23, 2014 REGULAR COUNCIL TO: Mayor & Council DATE: June 23, 2014 FROM: General Manager, Planning and Development FILE: 6440-01 SUBJECT: Annual (2013) Review
VACANT URBAN RESIDENTIAL LAND SURVEY 2016 UPDATE. City of Ottawa Planning, Infrastructure and Economic Development
 VACANT URBAN RESIDENTIAL LAND SURVEY 2016 UPDATE City of Ottawa Planning, Infrastructure and Economic Development May 2017 This page has been intentionally left blank Vacant Urban Residential Land Survey
Performance of the Private Rental Market in Northern Ireland
 Summary Research Report July - December Performance of the Private Rental Market in Northern Ireland Research Report July - December 1 Northern Ireland Rental Index: Issue No. 8 Disclaimer This report
TASK 2 INITIAL REVIEW AND ANALYSIS U.S. 301/GALL BOULEVARD CORRIDOR FORM-BASED CODE
 TASK 2 INITIAL REVIEW AND ANALYSIS U.S. 301/GALL BOULEVARD CORRIDOR FORM-BASED CODE INTRODUCTION Using the framework established by the U.S. 301/Gall Boulevard Corridor Regulating Plan (Regulating Plan),
Ontario Rental Market Study:
 Ontario Rental Market Study: Renovation Investment and the Role of Vacancy Decontrol October 2017 Prepared for the Federation of Rental-housing Providers of Ontario by URBANATION Inc. Page 1 of 11 TABLE
Addressing the Impact of Housing for Virginia s Economy
 Addressing the Impact of Housing for Virginia s Economy A REPORT FOR VIRGINIA S HOUSING POLICY ADVISORY COUNCIL NOVEMBER 2017 Appendix Report 2: Housing the Commonwealth's Future Workforce 2014-2024 Jeannette
RESOLUTION NO ( R)
") RESOLUTION NO. 2013-06- 088 ( R) A RESOLUTION OF THE CITY COUNCIL OF THE CITY OF McKINNEY, TEXAS, APPROVING THE LAND USE ASSUMPTIONS FOR THE 2012-2013 ROADWAY IMPACT FEE UPDATE WHEREAS, per Texas Local
RESOLUTION NO. 2013-06- 088 ( R) A RESOLUTION OF THE CITY COUNCIL OF THE CITY OF McKINNEY, TEXAS, APPROVING THE LAND USE ASSUMPTIONS FOR THE 2012-2013 ROADWAY IMPACT FEE UPDATE WHEREAS, per Texas Local
The Future of Housing in the GTHA The Impact of Land Use Policy
 BILD Thought Leadership Series The Future of Housing in the GTHA The Impact of Land Use Policy Commentary Building Industry and Land Development Association Malone Given Parsons Ltd. November 20, 2018
Planning Justification Report
 Planning Justification Report, Township of Puslinch FARHI HOLDINGS CORPORATION Updated January 27, 2017 Zelinka Priamo Ltd. Page i TABLE OF CONTENTS Page No. 1.0 1.1 1.2 1.3 2.0 2.1 2.2 2.3 2.4 2.5 3.0
JASPER PLACE NEIGHBOURHOOD HOUSING ASSESSMENT NOVEMBER West Jasper Place. Glenwood. Britannia Youngstown. Canora
 JASPER PLACE NEIGHBOURHOOD HOUSING ASSESSMENT NOVEMBER 2013 West Jasper Place Glenwood Britannia Youngstown Canora TABLE OF CONTENTS A: INTRODUCTION................................... 01 B: PHOTOGRAPHIC
Residential Intensification Analysis Report
 Guelph Growth Management Strategy: Residential Intensification Analysis Report The Fall, 2007 Table of Contents Executive Summary,...03 1.0 Introduction...04 1.1 Background. 04 1.2 Preliminary Capacity
Trends in Housing Occupancy
 This bulletin is one in a series of background bulletins to the Official Plan Review. It provides an analysis of changes in household composition and housing occupancy between 1996 and 2006. A copy of
THE CORPORATION OF THE TOWNSHIP OF KING THE CERTIFICATE PAGE FOR AMENDMENT NO. 89 TO THE OFFICIAL PLAN OF THE TOWNSHIP OF KING
 THE CORPORATION OF THE TOWNSHIP OF KING THE CERTIFICATE PAGE FOR AMENDMENT NO. 89 TO THE OFFICIAL PLAN OF THE TOWNSHIP OF KING (KING CITY COMMUNITY PLAN) The attached text and schedules constituting Amendment
ental Market report Vacancy Rate Up Slightly Vacancy Rate Edges Higher in 2004 Charlottetown CA CHARLOTTETOWN Canada Mortgage and Housing Corporation
 4.8% r ental Market report Vacancy Rate Up Slightly CHARLOTTETOWN Canada Mortgage and Housing Corporation Volume 6 Edition 1 October 2004 www.cmhc.ca Vacancy Rate Edges Higher in 2004 The vacancy rate
7. DISTRICT OF MUSKOKA HOUSING SUPPLY AND DEMAND
 7. DISTRICT OF MUSKOKA HOUSING SUPPLY AND DEMAND 7-1 7. DISTRICT OF MUSKOKA HOUSING SUPPLY AND DEMAND 7.1 Permanent Housing 7.1.1 Potential Urban Housing Supply by Stage of Development Table 7-1 summarizes
8Land Use. The Land Use Plan consists of the following elements:
 8Land Use 1. Introduction The Land Use Plan consists of the following elements: 1. Introduction 2. Existing Conditions 3. Opportunities for Redevelopment 4. Land Use Projections 5. Future Land Use Policies
Residential Intensification in Established Neighbourhoods Study (RIENS)
") Residential Intensification in Established Neighbourhoods Study (RIENS) EXECUTIVE SUMMARY In December 2015, the City of Kitchener retained Meridian Planning Consultants to undertake the Residential Intensification
Residential Intensification in Established Neighbourhoods Study (RIENS) EXECUTIVE SUMMARY In December 2015, the City of Kitchener retained Meridian Planning Consultants to undertake the Residential Intensification
Housing Need in South Worcestershire. Malvern Hills District Council, Wychavon District Council and Worcester City Council. Final Report.
 Housing Need in South Worcestershire Malvern Hills District Council, Wychavon District Council and Worcester City Council Final Report Main Contact: Michael Bullock Email: michael.bullock@arc4.co.uk Telephone:
Housing Characteristics
 CHAPTER 7 HOUSING The housing component of the comprehensive plan is intended to provide an analysis of housing conditions and need. This component contains a discussion of McCall s 1990 housing inventory
The Seattle MD Apartment Market Report
 The Seattle MD Apartment Market Report Volume 16 Issue 2, December 2016 The Nation s Crane Capital Seattle continues to experience an apartment boom which requires constant construction of new units. At
Why There is a Shortage of New Ground-Related Housing in the GTA
 Why There is a Shortage of New Ground-Related Housing in the GTA Presentation by: Dr. Frank Clayton Senior Research Fellow Centre for Urban Research and Land Development (CUR) Faculty of Community Services,
PLANNING REPORT. 33 Arkell Road City of Guelph. Prepared on behalf of OHM Arkell Inc. August 4, Project No. 1327
 PLANNING REPORT 33 Arkell Road City of Guelph Prepared on behalf of OHM Arkell Inc. August 4, 2015 Project No. 1327 423 Woolwich Street, Suite 201, Guelph, Ontario, N1H 3X3 Phone (519) 836-7526 Fax (519)
4. Parks and Recreation Fee Facility Needs and Cost Estimates Fee Calculation Nexus Findings 24
 TABLE OF CONTENTS CHAPTER PAGE 1. Introduction and Summary of Calculated Fees 1 1.1 Background and Study Objectives 1 1.2 Organization of the Report 2 1.3 Calculated Development Impact Fees 2 2. Fee Methodology
Attachment 3. Guelph s Housing Statistical Profile
 Attachment 3 Guelph s Housing Statistical Profile Table of Contents 1. Population...1 1.1 Current Population (26)...1 1.2 Comparative Growth, Guelph and Ontario (21-26)...1 1.3 Total Household Growth (21
Chapter 1: Community & Planning Context
 Chapter 1: Community & Planning Context Yesterday, Today & Tomorrow Comprehensive Plan 2040 2 INTRODUCTION The City of Lauderdale is a small town with a long history. Nestled between Saint Paul and Minneapolis,
Visit our Publications and Open Data Catalogue to find our complete inventory of our freely available information products.
 Welcome to Mississauga Data This report and other related documents can be found at www.mississauga.ca/data. Mississauga Data is the official City of Mississauga website that contains urban planning related
AMENDMENT NO. 25 TO THE OFFICIAL PLAN OF THE TOWN OF BRADFORD WEST GWILLIMBURY. Growth and Population Review
 AMENDMENT NO. 25 TO THE OFFICIAL PLAN OF THE TOWN OF BRADFORD WEST GWILLIMBURY Growth and Population Review ADOPTED: March 21, 2017 APPROVED BY THE COUNTY OF SIMCOE:, 201_ IN EFFECT:, 201_ OFFICIAL PLAN
Chairman and Members of the Planning and Development Committee. Thomas S. Mokrzycki, Commissioner of Planning and Building
 Exhibit 1 Port Credit DATE: TO: FROM: SUBJECT: Chairman and Members of the Planning and Development Committee Thomas S. Mokrzycki, Commissioner of Planning and Building Proposed Heritage Conservation District
Ontario Municipal Board Commission des affaires municipales de l Ontario
 ISSUE DATE: April 01, 2014 Ontario Municipal Board Commission des affaires municipales de l Ontario PL101128 PL101233 PL101238 IN THE MATTER OF subsection 17(36) of the Planning Act, R.S.O. 1990 c. P.
PIP practice note 1 planning assumptions. How to use this practice note. Planning assumptions. What are planning assumptions? Type.
 PIP PRACTICE NOTE 1 How to use this practice note This practice note has been prepared to support in the preparation or amending of planning assumptions within a priority infrastructure plan (PIP). It
Township of Tay Official Plan
 Township of Tay Official Plan Draft for Consultation (v.3) March 2016 Contents 1. INTRODUCTION... 1 1.1 Content, Title and Scope... 1 1.2 Basis and Purpose of this Plan... 1 1.3 Plan Structure... 2 2.
Highland Green Estates Neighbourhood Area Structure Plan
 Highland Green Estates Neighbourhood Area Structure Plan Original Outline Plan approved by Council: March 10, 1997 Outline Plan amended by Council: March 24, 1997 Converted to a Neighbourhood Area Structure
For Vintages of Four Mile Creek Town of Niagara on the Lake, Ontario
 Planning Impact Analysis For Vintages of Four Mile Creek Town of Niagara on the Lake, Ontario Prepared by: Upper Canada Consultants 261 Martindale Road Unit #1 St. Catharines, Ontario L2W 1A1 Prepared
2011 Census Bulletin #4 Dwellings & Structure Type in Metro Vancouver
 2011 Census Bulletin #4 Dwellings & Structure Type in Metro Vancouver Regional Dwelling Count According to the 2011 Census figures recently released by Statistics Canada, there were 891,340 occupied private
METHODOLOGY GUIDE VALUING LANDS IN TRANSITION IN ONTARIO. Valuation Date: January 1, 2016
 METHODOLOGY GUIDE VALUING LANDS IN TRANSITION IN ONTARIO Valuation Date: January 1, 2016 August 2017 August 22, 2017 The Municipal Property Assessment Corporation (MPAC) is responsible for accurately assessing
PLANNING REPORT Gordon Street City of Guelph. Prepared on behalf of Ontario Inc. March 17, Project No. 1507
 PLANNING REPORT 1131 Gordon Street City of Guelph Prepared on behalf of 1876698 Ontario Inc. March 17, 2016 Project No. 1507 423 Woolwich Street, Suite 201, Guelph, Ontario, N1H 3X3 Phone (519) 836-7526
TOTTENHAM SECONDARY PLAN
 TOTTENHAM SECONDARY PLAN AMENDMENT NO. 11 TO THE OFFICIAL PLAN OF THE TOWN OF NEW TECUMSETH The following text and schedules to the Official Plan of the Town of New Tecumseth constitute Amendment No. 11
rd Quarter Market Report
 2012 3 rd Quarter Market Report The voice of real estate in Central Virginia CAAR Member Copy Expanded Edition Charlottesville Area 3 rd Quarter 2012 Highlights: Overall sales in Greater Charlottesville
RENTAL MARKET REPORT. Manitoba Highlights* Highlight Box. Housing market intelligence you can count on
 H o u s i n g M a r k e t I n f o r m a t i o n RENTAL MARKET REPORT Manitoba Highlights* C a n a d a M o r t g a g e a n d H o u s i n g C o r p o r a t i o n Date Released: Spring 2011 Figure 1 Winnipeg
TOWNSHIP OF ESSA GROWTH STRATEGY
 TOWNSHIP OF ESSA GROWTH STRATEGY AINLEY GROUP October 2013 Consulting Engineers and Planners File: 213003 550 Welham Road Barrie, ON L4N 8Z7 Telephone: 705-726-3371 Facsimile: 705-726-4391 E-mail: barrie@ainleygroup.com
Frequently Asked Questions
 Frequently Asked Questions Cambridge West Land Use Planning Matters January 10, 2018 Q1 What is proposed for the undeveloped lands within the Cambridge West area? A. Four separate landowners each own part
HOUSING AND PROPERTY MARKET IN LITHUANIA CONTENTS
 HOUSING AND PROPERTY MARKET IN LITHUANIA Kęstutis Sabaliauskas, Director General State Enterprise Centre of Registers, Lithuania Kestutis.Sabaliauskas@registrucentras.lt CONTENTS Legal environment Real
Edward R. Sajecki Commissioner of Planning and Building
 Corporate Report Clerk s Files Originator s Files CD.01.REG (Region of Peel Official Plan) DATE: June 5, 2007 TO: FROM: Chair and Members of Planning and Development Committee Meeting Date: June 25, 2007
Visit our Publications and Open Data Catalogue to find our complete inventory of our freely available information products.
 Welcome to Mississauga Data This report and other related documents can be found at www.mississauga.ca/data. Mississauga Data is the official City of Mississauga website that contains urban planning related
ATTACHMENT 1: Proposed Official Plan Amendment - Affordable Housing
 ATTACHMENT 1: Proposed Official Plan Amendment - Affordable Housing AMENDMENT NUMBER (?) TO THE OFFICIAL PLAN FOR THE CORPORATION OF THE CITY OF GUELPH: AFFORDABLE HOUSING AMENDMENT INDEX PART A - THE
Current and Projected Size and Scope of Ontario s Secondary Rental Housing Market
 Abstract This report was prepared to develop comprehensive information about the size of the secondary rental housing market in Ontario. The report estimates the number and type of rental units which comprise
Brooklin Study Secondary Plan and Transportation Master Plan Background Report: Potential Intensification Opportunities
 Brooklin Study Secondary Plan and Transportation Master Plan Background Report: Potential Intensification Opportunities January 2015 prepared by Sorensen Gravely Lowes Planning Associates inc. with for
Market Segmentation: The Omaha Condominium Market
 Market Segmentation: The Omaha Condominium Market Roger P. Sindt Steven Shultz University of Nebraska at Omaha Introduction A highly visible and growing niche in the homeownership market is the condominium
Existing Land Use. Typical densities for single-family detached residential development in Cumberland County: 1
 Existing Land Use A description of existing land use in Cumberland County is fundamental to understanding the character of the County and its development related issues. Economic factors, development trends,
Powell River. Courtenay. Port Alberni Parksville. Vancouver Nanaimo. Duncan. Avg. Rent
 Housing Market Information RENTAL MARKET REPORT Highlights 1 Canada Mortgage and Housing Corpor ation Date Released: 2016 The overall vacancy rate *... INCREASED to 1.3 % The average rent is *... $ 1,099
Planning Justification Report - Update Castlegrove Subdivision, Gananoque Draft Plan of Subdivision and Class III Development Permit
 Planning Justification Report - Update Castlegrove Subdivision, Gananoque Draft Plan of Subdivision and Class III Development Permit by IBI Group Table of Contents Executive Summary... 1 1 Introduction...
An Executive Summary. Residential Market Potential
 T1 Residential Market Potential for New Traditional Neighborhoods, Neighborhood Centers, Town Centers, Urban Centers, and The Urban Core T2 October 2004 Conducted by Zimmerman/Volk Associates Inc. Clinton,
Location-Efficient Choices for GTA Homebuyers A policy supplement to Priced Out
 Photo: Queen Street by Ian Freimuth, Flickr CC Location-Efficient Choices for GTA Homebuyers A policy supplement to Priced Out Housing prices have been rising in the Greater Toronto Area in large part
HOUSING AFFORDABILITY
 HOUSING AFFORDABILITY 2016 A study for the Perth metropolitan area Research and analysis conducted by: In association with industry experts: And supported by: Contents 1. Introduction...3 2. Executive
10 Affordable Housing Measuring and Monitoring Guidelines
 Clause 10 in Report No. 11 of Committee of the Whole was adopted, without amendment, by the Council of The Regional Municipality of York at its meeting held on June 25, 2015. 10 Affordable Housing Measuring
Nonresidential construction activity in the Twin Cities region was robust in 2013
 1 Recent Nonresidential Construction Activity in the Twin Cities Region March 2015 Key Findings After bottoming out in 2010, nonresidential construction activity in the Twin Cities region is once again
The Profile for Residential Building Approvals by Type and Geography
 The Profile for Residential Building Approvals by Type and Geography Key Points: ABS Building Approvals for Australia peaked back in October 2015. As we have frequently highlighted, approvals have subsequently
Mr. Trevor Hawkins Development Planner Development Services City of Waterloo 100 Regina Street South Waterloo, ON N2J 4A8. Dear Mr.
 KITCHENER WOODBRIDGE LONDON KINGSTON BARRIE Mr. Trevor Hawkins Development Planner Development Services City of Waterloo 100 Regina Street South Waterloo, ON N2J 4A8 Dear Mr. Hawkins: RE: Grey Silo Road/
INNOVATIVE PLANNING SOLUTIONS
 Reference Document 2 Committee of the Whole Item CCW 16-190 1 of 13 INNOVATIVE PLANNING SOLUTIONS Township of Springwater Planning Department 2231 Nursery Road Minesing, ON L0L 1Y2 Tuesday February 24
Planning Justification Report
 Planning Justification Report 101 Kozlov Street, Barrie, Ont. Destaron Property Management Ltd. November 2015 Revised February 2017 TABLE OF CONTENTS Page 1.0 INTRODUCTION... 1 2.0 DESCRIPTION OF SUBJECT
Task 13A: Review & Assessment of Affordable and Shared Housing, and Secondary Suites. Comprehensive Zoning By-law Project
 City of Markham Task 13A: Review & Assessment of Affordable and Shared Housing, and Secondary Suites Comprehensive Zoning By-law Project Markham Zoning By-law Consultant Team Gladki Planning Associates,
CHICO/CARD AREA PARK FEE NEXUS STUDY
 REVISED FINAL REPORT CHICO/CARD AREA PARK FEE NEXUS STUDY Prepared for: City of Chico and Chico Area Recreation District (CARD) Prepared by: Economic & Planning Systems, Inc. December 2, 2003 EPS #12607
City of Burlington Official Plan Review Commercial Strategy Study. Phase 1: Commercial Market Supply and Demand Analysis
 City of Burlington Official Plan Review Commercial Strategy Study Phase 1: Commercial Market Supply and Demand Analysis February 21, 2013 (Revised June 10, 2013) February 21, 2013 Ms. Andrea Smith, MCIP,
1267 King Street West Zoning Amendment Final Report
 . STAFF REPORT ACTION REQUIRED 1267 King Street West Zoning Amendment Final Report Date: January 28, 2015 To: From: Wards: Reference Number: Toronto and East York Community Council Director, Community
City of Lacombe Housing Analysis Summary of Data and Feedback
 City of Lacombe Housing Analysis Summary of Data and Feedback October, 2013 Submitted by: Another Way and creo Percent 1999 2001 2003 2005 2007 2009 2011 % Permits Issued Executive Summary This first stage
City of Kingston Report to Council Report Number
 To: From: Resource Staff: City of Kingston Report to Council Report Number 18-043 Mayor and Members of Council Lanie Hurdle, Commissioner, Community Services Paige Agnew, Director, Planning, Building &
Comprehensive Plan /24/01
 IV The is a central component of the Comprehensive Plan. It is an extension of the general goals and policies of the community, as well as a reflection of previous development decisions and the physical