South East Queensland Growth Management Program
|
|
|
- Edgar Boyd
- 5 years ago
- Views:
Transcription


1 South East Queensland Growth Management Program
2 Acknowledgements Office of Economic and Statistical Research, Demography and Planning Australian Bureau of Statistics Urban Land Development Authority Brisbane City, Gold Coast City, Ipswich City, Lockyer Valley Regional, Logan City, Moreton Bay Regional, Redland City, Scenic Rim Regional, Somerset Regional, Sunshine Coast Regional and Toowoomba Regional Councils. Looking forward. Delivering now. The Department of Local Government and Planning leads a coordinated Queensland Government approach to planning, infrastructure and development across the state. State of Queensland. Published by the Department of Local Government and Planning, April 2011, 100 George Street, Brisbane Qld The Queensland Government supports and encourages the dissemination and exchange of information. However, copyright protects this publication. The State of Queensland has no objection to this material being reproduced, made available online or electronically but only if it is recognised as the owner of the copyright and this material remains unaltered. The Australian Bureau of Statistics gives no warranty that the data are free from error, are complete, have particular quality, and are suitable for any purpose and otherwise. Copyright inquiries about this publication should be directed to the department s Legal Services division via copyright@dip.qld.gov.au or in writing to PO Box 15009, City East, Queensland The Queensland Government is committed to providing accessible services to Queenslanders of all cultural and linguistic backgrounds. If you have difficulty understanding this publication and need a translator, please call the Translating and Interpreting Service (TIS National) on and ask them to telephone the Queensland Department of Local Government and Planning on Disclaimer: While every care has been taken in preparing this publication, the State of Queensland accepts no responsibility for decisions or actions taken as a result of any data, information, statement or advice, expressed or implied, contained within. To the best of our knowledge, the content was correct at the time of publishing. Any references to legislation are not an interpretation of the law. They are to be used as a guide only. The information in this publication is general and does not take into account individual circumstances or situations. Where appropriate, independent legal advice should be sought. RPS_0021_.002_Pu 1
3 Foreword Already the third most populous urban region in Australia, South East Queensland (SEQ) continues to face significant population growth and infrastructure development pressures. Between 2006 and 2031, it is anticipated that around additional dwellings and diversity in housing options will be needed within SEQ to accommodate the projected resident population. The way we manage the expected population and employment growth, as a region and within each local government area, is of critical importance. The region s growth is currently managed through the South East Queensland Regional Plan (SEQ Regional Plan). As part of implementing the SEQ Regional Plan, the SEQ Growth Management Program was established to inform and help prioritise state and local government planning actions and infrastructure investment. It is aimed at ensuring an adequate land and dwelling supply. Producing the SEQ Growth Management Program annual reports is an action from the state government s response to the Growth Management Summit, which was held over two days in March 2010 and engaged experts and wider community stakeholders on growth management issues. This inaugural report integrates the findings of a number of existing state government land supply and development monitoring programs and compares recent levels of development activity to the dwelling targets of the SEQ Regional Plan. It also makes extensive use of local government land supply analyses and development projections. The report identifies actions for consideration to address current dwelling supply shortfalls compared to the targets, or to verify existing estimates of supply. It recognises and reinforces the existing and ongoing work of SEQ local governments in this space. By seeking to maintain an adequate number of years supply of land and dwellings at any point in time, the SEQ Growth Management Program aims to minimise pressures on land and housing affordability that might otherwise result from an inadequate supply relative to demand. In coming years, we will work to improve available data and integrate other sources of information into future annual reports. This will support more complete reporting in relation to the industrial land supply and improve the consistency of dwelling activity and supply estimates. The state government looks forward to continued cooperation and stakeholder involvement as we work to improve the SEQ Growth Management Program as part of ensuring we have sustainable development in SEQ. The Honourable Paul Lucas MP Deputy Premier and Attorney-General, Minister for Local Government and Special Minister of State 2
4 Executive summary The purpose of the South East Queensland (SEQ) Growth Management Program is to monitor and report annually on residential and industrial land supply and development in relation to the South East Queensland Regional Plan (SEQ Regional Plan). This includes tracking dwelling activity against the SEQ Regional Plan infill and total dwelling targets and identifying actions for consideration by state and local governments to manage growth in SEQ. The SEQ Regional Plan provides the policy framework that addresses regional growth management issues, including high population growth, housing affordability, transport congestion, climate change and employment opportunities. Among other things, the SEQ Regional Plan establishes infill and total dwelling targets for each local government area. Those targets are a measure of the dwelling supply required to accommodate the projected dwelling demand in SEQ between 2006 and 2031, a total of additional dwellings across SEQ, and were determined in accordance with the preferred settlement pattern of the SEQ Regional Plan. The SEQ Growth Management Program will be implemented through a range of mechanisms to ensure land supply outcomes of the SEQ Regional Plan are achieved. These mechanisms include those available under the Sustainable Planning Act 2009, such as planning scheme amendments and reviews, master planned area declarations and the Integrated Development Assessment System. The SEQ Growth Management Program aims to minimise pressure on land and housing affordability by maintaining an adequate supply of land and dwellings. Dwelling and industrial land supply are reported in three main categories: approved supply - can be developed in accordance with a development permit. It is the supply most readily available for development in the short term planned supply - a development permit is able to be applied for and is likely to be approved, i.e. where that development is consistent with the adopted planning scheme or equivalent. This supply is available for development, subject to the land being made available by the landowner, market demand and economic feasibility emerging supply - is in various stages of allocation or planning for future development but is not yet consistent with an adopted planning scheme or equivalent. In each of these supply categories, the SEQ Growth Management Program estimates how many years supply of dwellings are available. The aim is to have a minimum of 10 years planned supply and 15 years of combined planned and emerging supply at any time. This should minimise price pressures that may result from an inadequate supply relative to dwelling demand. The SEQ Growth Management Program draws data from: residential and industrial development and land supply databases compiled by the Office of Economic and Statistical Research (OESR) infrastructure demand projections and dwelling yield estimates of SEQ local governments, and Urban Land Development Authority (ULDA) dwelling yield estimates. 3
5 To improve the SEQ Growth Management Program supply estimates over time, it is proposed that a more consistent basis for assumptions about expected dwelling density, land availability and development probability be developed. This will inform the creation of land supply and infrastructure demand projections databases in Queensland. Future work will also aim to improve the capacity of the SEQ Growth Management Program to differentiate between the planned and emerging supply categories and estimate additional dwellings for the purpose of comparison to the dwelling targets. Improved information on the effects of development constraints, e.g. environmental values and flooding, will be reflected in future land and dwelling supply estimates as it becomes available. Dwelling activity To give an indication of how SEQ and individual local government areas are tracking in terms of being able to accommodate the projected dwelling demand to 2031, the dwelling targets are represented as the average number of additional dwellings required quarterly to match the respective infill and total targets. The cumulative total of the dwelling activity for a period, e.g. new dwelling approvals from 1 July 2006 to 30 June 2010, is reported against the corresponding cumulative total of the average quarterly target, referred to as the pro rata target. Dwelling activity may vary over time without affecting an area s capacity to accommodate the projected dwelling demand by Such activity needs to be considered in the context of the dwelling supply for the area. Across SEQ as a whole, new dwelling approvals were tracking in line with the pro rata total additional dwelling target until the global financial crisis in From then until June 2010, approvals declined to be 86 per cent of the pro rata target. The nature of land supply in some local government areas including Moreton Bay and Somerset meant they could better maintain, recover or even increase activity levels much earlier than other parts of SEQ. In comparison, dwelling activity in Ipswich, Logan and Scenic Rim will only approach their respective pro rata targets as the full potential of their residential and industrial land supplies is taken up. Up to June 2010, new infill dwelling approvals were tracking ahead of the pro rata infill dwelling targets across SEQ as a whole and in six of the nine local government areas that have infill dwelling targets. A major factor in this is the high proportion of dwelling houses occurring in the Existing Urban Area, most of which would have been located on recently subdivided broadhectare land. As remaining broadhectare land in the Existing Urban Area is taken up in the short to medium-term, the significance of dwelling house activity in the Existing Urban Area will decline. It is expected that infill multiple dwelling activity will increase as policy reform and increased market acceptance takes hold. Dwelling supply As at June 2010, approved supplies of multiple dwellings and residential lots appeared to provide an adequate supply of dwellings in the short term, across SEQ as a whole and in most local government areas. For the whole of SEQ, there is significantly more than 10 years planned supply and 15 years combined planned and emerging supply for both infill and total dwellings. This means the SEQ region is currently meeting the benchmarks for an adequate number of years supply. However, this is not currently the case in every individual local government area. There are significant planning scheme or equivalent changes underway in a number of local government areas to address this. Furthermore, there is the potential (if needed) to bring forward dwellings currently estimated to occur after
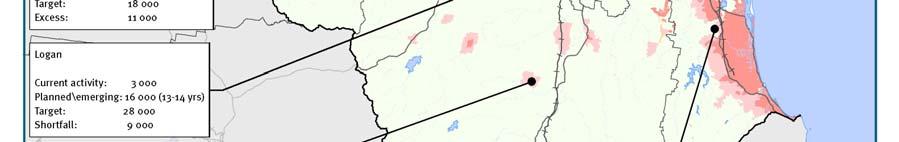
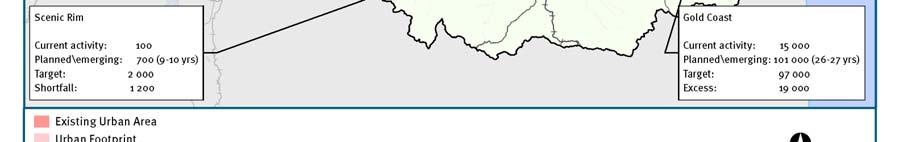
6 The SEQ Regional Plan has a longer timeframe (that is, 20 or more years) than the minimum supply benchmarks of 10 and 15 years. It is anticipated that planning changes in a number of local governments and possible bring forwards will also address reported shortfalls in the supply of dwellings when compared to the SEQ Regional Plan targets to The circumstances of the planned and emerging dwelling supply in the 11 local government areas include: Brisbane - Major planning scheme changes are underway in Brisbane to address the shortfalls in combined planned and emerging dwelling supply compared to both the infill and total targets. These changes need to be supported, monitored and coordinated in line with the council s new strategic framework and associated studies (once finalised). Gold Coast - Gold Coast appears to have an adequate combined planned and emerging dwelling supply to accommodate the infill and total dwelling targets. Actual development activity, the level of tourist dwelling demand and the adoption of a number of local area plans need to be assessed over time to verify, and if necessary review, the dwelling yield assumptions that support this assessment. Ipswich - Ipswich appears to have an adequate combined planned and emerging dwelling supply to accommodate its infill and total dwelling targets. Actual development activity and achieved dwelling yields need to be monitored over time to verify, and if necessary review, the dwelling yield assumptions that support this assessment. Lockyer Valley - The Department of Local Government and Planning and Lockyer Valley Regional Council need to work collaboratively over time to resolve what further planning scheme changes may be required to accommodate the total dwelling target. Based on the 2009 broadhectare study there appears to be a proportionally small shortfall compared to the target, but council s own Residential Needs Report suggests there is adequate planned supply. Logan - The planned and emerging total dwelling supply appear adequate in Logan, subject to the near future implementation of Urban Land Development Authority development schemes for the satellite communities of Greater Flagstone and Yarrabilba and council s planning scheme changes for Park Ridge. Further land use and infrastructure planning changes would appear necessary to enable Logan to accommodate its infill dwelling target. Moreton Bay - There is currently more than 10 years planned supply and 15 years combined planned and emerging supply for both infill and total dwellings in Moreton Bay. The council is progressing a number of planning scheme changes that may increase dwelling yields to address the shortfalls compared to the dwelling targets to Other changes that could be considered include further urban density redevelopment of existing large lot rural residential areas in the Urban Footprint. Redland - The combined planned and emerging dwelling supply is estimated to exceed the total dwelling target, but the impacts of the State Planning Policy 2/10: Koala Conservation in South East Queensland and South East Queensland Koala Conservation State Planning Regulatory Provisions on yields need to be monitored. Further land use and infrastructure planning changes would appear necessary over time to address the current shortfall compared to the infill dwelling target. 5
7 Scenic Rim - The current dwelling targets for Scenic Rim appear linked to future economic development opportunities for the area, such as those associated with the Bromelton industrial area. This gives the council time to implement planning changes, including the envisaged Beaudesert Growth Management Strategy and associated planning scheme amendments, to provide an adequate supply to accommodate the infill and total dwelling targets. Somerset - The council expects to increase the planned and emerging supply through local area or structure plans for the substantial Urban Footprints associated with the towns in the area. This would address the current shortfall of supply compared to the total dwelling target. Sunshine Coast - In preparing its new planning scheme, Sunshine Coast Regional Council is undertaking a detailed assessment of dwelling supply and will demonstrate how the dwelling targets will be addressed. This should deal with the current apparent shortfall compared to the infill and total targets. Toowoomba (SEQ) - The council has identified additional broadhectare opportunities as part of preparing its new planning scheme, but advises land ownership and infrastructure planning and coordination issues may make it impractical to accommodate the total dwelling target by Further planning actions may be required to provide the capacity to accommodate the total dwelling target. Toowoomba appears to have the capacity to accommodate its relatively low infill target. Industrial development and land supply Across SEQ, new building approvals on industrial land comprised an average of around 126 hectares per year over the four years to December Brisbane represented about 56 per cent of that consumption, with the next highest consumption being on the Gold Coast (13 per cent). Across SEQ there was around 8500 hectares of planned and 6100 hectares of emerging industrial land supply as at December Ipswich comprises about one-third of the total. Brisbane, Moreton Bay, Scenic Rim and Toowoomba each have approximately 10 per cent of the combined planned and emerging SEQ supply. Further analysis using the findings of detailed sub-regional studies will inform future planning actions that may be required to ensure the supply of industrial land is adequate over time. 6
8 Contents Foreword... 2 Executive summary Introduction Background SEQ Regional Plan Growth Management Summit Reporting area Role of the SEQ Growth Management Program Concerns relating to land supply Context of land supply and development monitoring in Queensland Understanding the SEQ Regional Plan dwelling targets Background to the current dwelling targets Issues affecting the dwelling targets and dwelling demand Report structure and future reporting Explanation of data elements Dwelling activity versus SEQ Regional Plan targets Categories of supply Limitations of data Minimum land supply benchmarks Development and market context Integrated analysis Dwelling approvals Residential subdivision Lot approvals Lot production Lots lapsed Vacant land sales New industrial building approvals South East Queensland region Integrated analysis Total dwelling activity Infill dwelling activity Approved dwelling supply Planned and emerging dwelling supply Industrial development and land supply Development prioritisation Map SEQ Total dwelling supply Map SEQ Infill dwelling supply Dwelling activity versus SEQ Regional Plan dwelling targets Total dwelling activity versus targets Infill dwelling activity versus targets Residential supply Approved dwelling supply Planned and emerging dwelling supply Industrial development and land supply Development Areas
9 Local government areas Brisbane Integrated analysis Dwelling activity versus SEQ Regional Plan dwelling targets Residential supply Industrial development and land supply Development Areas Gold Coast Integrated analysis Dwelling activity versus SEQ Regional Plan dwelling targets Residential supply Industrial development and land supply Development Areas Ipswich Integrated analysis Dwelling activity versus SEQ Regional Plan dwelling targets Residential supply Industrial development and land supply Development Areas Lockyer Valley Integrated analysis Dwelling activity versus SEQ Regional Plan dwelling targets Residential supply Industrial development and land supply Development Areas Logan Integrated analysis Dwelling activity versus SEQ Regional Plan dwelling targets Residential supply Industrial development and land supply Development Areas Moreton Bay Integrated analysis Dwelling activity versus SEQ Regional Plan dwelling targets Residential supply Industrial development and land supply Development Areas Redland Integrated analysis Dwelling activity versus SEQ Regional Plan dwelling targets Residential supply Industrial development and land supply Development Areas Scenic Rim Integrated analysis Dwelling activity versus SEQ Regional Plan dwelling targets Residential supply Industrial development and land supply Development Areas Somerset Integrated analysis Dwelling activity versus SEQ Regional Plan dwelling targets
10 13.3 Residential supply Industrial development and land supply Development Areas Sunshine Coast Integrated analysis Dwelling activity versus SEQ Regional Plan dwelling targets Residential supply Industrial development and land supply Development Areas Toowoomba (SEQ) Integrated analysis Dwelling activity versus SEQ Regional Plan dwelling targets Residential supply Industrial development and land supply Development Areas Findings and related actions for consideration by state and local governments SEQ region Brisbane Gold Coast Ipswich Lockyer Valley Logan Moreton Bay Redland Scenic Rim Somerset Sunshine Coast Toowoomba (SEQ) Appendices A1 Compilation of residential supply data A1.1 Approved dwelling supply A1.2 Planned dwelling supply A1.3 Emerging dwelling supply A1.4 Dwelling supply beyond A1.5 Current activity A2 Compilation of industrial land supply data A3 Limitations of data A3.1 Dwelling approvals A3.2 Differentiating categories of supply A3.3 Dwelling supply A3.4 Industrial land supply A3.5 Constraints information Definitions/abbreviations Sources
11 1.0 Introduction 1.1 Background SEQ Regional Plan The South East Queensland (SEQ) Growth Management Program has been established within Growth Management Queensland to assist in implementing a number of policies related to growth management outlined within the South East Queensland Regional Plan (SEQ Regional Plan). The establishment and scope of the SEQ Growth Management Program are set under the following sections of the SEQ Regional Plan: Part D Regional policies, desired regional outcome 8.1 (Compact development), Program Part D Regional policies, desired regional outcome 8.10 (Development Area delivery), Program Part D Regional policies, desired regional outcome 9.3 (Enterprise opportunities), Programs and Part D Regional policies, desired regional outcome 10.2 (Infrastructure planning, coordination and funding), Program Part E Implementation and monitoring. In doing this the SEQ Growth Management Program draws upon extensive residential and industrial land monitoring activities undertaken by the Office of Economic and Statistical Research (OESR), as well as significant supplementary information from SEQ local governments and the Urban Land Development Authority (ULDA) Growth Management Summit The Queensland Growth Management Summit was held in Brisbane on 30 and 31 March 2010 to bring stakeholders and community members together to discuss how best to manage growth. As a result of the ideas generated at the Summit, the state government committed to 22 new key initiatives and 25 supporting actions. These are outlined in Shaping Tomorrow s Queensland: A response to the Queensland Growth Management Summit. Production of this first annual report of the SEQ Growth Management Program flows from supporting action F, which is to: prepare annual growth management program reports to monitor land supply, track development against dwelling targets and recommend actions to manage growth in South East Queensland. 10
")
.")


.")
12 1.2 Reporting area This report relates to the South East Queensland (SEQ) region as defined for the purposes of the SEQ Regional Plan (see Figure 1). The SEQ region includes the local government areas of Brisbane, Gold Coast, Ipswich, Lockyer Valley, Logan, Moreton Bay, Redland, Scenic Rim, Somerset and Sunshine Coast. It also includes that part of the Toowoomba Regional Council area located in the Toowoomba Statistical District (plus one Census Collection District on its western edge at Charlton Wellcamp). Figure 1 SEQ Growth Management Program area of interest 11
13 The report provides an overall regional view in terms of monitoring land supply and tracking development against the dwelling targets. It then analyses the same issues for each local government area. It is intended that the SEQ Growth Management Program framework and reporting be developed for potential application in other parts of the state, to assist in the implementation of other regional plans. 1.3 Role of the SEQ Growth Management Program The SEQ Regional Plan established the SEQ Growth Management Program to monitor and inform how SEQ can accommodate the projected dwellings and employment growth, balanced with enhancing land and housing affordability. The broad purpose of the SEQ Growth Management Program is to monitor and report annually on land supply and development in relation to the SEQ Regional Plan. This information will consequently inform the prioritisation of delivery of dwellings and land supply, to meet the SEQ Regional Plan dwelling targets and assist in providing a reasonable balance between supply and demand. Figure 2 identifies the relationship between the SEQ Growth Management Program and the SEQ Regional Plan, local government planning schemes and infrastructure prioritisation and planning. In the future, these will be informed by and inform the emerging Queensland Regionalisation Strategy and Queensland Infrastructure Plan. Regional Strategy and Targets SEQ Regional Plan Policy Direction Sub-Regional Policy and Associated Targets Local Government Planning Schemes Monitoring and Review SEQ Growth Management Program Infrastructure Prioritisation and Planning Inform Policy Review Figure 2 Land use and infrastructure planning context of SEQ Regional Plan and SEQ Growth Management Program To achieve its purpose, the SEQ Growth Management Program will identify actions for consideration that may use a range of mechanisms. These mechanisms include those available under the Sustainable Planning Act 2009, such as planning scheme amendments and reviews, master planned area declarations and the Integrated Development Assessment System. 1.4 Concerns relating to land supply There has been debate over the issue of land availability in SEQ. This debate centres on the amount of land identified and available, the ability to meet dwelling targets and the way in which land is accessed in an affordable and timely manner. The Queensland Government has responded to these ongoing concerns with strategies and policies including: bringing forward the review of the South East Queensland Regional Plan (SEQ Regional Plan ), resulting in the SEQ Regional Plan as adopted in July 2009 the review of legislation, including the introduction of the Sustainable Planning Act in December
14 implementation of the Queensland Housing Affordability Strategy, including the creation and expanded use of the ULDA. These strategies and policies have, among other things, initiated expansion of and improvements to monitoring of land supply and development activity. These all assist to monitor the achievement of policies, principles and strategies to accommodate the SEQ region s continued growth. The Government s response to the Growth Management Summit addresses concerns over land supply through the following key initiatives: Key initiative 9 - Task the ULDA with responsibility for facilitating delivery of major new satellite communities in priority greenfield areas, initially at Ripley Valley, Yarrabilba and Flagstone (extended in October 2010 to include Caloundra South). Key initiative 17 - Work in partnership with local government to confirm the distribution of dwelling targets within SEQ through the development of a Queensland Infrastructure Plan. Related supporting actions of the Government s response to the Growth Management Summit that are currently underway, other than that to prepare the SEQ Growth Management Program annual reports (supporting action F), include: Supporting action C - Develop and include employment projections in all regional plans to support more jobs closer to where people live as part of the preparation of regional plans across Queensland. Supporting action J - Work more closely with local government in the sequencing of infrastructure projects to take account of significant local infrastructure investment. 1.5 Context of land supply and development monitoring in Queensland The SEQ Growth Management Program builds on the previous Urban Development Monitoring Program and reports prepared by the former Office of Urban Management. Those reports tracked development activity against the dwelling targets pursuant to the SEQ Regional Plan The SEQ Growth Management Program utilises information from a number of land supply and development monitoring programs established, improved and expanded by the OESR, and the former Planning Information and Forecasting Unit of the Department of Local Government and Planning, over the last 20 years. Those programs include: residential land and dwelling activity monitoring broadhectare studies residential infill development monitoring industrial land monitoring. The Industrial Land Monitoring Program was established in The OESR undertakes the Industrial Land Monitoring Program pursuant to a Memorandum of Understanding with the Industrial Land Analysis and Planning branch of the Coordinator General. Significant supplementary land supply information presented in this report is drawn primarily from local governments and the ULDA, in some cases including strategic land use and infrastructure planning databases, such as those used to provide projections for Priority Infrastructure Plans. 13
15 There are similar programs for land supply and development monitoring and growth management in other states, such as the Metropolitan Development Program for the Sydney Region, the Urban Development Program for Melbourne and Geelong, the Housing and Employment Land Supply Program for Greater Adelaide and Western Australia s Urban Development Program. 1.6 Understanding the SEQ Regional Plan dwelling targets Background to the current dwelling targets SEQ is the third most populous urban region in Australia and has experienced rapid and sustained high levels of growth over the past 30 years. The SEQ Regional Plan identifies a projected increase in resident population from approximately 2.8 million people in 2006 to around 4.4 million people by Over the period from 1 October 2004 to 30 September 2007, the Urban Development Monitoring Program found that the SEQ region dwelling activity tracked well against the total and infill additional dwelling targets as set out under the SEQ Regional Plan As a result of revised, higher population projections prepared in 2008 and changes to the SEQ region's boundary, new dwelling targets were formulated in the SEQ Regional Plan. The total additional dwelling demand across SEQ was determined by the OESR based on the Queensland Government s medium series population projections (2008 edition). From 2006 to 2031, around additional dwellings were projected for SEQ to cater for population growth and provide housing choices for a more diverse population. This is the overall dwelling target for the SEQ Regional Plan. Of the total dwelling target, approximately 50 per cent ( ) has been allocated to the Existing Urban Area to promote the efficient and cost effective use of existing infrastructure. The remainder of the dwellings required are to be accommodated outside the Existing Urban Area or inside if additional capacity is available. Major components of the region's infill dwelling target have been allocated to Brisbane ( per cent) and the Gold Coast ( per cent). The SEQ Regional Plan targets reallocate the projected growth based on achieving a land supply and dwelling density scenario consistent with SEQ Regional Plan policy objectives and settlement pattern. People Historical population growth Projected population growth Figure 3 SEQ historical and projected population growth (2008 edition medium series) People Historical absolute average annual growth Projected absolute average annual growth Historical 5 year average annual growth rate Projected 5 year average annual growth rate % 3.0% 2.5% 2.0% 1.5% 1.0% 0.5% 0.0% Figure 4 SEQ average annual absolute and percentage historical and projected population growth (2008 edition medium series) Percent 14
16 A core drafting approach of the SEQ Regional Plan was to maintain the principles of the settlement pattern established under the SEQ Regional Plan , to enable realisation of that policy. The SEQ Regional Plan distributes the overall projected additional dwelling demand through the preferred settlement pattern to: relieve pressures on the coast encourage growth in the western corridor promote infill and renewal in existing urban areas promote appropriate development in infrastructure-rich areas maximise residential yield in major new residential developments. The preferred settlement pattern dwelling distribution means that for some local government areas, such as Brisbane and the Gold Coast, there will be a difference between the dwelling projections by the OESR and the SEQ Regional Plan s dwelling targets. Helping to achieve this shift in projected dwelling demand is part of the role of the SEQ Growth Management Program in implementing the policy of the SEQ Regional Plan. The dwelling targets of the SEQ Regional Plan were informed by a number of investigations and policy considerations: SEQ broadhectare studies were used to derive an estimate of the dwelling yields from broadhectare land planned for residential use infill dwelling yields were derived from a variety of parcel-level analyses prepared by local governments for infrastructure and strategic planning purposes draft local growth management strategies prepared by local governments were also used to identify key growth areas (including infill locations) and dwelling yields assessments were made about the practicality of additional future changes to land allocations and densities to accommodate the projected dwelling demand. The dwelling targets are a measure of the dwelling supply required to accommodate the projected dwelling demand in SEQ between 2006 and 2031, in accordance with the policies of the SEQ Regional Plan Issues affecting the dwelling targets and dwelling demand The following factors that have emerged since the adoption of the SEQ Regional Plan have influenced and will influence consideration of the dwelling targets: Key Initiative 17 of the Growth Management Summit was to: work in partnership with local government to confirm the distribution of dwellings targets within SEQ through the development of a Queensland Infrastructure Plan. Consultation has been undertaken with SEQ local governments to implement this initiative. For the purpose of this report the dwelling targets remain as identified in the SEQ Regional Plan, pending further work to confirm expected dwelling yields and timings in various areas. Key initiative 9 of the Growth Management Summit is to: task the ULDA with responsibility for facilitating delivery of major new satellite communities in priority greenfield areas, initially at Ripley Valley, Yarrabilba and Flagstone. Urban Development Areas were declared over Ripley Valley, Yarrabilba and Greater Flagstone in October 2010, prior to the adoption of development schemes for those areas in 2011 and early release development. The implications of the development of these areas for the dwelling targets depends on the planned timing of development, which in all cases is expected to extend well past the current 2031 dwelling target date. 15
17 The Caloundra South Regional Plan Development Area has also been declared as an Urban Development Area. A new round of state, regional and local government level population, household and dwelling projections is being prepared by the OESR. State and statistical division population projections were released in March Local government population projections and household and dwelling projections are expected to follow later in Those projections will have implications for the assumed medium to long-term dwelling demand in future SEQ Growth Management Program reports. 1.7 Report structure and future reporting The focus of this first SEQ Growth Management Program annual report is Sections 4 to 15, which report on residential and industrial land supply and development for SEQ as a whole and then each local government area (in alphabetical order). Those sections can be read as semi-independent reports for each area. Each of the Sections 4 to 15 first provides an integrated analysis of the data which is then presented in detail in the subsequent sub-sections. The following Section 2 provides an explanation of the data elements presented in Sections 4 to 15. Section 3 looks at recent development and market activity in SEQ as a context for considering the approved supply of land and dwellings and recent dwelling trends relative to the dwelling targets. Section 16 provides an overall summary of the findings of the report related to actions for consideration by state and local governments. The appendices provide more detail on the compilation, from multiple sources, of the land supply data reported in Sections 4 to 15. The timing of the release of future SEQ Growth Management Program annual reports will be determined in the context of a number of factors, including: the relationship of the SEQ Growth Management Program to the Queensland Infrastructure Plan, the first of which is expected to be released in mid-2011 the timing of availability of relevant development and supply data consideration being given to releasing factsheets in between annual reports to provide more timely updates, particularly on approved supply and development data. 16
18 2.0 Explanation of data elements This section provides an explanation of the data elements used to track development activity and estimate dwelling and industrial land supply for the SEQ region and each local government area (as reported in Sections 4 to 15). 2.1 Dwelling activity versus SEQ Regional Plan targets Infill and total dwelling activity is based on new dwelling approvals for the period 1 July 2006 to 30 June The approvals are derived from the Australian Bureau of Statistics Census Collection District level building approvals data, obtained through OESR. To give a broad indication only of how SEQ and individual local government areas are tracking in terms of being able to accommodate the projected dwelling demand to 2031, the dwelling targets are represented as the average number of dwellings required quarterly to match the respective total or infill targets. The cumulative dwelling activity up to each quarter is reported against the corresponding cumulative total of the average quarterly target. This is referred to as the pro rata target. Actual dwelling activity will vary up and down over time due to both short-term market factors, e.g. the cost and availability of finance, and longer-term trends of land availability and take-up, e.g. as land in existing developments is taken up and new developments in other areas gather momentum. The reported activity levels are less important than the reported dwelling supply when assessing the capacity of each local government area to accommodate the dwelling targets. Dwelling demand and activity over any period may fall above or below the pro rata target without affecting the area s capacity to accommodate the projected dwelling demand by In some local government areas, to illustrate the effect of expected variations in developable land supply and other factors over time, the cumulative dwelling activity is also compared to an adjusted rate of achieving of the targets which is proportional to the straight-line trend of OESR s dwelling projections (2008 edition medium series) between 2006 and Infill dwellings are both dwelling houses and multiple dwellings located within the Existing Urban Area. For the sake of simplicity in this report, the multiple dwelling figures include dual occupancy. The Existing Urban Area is a special purpose statistical area developed for the purposes of the SEQ Regional Plan. Maps of the Existing Urban Area and an explanation of its derivation and use are available at 17
19 2.2 Categories of supply Approved supply Both dwellings and industrial land supply are reported in three main categories: approved supply, planned supply and emerging supply. As illustrated in Figure 5, these categories reflect levels of land availability for development and stages in planning and development certainty. Progress to increasing planning certainty Planned supply Emerging supply Figure 5 Categories of dwelling and land supply Progress to increasing land availability Approved supply Approved supply is that which, in general, can be developed in accordance with an existing development permit. This is the component of supply that is most readily available for development in the short-term, subject to it being economically feasible. The estimated years of approved supply is an indicator of the capacity of the development industry to respond quickly to market demand without placing too much pressure on prices. It is important to note that the approved supply, as identified in this report, is generally a component of planned supply rather than additional dwellings or land. Planned supply Planned supply is intended to capture those areas where the measured form of development is consistent with the adopted planning scheme or equivalent, and a development permit for such a proposal is able to be applied for and is likely to be approved. This may include, for example, areas zoned or included in a local plan precinct primarily for the measured form of development, areas subject to a preliminary approval overriding a planning scheme, or areas identified for such development in a ULDA development scheme. The planned supply is that which, in land use planning terms, is available for development now, subject to a development application being made, the land being made available by the landowner, market demand and economic feasibility, including infrastructure costs. Emerging supply Emerging supply is intended to capture estimated dwelling yields and industrial land areas that are in various stages of allocation and planning for future development but do not yet meet the criteria for inclusion as planned supply. This applies to the additional dwellings or industrial land areas that would result from proposed new urban residential or industrial development or residential redevelopment, but the local planning to enable applications for development permits for such development to be made and approved is yet to be adopted into the planning scheme or equivalent. 18
20 Emerging supply is less certain than planned supply, which in turn is less certain than approved supply, in terms of dwelling yields and industrial land areas available and the timing of development. Those yields and land areas cannot, therefore, be taken as equivalent to the planned supply, until verified through the planning process. For the purpose of comparison to the SEQ Regional Plan dwelling targets, only the planned or emerging dwelling supply estimated to be developable by 2031 is reported in the respective planned and emerging supply graphs in Sections 4 to 15. Potential additional dwelling yields beyond 2031 are acknowledged separately in considering the ways in which any dwelling target shortfalls may be addressed. Appendices A1 and A2 explain the detailed derivation of each of the above categories of dwelling and industrial land supply for the purpose of this report. 2.3 Limitations of data In interpreting the development, dwelling and land supply data presented in this report, it is important to recognise a number of data limitations as explained in Appendix A Minimum land supply benchmarks The number of years supply is estimated for the different categories of dwelling supply to give an indication of the adequacy of supply, with a view to minimising price pressures that may result from an inadequate supply relative to demand. This responds to the SEQ Regional Plan which indicates the annual report on land supply will identify the number of years of land supply available in each sub-region and the amount of land and dwellings potentially available in the short to medium-term (p. 153). The report Factors Underpinning New Housing Costs and New Housing Availability in Victoria and Queensland, prepared by Urbis for the Queensland Department of Premier and Cabinet in March 2010, recommended the SEQ Growth Management Program establish land supply objectives for key growth areas (e.g. minimum of 10 years of developer ready land supply) (p.ix). The following provide some guidance for the respective categories of dwelling supply: Approved dwelling supply The current stock of approved supply is likely to be high compared to more recent rates of lot production and building approvals. This is because many of the approvals were sought and given during a period of relatively high development activity and confidence, and actual lot production and building activity has declined since the global financial crisis of The stock of uncompleted lots across SEQ is close to an historical high (based on OESR data). Given that the stock as at 30 June 2010 was equivalent to around four years supply, this is likely to be more than an adequate supply, subject to the current feasibility of developing that stock (see Section 3.1). The stock of operational works approvals across SEQ as at June 2010, at lots (1.2 years supply), was higher than it was for the same quarters in 2008 and 2009 (this is the full extent of the time series of data for operational works approvals). 19
21 The current stock of multiple dwelling material change of use approvals, at 5.7 estimated years of supply across SEQ, is likely to be historically high and more than an adequate supply, again subject to the current feasibility of developing those approvals, with some potentially not proceeding. The longer lead times required for building construction, particularly medium-high rise buildings, suggest a larger approved supply is preferable for multiple dwelling approvals compared to uncompleted lots. Planned dwelling supply The closest equivalent to planned dwelling supply in other jurisdictions is the zoned land supply. Under Victoria s Urban Development Program 10 years was previously identified as the benchmark for zoned land supply (the Urban Development Program now has a different basis for measurement based on Precinct Structure Plan status, with no minimum benchmarks identified). The New South Wales Metropolitan Development Program uses a benchmark of eight years for zoned land. However, in both cases those benchmarks were/are applied only to the supply in new development or growth areas outside the existing urban area. South Australia s Housing and Employment Land Supply Program is working towards increasing supply to a minimum of 15 years of zoned potential. Combined planned and emerging dwelling supply Both the Urban Development Program and Metropolitan Development Program previously had or have, respectively, adopted a benchmark of 15 years for the combined total of zoned and unzoned land in new development or growth areas. This is the closest equivalent to the combined planned and emerging supply category as reported in Sections 4 to 15. The Housing and Employment Land Supply Program identifies the objective of a 25-year rolling supply of land as a context for the 15 years supply of zoned land. The SEQ Regional Plan allocates land for the projected growth up to Unless there is a significant increase in the rate of growth in the meantime, or potential yields are significantly lower than previously estimated, there should be a minimum of 15 years of combined planned and emerging land supply available up to the time of adoption of a new Regional Plan, as expected in For the purpose of this report, the following minimum dwelling supply benchmarks are used as a basis for comparison to the reported supplies. These are subject to further research for future SEQ Growth Management Program annual reports. Category of supply Planned supply Combined planned and emerging supply Minimum dwelling supply benchmark 10 years 15 years No approved supply benchmarks are identified at this stage because: the effect of the global financial crisis has distorted the comparison of the approved stock with more recent production and building activity there is uncertainty about the current feasibility of some of the approved supply as the economic circumstances have changed significantly since the applications were made and approved. The report considers the number of years approved supply in the context of these circumstances and makes comparisons to the available historical data, SEQ regional averages and other local government areas. 20
22 For the reasons identified in Appendix A3.4, no estimates have been made of the number of years supply of available industrial land and no minimum supply benchmarks have been identified for the purpose of this report. Future SEQ Growth Management Program annual reports are proposed to address the adequacy of the industrial land supply. 21
23 3.0 Development and market context This section looks at development and market activity as a context for considering the approved supply of land and dwellings and recent dwelling trends relative to the dwelling targets. 3.1 Integrated analysis All available indicators of residential development and market activity in SEQ (see Sub-Sections 3.2 and 3.3), including dwelling and lot approvals, lot production and vacant lot sales, have been at relatively low levels over the two years to June 2010, although dwelling approvals consistently increased from March 2009 to June The level of new industrial building activity was also at a lower level during 2009 (see Section 3.4). The major factors contributing to these lower levels of activity are believed to be the reduced availability and higher cost of finance and a more risk averse market since the global financial crisis of The significance of other factors in contributing to the decline in activity is not for this report to assess. Infrastructure charges and development assessment requirements (in part) are the subject of other initiatives of the state government s response to the Growth Management Summit. The historically high level of lapsed residential lot approvals during 2009 and continuing into 2010, with those approvals having occurred during a period of high lot approvals, indicates that many previously approved developments have not been considered economically feasible in the prevailing market. The unknown scope of currently unfeasible developments is a qualifying factor on the size of the stocks of uncompleted lots and multiple dwelling approvals reported as part of the SEQ region and individual local government area approved dwelling supplies (see Sections 4 to 15). 3.2 Dwelling approvals Figure 6 shows that, since the September Quarter 2008, dwelling approvals have been at levels below both the average SEQ Regional Plan dwelling target and activity levels over the period. Activity levels recovered somewhat up to the June Quarter 2010 after the very low figure for March Quarter In the year to June 2010 there were new dwelling approvals in SEQ. This is a 12 per cent increase on approvals in Dwellings Sep Dec Mar Jun Sep Dec Mar Jun Sep Dec Mar Jun Sep Dec Mar Jun Multiple dwellings Dwelling houses Quarterly averaged total target Figure 6 Quarterly dwelling approvals and averaged target 22
24 3.3 Residential subdivision Lot approvals Figure 7 shows quarterly residential lot approvals over the period from July 2006 to June Lot approvals relate to the number of residential lots in a subdivision plan which has been approved by a local government. The information relates to all residential and rural residential lots approved, with most being for dwelling houses. The total number of lot approvals for the year to June 2010 was This is a 12 per cent decrease on the number of lots approved in and the level of approvals in both years is below the annual average of approvals experienced over the period July 2006 to June Lots Sep Dec Mar Jun Sep Dec Mar Jun Sep Dec Mar Jun Sep Dec Mar Jun Lot approvals Quarterly averaged lot approvals Figure 7 Lot approvals Lot production Figure 8 shows quarterly residential lot production over the July 2006 to June 2010 period. Lot production is the number of lots which have been completed in accordance with the conditions of the local government approval. The information relates to all residential and rural residential lots produced. Total lot production for the year to June 2010 was , an 8 per cent decrease on the number of lots produced in Over the period to June 2010, the SEQ region produced an annual average of lots per year. Lot production has generally been below average over the last two years. Lots Sep Dec Mar Jun Sep Dec Mar Jun Sep Dec Mar Jun Sep Dec Mar Jun Lot production Quarterly averaged lot production Figure 8 Lot production Lots lapsed Figure 9 shows the number of lapsed lots by quarter over the July 2006 to June 2010 period. Lapsed lots include those which have previously been approved for subdivision but those approvals have lapsed, i.e. they have not been implemented or extended in the time set by the Sustainable Planning Act or the former Integrated Planning Act. They also include approved lots effectively superseded by another approval. The total number of lapses for the year to June 2010 was This is a 4.4 per cent decrease on the number of lapses for On average over the period to June 2010, the SEQ region experienced 2003 lapses per year. Lots Sep Dec Mar Jun Sep Dec Mar Jun Sep Dec Mar Jun Sep Dec Mar Jun Lots lapsed Quarterly averaged lots lapsed Figure 9 Lots lapsed 23
25 OESR has advised that the recent increase in lots lapsed correlates, with an appropriate lag in time, with an earlier period of high lot approvals, and there were similar correlations between high levels of lots lapsed in the late 1990 s and high lot approvals in the early 1990 s Vacant land sales Figure 10 shows the number of vacant lot sales by quarter over the July 2006 to June 2010 period, based on the date of signing of the sales contract. It should be noted that there is a time lag between the signing of a contract and the settlement date and when information is provided, which may tend to reduce recent figures compared to their actual level. The total number of sales for the year ending June 2010 was Although below average for the whole period, this is a 1.5 per cent increase on the number of sales for Over the period to June 2010, the SEQ region experienced an annual average of sales per year. Lots Sep Dec Mar Jun Sep Dec Mar Jun Sep Dec Mar Jun Sep Dec Mar Jun Vacant lot sales Quarterly averaged vacant lot sales Figure 10 Vacant lot sales 3.4 New industrial building approvals The number of new industrial building approvals and the areas of those approvals have fluctuated over the January 2006 to December 2009 period, as shown in Figure 11. In 2009, 56 hectares of industrial land was taken up through approvals, this equates to a 71.3 per cent decline in approval areas from 2008, and a 46.5 per cent reduction in the number of approvals over the same period. Area (ha) Mar Jun Sept Dec Mar Jun Sept Dec Mar Jun Sept Dec Mar Jun Sept Dec Approvals Area of industrial approvals Number of approvals Quarterly ave (last 4 years) Figure 11 New building approvals on industrial land 24
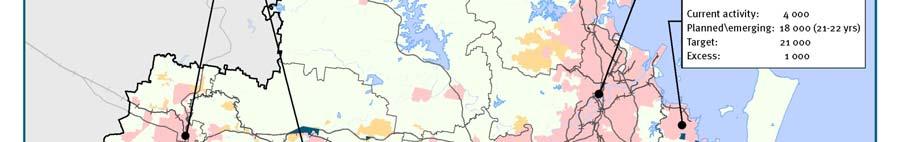
26 4.0 South East Queensland region 4.1 Integrated analysis Total dwelling activity Up to about June 2008 total new dwelling approvals in SEQ were tracking in line with the pro rata total additional dwelling target. Since the global financial crisis dwelling activity has declined and the total new dwelling approvals up to June 2010 were about 86 per cent of the pro rata total additional dwelling target Infill dwelling activity Up to June 2010 new infill dwelling approvals were tracking ahead of the pro rata infill additional dwelling target. More than half of the new infill dwelling approvals were for dwelling houses, which would mostly have been locating on recently subdivided land in the Existing Urban Area. As the remaining broadhectare land in the Existing Urban Area is taken up in the short to medium-term, dwelling house activity in these areas will decline. It is expected that multiple dwelling development activity will increase as policy reform and increased market acceptance take hold. This is dependent on enabling amendments to planning schemes, development approvals and appropriate supporting infrastructure investment. Planned state infrastructure across the region that is supportive of infill development includes: the Eastern and Northern Busways and Cross River Rail in Brisbane; Gold Coast Rapid Transit and extension of the rail line to Elanora and Coolangatta on the Gold Coast; the Moreton Bay Rail Line between Petrie and Kippa Ring; and generally additional rail lines and carriage stock across the region Approved dwelling supply As at June 2010, across SEQ as a whole, the approved supplies of multiple dwellings and residential lots, including total uncompleted lots and those with operational works approval, appeared to provide an adequate supply of dwellings in the short-term, subject to the current feasibility of developing those approvals Planned and emerging dwelling supply Across the SEQ region as a whole there is adequate planned and combined planned and emerging supply, for both infill and total dwellings, in terms of the minimum supply benchmarks of 10 and 15 years, respectively. Some local governments have inadequate years of supply in some categories of planned and combined planned and emerging infill and total dwelling supply. Overall there are shortfalls in the combined planned and emerging supply compared to both the infill and total dwelling targets to 2031, but there are significant emerging planning changes in a number of local government areas (see Sections 5 to 15) whose additional dwelling yields are not yet able to be estimated. There are also expected dwelling yields beyond 2031 that may be able to be brought forward if required to offset any shortfalls in meeting the dwelling targets to
27 From a land use planning perspective, the capacity of the SEQ region and individual local government areas to achieve the targets will depend on: various emerging planning changes being implemented to enable increased dwelling yields monitoring the achievement of the currently estimated dwelling yields to ensure they are realistic and improving the consistency of such estimates to better inform decision-making over time Industrial development and land supply Over the period , new building approvals on industrial land are estimated to have taken up an average of about 126 hectares per year across SEQ, but for the reasons identified in Section A3.4, this cannot be used directly as a basis for assessing land supply adequacy. Further work is required over time to integrate the Industrial Land Monitoring Program data reported here with the findings of other sub-regional industrial land studies to enable meaningful conclusions to be drawn regarding the adequacy of industrial land supplies and planning actions for consideration. It is notable that there is currently limited noxious and hazardous industry equivalent available land across the whole of SEQ. High impact industry equivalent zones may be able to accommodate some of these difficult to locate uses, but this finding supports the need for the current state government investigations to identify a 50-year land bank for large scale and high impact industries Development prioritisation The SEQ Regional Plan establishes the priority of the preparation of plans for the Regional Development Areas...to achieve on-going land supply through the delivery of several large master-planned communities... (p.107). Key Initiative 9 of the state government s response to the Growth Management Summit further establishes the priority for development of three major new satellite communities based on what are now the Urban Development Areas of Ripley Valley, Greater Flagstone and Yarrabilba. The subsequent decision to also declare the Caloundra South Regional Plan Development Area as an Urban Development Area indicates the importance the state government has placed on increasing planned dwelling supply to assist in improving housing affordability across the region. The Regional Development Areas across the SEQ region typically require significant investment in state transport infrastructure to support their full development, as well as other necessary education, health, emergency services and recreational facilities over time to enable the resulting communities to function effectively. The effective availability of a proportion of the dwelling and land supplies identified in this report is therefore dependent on state and other infrastructure funding being available to support the development and use of those areas. The actual prioritisation of the required infrastructure funding and thus the related Development Areas will be informed by a range of policy, community need and market considerations which are beyond the scope of the SEQ Growth Management Program in itself. Pursuant to the SEQ Regional Plan, the SEQ Growth Management Program has a role in informing the prioritisation of the state government s infrastructure expenditure. The primary roles of the SEQ Growth Management Program in this regard will be to: inform the need for investigation of additional or alternative areas for development or higher densities, if required to meet the dwelling targets or projected land demand over time, with such areas having differing requirements for state infrastructure 26
28 facilitate an integrated and consistent appreciation and comparison of realistic dwelling and employment yields, as a basis for estimating infrastructure demand and assessing dwelling and employment yields relative to costs. The capacity of the SEQ Growth Management Program to perform these roles is expected to improve over time. Solely from the perspective of dwelling supply needs, the highest priority for land use and infrastructure planning work across SEQ should be given to those local government areas where the planned or combined planned and emerging supply is or may soon be inadequate compared to the minimum supply benchmarks. Planning actions are underway to address apparent land supply inadequacies in Brisbane, Logan, Toowoomba, Scenic Rim and Somerset. The next highest priority for land use and infrastructure planning work should be those areas which may have an adequate number of years supply currently, but where further planning changes would appear necessary to provide the capacity to accommodate the dwelling targets to Local government areas that appear to be in this category, for infill or total dwellings or both, include Lockyer Valley, Moreton Bay, Redland and Sunshine Coast, but again planning actions are generally in process to address the identified shortfalls or provide better measurement of the supply. From an industrial perspective, the SEQ Growth Management Program is not yet able to provide land supply adequacy cues to inform the prioritisation of land use and infrastructure planning work. Structure planning is occurring for the two largest Regional Development Areas of Ebenezer and Bromelton to support the availability of these areas for development in the short to medium-term. 27


29 4.1.7 Map SEQ Total dwelling supply 28


30 4.1.8 Map SEQ Infill dwelling supply 29
31 4.2 Dwelling activity versus SEQ Regional Plan dwelling targets Total dwelling activity versus targets Figure 12 shows that, for the period July 2006 to June 2010, new dwelling approvals were tracking around the pro rata target for total additional dwellings until about June Since then the new dwelling approvals have dropped to be about 86 per cent of the target as at 30 June 2010 (see Table 1 also). Dwellings As noted in Section 2.1, dwelling activity will vary up and down over time due to short-term market factors and longer-term trends. The scope for achievement of Mulitple dwellings 2006 onwards Pro rata dwelling target SEQRP Dwelling houses 2006 onwards the dwelling target to 2031 needs to be informed by the reported dwelling supply (see Section 4.3). A range of circumstances exists in SEQ's 11 local government areas in terms of how they are tracking against their individual pro rata total additional dwelling targets, as described in Sections 5 to 15. In SEQ the proportion of multiple dwellings has remained fairly constant, with a cumulative percentage of around 35 per cent of all dwelling approvals in the period up to June In comparison, around 32 per cent of Queensland's new dwelling approvals were for multiple dwellings. In New South Wales the equivalent figure was around 47 per cent with the Australian Capital Territory the highest for Australian states at 48.4 per cent. Table 1 Total dwelling activity and pro rata SEQ Regional Plan target Sep Dec Mar Jun Sep Dec Mar Figure 12 Cumulative dwelling approvals and pro rata total dwelling target Jun Sep Dec Mar Jun Sep Dec Mar Jun Cumulative total of all new dwelling approvals (1 July 2006 to 30 June 2010) Pro rata total additional dwelling target ( / year) ( / year) Current activity as a percentage of the pro rata total additional dwelling target 86% SEQ is currently tracking below the pro rata total additional dwelling target ( / year) Note: values above are as at 30 June
32 4.2.2 Infill dwelling activity versus targets Figure 13 and Table 2 show that, for the period July 2006 to June 2010, the SEQ region as a whole was tracking ahead of the pro rata infill additional dwelling target. This is also the case in most of the nine local government areas that have infill dwelling targets, as described in Sections 5 to 15. Dwellings Sep Dec Of the new infill dwelling approvals, 47 per cent were for multiple dwellings. Conversely, 53 per cent of the new infill dwelling approvals were for Mulitple dwellings 2006 onwards Pro rata dwelling target SEQRP Dwelling houses 2006 onwards dwelling houses, most of which Figure 13 Cumulative new infill dwelling approvals and pro rata infill dwelling target would have been locating on recently subdivided land in the Existing Urban Area. This type of dwelling activity is expected to decline in the short to medium-term as remnant broadhectare land in the Existing Urban Area is taken up. The level of multiple dwelling activity in the Existing Urban Area is expected to increase over time, inline with the principles, strategies and actions of the SEQ Regional Plan Mar Jun Sep Dec Mar Jun Sep Dec Mar Jun Sep Dec Mar Jun Table 2 Infill dwelling activity and pro rata SEQ Regional Plan infill target Cumulative total of new infill dwelling approvals (1 July 2006 to 30 June 2010) Pro rata infill additional dwelling target ( / year) ( / year) Current activity as a percentage of the pro rata infill additional dwelling target 122% SEQ is currently tracking above the pro rata infill additional dwelling target (3 310 / year) Current percentage of infill to total new dwelling approvals (target aim 50% overall) 70% Note: values above are as at 30 June
33 4.3 Residential supply Approved dwelling supply Figure 14 shows that lot production over the last four years has generally been lower than lot approvals. The more recent increase in lots lapsed has been the main reason for the decline in the number of uncompleted lots from the historically high level of The stock of uncompleted lots for the SEQ region as at 30 June 2010 was lots, which is a 1 per cent decrease on Lots Figure 14 also shows there were uncompleted operational works approvals as at 30 June 2010, a 6.1 per cent increase on Table 3 summarises the approved dwelling supply reflected in both the stock of uncompleted lots and multiple dwelling material change of use approvals in the Existing Urban Area across the SEQ region. Uncompleted lots - total Lot production Lots lapsed Uncompleted lots - operational works Lot approvals Figure 14 Uncompleted lots and operational works approvals with annual lot approvals, lot production and lots lapsed Table 3 Approved dwelling supply Type of dwelling supply Number of Estimated years Part of region (as at 30 June 2010) dwellings 1 of supply Inside Existing Multiple dwelling material change of use development Urban Area permits and undefined approvals Uncompleted lots operational works Total Uncompleted lots total These components of approved dwelling supply cannot be summed because operational works approvals are a subset of the total uncompleted lots and there are overlaps between uncompleted lots and multiple dwelling material change of use approvals. The multiple dwelling material change of use approvals is a relatively new data collection, but the stock of approvals reported by OESR has continually increased from December 2008 to June The absolute number of operational works approvals is the highest shown in Figure 14 (the data was first reported in 2007). The total stock of uncompleted lots is close to the historical high. Given these factors, the approved supply across the SEQ region as a whole would appear to provide an adequate supply of dwellings in the short-term, subject to the current feasibility of developing those approvals. 32
34 4.3.2 Planned and emerging dwelling supply Figure 15 reports planned and emerging dwelling supply for both inside the Existing Urban Area and the total area of SEQ. It also estimates the number of years supply those dwellings represent (as at 30 June 2010) and the estimated current shortfall or excess of the combined planned and emerging supply compared to the infill and total dwelling targets Shortfall dwgs Dwellings Planned dwgs years Planned / emerging dwgs years Shortfall dwgs Planned dwgs years Planned / emerging dwgs years Current activty dwgs Current activty dwgs Total Infill Emerging supply Planned supply Current Activity 07/06-06/10 Target to 2031 Figure 15 SEQ planned and emerging dwelling supply (figures rounded to nearest 1 000) Figure 15 shows there is adequate planned and combined planned and emerging supply, for both infill and total dwellings across the SEQ region as a whole, in terms of the minimum supply benchmarks of 10 and 15 years, respectively. There is a shortfall in the combined planned and emerging supply compared to the infill and total dwelling targets to 2031, but there are also significant emerging planning changes in various local government areas whose additional dwelling yields are not yet able to be quantified and have therefore not been reported in Figure 15. In addition, there are significant planned and emerging dwelling yields currently expected beyond 2031 and additional potential dwelling yields within the Urban Footprint in various locations, which may need to be brought forward to assist in addressing the shortfalls. Details of the emerging planning changes across the region and estimated yields beyond 2031 are provided where relevant for each local government area in Sections 5 to 15. Those or equivalent changes will need to be implemented over time for the respective local government areas and the region as a whole to have the capacity to accommodate the infill and total dwelling targets. 33
35 4.4 Industrial development and land supply Figure 16 shows the number and area of new nonresidential building approvals on industrial land for the period from January 2006 to December Overall, the region experienced development of 504 hectares total or an average of around 126 hectares annually of new nonresidential building approvals on industrial land. Both the land area and number of new building approvals on industrial land have fluctuated over the period, as shown in Figure 16. In 2009, there was a 71.3 per cent decrease in building approval areas from Area (ha) Area of industrial approvals Number of approvals Annual ave (last 4 years) Figure 16 New building approvals on industrial land Approvals Figure 17 shows the industrial land supply across SEQ by Queensland Planning Provisions zone category (see Appendix A2) with the inclusion of a non-industry zone to account for predominantly industrial uses approved on nonindustrial zoned land. Around 58 per cent of the land is zoned and the remainder is industry investigation equivalent, the latter including the SEQ Regional Plan Development Areas and enterprise opportunity areas that are not currently zoned for industry. The main zones in terms of available land are medium Figure 17 Available industrial land areas by zone impact equivalent, industry equivalent, low impact equivalent, non-industry zones and then high impact equivalent. It is notable that there is limited noxious and hazardous equivalent available land across SEQ, all of which is located in Brisbane, although the high impact equivalent zones may be accommodating some of those difficult to locate uses. Table 4 shows areas of approved, planned and emerging industrial land supply across the SEQ region. Area (ha) High Impact 203 High technology Industry Planned Low impact Medium impact 915 Non industry 37 Noxious and hazardous Emerging 170 Waterfront marine Industry Investigation Table 4 Industrial land supply Planned and emerging Approved 1 Planned 2 Emerging 3 Total % of SEQ Brisbane Gold Coast Ipswich Lockyer Valley Logan Moreton Bay Redland Scenic Rim Somerset Sunshine Coast Toowoomba (SEQ part) Total SEQ Includes land with material change of use or reconfiguring a lot development permits and vacant industrial zoned lots registered in the last five years. 2. Includes approved supply and industrial zones other than emerging supply, plus preliminary approvals overriding the planning scheme. 3. Includes areas zoned for industry investigation or equivalent plus SEQ Regional Plan Development Areas (employment only) and enterprise opportunity areas. 34
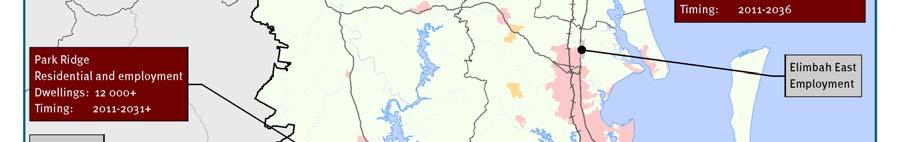
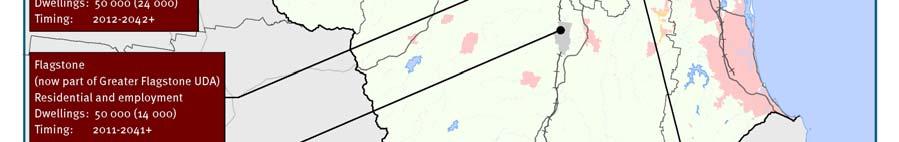
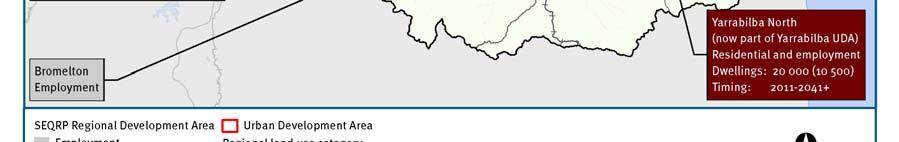
36 The bulk of the land in Ipswich (3 528 hectares or 75 per cent) is emerging supply (industry investigation), mostly in the Ebenezer Regional Development Area. Scenic Rim currently has the most zoned land of any local government area, mostly in the Bromelton Regional Development Area which is currently subject to structure planning that will further refine planning for this area. 4.5 Development Areas Development Areas as identified in the SEQ Regional Plan are fundamental to delivering dwellings and employment for the region. They will be monitored as part of the SEQ Growth Management Program to ensure constraints on their planning and development are identified and actions are considered by state and local government to help ensure development occurs in an appropriately prioritised manner. Many of the Development Areas are currently at various stages in the preparation of plans to guide and facilitate their development. The focus of the SEQ Growth Management Program will be on monitoring and informing the implementation of the necessary land use and infrastructure planning, and the funding or provision of infrastructure, to enable the development of the Development Areas. Tables 5 and 6 summarise the expected type of development, scale and timing of development of the Regional Development Areas, and Figure 18 illustrates their location. Details of the current land use planning and infrastructure status of the areas are identified in the respective local government area Sections 5 to 15, together with similar information on the Local Development Areas in those local government areas. Table 5 Residential and employment Regional Development Areas (as at October 2010) Area Type of development Dwellings (approx.) Gold Coast Coomera Town Centre Ipswich Ripley Valley Logan Flagstone (now part of Greater Flagstone Urban Development Area) Park Ridge Yarrabilba North (now part of Yarrabilba Urban Development Area) Envisaged to accommodate a mix of residential and employment uses A model mixed-use urban community including a major regional activity centre and a range of housing and employment A model urban community including a major regional activity centre with a full range of services, employment and transport options. Offering a diverse range of housing and community facilities and knowledge-based and mixed use employment A model self-contained community, accommodating a regional activity centre, residential, local services and employment ( to 2031) ( to 2031) ( to 2031) Expected timing ( to 2031)
37 Area Type of development Dwellings (approx.) Sunshine Coast Caloundra South Maroochydore Palmview A compact community with an efficient and effective public transport system, a range of housing choice and affordability, local employment, retail, community facilities, services and recreation A significant location for economic and employment growth and a diverse range of housing and an efficient and effective multi-modal public transport system. A range of housing choice and affordability, as well as employment and recreation ( to 2031) Expected timing to Table 6 Employment Regional Development Areas (as at October 2010) Ipswich Ebenezer Moreton Bay Elimbah East Scenic Rim Bromelton Area Type of development Industrial area (ha) Proposed to accommodate a range of manufacturing and logistics enterprises, as well as heavy, difficult to locate and large footprint industries Proposed for light industry with ready access to the Bruce Highway Potential to accommodate high impact industries, such as those requiring large buffer areas and separation from built up areas Expected timing Unknown


38 Figure 18 SEQ Regional Plan Regional Development Areas 37
39 Local government areas 5.0 Brisbane 5.1 Integrated analysis Total dwelling activity Up to June 2010, total new dwelling activity in Brisbane was above the pro rata additional dwelling target, with only a small decline in activity apparent following the global financial crisis in Infill dwelling activity Infill dwelling activity was also tracking ahead of the pro rata additional infill dwelling target up to June 2010, although it needs to be recognised that nearly half of the new dwelling approvals recorded were for dwelling houses, which would have been locating mostly on recently subdivided land in the Existing Urban Area. Over time there is expected to be an increase in multiple dwelling activity to make up for the expected decline in dwelling house approvals. Further land use planning changes and supporting infrastructure investment are needed to maintain dwelling activity as remnant broadhectare land inside the Existing Urban Area is taken up Approved dwelling supply As at June 2010, the approved supply of residential lots, both total uncompleted lots and those with operational works approval, was relatively low compared to most other parts of SEQ and the regional average years of supply. This is of less concern given that land subdivision is becoming a less significant component of dwelling supply in Brisbane. The approved supply of multiple dwellings is likely to be adequate, subject to the feasibility of developing those approvals Planned and emerging dwelling supply The planned and combined planned and emerging dwelling supply are above or slightly below the minimum benchmarks for an adequate supply. The combined planned and emerging supply initially represents a significant shortfall compared to both the infill and total dwelling targets, but this is primarily because many of the emerging planning changes are not yet sufficiently progressed to identify a reliable dwelling yield. There are a number of land use planning changes underway in Brisbane that will contribute significantly towards accommodating the infill and total dwelling targets. These changes are facilitated by state government planning and infrastructure investment. The state is collaboratively involved in a number of related initiatives, e.g. River City Blueprint and Yeerongpilly Transit Oriented Development. The council and collaborative land use planning initiatives are supported by state infrastructure investment, including the Eastern and Northern Busways, the proposed Cross River Rail and increases in rail lines and carriage stock. The ULDA Urban Development Areas at Fitzgibbon, Northshore Hamilton, Bowen Hills and Woolloongabba contribute significantly to planned and emerging infill dwelling yields in Brisbane. The numerous planning changes in process need to be monitored to ensure adequate planned supply is created overtime to accommodate the dwelling targets. When prepared, the council s new strategic 38
40 framework and associated studies should provide the appropriate tool for coordinating the distribution of growth and ensuring the combined dwelling supply across the City is adequate to 2031 and beyond Industrial development and land supply About 56 per cent of the industrial land consumption across the SEQ region during the four years to December 2009 was in Brisbane. Given the large supplies of industrial land available in other SEQ local government areas, and the constraints on further significant industrial development in or near Brisbane s urban area, the City s current industrial land demand would be expected to shift to other areas over time. 39

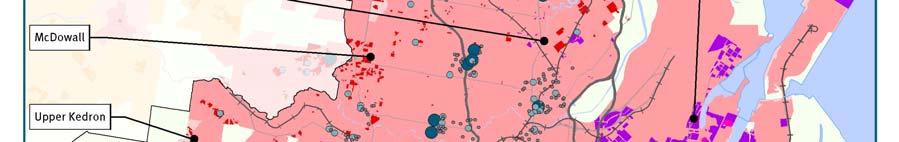
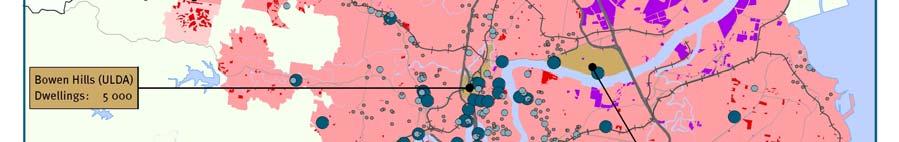
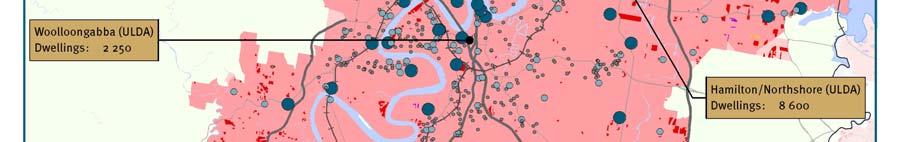
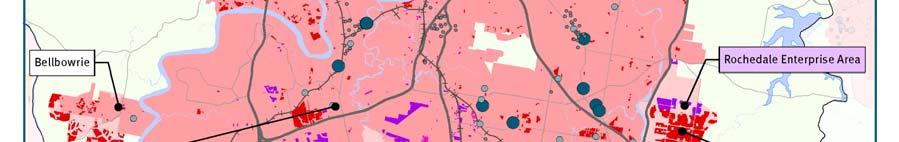
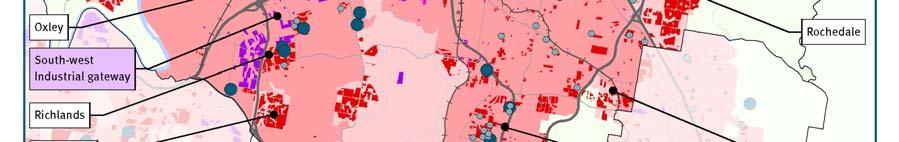
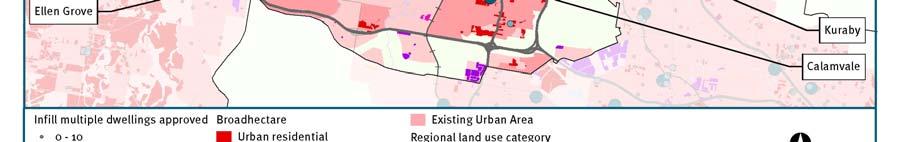
41 5.1.6 Brisbane integrated land supply 40
42 5.2 Dwelling activity versus SEQ Regional Plan dwelling targets Total dwelling activity and targets Figure 19 and Table 7 show that, for the period from July 2006 to June 2010, Brisbane was tracking at about 112 per cent of its pro rata total additional dwelling target, based on building approvals for new dwellings. This is despite an apparent decline in activity during Dwellings The proportion of multiple dwellings has increased over the period to June 2010, with a cumulative percentage of around 53 per cent of all new dwelling approvals. In comparison, the equivalent figure for SEQ as a whole was 35 per cent Sep Dec Mar Jun Sep Dec Mar Jun Sep Dec Mar Jun Sep Dec Mar Mulitple dwellings 2006 onwards Dwelling houses 2006 onwards Pro rata dwelling target SEQRP Figure 19 Cumulative dwelling approvals and pro rata total dwelling target Jun Table 7 Total dwelling activity and pro rata SEQ Regional Plan target Cumulative total of all new dwelling approvals (1 July 2006 to 30 June 2010) Pro rata total additional dwelling target (7 017 / year) (6 240 / year) Current activity as a percentage of the pro rata total additional dwelling target 112% Brisbane is currently tracking ahead the pro rata total additional dwelling target (777 / year) Note: values above are as at 30 June
43 5.2.2 Infill dwelling activity and targets Figure 20 and Table 8 show that, for the period July 2006 to June 2010, Brisbane was tracking at about 117 per cent of its pro rata infill additional dwelling target. The proportion of multiple dwelling approvals in the Existing Urban Area has recorded an increase over the period to June 2010, with a cumulative percentage of around 56 per cent of all dwelling approvals. In comparison, the equivalent figure for SEQ was 47 per cent. Dwellings Sep Dec Mar Jun Sep Dec Mar Jun Sep Dec Mar Jun Sep Dec Mar Jun Mulitple dwellings 2006 onwards Dwelling houses 2006 onwards Pro rata dwelling target SEQRP Figure 20 Cumulative infill dwelling approvals and pro rata infill dwelling target Conversely, about 44 per cent of the new dwelling approvals in Brisbane s Existing Urban Area were for dwelling houses. As the remnant broadhectare land in the Existing Urban Area is taken up in the short to medium-term, this activity is expected to decline. To assist in accommodating the infill target, council's new strategic framework and continued development of neighbourhood plans is expected to support increased multiple dwelling activity. Table 8 Infill dwelling activity and pro rata SEQ Regional Plan infill target Cumulative total of new infill dwelling approvals (1 July 2006 to 30 June 2010) Pro rata infill additional dwelling target (6 468 / year) (5 520 / year) Current activity as a percentage of the pro rata infill additional dwelling target 117% Brisbane is currently tracking above the pro rata infill additional dwelling target (948 / year) Current cumulative percentage of infill to total dwellings (target aim 88% overall) 92% Note: values above are as at 30 June
44 5.3 Residential supply Approved dwelling supply Figure 21 shows that the stock of uncompleted lots has fluctuated since This has been associated with a decline in both lot approvals and production to , and a significant increase in lots lapsed in recent years. There has been an increase in the number of uncompleted lots in , due mainly to increased lot approvals. The closing stock as at 30 June 2010 was 6642 lots, which is an 8.3 per cent increase on The increased number of lots lapsed in the last two years or so is a consistent finding across SEQ. As indicated in Section 3.1, this represents a qualification on the realistic availability of the remaining stock of lots. Lots Uncompleted lots - total Lot production Lots lapsed Uncompleted lots - operational works Lot approvals Figure 21 Uncompleted lot and operational works approvals with annual lot approvals, lot production and lots lapsed Figure 21 also shows that there were 1508 uncompleted lots with operational works approvals as at 30 June 2010, a 1.5 per cent increase on Due to the investment required to obtain operational works approval, this stock of lots is likely be produced in the very short-term. Table 9 summarises the approved dwelling supply reflected in both the stock of uncompleted lots and multiple dwelling material change of use approvals in the Existing Urban Area. Table 9 Approved dwelling supply Type of dwelling supply Number of Estimated years of Part of area (as at 30 June 2010) dwellings 1 supply Inside Existing Multiple dwelling material change of use Urban Areas development permits and undefined approvals Uncompleted lots operational works Total Uncompleted lots total These components of approved dwelling supply cannot be summed because operational works approvals are a subset of the total uncompleted lots and there are overlaps between uncompleted lots and multiple dwelling material change of use approvals. At 3.1 years, the stock of uncompleted lots is the lowest for the region, below the 4.0 years average for SEQ, but given that land subdivision would be expected to be a declining component of Brisbane s dwelling supply over time, this is of less concern. The stock of operational works approvals is one of the lowest for the region, below the 1.2 years average for SEQ. The approved supply of multiple dwellings is likely to be adequate, subject to the feasibility of developing those approvals, even though it is just below the SEQ average of 5.7 years of supply Planned and emerging dwelling supply Figure 22 reports the planned and emerging dwelling supply for both inside the Existing Urban Area and the total area of Brisbane. It also estimates the number of years supply those dwellings represent (as at 30 June 2010) and the estimated current shortfall or excess of the combined planned and emerging supply compared to the infill and total dwelling targets. 43
45 Shortfall dwgs Shortfall dwgs Dwellings Planned dwgs years Planned / emerging dwgs years Planned dwgs 9-10 years Planned / emerging dwgs years Current activty dwgs Current activty dwgs Total Infill Emerging supply Planned supply Current Activity 07/06-06/10 Target to 2031 Figure 22 Brisbane planned and emerging dwelling supply (dwellings rounded to nearest 1 000) The planned and combined planned and emerging dwelling supply, for both infill and total dwellings as at June 2010, either met (for total planned supply) or was slightly below the minimum supply benchmarks of 10 and 15 years, respectively. Although the combined planned and emerging supply is well below both the infill and total dwelling targets, Table 10 identifies the status of a large number of emerging planning changes in Brisbane that may contribute to increased supply to accommodate those targets. Table 10 Emerging planning changes (as at October 2010) Planning change Status Bowen Hills Renewal Plan Plan project in development Brisbane Strategic Plan Drafting Bulimba District Neighbourhood Plan Drafting Chermside Centre Neighbourhood Plan Drafting Eastern Corridor Neighbourhood Plan Draft Indooroopilly Centre Neighbourhood Plan Drafting Kangaroo Point South Renewal Plan Drafting Lower Oxley Creek South Neighbourhood Plan Drafting Lower Oxley Creek North Neighbourhood Plan Drafting Milton Railway Neighbourhood Plan On public display Mitchelton Neighbourhood Plan Drafting (post strategy) Moggill Bellbowrie Neighbourhood Plan Planning commenced July 2010 Mt Gravatt Corridor Neighbourhood Plan Drafting (strategy exhibited) Newstead Teneriffe Neighbourhood Plan Drafting Oxley Darra District Neighbourhood Plan Planning commenced July 2010 Paradise Wetlands Neighbourhood Plan First state interest check Pinkenba and Eagle Farm Neighbourhood Plan Drafting (pre strategy) 44
46 Planning change Status Racecourse Precinct Neighbourhood Plan Drafting Richlands Wacol Corridor Neighbourhood Plan Drafting (post strategy) River Gateway Neighbourhood Plan Planning commenced July 2010 Sherwood and Graceville District Neighbourhood Plan Post statutory exhibition South Brisbane Riverside Neighbourhood Plan First state interest check Taringa-St Lucia Renewal Plan Drafting Toombul Nundah Renewal Plan Planning commenced July 2010 Toowong-Auchenflower Neighbourhood Plan Drafting Yeerongpilly Transit Oriented Development Planning commenced July 2010 The potential additional dwelling yields associated with many of the emerging planning changes are not counted in the emerging supply reflected in Figure 22 because planning is not sufficiently advanced to estimate or report those yields. There are also components of the planned dwelling supply currently expected to occur after 2031 that are not counted in Figure 22 but may be able to be brought forward. Given the emerging planning changes, also including a draft strategic framework and associated studies which the council expects to produce in 2012 and which will be directed towards accommodating the dwelling targets, Brisbane should be able to create adequate planned dwelling supply over time. This will be tracked in future SEQ Growth Management Program annual reports. 5.4 Industrial development and land supply Over the four-year period from January 2006 to December 2009, Brisbane experienced development of around 70 hectares annually of new building approvals on industrial land. This is 56 per cent of the industrial land consumption across the SEQ region as a whole (see Section 4.4). The area of building approvals on industrial land fluctuated over this period, as shown in figure 23. In 2008 the area of building approvals was the highest, even though the number of approvals declined consistently between 2006 and Area (ha) Area of industrial approvals Number of approvals Annual ave (last 4 years) Figure 23 New building approvals on industrial land Approvals Figure 24 shows that the bulk of the available industrial land was located in industry equivalent or low or medium impact equivalent zones. There are small proportions of high impact, high technology and noxious and hazardous equivalent zones. Three per cent of the allocated land is zoned equivalent to industry investigation (future industry). Area (ha) Table 11 shows the land areas of approved, planned and emerging industrial land supply compared to SEQ as a whole. As illustrated on the map in Section 5.1, major localities of industrial land supply (planned and emerging) in Brisbane include Australia Trade Coast, Rochedale and the South-west industrial gateway. High Impact High technology Industry Planned Low impact Medium impact Non industry Noxious and hazardous Emerging Waterfront marine Industry Investigation Figure 24 Available industrial land areas by zone 45
47 Table 11 Industrial land supply Planned and emerging Approved 1 Planned 2 Emerging 3 Total % of SEQ Brisbane Total SEQ Includes material change of use and reconfiguring a lot development permits and vacant industrial zoned lots registered in the last five years. 2. Includes approved supply and industrial zones other than emerging supply, plus preliminary approvals overriding the planning scheme. 3. Includes areas zoned for industrial investigation or equivalent plus SEQ Regional Plan Development Areas (employment only) and enterprise opportunity areas. 5.5 Development Areas The SEQ Regional Plan does not nominate any Development Areas for Brisbane. 46
48 6.0 Gold Coast 6.1 Integrated analysis Total dwelling activity Dwelling activity on the Gold Coast has been tracking reasonably well against the total dwelling target up to June The decline in activity since about mid-2008 means new dwelling approvals are no longer tracking ahead of the pro rata additional dwelling target, but that decline is likely to be at least partly a result of the global financial crisis and activity levels could be expected to improve over time Infill dwelling activity Over the whole period to June 2010 the level of infill dwelling activity was close to the pro rata infill additional dwelling target, but as for total dwellings, activity has declined since mid Due to the factors involved this is not expected to herald a long-term change in activity levels Approved dwelling supply As at June 2010, Gold Coast had a low level of operational works approvals, but the total stock of uncompleted lots and multiple dwelling approvals appear to provide an adequate supply of dwellings in the short-term, subject to the current feasibility of developing those approvals Planned and emerging dwelling supply According to the council s new Priority Infrastructure Plan projections, the Gold Coast should have enough supply to accommodate the infill and total dwelling targets to 2031, and an adequate number of years planned and combined planned and emerging supply in the interim. Actual development activity, the level of tourist dwelling demand and the adoption of a number of local area plans need to be monitored and reviewed to verify whether the dwelling yield assumptions of the Priority Infrastructure Plan projections are likely to be achieved. Gold Coast is a major contributor to the region's overall infill target (26 per cent) and needs to develop an increasing proportion of multiple dwellings in well-serviced locations. State funded infrastructure which will support this over time includes the Gold Coast Rapid Transit, the Gold Coast University Hospital precinct, various road widening projects, including the provision of bus and transit lanes, and the planned long-term extension of the rail line to Elanora and Coolangatta. Over time, the council expects to amend the planning scheme to increase dwelling yields along the Rapid Transit corridor, which is seen as having the potential to transform living and working styles on the Gold Coast. This is likely to contribute significantly to accommodating the infill dwelling target Industrial development and land supply About 13 per cent of the industrial land consumption across SEQ region during the January 2006 to December 2009 period was in Gold Coast. Much of this occurred in the regionally significant industrial area of Yatala which comprises a large proportion of Gold Coast s available industrial land and is expected to be a major employment location in the long-term. 47
49 Given the large areas of industrial land available in other local government areas in SEQ, and the constraints on significant expansion of the industrial land supply in or near the Gold Coast urban area, in the medium to long-term more industrial land demand will need to be met in those other locations, e.g. in the neighbouring Scenic Rim and Logan. 48

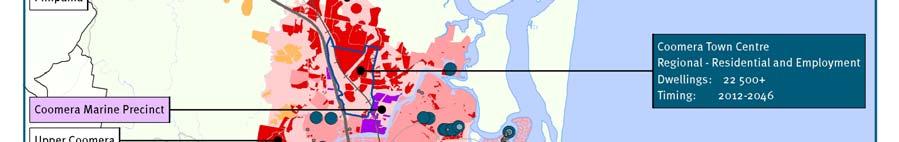
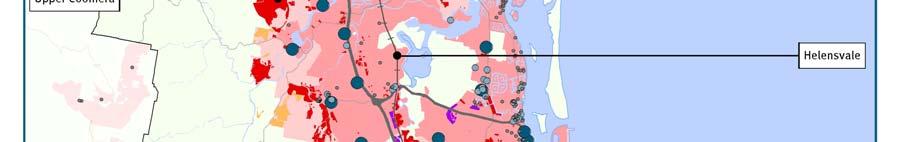
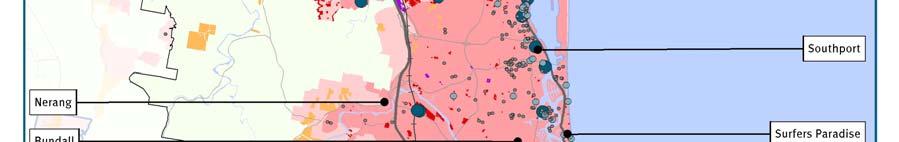
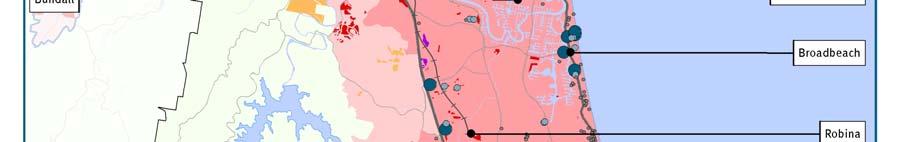

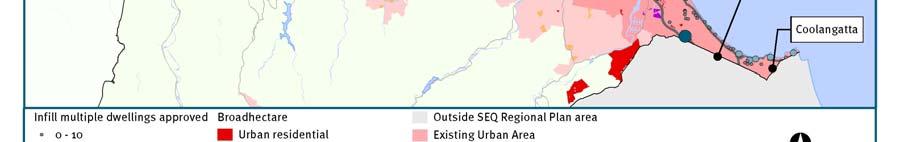
50 6.1.6 Gold Coast integrated land supply 49
51 6.2 Dwelling activity versus SEQ Regional Plan dwelling targets Total dwelling activity and targets Figure 25 and Table 12 show that, for the period from July 2006 to June 2010, Gold Coast was tracking at about 95 per cent of its pro rata total additional dwelling target, based on building approvals for new dwellings. Dwellings Dwelling approvals have declined since about mid-2008 when cumulative approvals exceeded the pro rata target Sep Dec Mar Jun Sep Dec Mar Jun Sep Dec Mar Jun Sep Dec Mar Jun Mulitple dwellings 2006 onwards Pro rata dwelling target SEQRP Dwelling houses 2006 onwards The proportion of multiple dwellings has remained Figure 25 Cumulative dwelling approvals and pro rata total dwelling target relatively constant over the period to June 2010, with a cumulative percentage of around 48 per cent of all new dwelling approvals. The equivalent figure for SEQ was around 35 per cent. Table 12 Total dwelling activity and pro rata SEQ Regional Plan target Cumulative total of all new dwelling approvals (1 July 2006 to 30 June 2010) Pro rata total additional dwelling target (5 457 / year) (5 720 / year) Current activity as a percentage of the pro rata total additional dwelling target 95% Gold Coast is currently tracking just below the pro rata total additional dwelling target (-264 / year) Note: values above are as at 30 June
52 6.2.2 Infill dwelling activity and targets Figure 26 and Table 13 show that, for the period July 2006 to June 2010, Gold Coast was close to its pro rata infill additional dwelling target, based on building approvals for new dwellings. Dwelling approvals have declined since about mid-2008 when cumulative approvals substantially exceeded the pro rata target. Dwellings Sep Dec The proportion of multiple dwellings within the Existing Mulitple dwellings 2006 onwards Pro rata dwelling target SEQRP Dwelling houses 2006 onwards Urban Area has recorded an increase over the period to Figure 26 Cumulative infill dwelling approvals and pro rata infill dwelling target June 2010, with a cumulative percentage of around 63 per cent of all dwelling approvals. In comparison, the equivalent figure for SEQ as a whole is around 47 per cent. Conversely, about 37 per cent of infill dwelling approvals to June 2010 were for dwelling houses. As remnant broadhectare land in the Existing Urban Area is taken up in short to medium-term, this activity is expected to decline further as a proportion of new dwelling approvals Mar Jun Sep Dec Mar Jun Sep Dec Mar Jun Sep Dec Mar Jun Table 13 Infill dwelling activity and pro rata SEQ Regional Plan infill target Cumulative total of new infill dwelling approvals (1 July 2006 to 30 June 2010) Pro rata infill additional dwelling target (3 774 / year) (3 880 / year) Current activity as a percentage of the pro rata infill additional dwelling target 97% Gold Coast is currently tracking just below the pro rata infill additional dwelling target -424 (-106 / year) Current cumulative percentage of infill to total dwellings (target aim 68% overall) 69% Note: values above are as at 30 June
53 6.3 Residential supply Approved dwelling supply Figure 27 shows that the stock of uncompleted lots has declined since , with a slight increase in This has been associated with a decline in both lot approvals and production in recent years, with a slight increase in approvals in The closing stock for Gold Coast as at June 2010 was 8881 lots, which is a 0.8 per cent increase on Lots The increase in lots lapsed was the main reason for the decline in the number of uncompleted lots to Figure 27 also shows that there were 1383 uncompleted operational works approvals as at 30 June 2010, a 2.7 per cent decrease on Table 14 summarises the approved dwelling supply reflected in both the stock of uncompleted lots and multiple dwelling material change of use approvals in the Existing Urban Area. Uncompleted lots - total Lot production Lots lapsed Uncompleted lots - operational works Lot approvals Figure 27 Uncompleted lot and operational works approvals with annual lot approvals, lot production and lots lapsed Table 14 Approved dwelling supply Type of dwelling supply Number of Estimated years of Part of area (as at 30 June 2010) dwellings 1 supply Inside Existing Multiple dwelling material change of use Urban Area development permits and undefined approvals Uncompleted lots operational works Total Uncompleted lots total These components of approved dwelling supply cannot be summed because operational works approvals are a subset of the total uncompleted lots and there are overlaps between uncompleted lots and multiple dwelling material change of use approvals. As the estimated years of supply is higher than the average stock across SEQ, which is close to an historical high in terms of absolute numbers of lots, there would appear to be an adequate overall supply of uncompleted lots in Gold Coast City. The stock of operational works approvals is, however, the lowest in the region, 0.7 years of supply. Gold Coast has the second lowest supply of multiple dwelling approvals in SEQ, but that is still nearly five years supply Planned and emerging dwelling supply Figure 28 reports planned and emerging dwelling supply for both inside the Existing Urban Area and the total area of Gold Coast City. It also estimates the number of years supply those dwellings represent (as at 30 June 2010) and the estimated current shortfall or excess of the combined planned and emerging supply compared to the infill and total dwelling targets. 52
54 Excess dwgs Dwellings Planned dwgs years Planned / emerging dwgs years Planned dwgs years Excess dwgs Planned / emerging dwgs years Current activty dwgs Current activty dwgs Total Infill Emerging supply Planned supply Current Activity 07/06-06/10 Target to 2031 Figure 28 Gold Coast planned and emerging dwelling supply (dwellings rounded to nearest 1 000) The figures suggest there is a substantial excess of supply compared to the targets for both infill and total dwellings, and a large number of years supply compared to the minimum supply benchmarks. The council s new Priority Infrastructure Plan projections, which provided the basis for the planned dwelling supply inside the Existing Urban Area and for Coomera Town Centre, and emerging changes elsewhere outside the Existing Urban Area, included the effect of some advanced draft local area plans that were not yet adopted into the planning scheme. Table 15 identifies the status of those plans. Table 15 Emerging planning changes (as at October 2010) Planning change Central Southport Master Plan Hope Island Local Area Plan Lake Orr and Environs Local Area Plan Varsity Lakes Local Area Plan Status Completed (drafting of revised Southport Local Area Plan to follow) Drafting First state Interest Check Review of submissions after public display The capacity of the Gold Coast to accommodate its infill and total dwelling targets depends partly on: the assumed dwelling yields of the new Priority Infrastructure Plan projections being achieved the level of additional tourist dwelling demand that needs to be accommodated to 2031 (this also needs to be accommodated in the supply reported in Figure 28) the plans in Table 15 being adopted into the planning scheme and any further plans, such as potential additional yields at Worongary, coming to fruition demand for new dwellings along the Gold Coast Rapid Transit corridor. 53
55 The new Priority Infrastructure Plan projections have been accepted by the Department of Local Government and Planning as a basis for local infrastructure planning, but it is expected new Priority Infrastructure Plan projections will be prepared at least once in every five years, and in the interim the projections can be checked against actual development activity. 6.4 Industrial development and land supply Over the four year period from January 2006 to December 2009, Gold Coast experienced development of around 16 hectares annually of new building approvals on industrial land. This is 13 per cent of the industrial land consumption across the SEQ region overall and 23 per cent of that in Brisbane for the same period. Both the land area and number of building approvals on industrial land have fluctuated over this period, as shown in Figure 29. Figure 30 shows that around 62 per cent of all available industrial land is zoned, with the predominant zones being medium and low impact equivalent and waterfront marine. There are small areas of non-industry zones and high impact industry equivalent. The remaining 38 per cent of allocated land is industry investigation or equivalent. Area (ha) Area (ha) Area of industrial approvals Annual ave (last 4 years) Number of approvals Figure 29 New building approvals on industrial land Approvals Table 16 shows the land areas of approved, planned and emerging industrial land supply compared to SEQ as a whole. High Impact High technology Industry Planned Low impact Medium impact Non industry Noxious and hazardous Emerging Waterfront marine Industry Investigation Figure 30 Available industrial land areas by zone Table 16 Industrial land supply Planned and emerging Approved 1 Planned 2 Emerging 3 Total % of SEQ Gold Coast Total SEQ Includes land with material change of use or reconfiguring a lot development permits and vacant industrial zoned lots registered in the last five years. 2. Includes approved supply and industrial zones other than emerging supply, plus preliminary approvals overriding the planning scheme. 3. Includes areas zoned for Industrial Investigation or equivalent plus SEQ Regional Plan Development Areas (employment only) and enterprise opportunity areas As illustrated on the map in Section 6.1, major localities of industrial land supply (planned and emerging) in Gold Coast include Yatala, Coomera Marine Precinct and Steiglitz Marine Precinct. 54
56 6.5 Development Areas Table 17 and 18 identify the planning and infrastructure status, scale and expected timing of the SEQ Regional Plan s Regional and Local Development Areas in Gold Coast. Table 17 Regional Development Areas (as at October 2010) Area Planning and infrastructure status Residential and employment Major regional centre at Coomera Railway Station Mix of residential and employment uses planned Structure Plan commenced 15 October 2010 Coomera Master Plan approval required to permit development in core areas Access to the Town Centre being resolved as part of road network planning Dwellings (dwgs) Industrial area (ha) dwgs ( to 2031) Expected timing Table 18 Local Development Areas (as at October 2010) Area Employment Steiglitz Planning and infrastructure status Proposed marine industry precinct Extensive infrastructure required Dwellings (dwgs) Industrial area (ha) 62 ha Expected timing Medium to long-term 55
57 7.0 Ipswich 7.1 Integrated analysis Total dwelling activity Up to June 2010 the overall level of dwelling activity in Ipswich has been low compared to the pro rata total additional dwelling target because major areas of the broadhectare land supply such as Ripley Valley are yet to commence development. Over time development activity in Ipswich is expected to increase. Dwelling activity up to June 2010 matched the adjusted rate of achieving the target which is proportional to OESR s dwelling projections (2008 edition medium series) Infill dwelling activity The level of infill dwelling activity up to June 2010 was high compared to the infill additional dwelling target primarily because most of the infill dwelling activity was dwelling houses on recently subdivided land inside the Existing Urban Area. Such infill activity will decline over time as remnant broadhectare land in the Existing Urban Area is taken up. The proportion of multiple dwelling activity in the Existing Urban Area is expected to increase over time to accommodate infill dwelling demand Approved dwelling supply As at June 2010, the approved supply of residential lots, including total uncompleted lots and those with operational works approval, and multiple dwellings would appear to provide an adequate supply of dwellings in the short-term, subject to the current feasibility of developing those approvals Planned and emerging dwelling supply Ipswich appears to have a more than adequate planned and combined planned and emerging dwelling supply to both exceed the minimum supply benchmarks and accommodate its total and infill dwelling targets by Actual development activity and the achieved dwelling yields need to be monitored and reviewed over time to verify the dwelling yield assumptions of the Ipswich Population Modeller and the broadhectare study. The actions of the state government, through the ULDA, to build on the extensive planning already undertaken by the council and others and bring forward the development of Ripley Valley can contribute significantly to Ipswich accommodating its total additional dwelling target. Council has advised that the capacity to accommodate the dwelling targets will depend in part on all levels of government and urban water agencies having the capacity and commitment to fund the infrastructure necessary for the development of the major planned and emerging development areas. Major items of state infrastructure that will support the development of the planned and emerging supply include the Ipswich to Ripley and connecting Springfield to Ripley rail lines Industrial development and land supply About eight per cent of the industrial land consumption across SEQ region during the January 2006 to December 2009 period was in Ipswich. 56
58 The bulk of Ipswich s industrial land supply is subject to further land use and infrastructure planning to make it available for development. The Ebenezer Regional Development Area is a major component of the future industrial land supply in Ipswich and the SEQ region overall. Structure planning for this area has commenced under a project managed by the Coordinator General in collaboration with Ipswich City Council. This process could contribute to an increase in planned supply for the City in the short to medium-term. The large area of industry investigation equivalent land in Ipswich may provide the opportunity to meet a range of industrial land needs. 57


59 7.1.6 Ipswich integrated land supply 58
60 7.2 Dwelling activity versus SEQ Regional Plan dwelling targets Total dwelling activity and targets Figure 31 shows that, for the period July 2006 to June 2010, Ipswich was tracking at about half of the pro rata total additional dwelling target, but it was matching the adjusted rate of achieving the target which is proportional to OESR s dwelling projections (2008 edition medium series). Dwellings The shortfall compared to the pro rata target was to be expected, because two of the large broadhectare areas that will accommodate much of Ipswich s expected growth to 2031 and beyond have so far had little or no development, Sep i.e. Ripley Valley (where the initial stages are expected to commence in 2012) and Walloon-Thagoona. There are also large broadhectare areas remaining in the major community of Springfield and nearby Redbank Plains. The long-term trend for development activity in Ipswich has been up and it is expected to pick up further as the broadhectare supply in other parts of the Brisbane metropolitan area is depleted and all of the supplies in Ipswich become available for development. OESR s dwelling projections (2008 edition medium series) reflect this expected take-up and therefore provide a more realistic basis for comparison to the recent rate of dwelling approvals. Table 19 therefore compares the dwelling approvals to 30 June 2010 to the adjusted rate of achieving the total additional dwelling target Dec Mar Jun Sep Dec Mulitple dwellings 2006 onwards Pro rata dwellings target SEQRP Mar Jun Sep Dec Mar Jun Sep Dec Dwelling houses 2006 onwards Adjusted rate of achieving target Figure 31 Cumulative dwelling approvals and pro rata and adjusted rate of achieving the total dwelling target Mar Jun Table 19 Total dwelling activity and adjusted rate of achieving the total dwelling target Cumulative total of all new dwelling approvals (1 July 2006 to 30 June 2010) Total additional dwelling target to June 2010 (based on adjusted rate of achievement) Current activity as a percentage of the adjusted rate of achieving total additional dwelling target to 30 June 2010 Ipswich is currently tracking above the adjusted rate of achieving the total additional dwelling target (2 188 / year) (2 168 / year) 101% 83 (21 / year) Note: values above are as at 30 June
61 7.2.2 Infill dwelling activity and targets In contrast to the total dwelling activity, Figure 32 and Table 20 show that up to June 2010 Ipswich was tracking at more than 200 per cent of its much smaller pro rata infill additional dwelling target, based on building approvals for new dwellings. Dwellings This is occurring primarily because about 84 per cent of infill dwelling approvals between July 2006 and June 2010 were for dwelling houses, which would have been mostly locating on recently subdivided land in the Existing Urban Area. As the remnant broadhectare Mulitple dwellings 2006 onwards Pro rata dwelling target SEQRP Dwelling houses 2006 onwards land within the Existing Urban Area is taken up in the short to medium-term, dwelling house activity is expected to decline Sep Dec The proportion of multiple dwellings within the Existing Urban Area actually decreased during the period to June 2010, ending with a cumulative percentage of around 16 per cent of all dwelling approvals. Over time, this percentage would be expected to increase to accommodate infill dwelling demand Mar Jun Sep Dec Mar Figure 32 Cumulative infill dwelling approvals and pro rata infill dwelling target Jun Sep Dec Mar Jun Sep Dec Mar Jun Table 20 Infill dwelling activity and pro rata SEQ Regional Plan infill target Cumulative total of new infill dwelling approvals (1 July 2006 to 30 June 2010) Pro rata infill additional dwelling target (1 565 / year) (720 / year) Current activity as a percentage of the pro rata infill additional dwelling target 217% Ipswich is currently tracking well above the pro rata infill additional dwelling target (845 / year) Current cumulative percentage of infill to total dwellings (target aim 15% overall) 72% Note: values above are as at 30 June
62 7.3 Residential supply Approved dwelling supply Figure 33 shows that lot production over the last four years has consistently been in line with or lower than lot approvals. That has more than offset the increase in lots lapsed in recent years, increasing the stock of uncompleted lots. The closing stock of uncompleted lots for Ipswich as at June 2010 was 8086 lots, which is a 3.6 per cent increase on The stock of lots in Ipswich has increased since Figure 33 also shows there were 3336 uncompleted operational works approvals as at 30 June 2010, a 43.2 per cent increase on Table 21 summarises the approved dwelling supply reflected in both the stock of uncompleted lots and multiple dwelling material change of use approvals in the Existing Urban Area. Lots Uncompleted lots - total Lot production Lots lapsed Uncompleted lots - operational works Lot approvals Figure 33 Uncompleted lot and operational works approvals with annual lot approvals, lot production and lots lapsed Table 21 Approved dwelling supply Type of dwelling supply Number of Estimated years of Part of area (as at 30 June 2010) dwellings 1 supply Inside Existing Multiple dwelling material change of use Urban Area development permits and undefined approvals Uncompleted lots operational works Total Uncompleted lots total These components of approved dwelling supply cannot be summed because operational works approvals are a subset of the total uncompleted lots and there are overlaps between uncompleted lots and multiple dwelling material change of use approvals. The large estimated years of supply for multiple dwelling material change of use approvals partly reflects the low level of building approvals for such dwellings in recent years, but there appears to be an adequate approved supply based on recent demand, subject to the current feasibility of developing those approvals. In terms of years of supply, Ipswich has the largest stock of operational works approvals of all the large urban councils, so that approved supply would appear more than adequate. The total stock of uncompleted lots is an historically high figure and also above the average years supply across SEQ, so that stock should also be more than adequate, subject to the current feasibility of developing those lots. 61
63 7.3.2 Planned and emerging dwelling supply Figure 34 reports planned and emerging dwelling supply for both inside the Existing Urban Area and the total area of Ipswich. It also estimates the number of years supply those dwellings represent (as at 30 June 2010) and the estimated current shortfall or excess of the combined planned and emerging supply compared to the infill and total dwelling targets Excess dwgs Dwellings Planned / emerging dwgs years Planned dwgs years Excess dwgs Planned dwgs years Planned / emerging dwgs years Current activty dwgs Current activty dwgs Total Infill Emerging supply Planned supply Current Activity 07/06-06/10 Target to 2031 Figure 34 Ipswich planned and emerging dwelling supply (dwellings rounded to nearest 1 000) The figures indicate a significant excess in the Existing Urban Area and a small excess for the total dwelling supply compared to the target, as well as large numbers of years supply compared to the minimum benchmarks of 10 and 15 years, respectively, for the planned and combined planned and emerging supply. Table 22 identifies planning changes in process potentially affecting dwelling yields over time. Table 22 Emerging planning changes (as at October 2010) Planning change Ripley Valley Development Scheme Status Urban Development Area declared October 2010 prior to adoption of Development Scheme in 2011 (existing Structure Plan in Ipswich Planning Scheme to be superseded) The estimated infill supply and emerging supply outside the Existing Urban Area are based partly on the projections of the Ipswich Population Modeller, a projections database underpinning strategic land use and infrastructure planning for Ipswich. The capacity of Ipswich to accommodate its infill and total dwelling targets depends partly on the assumed dwelling yields of the Population Modeller and broadhectare study being shown over time to be realistic. 62
64 7.4 Industrial development and land supply Over the four year period from January 2006 to December 2009, Ipswich experienced development of around 11 hectares annually of new building approvals on industrial land. Both the land area and number of building approvals on industrial land have varied over this period, as shown in Figure 35. Area (ha) Approvals Figure 36 shows that only 25 per cent of all available industrial land is zoned, with the predominant zones being medium and low impact equivalent, and a small area of non-industry zones. Seventy-five per cent of the available industrial land in Ipswich is industrial investigation equivalent, and most of that is located in the Ebenezer Regional Development Area. Table 23 shows the land areas of approved, planned and emerging industrial land supply compared to SEQ as a whole. Area (ha) Area of industrial approvals Annual ave (last 4 years) Number of approvals Figure 35 New building approvals on industrial land High Impact High technology 32 Industry 419 Low impact 486 Medium impact 250 Non industry Noxious and hazardous Waterfront marine Industry Investigation Planned Emerging Figure 36 Available industrial land areas by zone Table 23 Industrial land supply Planned and emerging Approved 1 Planned 2 Emerging 3 Total % of SEQ Ipswich Total SEQ Includes land with material change of use or reconfiguring a lot development permits and vacant industrial zoned lots registered in the last five years. 2. Includes approved supply and industrial zones other than emerging supply, plus preliminary approvals overriding the planning scheme. 3. Includes areas zoned for industrial investigation or equivalent plus SEQ Regional Plan Development Areas (employment only) and enterprise opportunity areas As illustrated on the map in Section 7.1, major areas of available industrial land, planned and emerging, in Ipswich City include Ebenezer, Swanbank Enterprise Park, Wulkuraka, Riverview/Bundamba, Redbank and Amberley Aerospace. In total Ipswich accounts for about one-third of all industrial land supply in SEQ. 63
65 7.5 Development Areas Table 24 identifies the planning and infrastructure status, scale and expected timing of the SEQ Regional Plan s Regional Development Areas in Ipswich City. Table 24 Regional Development Areas (as at October 2010) Area Planning and infrastructure status Residential and employment Urban Development Area declared October 2010 ULDA to plan and administer development under Development Scheme prepared by 2011 Interim Land Use Plan identifies early release Ripley Valley precincts Centenary Highway extension Springfield to Yamanto (completed) Ipswich to Springfield rail line ( ) 1 Employment Dwellings (dwgs) Industrial area (ha) dwgs ( to 2031) Expected timing Ebenezer Proposed to accommodate a range of manufacturing, logistics, heavy, difficult to locate and large footprint industries Structure planning underway in 2010 the Coordinator General is project managing in collaboration with council Cunningham Highway four lanes Ripley Road to Ebenezer ( , subject to Federal funding) 3292 ha (subject to review pursuant to Structure Plan) Indicative delivery timeframe in South East Queensland Infrastructure Plan and Program
66 8.0 Lockyer Valley 8.1 Integrated analysis Total dwelling activity Over the period July 2006 to June 2010, new dwelling approvals in Lockyer Valley were tracking below the pro rata total additional dwelling target Infill dwelling activity Lockyer Valley does not have an infill dwelling target so infill dwelling approvals have not been separately reported Approved dwelling supply As at June 2010, the approved supply of residential lots appeared to provide an adequate supply of land for dwellings in the short-term, subject to the current feasibility of developing those approved lots Planned and emerging dwelling supply The broadhectare study data indicates there are adequate years supply of planned and combined planned and emerging dwelling supply, compared to the minimum supply benchmarks, but there is a proportionally small shortfall compared to the total dwelling target to Council s own Residential Needs Report indicates there is no shortfall. The Department of Local Government and Planning and the council need to work collaboratively to resolve appropriate estimates of dwelling yields and inform what further planning actions may be required to accommodate the total dwelling target. State infrastructure that may impact on future residential development in Lockyer Valley includes the South Queensland Correctional Precinct Industrial development and land supply There were no new building approvals on industrial land recorded for the period in Lockyer Valley. With extension of infrastructure and resolution of constraints the Gatton North Local Development Area can fulfil its role as the major area of available industrial land in Lockyer Valley. 65


67 8.1.6 Lockyer Valley integrated land supply 66
68 8.2 Dwelling activity versus SEQ Regional Plan dwelling targets Total dwelling activity and targets Figure 37 and Table 25 show that total new dwelling approvals have been tracking below the pro rata target for total additional dwellings. There has been a decline in activity since about mid Dwellings The bulk of development in Lockyer Valley is dwelling houses on subdivided broadhectare land Sep Dec Mar Jun Sep Dec Mar Jun Sep Dec Mar Jun Sep Dec Mar Jun Mulitple dwellings 2006 onwards Pro rata dwelling target SEQRP Dwelling houses 2006 onwards Figure 37 Cumulative dwelling approvals and pro rata total dwelling target Table 25 Total dwelling activity and pro rata SEQ Regional Plan target Cumulative total of all new dwelling approvals (1 July 2006 to 30 June 2010) Pro rata total additional dwelling target (346 / year) (460 / year) Current activity as a percentage of the pro rata total additional dwelling target 75% Lockyer Valley is currently tracking below the pro rata total additional dwelling target -458 (-115 / year) Note: values above are as at 30 June Infill dwelling activity and targets The SEQ Regional Plan does not identify an infill dwelling target for Lockyer Valley. 67
69 8.3 Residential supply Approved dwelling supply Figure 38 shows that the stock of uncompleted lots has increased since This has been associated with a consistently higher level of lot approvals compared to lot production, and a recent increase in lots lapsed. The closing stock for Lockyer Valley as at June 2010 was 1921 lots, which is a 6.8 per cent increase on Figure 38 also shows there were 424 uncompleted operational works approvals as at 30 June 2010, a 11.9 per cent decrease on Table 26 summarises the approved dwelling supply reflected in the stock of uncompleted lots. Table 26 Approved dwelling supply Lots Uncompleted lots - total Lot production Lots lapsed Uncompleted lots - operational works Lot approvals Figure 38 Uncompleted lots and operational works approvals with annual lot approvals, lot production and lots lapsed Part of area Type of dwelling supply Number of Estimated years of (as at 30 June 2010) dwellings 1 supply Total Uncompleted lots operational works Uncompleted lots total These components of approved dwelling supply cannot be summed because operational works approvals are a subset of the total uncompleted lots. Given that the number of years supply of both total lots and those with operational works approval are above the SEQ region averages, and the total lots approved is at an historical high, the approved supply would appear to provide an adequate short-term supply of lots for dwelling houses. This is subject to the current feasibility of developing those lots Planned and emerging dwelling supply Figure 39 reports planned and emerging dwelling supply for the total area of Lockyer Valley. It also estimates the number of years supply those dwellings represent (as at 30 June 2010) and the estimated current shortfall or excess of the combined planned and emerging supply compared to the total dwelling target. 68
70 Shortfall dwgs Dwellings Planned dwgs years Planned / emerging dwgs years No infill target Current activty dwgs Total Infill Emerging supply Planned supply Current Activity 07/06-06/10 Target to 2031 Figure 39 Lockyer Valley planned and emerging dwelling supply (dwellings rounded to nearest 100) Figure 39 shows the estimated years of planned and combined planned and emerging supply exceed the minimum benchmarks of 10 and 15 years, respectively. The combined planned and emerging supply indicates a proportionally small shortfall compared to the total dwelling target to The council has prepared a Residential Needs Report to inform its new planning scheme. That Report indicates there is adequate planned dwelling supply to accommodate the total target. For consistency with other areas, the dwelling yield estimates of the broadhectare study, rather than those of the Residential Needs Report, have been used in Figure Industrial development and land supply Over the four-year period from January 2006 to December 2009, Lockyer Valley did not register a new building approval over industrial land Around 20 per cent of all available industrial land is zoned, with the predominant zone being medium impact equivalent. The remaining 80 per cent of allocated land is industry investigation equivalent located in the Gatton North Development Area. Table 27 shows the land areas of approved, planned and emerging industrial land supply compared to SEQ as a whole. Area (ha) High Impact High technology 6 Industry Planned 38 Low impact 117 Medium impact Non industry Noxious and hazardous Emerging Waterfront marine Figure 40 Available industrial land areas by zone Industry Investigation 69
71 Table 27 Industrial land supply Planned and emerging Approved 1 Planned 2 Emerging 3 Total % of SEQ Lockyer Valley Total SEQ Includes land with material change of use or reconfiguring a lot development permits and vacant industrial zoned lots registered in the last five years. 2. Includes approved supply and industrial zones other than emerging supply, plus preliminary approvals overriding the planning scheme. 3. Includes areas zoned for industrial investigation or equivalent plus SEQ Regional Plan Development Areas (employment only) and enterprise opportunity areas As illustrated on the map in Section 8.1, the major area of available industrial land in Lockyer Valley is the Gatton North Development Area. Council has advised there are constraints to development not reflected in the reported industrial land supply, including at Gatton North, which would have the effect of reducing the available industrial land. 8.5 Development Areas Table 28 identifies the planning and infrastructure status, scale and expected timing of the SEQ Regional Plan s Local Development Areas in Lockyer Valley. Table 28 Local Development Areas (as at October 2010) Dwellings (dwgs) Industrial area (ha) 630 ha (subject to local planning and constraints) 500 dwgs 12 ha Expected timing Area Planning and infrastructure status Employment Expected to operate as an enterprise precinct for industrial purposes Gatton North Access to Warrego Highway and Brisbane- Toowoomba rail line close to Gatton Requires major extensions of existing infrastructure Residential and employment Plain land Service centre to surrounding rural living areas Mediumterm Unknown 70
72 9.0 Logan 9.1 Integrated analysis Total dwelling activity The overall level of dwelling activity in Logan has been low compared to the pro rata total additional dwelling target because large areas of the broadhectare land supply are either yet to commence development or have scope for significantly increased rates of development in the future, e.g. Greater Flagstone, Park Ridge and Yarrabilba. Dwelling activity up to June 2010 is closer to the adjusted rate of achieving the target which is proportional to OESR s dwelling projections (2008 edition medium series) Infill dwelling activity The level of infill dwelling activity has tracked below the pro rata infill additional dwelling target since the global financial crisis in Also, most of the infill dwelling activity in the short-term has been dwelling houses on recently subdivided land in the Existing Urban Area. This type of dwelling activity is expected to decline in the short to medium-term as remnant broadhectare land in the Existing Urban Area is taken up, so the level of multiple dwelling activity would be expected to increase over time to accommodate infill dwelling demand Approved dwelling supply As at June 2010, the supply of lots with operational works approval and approved multiple dwellings appeared to provide an adequate supply of dwellings in the short-term, subject to the current feasibility of developing those approvals. The total approved supply of residential lots was at a relatively low level compared to other local government areas. This supply should increase when the large broadhectare areas of Greater Flagstone, Yarrabilba and Park Ridge commence or increase their rate of development Planned and emerging dwelling supply Subject to the near future implementation of ULDA development schemes for the satellite communities of Greater Flagstone and Yarrabilba, and council s planning scheme changes for Park Ridge, Logan appears to have an adequate planned and emerging supply to It also has a large supply beyond 2031 primarily in Greater Flagstone and Yarrabilba. Further land use and infrastructure planning changes may be necessary to enable Logan to achieve its infill dwelling target by Industrial development and land supply Industrial building activity has fluctuated widely in Logan over the period. The new communities and broadhectare development areas at Greater Flagstone, Park Ridge and Yarrabilba are expected to develop an industrial land component to provide local employment opportunities and meet the industrial land needs in those areas. 71

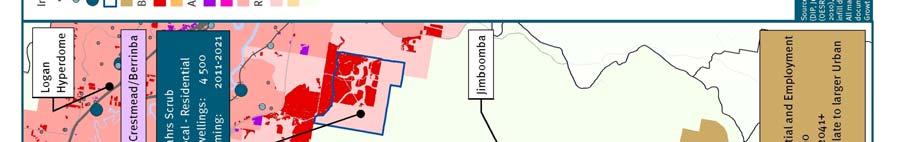
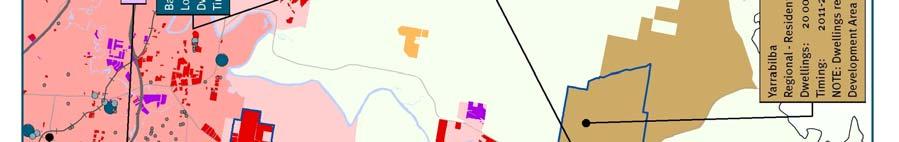

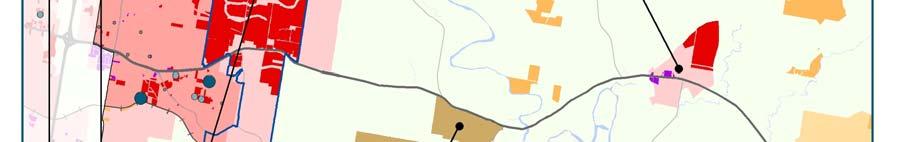

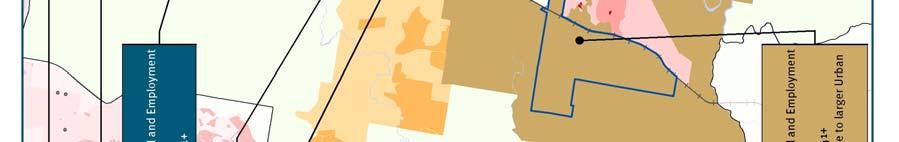
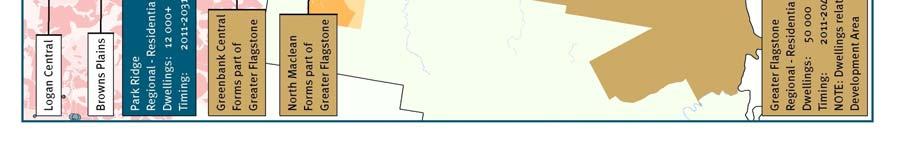
73 9.1.6 Logan integrated land supply 72
74 9.2 Dwelling activity versus SEQ Regional Plan dwelling targets Total dwelling activity and targets Figure 41 shows that, for the period July 2006 to June 2010, Logan was tracking at about half of its pro rata total additional dwelling target, but about two-thirds of the adjusted rate of achieving the target which is proportional to OESR s dwelling projections (2008 edition medium series). Dwellings This shortfall compared to the pro rata target was expected. Total dwelling activity should increase towards the pro rata target in the future when development commences or increases in the large scale broadhectare areas of Greater Flagstone, Yarrabilba and Park Ridge. OESR s dwelling projections (2008 edition medium series) are closer to reflecting this expected take-up, than the pro rata target, and provide a more realistic basis for comparison to the recent rate of dwelling approvals. Table 29 therefore compares the dwelling approvals to 30 June 2010 to the adjusted rate of achieving the target. Over the whole period to June 2010, around 18 per cent of all dwelling approvals were for multiple dwellings. In comparison, the equivalent figure for SEQ was around 35 per cent Sep Dec Mar Jun Sep Dec Mulitple dwellings 2006 onwards Pro rata dwellings target SEQRP Mar Jun Sep Dec Mar Jun Sep Dec Dwelling houses 2006 onwards Adjusted rate of achieving target Figure 41 Cumulative dwelling approvals and pro rata and adjusted rate of achieving the total dwelling target Mar Jun Table 29 Total dwelling activity and adjusted rate of achieving the total dwelling target Cumulative total of all new dwelling approvals (1 July 2006 to 30 June 2010) Total dwelling target to June 2010 (based on adjusted rate of achievement) (1 385 / year) (2 167 / year) Current activity as a percentage of the adjusted total dwelling target to 30 June % Logan is currently tracking below the adjusted rate of achieving the total dwelling target (-782 / year) Note: values above are as at 30 June
75 9.2.2 Infill dwelling activity and targets Figure 42 shows that new infill dwelling approvals have dropped below the pro rata infill additional dwelling target since mid There have been only limited multiple dwelling approvals in Logan since the global financial crisis in Table 30 shows that, for the whole period July 2006 to June 2010, Logan was tracking at about 77 per cent of the pro rata infill additional dwelling target, based on approvals for new dwellings. Dwellings Sep Dec Mar Jun Sep Dec Mulitple dwellings 2006 onwards Pro rata dwelling target SEQRP Mar Jun Sep Dec Mar Jun Sep Dec Mar Dwelling houses 2006 onwards Jun Over the whole period to June Figure 42 Cumulative infill dwelling approvals and pro rata infill dwelling target 2010, around 26 per cent of all new dwelling approvals in the Existing Urban Area were for multiple dwellings. Conversely, about 74 per cent of new dwelling approvals in the Existing Urban Area in Logan were for dwelling houses, which would mostly have been locating on recently subdivided land. As remnant broadhectare land within the Existing Urban Area is taken up in the short to medium-term, dwelling house activity is expected to decline. Over time the proportion of multiple dwellings would be expected to increase to accommodate infill dwelling demand. Table 30 Infill dwelling activity and pro rata SEQ Regional Plan infill target Cumulative total of new infill dwelling approvals (1 July 2006 to 30 June 2010) Pro rata infill additional dwelling target (857 / year) (1 120 / year) Current activity as a percentage of the pro rata infill additional dwelling target 77% Logan is currently tracking below the pro rata infill additional dwelling target (-263 / year) Current cumulative percentage of infill to total dwellings (target aim 40% overall) 62% Note: values above are as at 30 June
76 9.3 Residential supply Approved dwelling supply Figure 43 shows that lot production over the last four years has consistently been lower than lot approvals. The increase in lots lapsed was the main reason for the decline in the stock of uncompleted lots in The closing stock for Logan as at June 2010 was 4469 lots, which is a 6.1 per cent increase on Figure 43 also shows there were 1693 uncompleted operational works approvals as at 30 June 2010, a 9.9 per cent decrease on Table 31 summarises the approved dwelling supply reflected in both the stock of uncompleted lots and multiple dwelling material change of use approvals in the Existing Urban Area. Lots Uncompleted lots - total Lot production Lots lapsed Uncompleted lots - operational works Lot approvals Figure 43 Uncompleted lots and operational works approvals with annual lot approvals, lot production and lots lapsed Table 31 Approved dwelling supply Part of area Inside Existing Urban Area (infill) Type of dwelling supply (as at 30 June 2010) Multiple dwelling material change of use development permits and undefined approvals Number of dwellings 1 Estimated years of supply Uncompleted lots operational works Total Uncompleted lots total These components of approved dwelling supply cannot be summed because operational works approvals are a subset of the total uncompleted lots and there are overlaps between uncompleted lots and multiple dwelling material change of use approvals. The large estimated years of supply for multiple dwelling material change of use approvals partly reflects the relatively low level of building approvals for such dwellings in recent years (as average annual other dwelling approvals over the last four years are used to estimate years supply). However, there appears to be an adequate approved supply based on recent demand, subject to the current feasibility of developing those approvals. The stock of operational works approvals is above the SEQ region average, in terms of years supply, and close to the high figure for The supply would therefore appear adequate. The stock of total uncompleted lots is one of the lowest in SEQ, below the regional average of 4.0 years, but the absolute number of approvals as at June 2010 is the highest shown in Figure 43. An increase in this supply may depend on development commencing or increasing in the large broadhectare areas of Greater Flagstone, Park Ridge and Yarrabilba Planned and emerging dwelling supply Figure 44 reports planned and emerging dwelling supply for both inside the Existing Urban Area and the total area of Logan City. It also estimates the number of years supply those dwellings represent (as at 30 June 2010) and the estimated current shortfall or excess of the combined planned and emerging supply compared to the infill and total dwelling targets. 75
77 Excess dwgs Dwellings Planned / emerging dwgs years Shortfall dwgs Planned dwgs 8-9 years Planned dwgs years Planned / emerging dwgs years Current activty dwgs Current activty dwgs Total Infill Emerging supply Planned supply Current Activity 07/06-06/10 Target to 2031 Figure 44 Logan planned and emerging dwelling supply Figure 44 shows a shortfall of dwelling supply compared to the infill dwelling target, but a small excess compared to the total target. The estimated dwelling yields outside the Existing Urban Area take into account the ULDA s best current estimates of the timing of the dwelling yields from the Urban Development Areas of Greater Flagstone and Yarrabilba. The current total planned supply is just below the minimum supply benchmark of 10 years, but there is a large emerging supply expected to become planned supply in the next year, including the Park Ridge Scheme Amendment Area and the Greater Flagstone and Yarrabilba Development Schemes. The latter are also expected to have a yield of about dwellings beyond 2031, which is not part of the reported emerging supply. Table 32 identifies the planning changes currently in process for Logan that may increase dwelling yields. Table 32 Emerging planning changes (as at October 2010) Planning change Status Bahrs Scrub structure planning In preparation Beenleigh master plan In preparation consultation late 2010 Browns Plains master plan Initial scoping Greater Flagstone Development Scheme In preparation Greater Springwood master plan Endorsed by council for incorporation in new planning scheme Infill areas In preparation Jimboomba Local Plan Endorsed by council for incorporation in new planning scheme Logan Central master plan In preparation consultation early
78 Planning change Logan Village Local Plan Meadowbrook master plan Park Ridge Scheme Amendment Area Yarrabilba Development Scheme Status Endorsed by council for incorporation in new planning scheme In preparation With Department of Local Government and Planning for second state interest review In preparation Most of the emerging planning changes in Table 32 are already reflected in the version of the Logan Development Projections Model provided by council and used as the basis for estimating the planned and combined planned and emerging infill dwelling yields in Figure 44. The capacity of Logan to achieve its infill dwelling target may depend on further land use planning and infrastructure changes to increase dwelling yields. 9.4 Industrial development and land supply Over the four year period from January 2006 to December 2009, Logan experienced an average of around 11 hectares annually of new building approvals on industrial land. Areas and numbers of building approvals on industrial land fluctuated over this period, as shown in Figure 45. In 2009, there was an 88 per cent decrease in building approval areas from the rate of approvals in All available industrial land in Logan is zoned, with the predominant zones being high technology and medium impact equivalent. Table 33 shows the land areas of approved, planned and emerging industrial land supply compared to SEQ as a whole. The Park Ridge Scheme Amendment identifies and the development schemes for Greater Flagstone and Yarrabilba are expected to identify significant areas for industrial development, which will increase the planned industrial land supply in Logan over time. Due to the timing of preparation relative to the industrial land stocktake, these areas are not currently captured as emerging supply. Area (ha) Area (ha) Area of industrial approvals Annual ave (last 4 years) Number of approvals 10 8 Figure 45 New building approvals on industrial land High Impact 141 High technology Industry Planned 72 Low impact 121 Medium impact 16 Non industry Noxious and hazardous Emerging Waterfront marine Industry Investigation Figure 46 Available industrial land areas by zone Approvals 77
79 Table 33 Industrial land supply Planned and emerging Approved 1 Planned 2 Emerging 3 Total % of SEQ Logan Total SEQ Includes land with material change of use or reconfiguring a lot development permits and vacant industrial zoned lots registered in the last five years. 2. Includes approved supply and industrial zones other than emerging supply, plus preliminary approvals overriding the planning scheme. 3. Includes areas zoned for industrial investigation or equivalent plus SEQ Regional Plan Development Areas (employment only) and enterprise opportunity areas. As illustrated on the map in Section 9.1, the major area of available industrial land in Logan currently is Berrinba/Crestmead. 9.5 Development Areas Tables 34 and 35 identify the planning and infrastructure status, scale and expected timing of the SEQ Regional Plan s Regional and Local Development Areas in Logan City. Table 34 Regional Development Areas (as at October 2010) Area Planning and infrastructure status Residential and employment Significant component of employment uses as well as residential Scheme amendment with Department of Local Park Ridge Government and Planning for second state interest review Fragmented land ownership means resolution of funding required for local infrastructure Greater Flagstone Urban Development Area Flagstone declared October 2010 (now part of ULDA to plan and administer development through the Greater Development Scheme expected in 2011 Flagstone Initial early release development in 2011 Urban In long-term, proposed to be serviced by new Development passenger rail line in interstate freight rail corridor Area) (Salisbury-Flagstone) Yarrabilba North (now part of Yarrabilba Urban Development Area) Yarrabilba Urban Development Area declared October 2010 ULDA to plan and administer development through Development Scheme expected in 2011 Initial early release development in 2011 Upgrading of road access required to support significant development Dwellings (dwgs) Industrial area (ha) Expected timing dwgs dwgs ( to 2031) dwgs ( to 2031)
80 Table 35 Local Development Areas (as at October 2010) Area Planning and infrastructure status Residential and employment Greenbank Central Incorporated within Greater Flagstone Urban Development Area Residential Predominantly residential with supporting Bahrs Scrub community uses Draft structure plan in preparation for endorsement by council in 2011 Dwellings (dwgs) Industrial area (ha) NA Expected timing NA 4500 dwgs
81 10.0 Moreton Bay 10.1 Integrated analysis Total dwelling activity Dwelling activity in Moreton Bay was tracking ahead of the pro rata total additional dwelling target up to June Dwelling activity levels have been maintained following the global financial crisis Infill dwelling activity Up to June 2010 infill dwelling activity was well ahead of the pro rata infill additional dwelling target. Dwelling house activity in the Existing Urban Area is expected to decline in the short to medium-term as remnant broadhectare land is taken up. Multiple dwelling activity would be expected to continue to increase over time to accommodate infill dwelling demand Approved dwelling supply As at June 2010, the approved supply of residential lots, including total uncompleted lots and those with operational works approval, and multiple dwellings would appear to provide an adequate supply of dwellings in the short-term, subject to the current feasibility of developing those approvals Planned and emerging dwelling supply There is currently an adequate number of years supply of planned and combined planned and emerging dwelling supply for both infill and total dwellings, based on the minimum supply benchmarks. The combined planned and emerging supply falls short of both the infill and total dwelling targets to 2031, but as envisaged at the time of determining the dwelling targets for the SEQ Regional Plan, the council is progressing a number of planning changes that are proposed to increase dwelling yields. The yields of those emerging planning changes need to be determined to inform whether or not further changes will be required to achieve the targets. Another change considered by the SEQ Regional Plan included further urban density redevelopment of existing large lot rural residential areas in the Urban Footprint. The proposed Moreton Bay rail line between Petrie and Kippa Ring will support the achievement of the infill dwelling target Industrial development and land supply Over the four years to December 2009, industrial building activity in Moreton Bay peaked in 2008 before dropping significantly in Major areas of available industrial land include Elimbah East, Northeast Business Park, Brendale, Burpengary Enterprise Area and Narangba Business Park. 80

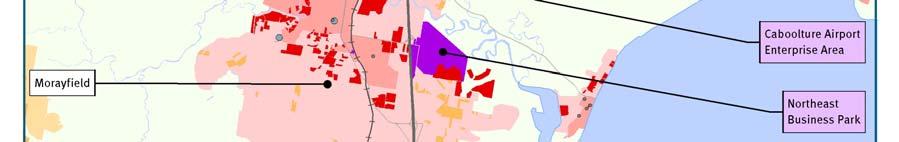

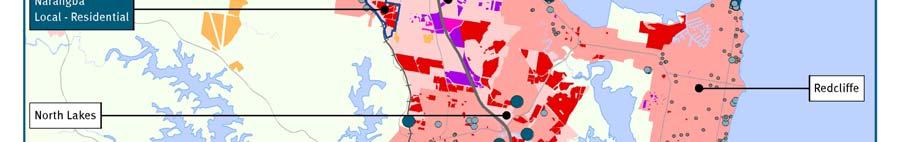
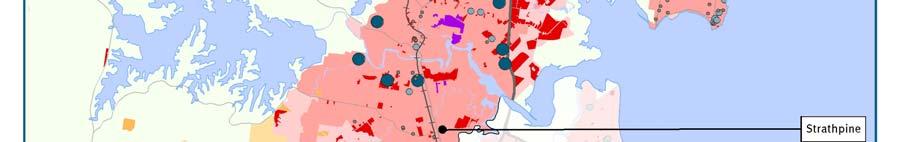

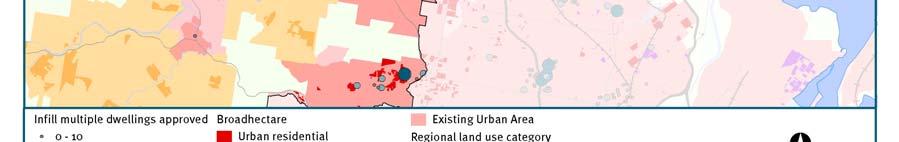
82 Moreton Bay integrated land supply 81
83 10.2 Dwelling activity versus SEQ Regional Plan dwelling targets Total dwelling activity and targets Figure 47 and Table 36 show that, for the period July 2006 to June 2010, Moreton Bay was tracking above the pro rata total additional dwelling target, based on building approvals for new dwellings. Dwellings Moreton Bay has significant active broadhectare developments, including the major master planned community of North Lakes, that have maintained dwelling activity in the aftermath of the global financial crisis Sep Dec Over the whole period to June 2010, around 24 per cent of all dwelling approvals were for multiple dwellings. In comparison, the equivalent figure for SEQ was around 35 per cent Mar Jun Sep Dec Mar Mulitple dwellings 2006 onwards Dwelling houses 2006 onwards Pro rata dwelling target SEQRP Figure 47 Cumulative dwelling approvals and pro rata total dwelling target Jun Sep Dec Mar Jun Sep Dec Mar Jun Table 36 Total dwelling activity and pro rata SEQ Regional Plan target Cumulative total of all new dwelling approvals (1 July 2006 to 30 June 2010) Pro rata total additional dwelling target (4 130 / year) (3 360 / year) Current activity as a percentage of the pro rata total additional dwelling target 123% Moreton Bay is currently tracking ahead of the pro rata total additional dwelling target (770 / year) Note: values above are as at 30 June
84 Infill dwelling activity and targets Figure 48 and Table 37 show that up to June 2010 Moreton Bay was tracking at around 172 per cent of its pro rata infill additional dwelling target, based on building approvals for new dwellings. The proportion of multiple dwellings within the Existing Urban Area has recorded an increase over the period to June 2010, with a cumulative percentage of around 36 per cent of all new dwelling approvals. This represents about 62 per cent of the pro rata infill target. Dwellings Sep Dec Mar Jun Sep Dec Mar Jun Sep Dec Mar Jun Sep Dec Mar Jun Mulitple dwellings 2006 onwards Dwelling houses 2006 onwards Pro rata dwelling target SEQRP Figure 48 Cumulative infill dwelling approvals and pro rata infill dwelling target Conversely, around 64 per cent of the infill dwelling activity during the July 2006 to June 2010 period was for dwelling houses, which would mostly have been located on recently subdivided land in the Existing Urban Area. As the remnant broadhectare land in the Existing Urban Area is taken up in the short to medium-term, this type of dwelling activity will decline. With the high and increasing level of multiple dwelling activity, compared to the pro rata target, Moreton Bay would appear well placed to accommodate a higher proportion of infill dwelling demand in multiple dwellings. Table 37 Infill dwelling activity and pro rata SEQ Regional Plan infill target Cumulative total of new infill dwelling approvals (1 July 2006 to 30 June 2010) Pro rata infill additional dwelling target (2 412 / year) (1 400 / year) Current activity as a percentage of pro rata infill additional dwelling target 172% Moreton Bay is currently tracking ahead of the pro rata infill additional dwelling target (1 012 / year) Current cumulative percentage of infill to total dwellings (target aim 42% overall) 58% Note: values above are as at 30 June
85 10.3 Residential supply Approved dwelling supply Figure 49 shows that lot production over the last four years has consistently been in line with or lower than lot approvals, contributing to an increase in the stock of lots up to The closing stock for Moreton Bay as at June 2010 was 9144 lots, a slight decline on , due mainly to the recent increase in lots lapsed. Figure 49 also shows there were 3683 uncompleted operational works approvals as at 30 June 2010, a 4.4 per cent increase on Table 38 summarises the approved dwelling supply reflected in both the stock of uncompleted lots and multiple dwelling material change of use approvals in the Existing Urban Area. Lots Uncompleted lots - total Lot production Lots lapsed Uncompleted lots - operational works Lot approvals Figure 49 Uncompleted lot and operational works approvals with annual lot approvals, lot production and lots lapsed Table 38 Approved dwelling supply Part of area Inside Existing Urban Area (infill) Type of dwelling supply (as at 30 June 2010) Multiple dwelling material chance of use development permits and undefined approvals Number of dwellings 1 Estimated years of supply Uncompleted lots operational works Total Uncompleted lots total These components of approved dwelling supply cannot be summed because operational works approvals are a subset of the total uncompleted lots and there are overlaps between uncompleted lots and multiple dwelling material change of use approvals. Moreton Bay would appear to have an adequate supply of multiple dwelling approvals, subject to the current feasibility of developing those approvals. Although the estimated years of supply of uncompleted lots is the second lowest in SEQ, the stock of lots has increased since and Moreton Bay has maintained its dwelling house activity, following the global financial crisis, better than other local government areas, so the supply would appear adequate. The stock of operational works approvals has also been increasing since and the number of years supply is equal to the SEQ region average, so the very short-term supply of lots for production would appear adequate Planned and emerging dwelling supply Figure 50 shows planned and emerging dwelling supply for both inside the Existing Urban Area and the total area of Moreton Bay. It also estimates the number of years supply those dwellings represent (as at 30 June 2010) and the estimated current shortfall or excess of the combined planned and emerging supply compared to the infill and total dwelling targets. 84
86 Shortfall dwgs Dwellings Planned dwgs years Planned / emerging dwgs years Shortfall dwgs Planned dwgs years Planned / emerging dwgs years Current activty dwgs Current activty dwgs Total Infill Emerging supply Planned supply Current Activity 07/06-06/10 Target to 2031 Figure 50 Moreton Bay planned and emerging dwelling supply (dwellings round to nearest 1000) Using the council s draft Priority Infrastructure Plan planning assumptions, Figure 50 shows that the planned and combined planned and emerging dwelling supply fall just below the infill dwelling target. This currently provides an adequate number of years supply, based on the minimum supply benchmarks of 10 and 15 years, respectively. Figure 50 also shows there is about a 7 per cent shortfall in the combined planned and emerging dwelling supply compared to the total dwelling target, but there is currently an adequate number of years of planned and combined planned and emerging supply. The council is progressing planning changes, as listed in Table 39, that are proposed to increase total and infill dwelling yields. Also, as the draft Priority Infrastructure Plan planning assumptions are only to 2026, additional yields may be achievable by 2031 from currently planned areas. The scope of any such additional yields needs to be determined to assess whether further planning changes may be required to accommodate the dwelling targets. Such planning changes might include consideration of further urban density redevelopment of existing large lot rural residential areas in the Urban Footprint, for example the Morayfield-Burpengary Local Planning Area Investigation. Table 39 Emerging planning changes (as at October 2010) Planning change Caboolture/Morayfield Principal Regional Activity Centre Master Plan Narangba East Local Area Plan Strathpine Major Regional Activity Centre Master Plan Draft Draft Draft Status 85
87 10.4 Industrial development and land supply Over the four year period from January 2006 to December 2009, Moreton Bay experienced new building approvals on industrial land of around eight hectares annually. Both the land area and number of building approvals on industrial land has fluctuated over this period, as shown in Figure 51. In 2009, there was an 80 per cent decrease in building approval areas from Area (ha) Approvals Figure 52 shows that around 61 per cent of all available industrial land is zoned, with the predominant zone being medium impact equivalent. The remaining 39 per cent is identified as industry investigation equivalent. Area of industrial approvals Number of approvals Annual ave (last 4 years) Figure 51 New building approvals on industrial land Table 40 shows the land areas of approved, planned and emerging industrial land supply compared to SEQ as a whole High Impact High technology Industry Low impact Medium impact Non industry Noxious and hazardous Waterfront marine 63 Area (ha) Industry Investigation Planned Emerging Figure 52 Available industrial land areas by zone Table 40 Industrial land supply Planned and emerging Approved 1 Planned 2 Emerging 3 Total % of SEQ Moreton Bay Total SEQ Includes land with material change of use or reconfiguring a lot development permits and vacant industrial zoned lots registered in the last five years. 2. Includes approved supply and industrial zones other than emerging supply, plus preliminary approvals overriding the planning scheme. 3. Includes areas zoned for industrial investigation or equivalent plus SEQ Regional Plan Development Areas (employment only) and enterprise opportunity areas. As illustrated on the map in Section 10.1, the major areas of available industrial land include Elimbah East, Northeast Business Park, Brendale, Burpengary Enterprise Area and Narangba Business Park. 86
88 10.5 Development Areas Tables 41 and 42 identify the planning and infrastructure status, scale and expected timing of the SEQ Regional Plan s Regional and Local Development Areas in Moreton Bay. Table 41 Regional Development Areas (as at October 2010) Area Planning and infrastructure status Dwellings (dwgs) Industrial area (ha) Expected timing Employment Elimbah East Local/structure planning to be undertaken 404 ha Unknown Table 42 Local Development Areas (as at October 2010) Area Planning and infrastructure status Dwellings (dwgs) Industrial area (ha) Expected timing Residential Narangba Currently undergoing local area planning Unknown Unknown 87
89 11.0 Redland 11.1 Integrated analysis Total dwelling activity Up to June 2010, Redland was tracking ahead of its pro rata total dwelling target, based on building approvals for new dwellings Infill dwelling activity Redland was also matching its pro rata infill dwelling target up to June As dwelling house activity on remnant broadhectare land in the Existing Urban Area is expected to decline in the short to medium-term, multiple dwelling activity would be expected to increase over time to accommodate expected infill dwelling demand Approved dwelling supply As at June 2010, the approved supply of residential lots, including the total uncompleted lots and those with operational works approval, and multiple dwellings would appear to provide an adequate supply of dwellings in the short-term, subject to the current feasibility of developing those approved lots and multiple dwellings Planned and emerging dwelling supply The planned and combined planned and emerging supply of dwellings both inside the Existing Urban Area and overall exceed the minimum benchmarks in terms of years of supply. This will give the council time to address the current shortfall of infill dwellings compared to the target to Provision of improvements to the public transport system would support the dwelling supply needed to accommodate the infill dwelling target. The combined planned and emerging supply is currently estimated to slightly exceed the total dwelling target. The impact of the SEQ Koala Conservation State Planning Policy and associated State Planning Regulatory Provisions on dwelling yields needs to be monitored Industrial development and land supply Over the four years to December 2009, Redland had a low level of building approvals on industrial land and a small area of available land. There is limited opportunity to expand the industrial land supply in Redland. 88

90 Redland integrated land supply 89
91 11.2 Dwelling activity versus SEQ Regional Plan dwelling targets Total dwelling activity and targets Figure 53 and Table 43 show that, for the July 2006 to June 2010 period, Redland was tracking ahead of its pro rata total additional dwelling target, based on building approvals for new dwellings. Dwellings The proportion of multiple dwellings has remained consistent over the period to June 2010, with a cumulative percentage of around 28 per cent of all dwelling approvals. In comparison, the equivalent figure for SEQ was around 35 per cent Sep Dec Mar Jun Sep Dec Mar Jun Sep Dec Mar Jun Sep Dec Mar Mulitple dwellings 2006 onwards Dwelling houses 2006 onwards Pro rata dwelling target SEQRP Figure 53 Cumulative dwelling approvals and pro rata total dwelling target Jun Table 43 Total dwelling activity and pro rata SEQ Regional Plan target Cumulative total of all new dwelling approvals (1 July 2006 to 30 June 2010) Pro rata total dwelling target (985 / year) (840 / year) Current activity as a percentage of the pro rata total additional dwelling target 117% Redland is currently tracking ahead of the pro rata total additional dwelling target 579 (145 / year) Note: values above are as at 30 June
92 Infill dwelling activity and targets Figure 54 and Table 44 show that, up to June 2010, new dwelling approvals in the Existing Urban Area consistently matched or exceeded the pro rata infill additional dwelling target. The proportion of multiple dwellings within the Existing Urban Area has remained consistent over the period, with a cumulative percentage of around 30 per cent of all dwelling approvals, representing about 37 per cent of the pro rata infill target. Dwellings Sep Dec Mar Jun Sep Dec Mar Jun Sep Dec Mar Jun Sep Dec Mar Jun Mulitple dwellings 2006 onwards Dwelling houses 2006 onwards Pro rata dwelling target SEQRP Figure 54 Cumulative infill dwelling approvals and pro rata infill dwelling target Conversely, about 70 per cent of the infill dwelling activity up to June 2010 was for dwelling houses, most of which would have been located on recently subdivided land in the Existing Urban Area. As remnant broadhectare land in the Existing Urban Area is used up in the short to medium-term, this type of dwelling activity will decline. Multiple dwelling activity levels would be expected to increase over time to accommodate infill dwelling demand. Table 44 Infill dwelling activity and pro rata SEQ Regional Plan infill target Cumulative total of new infill dwelling approvals (1 July 2006 to 30 June 2010) Pro rata infill additional dwelling target (736 / year) (600 / year) Current activity as a percentage of the pro rata infill additional dwelling target 123% Redland is currently tracking ahead of the pro rata infill additional dwelling target 544 (136 / year) Current cumulative percentage of infill to total dwellings (target aim 71% overall) 75% Note: values above are as at 30 June
93 11.3 Residential supply Approved dwelling supply Figure 55 shows that lot approvals have been on a downward trend with lot production varying over the last four years. The closing stock of uncompleted lots for Redland as at June 2010 was 2184 lots, which is an 11.2 per cent decrease on , due mainly to the decline in lot approvals versus increased production in Figure 55 also shows there were 818 uncompleted operational works approvals as at 30 June 2010, a 29 per cent increase on Table 45 summarises the approved dwelling supply reflected in both the stock of uncompleted lots and multiple dwelling material change of use approvals in the Existing Urban Area. Lots Uncompleted lots - total Lot production Lots lapsed Uncompleted lots - operational works Lot approvals Figure 55 Uncompleted lots and operational works approvals with annual lot approvals, lot production and lots lapsed Table 45 Approved dwelling supply Part of area Inside Existing Urban Area (infill) Type of dwelling supply (as at 30 June 2010) Multiple dwelling material change of use development permits and undefined approvals Number of dwellings 1 Estimated years of supply Uncompleted lots operational works Total Uncompleted lots total These components of approved dwelling supply cannot be summed because operational works approvals are a subset of the total uncompleted lots and there are overlaps between uncompleted lots and multiple dwelling material change of use approvals. The estimated years of supply in Table 45 are all equal to or above the SEQ averages and there would appear to be an adequate supply of approvals for multiple dwellings and residential lots to meet dwelling needs in the short-term. The consistent decline in lot approvals since may be addressed by new broadhectare supplies becoming available in the short to medium-term through the Local Development Areas of South East Thornlands and Kinross Road Planned and emerging dwelling supply Figure 56 reports planned and emerging dwelling supply for both inside the Existing Urban Area and the total area of Redland. It also estimates the number of years supply those dwellings represent (as at 30 June 2010) and the estimated current shortfall or excess of the combined planned and emerging supply compared to the infill and total dwelling targets. 92
94 Excess dwgs Dwellings Planned dwgs years Planned / emerging dwgs years Planned dwgs years Shortfall dwgs Planned / emerging dwgs years Current activty dwgs Current activty dwgs Total Infill Emerging supply Planned supply Current Activity 07/06-06/10 Target to 2031 Figure 56 Redland planned and emerging dwelling supply The assessment of infill dwelling supply to 2031 and the estimated yields for the Local Development Areas are based on parcel-level analyses provided by the council in Remaining yields are based on the broadhectare study. The planned and combined planned and emerging dwelling supply provide an adequate number of years supply of both infill and total dwellings, compared to the minimum benchmarks of 10 and 15 years, respectively. Within the Existing Urban Area, the combined planned and emerging dwelling supply indicates a shortfall in the infill dwelling yields compared to the target, but it is noted the council s master plans for the Cleveland and Capalaba regional activity centres include new capacity for residential development. That capacity could be taken up sooner than assumed for Figure 56, depending on the timing of upgrades to the public transport system in those areas. The SEQ Regional Plan's sub-regional narrative for Redland also prompts measures to increase infill in suburbs such as Thorneside, Birkdale, Wellington Point and Ormiston. The combined planned and emerging dwelling supply are currently estimated to slightly exceed the total dwelling target. Fulfilment of this expectation depends partly on the implementation of the emerging planning changes identified in Table 46 and on any dwelling yield impacts arising from the implementation of the SEQ Koala Conservation State Planning Policy and associated State Planning Regulatory Provisions. Table 46 Emerging planning changes (as at October 2010) Planning change Kinross Road Structure Plan Victoria Point Local Development Area Status First state Interest Review Future uses under consideration 93
95 11.4 Industrial development and land supply Over the four-year period from January 2006 to December 2009, Redland experienced development of around one and a half hectares annually of new building approvals on industrial land. Both the land area and number of building approvals on industrial land has fluctuated over this period as shown in Figure 57. In 2009, there was a 21 per cent increase in building approval areas from 2008, but a smaller number of approvals. As shown in Figure 58, all available industrial land is zoned, with the predominant zones being low impact equivalent and non-industry. Table 47 shows the land areas of approved, planned and emerging industrial land supply compared to SEQ as a whole. Redland has only a small area of industrial land and, given the existing land use pattern and conservation constraints, limited opportunity to expand this supply significantly. Area (ha) Area (ha) Area of industrial approvals Annual ave (last 4 years) Number of approvals Figure 57 New building approvals on industrial land High Impact 7 High technology Industry Planned 23 Low impact 4 Medium impact 15 Non industry Noxious and hazardous Emerging Waterfront marine Industry Investigation Figure 58 Available industrial land areas by zone Approvals Table 47 Industrial land supply Planned and emerging Approved 1 Planned 2 Emerging 3 Total % of SEQ Redland Total SEQ Includes land with material change of use or reconfiguring a lot development permits and vacant industrial zoned lots registered in the last five years. 2. Includes approved supply and industrial zones other than emerging supply, plus preliminary approvals overriding the planning scheme. 3. Includes areas zoned for industrial investigation or equivalent plus SEQ Regional Plan Development Areas (employment only) and enterprise opportunity areas 11.5 Development Areas Table 48 identifies the planning and infrastructure status, scale and expected timing of the SEQ Regional Plan s Local Development Areas in Redland. 94
96 Table 48 Local Development Areas (as at October 2010) Area Planning and infrastructure status Dwellings Residential Kinross Road South East Thornlands Victoria Point Draft Kinross Road Structure Plan subject to first state interest check Structure Plan adopted into planning scheme in March 2010 Future uses to be determined by council prior to planning scheme amendment Expected timing dwgs dwgs dwgs
97 12.0 Scenic Rim 12.1 Integrated analysis Total dwelling activity Over the period from July 2006 to June 2010, Scenic Rim was tracking well below the pro rata total additional dwelling target. Development may only approach that target in association with greater local employment opportunities, such as the future industrial activities envisaged for the Bromelton Regional Development Area Infill dwelling activity Up to June 2010, infill dwelling activity was also tracking well below the pro rata infill additional dwelling target. Increased activity may also depend on increased local employment at Bromelton Approved dwelling supply As at June 2010, the approved supply of residential lots, including total uncompleted lots and those with operational works approval, appeared to provide for an adequate supply of dwellings in the short-term, subject to the current feasibility of developing those approved lots Planned and emerging dwelling supply The estimated combined planned and emerging infill supply does not meet the minimum benchmark of 15 years. The planned and emerging total supply does meet that benchmark, and that for planned supply (10 years). There are locally significant shortfalls of total and infill dwellings compared to the targets. However, as noted above, the demand consistent with both the infill and total dwelling targets may not emerge for some years until there is more growth of employment opportunities. The Beaudesert Growth Management Strategy and associated planning scheme changes are expected to increase dwelling densities in the Beaudesert Local Development Area to support the capacity to accommodate the total dwelling target. Given the relatively low current level of actual dwelling demand, there is time for such planning changes to proceed Industrial development and land supply There were no new building approvals on industrial land recorded for the period in Scenic Rim. Scenic Rim has a very low level of industrial land demand currently, but this would be expected to increase with the future development of Bromelton. That area has the potential to satisfy particular SEQ region industrial land needs. 96


98 Scenic Rim integrated land supply 97
99 12.2 Dwelling activity versus SEQ Regional Plan dwelling targets Total dwelling activity and targets Figure 59 and Table 49 show that, for the period July 2006 to June 2010, total new dwelling approvals have been tracking well below the pro rata target for total additional dwellings. Multiple dwellings have been only about five per cent of total dwelling activity Sep Dec Mar Jun Sep Dec Mar Dwellings Jun Sep Dec Mar Jun Sep Dec Mar Jun Mulitple dwellings 2006 onwards Dwelling houses 2006 onwards Pro rata dwelling target SEQRP Figure 59 Cumulative dwelling approvals and pro rata total dwelling target Table 49 Total dwelling activity and pro rata SEQ Regional Plan target Cumulative total of all new dwelling approvals (1 July 2006 to 30 June 2010) Pro rata total additional dwelling target 891 (223 / year) (600 / year) Current activity as a percentage of pro rata total additional dwelling target 37% Scenic Rim is currently tracking below the pro rata total additional dwelling target (-377 / year) Note: values above are as at 30 June
100 Infill dwelling activity and targets Figure 60 and Table 50 show that new dwelling approvals in the Existing Urban Area have consistently been well below the pro rata infill additional dwelling target. About 18 per cent of the infill dwelling activity has been multiple dwellings, with most of the remaining activity likely to have been dwelling houses on recently subdivided land in the Existing Urban Area. Dwellings Sep Dec Mar Jun Sep Dec Mulitple dwellings 2006 onwards Mar Jun Sep Dec Mar Jun Sep Dec Mar Dwelling houses 2006 onwards Jun Pro rata dwelling target SEQRP Figure 60 Cumulative infill dwelling approvals and pro rata infill dwelling target Table 50 Infill dwelling activity and pro rata SEQ Regional Plan infill target Cumulative total of new infill dwelling approvals (1 July 2006 to 30 June 2010) Pro rata infill additional dwelling target 134 (33 / year) 320 (80 / year) Current activity as a percentage of the pro rata infill additional dwelling target 42% Scenic Rim is currently tracking below the pro rata infill additional dwelling target -186 (-47 / year) Current cumulative percentage of infill to total dwellings (target aim 13% overall) 15% Note: values above are as at 30 June
101 12.3 Residential supply Approved dwelling supply Figure 61 shows that lot production over the last four years has mostly been lower than lot approvals. In there was a large drop in lot approvals, even below the low level of lot production, and in a significant increase in lots lapsed, resulting in a decrease in the number of uncompleted lots since The closing stock of uncompleted lots for Scenic Rim as at June 2010 was 1126 lots, which is a 6.2 per cent decrease on Figure 61 also shows there were 244 uncompleted operational works approvals as at 30 June 2010, a 20.8 per cent increase on Lots Uncompleted lots - total Lot production Lots lapsed Uncompleted lots - operational works Lot approvals Figure 61 Uncompleted lots and operational works approvals with annual lot approvals, lot production and lots lapsed Table 51 summarises the approved dwelling supply reflected in both the stock of uncompleted lots and multiple dwelling material change of use approvals in the Existing Urban Area. Table 51 Approved dwelling supply Type of dwelling supply Number of Estimated years of Part of area (as at 30 June 2010) dwellings 1 supply Inside Existing Multiple dwelling material change of use Urban Area development permits and undefined approvals Uncompleted lots operational works Total Uncompleted lots total These components of approved dwelling supply cannot be summed because operational works approvals are a subset of the total uncompleted lots and there are overlaps between uncompleted lots and multiple dwelling material change of use approvals. Scenic Rim has only a small stock of multiple dwelling approvals so the number of years supply is a less reliable tool. The years of supply of total uncompleted lots and operational works approvals are both greater than the SEQ region averages and would appear adequate given that approvals have generally exceeded lot production. This is subject to the current feasibility of developing the approved lots Planned and emerging dwelling supply Figure 62 reports planned and emerging dwelling supply for both inside the Existing Urban Area and the total area of Scenic Rim Regional Council. It also estimates the number of years supply those dwellings represent (as at 30 June 2010) and the estimated current shortfall or excess of the combined planned and emerging supply compared to the infill and total dwelling targets. 100
102 Shortfall dwgs Dwellings Planned dwgs years Planned / emerging dwgs years Shortfall dwgs Current activty 900 dwgs Planned 700 dwgs 9-10 years Planned / emerging 700 dwgs 9-10 years Current activty 100 dwgs Total Infill Emerging supply Planned supply Current Activity 07/06-06/10 Target to 2031 Figure 62 Scenic Rim planned and emerging dwelling supply (dwellings rounded to nearest 100) The estimated infill supply figures are based on information provided by the council at the time of the Regional Plan review in and various adjustments. The total supply figures also include broadhectare study expected yields. There are locally significant shortfalls in the combined planned and emerging dwelling supply, compared to both the infill and total dwelling targets, and inadequate years of supply of infill dwellings. As indicated in Table 52, however, the council is currently preparing the Beaudesert Growth Management Strategy and is applying the minimum net density of 15 dwellings per hectare to the Beaudesert Local Development Area, as required by the SEQ Regional Plan. Based on council analyses, achievement of this density is expected to provide the capacity to accommodate the total dwelling target. Implementation of such development would appear reliant on future economic opportunities, such as those afforded by the envisaged industrial development of the Bromelton Regional Development Area (see Section 12.5). Further planning changes would appear necessary over time to provide the capacity to accommodate the infill target. Table 52 Emerging planning changes (as at October 2010) Planning change Beaudesert Growth Management Strategy Status In preparation by council 101
103 12.4 Industrial development and land supply Over the four year period from January 2006 to December 2009, Scenic Rim did not register a new building approval over industrial land. As shown in Figure 63, around 81 per cent of all available industrial land is zoned, with the predominant zone being industry equivalent. The remaining 19 per cent allocated is industry investigation equivalent. Table 53 shows the land areas of approved, planned and emerging industrial land supply compared to SEQ as a whole. Area (ha) High Impact High technology Industry Planned 98 Low impact Medium impact 2 Non industry Noxious and hazardous Emerging Waterfront marine Figure 63 Available industrial land areas by zone 372 Industry Investigation Table 53 Industrial land supply Planned and emerging Approved 1 Planned 2 Emerging 3 Total % of SEQ Scenic Rim Total SEQ Includes land with material change of use or reconfiguring a lot development permits and vacant industrial zoned lots registered in the last five years. 2. Includes approved supply and industrial zones other than emerging supply, plus preliminary approvals overriding the planning scheme. 3. Includes areas zoned for industrial investigation or equivalent plus SEQ Regional Plan Development Areas (employment only) and enterprise opportunity areas. As illustrated on the map in Section 12.1, the main area of potential industrial development is Bromelton. The need for that area relates more to overall SEQ region industrial land supply needs than those for Scenic Rim itself. The council has recently submitted the Bromelton Structure Plan and associated planning scheme amendments to the Department of Local Government and Planning for first state interest review. 102
104 12.5 Development Areas Tables 54 and 55 identify the planning and infrastructure status, scale and expected timing of the SEQ Regional Plan s Regional and Local Development Areas in Scenic Rim. Table 54 Regional Development Areas (as at October 2010) Area Employment Bromelton Planning and infrastructure status Located within a declared State Development Area Suitability for high impact industries being assessed through investigations to identify a 50 year land bank for large scale and high impact industries Council has submitted draft Structure Plan to the Department of Local Government and Planning for first state interest review Developers working on plans for a number of sites Development Scheme for State Development Area in preparation by the Coordinator General Interstate freight rail line passes through area Requires major extensions to existing infrastructure Dwellings (dwgs) Industrial area (ha) 1820 ha (subject to review pursuant to Structure Plan) Expected timing Table 55 Local Development Areas (as at October 2010) Area Residential Canungra Beaudesert Planning and infrastructure status Development potential under existing planning scheme Beaudesert Growth Management Strategy in preparation with a view to submitting, with associated planning scheme amendments, for first state interest review in 2011 Dwellings (dwgs) Industrial area (ha) Unknown Unknown Expected timing Unknown Unknown 103
105 13.0 Somerset 13.1 Integrated analysis Total dwelling activity Up to June 2010, new dwelling approvals in Somerset were matching the pro rata total additional dwelling target, with dwelling activity actually increasing somewhat since the global financial crisis Infill dwelling activity Somerset does not have an infill dwelling target so infill dwelling approvals have not been separately reported Approved dwelling supply As at June 2010, the approved supply of residential lots, including total uncompleted lots and those with operational works approval, appeared to provide an adequate supply of lots for dwelling houses in the short-term, subject to the current feasibility of developing those approved lots Planned and emerging dwelling supply There is potentially an inadequate number of years of planned and combined planned and emerging dwelling supply, compared to the minimum benchmarks of 10 and 15 years, respectively. There is also a significant shortfall of combined planned and emerging supply compared to the total dwelling target to Council expects, as part of preparing its new planning scheme, to progress work to significantly increase the planned and emerging supply through local area plans or structure plans for the substantial growth areas identified within the Urban Footprints associated with the region s towns. There have already been substantial urban residential development applications made and approvals given in those areas, particularly at Fernvale, Lowood and Kilcoy. Those developments have contributed to the recent increase in dwelling activity Industrial development and land supply There were no new building approvals on industrial land recorded for the period in Somerset. 104

106 Somerset integrated land supply 105
107 13.2 Dwelling activity versus SEQ Regional Plan dwelling targets Total dwelling activity and targets Figure 64 and Table 56 show that total new dwelling approvals have been tracking around the pro rata target for total additional dwellings towards the end of the July 2006 to June 2010 period. Dwelling activity in Somerset actually increased in recent years, based on building approvals for new dwellings. Only about five per cent of the new dwelling approvals over the period were for multiple dwellings. Dwellings Sep Dec Mar Jun Sep Dec Mar Jun Sep Dec Mar Jun Sep Dec Mar Mulitple dwellings 2006 onwards Dwelling houses 2006 onwards Pro rata dwelling target SEQRP Figure 64 Cumulative dwelling approvals and pro rata total dwelling target Jun Table 56 Total dwelling activity and pro rata SEQ Regional Plan target Cumulative total of all new dwelling approvals (1 July 2006 to 30 June 2010) Pro rata total additional dwelling target (276 / year) (260 / year) Current activity as a percentage of the pro rata total additional dwelling target 106% Somerset is currently tracking above the pro rata total additional dwelling target 63 (16 / year) Note: values above are as at 30 June Infill dwelling activity and targets The SEQ Regional Plan does not identify an infill dwelling target for Somerset. 106
108 13.3 Residential supply Approved dwelling supply Figure 65 shows that lot production over the last four years has consistently been lower than lot approvals. The closing stock of uncompleted lots for Somerset as at June 2010 was 2225 lots, which is a 10.5 per cent decrease on That decrease was primarily due to the increase in lots lapsed in Figure 65 also shows there were 600 uncompleted operational works approvals as at 30 June 2010, a 25.5 per cent increase on Table 57 summarises the approved dwelling supply reflected in the stock of uncompleted lots. Lots Uncompleted lots - total Uncompleted lots - operational works Lot production Lot approvals Lots lapsed 600 Figure 65 Uncompleted lots and operational works approvals with annual lot approvals, lot production and lots lapsed Table 57 Approved dwelling supply Part of area Type of dwelling supply Number of Estimated years of (as at 30 June 2010) dwellings 1 supply Total Uncompleted lots operational works Uncompleted lots total These components of approved dwelling supply cannot be summed because operational works approvals are a subset of the total uncompleted lots. As the stock of total uncompleted lots and operational works approvals are at or near historically high levels, and the estimated number of years supply are well above the SEQ region averages, the approved supply would appear to provide an adequate short-term supply of lots for dwelling houses. This is subject to the current feasibility of developing those lots Planned and emerging dwelling supply Figure 66 reports planned and emerging dwelling supply for the total area of Somerset. It also estimates the number of years supply those dwellings represent (as at 30 June 2010) and the estimated current shortfall or excess of the combined planned and emerging supply compared to the total dwelling targets. 107
109 Shortfall dwgs Dwellings Maximum additional planned supply based on Broadhectare study Planned supply dwgs 8-9 years Planned/emerging dwgs 8-9 years No infill target Current activity dwgs Total Infill Emerging supply Planned supply Current Activity 07/06-06/10 Target to 2031 Figure 66 Somerset planned and emerging dwelling supply (dwellings rounded to nearest 100) As indicated in Appendix A1, in most areas the planned dwelling supply outside the Existing Urban Area, which is effectively all of the supply in Somerset, is based primarily on the broadhectare study. In Somerset, due to the nature of recent residential subdivision approvals, most of those approvals are not captured by the broadhectare study. The approved supply reported in Table 57 is about twice the broadhectare study yields, and the extent to which the broadhectare study yields overlap with the approved supply, and vice versa, cannot be determined accurately based on the available data. Figure 66 therefore shows the approved supply (from Table 57) as the planned supply and illustrates the maximum additional planned supply if all of the broadhectare study yields did not overlap with the approved supply. Figure 66 indicates there is potentially an inadequate planned and combined planned and emerging supply, in terms of number of years supply, and there is a significant shortfall compared to the total dwelling target to 2031, even with the maximum additional yields from the broadhectare study. There is, however, substantial potential for additional supply within the current Urban Footprint, particularly those associated with the towns of Fernvale and Lowood. The Strategic Framework of the current Esk Shire Planning Scheme identifies those Urban Footprint areas as medium to long-term growth opportunities. Those areas, and the Urban Footprint associated with Kilcoy, have already been subject to significant urban residential development applications and approvals, which are only partly reflected in the approved supply in Table 57. At the time of reporting (October 2010), council advised there were an additional lots under application at Fernvale alone. The preparation of the council s new planning scheme is expected to progress work to increase the planned and emerging supply through local plans for the Urban Footprints around the region s towns. They appear to provide more than enough capacity for Somerset to accommodate the total dwelling target. 108
110 13.4 Industrial development and land supply Over the four-year period from January 2006 to December 2009, Somerset did not register a new building approval over industrial land. All available industrial land is zoned, with the predominant zones being industry equivalent and non-industry. Area (ha) Table 58 shows the land areas of approved, planned and emerging industrial land supply compared to SEQ as a whole. High Impact High technology Industry Planned Low impact Medium impact Non industry Noxious and hazardous Emerging Waterfront marine Industry Investigation Figure 67 Available industrial land areas by zone Table 58 Industrial land supply Planned and emerging Approved 1 Planned 2 Emerging 3 Total % of SEQ Somerset Total SEQ Includes land with material change of use or reconfiguring a lot development permits and vacant industrial zoned lots registered in the last five years. 2. Includes approved supply and industrial zones other than emerging supply, plus preliminary approvals overriding the planning scheme. 3. Includes areas zoned for industrial investigation or equivalent plus SEQ Regional Plan Development Areas (employment only) and enterprise opportunity areas Development Areas The SEQ Regional Plan does not nominate any Development Areas for Somerset. 109
111 14.0 Sunshine Coast 14.1 Integrated analysis Total dwelling activity Total dwelling activity on the Sunshine Coast up to June 2010 was tracking below the pro rata total additional dwelling target, probably due in part to the global financial crisis. Activity is expected to increase over time as the full development potential of areas such as Caloundra South, Palmview and Maroochydore is taken up together with remaining potential in other areas such as Kawana and Sippy Downs Infill dwelling activity Infill dwelling activity has been tracking well above the pro rata infill additional dwelling target. The predominant dwelling house component of that activity is expected to decline over time as remnant broadhectare land in the Existing Urban Area is taken up. Multiple dwelling activity will need to increase over time to accommodate expected infill dwelling demand Approved dwelling supply The approved supply of residential lots as at June 2010 would appear to provide an adequate supply of dwellings in the short-term, subject to the current feasibility of developing those approvals. The approved supply of multiple dwellings is lower than the SEQ average, but is still over four years supply Planned and emerging dwelling supply Based on indicative estimates of dwelling yields, there is currently an adequate number of years of planned and emerging supply for both infill and total dwellings. There appears, however, to be a shortfall in the combined planned and emerging supply compared to the total dwelling target, and a lesser shortfall compared to the infill target. The new planning scheme for Sunshine Coast is considering dwelling yields and will need to demonstrate how the dwelling targets will be addressed Industrial development and land supply The Sunshine Coast had a relatively low level of industrial development activity over the period. The Sippy Creek Enterprise Opportunity Area and Forest Glen west of the Bruce Highway have been included in the industrial land supply for the purposes of this report. The council has advised these areas are unsuitable for industrial development. Their status needs to be resolved as part of informing industrial land needs on the Sunshine Coast. 110

112 Sunshine Coast integrated land supply 111
113 14.2 Dwelling activity versus SEQ Regional Plan dwelling targets Total dwelling activity and targets Figure 68 and Table 59 show that, for the period July 2006 to June 2010, the Sunshine Coast was tracking below the pro rata total additional dwelling target, based on building approvals for new dwellings. Activity levels declined from about mid-2008 onwards. Dwellings Given suitable economic circumstances, total dwelling activity is expected to increase in the medium-term as the full development potential available in areas such as Caloundra South, Palmview and Mulitple dwellings 2006 onwards Pro rata dwelling target SEQRP Dwelling houses 2006 onwards Maroochydore comes on stream together with remaining potential in other areas such as Kawana and Sippy Downs Sep Dec Mar Jun Sep Dec Mar Figure 68 Cumulative dwelling approvals and pro rata total dwelling target Jun Sep Dec Mar Jun Sep Dec Mar Jun The proportion of total approvals that was multiple dwellings has been fairly consistent over the period to June 2010, with a cumulative percentage of around 27 per cent of all dwelling approvals. In comparison, the equivalent figure for SEQ was around 35 per cent. Table 59 Total dwelling activity and pro rata SEQ Regional Plan target Cumulative total of all new dwelling approvals (1 July 2006 to 30 June 2010) Pro rata total additional dwelling target (3 165 / year) (3 920 / year) Current activity as a percentage of pro rata total additional dwelling target 81% Sunshine Coast is currently tracking below the pro rata total additional dwelling target (-755 / year) Note: values above are as at 30 June
114 Infill dwelling activity and targets Figure 69 and Table 60 show that, up to June 2010, the Sunshine Coast was tracking ahead of its pro rata infill additional dwelling target, based on building approvals for new dwellings. Over the whole period to June 2010, the proportion of multiple dwellings within the Existing Urban Area was around 35 per cent of all new dwelling approvals, or about 49 per cent of the infill target. Dwellings Sep Dec Conversely, dwelling houses Figure 69 Cumulative infill dwelling approvals and pro rata infill dwelling target were 65 per cent of the new infill dwelling approvals up to June These would have mostly been located on recently subdivided land in the Existing Urban Area. As the remnant broadhectare land in the Existing Urban Area is taken up, this type of dwelling activity will decline. The level of multiple dwelling activity would be expected to increase over time to accommodate infill dwelling demand Mar Jun Sep Dec Mulitple dwellings 2006 onwards Pro rata dwelling target SEQRP Mar Jun Sep Dec Mar Jun Sep Dec Dwelling houses 2006 onwards Mar Jun Table 60 Infill dwelling activity and pro rata SEQ Regional Plan infill target Cumulative total of new infill dwelling approvals (1 July 2006 to 30 June 2010) Pro rata infill additional dwelling target (2 061 / year) (1 480 / year) Current activity as a percentage of the pro rata infill additional dwelling target 139% Sunshine Coast is currently tracking ahead of the pro rata infill additional dwelling target (581 / year) Current cumulative percentage of infill to total dwellings (target aim 38% overall) 65% Note: values above are as at 30 June
115 14.3 Residential supply Approved dwelling supply Figure 70 shows that lot production over the last four years has consistently been in line with or slightly higher than lot approvals. The more recent increase in lots lapsed has also contributed to the decline in the number of uncompleted lots since The closing stock for the Sunshine Coast as at June 2010 was 6460 lots, which is a seven per cent decrease on , and an 18 per cent decrease overall from Lots Figure 70 also shows there were 2003 uncompleted operational works approvals as at 30 June 2010, a 14.7 per cent decrease on Table 61 summarises the approved dwelling supply reflected in both the stock of uncompleted lots and multiple dwelling material change of use approvals in the Existing Urban Area. Uncompleted lots - total Lot production Lots lapsed Uncompleted lots - operational works Lot approvals Figure 70 Uncompleted lot and operational works approvals with annual lot approvals, lot production and lots lapsed Table 61 Approved dwelling supply Type of dwelling supply Number of Estimated years of Part of area (as at 30 June 2010) dwellings 1 supply Inside Existing Multiple dwelling material change of use Urban Area development permits and undefined approvals Uncompleted lots operational works Total Uncompleted lots total These components of approved dwelling supply cannot be summed because operational works approvals are a subset of the total uncompleted lots and there are overlaps between uncompleted lots and multiple dwelling material change of use approvals. The Sunshine Coast has the lowest number of years supply of multiple dwelling approvals in the Existing Urban Area, but that is still over four years supply. The stock of uncompleted lots is equal to the SEQ region average, in terms of years supply. Although the total stock has been declining since , up to June 2010 the stock of operational works approvals was just above the average years of supply across SEQ Planned and emerging dwelling supply Figure 71 reports planned and emerging dwelling supply for both inside the Existing Urban Area and the total area of the Sunshine Coast. It also estimates the number of years supply those dwellings represent (as at 30 June 2010) and the estimated current shortfall or excess of the combined planned and emerging supply compared to the infill and total dwelling targets. 114
116 Shortfall dwgs Dwellings Planned dwgs years Planned / emerging dwgs years Shortfall dwgs Planned dwgs years Planned / emerging dwgs years Current activty dwgs Current activty dwgs Total Infill Emerging supply Planned supply Current Activity 07/06-06/10 Target to 2031 Figure 71 Sunshine Coast planned and emerging dwelling supply (dwellings rounded to nearest 1 000) Within the Existing Urban Area, there is a proportionally small shortfall in the combined planned and emerging infill dwelling supply, but there is an adequate number of years of planned and emerging supply, based on the minimum supply benchmarks. There is also an adequate number of years of planned and combined planned and emerging total dwelling supply, but there is a shortfall compared to the total dwelling target. Part of that shortfall could be addressed by bringing forward the 5000 dwellings at Caloundra South currently expected to occur after The planned infill supply in Figure 71 is based primarily on analyses undertaken at the time of the Regional Plan review in , with use made of various parcel-level assessments of dwelling yields and other information provided by the council. Those analyses sought to allow for tourist dwelling needs, such that the dwelling supply numbers in Figure 71 are an estimate of dwellings for residents. Adjustments have been made to those estimates based on planning changes since Table 62 identifies planning changes in process, but the effect of those on dwelling yields has already been reflected in Figure 71. Overall, the dwelling yields identified in Figure 71 should be considered indicative estimates. The new planning scheme for the Sunshine Coast is considering dwelling yields, including a detailed parcel-level assessment, and will need to demonstrate how the Sunshine Coast will address the dwelling targets of the SEQ Regional Plan. 115
117 Table 62 Emerging planning changes (as at October 2010) Planning change Caloundra South Development Scheme Palmview Structure Plan Maroochydore Principal Activity Centre Structure Plan Forest Glen planning review Nambour Mill Site Status Urban Development Area declared in October 2010 Development Scheme to be prepared by October 2011 The former Minister for Infrastructure and Planning has advised council of his conditions for proceeding with adoption of the Structure Plan. Submissions being considered by council following public display Drafting Drafting 14.4 Industrial development and land supply Over the four year period from January 2006 to December 2009, Sunshine Coast experienced development of around five hectares annually of new building approvals on industrial land. Both the number and land area of building approvals on industrial land has fluctuated over this period as shown in Figure 72. Area (ha) Approvals Around 43 per cent of all available industrial land is zoned, with the predominant zone being medium impact equivalent. The remaining 57 per cent allocated is industry investigation equivalent. Table 63 shows the land areas of approved, planned and emerging industrial land supply compared to SEQ as a whole. Area of industrial approvals Number of approvals Annual ave (last 4 years) Figure 72 New building approvals on industrial land High Impact High technology Industry Low impact Medium impact Non industry Noxious and hazardous Waterfront marine Area (ha) Industry Investigation Planned Emerging Figure 73 Available industrial land areas by zone Table 63 Industrial land supply Planned and emerging Approved 1 Planned 2 Emerging 3 Total % of SEQ Sunshine Coast Total SEQ Includes land with material change of use or reconfiguring a lot development permits and vacant industrial zoned lots registered in the last five years. 2. Includes approved supply and industrial zones other than emerging supply, plus preliminary approvals overriding the planning scheme. 3. Includes areas zoned for industrial investigation or equivalent plus SEQ Regional Plan Development Areas (employment only) and enterprise opportunity areas. 116
118 As illustrated on the map in Section 14.1, the major areas of available industrial land include Coolum Industrial Area, Forest Glen Business Park and Sippy Creek Enterprise Opportunity Area. The latter represents all of the emerging supply and industry investigation equivalent land reported for the Sunshine Coast. It is noted the council has advised that the Forest Glen and Sippy Creek areas on the western side of the Bruce Highway are unsuitable for industrial development due to flooding, vegetation and access constraints. Those areas have still been reported because they form part of the data compiled for the Industrial Land Monitoring Program Development Areas Tables 64 and 65 identify the planning and infrastructure status, scale and expected timing of the SEQ Regional Plan s Regional and Local Development Areas on the Sunshine Coast. Table 64 Regional Development Areas (as at October 2010) Area Residential and employment Caloundra South (now part of the Caloundra South Urban Development Area) Planning and infrastructure status Caloundra South Urban Development Area declared October 2010 Development Scheme to be prepared by October 2011 Bellvista early release area for 800 lots Caloundra Maroochy Corridor Study - Beerwah to Maroochydore ( ) 1 Bells Creek connection through site Bruce Highway to Caloundra Road Investigation (2012) Dwellings (dwgs) Industrial area (ha) dwgs ( to 2031) Expected timing Part of Principal Regional Activity Centre Council considering submissions on draft Structure Maroochydore Plan, which covers a larger area than the Development Area dwgs Caloundra Maroochy Corridor Study Beerwah to Maroochydore ( ) 1 Involves relocation of the Horton Park Golf Course The Minister for Infrastructure and Planning has Palmview advised council of his conditions for adoption of the Structure Plan dwgs Local infrastructure agreement negotiated 1. Indicative delivery timeframe in South East Queensland Infrastructure Plan and Program Table 65 Local Development Areas (as at October 2010) Area Employment Nambour Planning and infrastructure status Draft planning scheme amendment is in preparation Expected to have a mix of housing and employment opportunities Dwellings (dwgs) Industrial area (ha) Expected timing 100 dwgs
119 15.0 Toowoomba (SEQ) 15.1 Integrated analysis Total dwelling activity Toowoomba s overall level of dwelling activity to June 2010 was below the pro rata total additional dwelling target Infill dwelling activity In contrast to the situation with the total dwelling activity, Toowoomba is tracking well ahead of its pro rata infill additional dwelling target, currently exceeding the pro rata target based solely on new multiple dwelling building approvals, i.e. without counting dwelling house approvals Approved dwelling supply The approved supply of residential lots, including the total uncompleted lots and those with operational works approval, and multiple dwelling material change of use approvals would appear to provide an adequate supply of dwellings in the short-term, subject to the current feasibility of developing those approved lots and multiple dwellings Planned and emerging dwelling supply The total planned dwelling supply is adequate in terms of the minimum years of supply benchmark. Although the combined planned and emerging supply does not provide an adequate number of years supply, and represents a significant shortfall compared to the 2031 target, council has identified additional broadhectare opportunities as part of preparing its new planning scheme. Council s draft Priority Infrastructure Plan projections database now suggests the total dwelling target could, in theory, be accommodated. However, council advises that land ownership and infrastructure planning and coordination issues may make this impractical. As part of council s planning scheme reviews, and as informed by the finalised Priority Infrastructure Plan projections database, further planning actions may be required to provide the capacity to accommodate the total dwelling target by Current indications are that Toowoomba has enough capacity to accommodate its relatively low infill dwelling target Industrial development and land supply Toowoomba has experienced a low level of building approvals on industrial land over the period and has a relatively large planned supply to accommodate future industrial expansion, subject to the mix of zonings required. 118

120 Toowoomba (SEQ) integrated land supply 119
121 15.2 Dwelling activity versus SEQ Regional Plan dwelling targets Total dwelling activity and targets Figure 74 and Table 66 show, for the July 2006 to June 2010 period, Toowoomba (SEQ part) was tracking below the pro rata total additional dwelling target, based on approvals for new dwellings. Dwellings Over the whole period to June 2010, around 26 per cent of all dwelling approvals were for multiple dwellings. In comparison, the equivalent figure for SEQ was around 35 per cent Sep Dec Mar Jun Sep Dec Mar Mulitple dwellings 2006 onwards Pro rata dwelling target SEQRP Jun Sep Dec Mar Jun Sep Dec Mar Dwelling houses 2006 onwards Jun Figure 74 Cumulative dwelling approvals and pro rata total dwelling target Table 66 Total dwelling activity and pro rata SEQ Regional Plan target Cumulative total of all new dwelling approvals (1 July 2006 to 30 June 2010) Pro rata total additional dwelling target (826 / year) (1 240 / year) Current activity as a percentage of the pro rata total additional dwelling target 67% Toowoomba (SEQ) is currently tracking below the pro rata total additional dwelling target (-414 / year) Note: values above are as at 30 June
122 Infill dwelling activity and targets Figure 75 and Table 67 show that new dwelling approvals in the Existing Urban Area have consistently exceeded the pro rata infill additional dwelling target. Toowoomba is the only area where the cumulative total of multiple dwelling approvals alone has exceeded the pro rata infill additional dwelling target, i.e. without counting dwelling houses. Dwellings Sep Dec Mar Jun Sep Dec Mar Jun Sep Dec Mar Jun Sep Dec Mar Jun Mulitple dwellings 2006 onwards Dwelling houses 2006 onwards Over the whole period to June Pro rata dwelling target SEQRP , around 50 per cent of all Figure 75 Cumulative infill dwelling approvals and pro rata infill dwelling target new dwelling approvals in the Existing Urban Area were for multiple dwellings. Although the level of dwelling house approvals in the Existing Urban Area could be expected to decline in the short to medium-term as remnant broadhectare land in the Existing Urban Area is taken up, multiple dwelling activity is currently exceeding the expected long-term rate of infill dwelling demand. Table 67 Infill dwelling activity and pro rata SEQ Regional Plan infill target Cumulative total of new infill dwelling approvals (1 July 2006 to 30 June 2010) Pro rata infill additional dwelling target (362 / year) 640 (160 / year) Current activity as a percentage of the pro rata infill additional dwelling target 227% Toowoomba (SEQ) is currently tracking ahead of the pro rata infill additional dwelling target 810 (202 / year) Current cumulative percentage of infill to total dwellings (target aim 13% overall) 44% Note: values above are as at 30 June
123 15.3 Residential supply Approved dwelling supply Figure 76 shows that lot production over the last four years has been lower than lot approvals, except for The decline in approvals in was the main reason for the decline in the number of uncompleted lots during the year. The closing stock for Toowoomba (SEQ) as at June 2010 was 2405 lots, which is a 15.9 per cent decrease on Lots Figure 76 also shows there were 747 uncompleted operational works approvals as at 30 June 2010, a small increase on Table 68 summarises the approved dwelling supply reflected in both the stock of uncompleted lots and multiple dwelling material change of use approvals in the Existing Urban Area. Uncompleted lots - total Lot production Lots lapsed Uncompleted lots - operational works Lot approvals Figure 76 Uncompleted lots and operational works approvals with annual lot approvals, lot production and lots lapsed Table 68 Approved dwelling supply Type of dwelling supply Number of Estimated years of Part of area (as at 30 June 2010) dwellings 1 supply Inside Existing Multiple dwelling material change of use Urban Area development permits and undefined approvals Uncompleted lots operational works Total Uncompleted lots total These components of approved dwelling supply cannot be summed because operational works approvals are a subset of the total uncompleted lots and there are overlaps between uncompleted lots and multiple dwelling material change of use approvals. Recent lower levels of building approvals may distort the calculation of number of years supply to a degree, but the estimates are all equal to or above the SEQ region averages. The actual stock of approved lots is also at a reasonably high level historically. Toowoomba (SEQ) would therefore appear to have an adequate approved supply of multiple dwellings and lots for dwelling houses as at 30 June 2010, subject to the current feasibility of developing those approvals Planned and emerging dwelling supply Figure 77 reports planned and emerging dwelling supply for both inside the Existing Urban Area and the total area of Toowoomba (SEQ). It also estimates the number of years supply those dwellings represent (as at 30 June 2010) and the estimated current shortfall or excess of the combined planned and emerging supply compared to the infill and total dwelling targets. 122
124 Shortfall dwgs Dwellings Planned dwgs years Planned / emerging dwgs years Current activty dwgs Planned dwgs years Shortfall 100 dwgs Planned / emerging dwgs years Current activty dwgs Total Infill Emerging supply Planned supply Current Activity 07/06-06/10 Target to 2031 Figure 77 Toowoomba planned and emerging dwelling supply (dwellings rounded to nearest 100) The total planned dwelling supply is adequate in terms of the minimum years of supply benchmark (10 years), but the combined planned and emerging supply is not adequate. The reported supply, based primarily on the broadhectare study prepared in 2008, represents a significant shortfall compared to the total dwelling target. The broadhectare study identifies an additional long-term theoretical yield of around 7000 lots that may occur after 2031, and some of this may develop earlier. This apparent shortfall needs to be considered in the context of the work the council is doing on its new planning scheme (see Table 69). As foreshadowed in the sub-regional narrative of the SEQ Regional Plan, additional medium to long-term broadhectare opportunities have been identified as part of preparing the new scheme. Analyses undertaken, including a draft Priority Infrastructure Plan projections database, indicate that, in theory, Toowoomba could now accommodate the total dwelling target, but there are concerns about the practicality of accommodating the target by 2031 given land ownership and infrastructure planning and coordination issues. Further work and finalisation of council's new planning scheme will clarify this matter. The estimated planned infill dwelling supply nearly matches the target, and Table 69 identifies emerging planning changes that may increase dwelling yields. The estimate of infill supply reported in Figure 77 is based on analyses undertaken at the time of the Regional Plan review in , which used a parcellevel assessment of dwelling potential provided by the council. The draft Priority Infrastructure Plan projections database prepared in support of the new planning scheme suggests Toowoomba has more than enough capacity to accommodate its infill dwelling target by
125 Table 69 Emerging planning changes (as at October 2010) Planning change Toowoomba City Centre Master Plan New planning scheme Status Drafting and finalisation In preparation 15.4 Industrial development and land supply Over the four year period from January 2006 to December 2009, Toowoomba (SEQ) experienced an average of around 2 hectares annually of new building approvals on industrial land. Both the land area and number of building approvals on industrial land fluctuated over this period as shown in Figure 78. In 2009, there was a 67 per cent decrease in building approval areas from Area (ha) Area of industrial approvals Annual ave (last 4 years) Number of approvals Approvals As shown in Figure 79, around 99 per cent of all available industrial land is zoned, with the predominant zones being high and medium impact equivalent. The remaining one per cent allocated is industry investigation equivalent. Table 70 shows the land areas of approved, planned and emerging industrial land supply compared to SEQ as a whole. Area (ha) Figure 78 New building approvals on industrial land High Impact High technology 44 Industry 114 Low impact 558 Medium impact 394 Non industry Noxious and hazardous Waterfront marine 21 Industry Investigation Planned Emerging Figure 79 Available industrial land areas by zone Table 70 Industrial land supply Planned and emerging Approved 1 Planned 2 Emerging 3 Total % of SEQ Toowoomba (SEQ part) Total SEQ Includes land with material change of use or reconfiguring a lot development permits and vacant industrial zoned lots registered in the last five years. 2. Includes approved supply and industrial zones other than emerging supply, plus preliminary approvals overriding the planning scheme. 3. Includes areas zoned for industrial investigation or equivalent plus SEQ Regional Plan Development Areas (employment only) and enterprise opportunity areas. As illustrated on the map in Section 15.1, the major area of available industrial land in Toowoomba is Charlton Wellcamp. Over time the level of industrial land demand may increase in Toowoomba, particularly if Charlton Wellcamp fulfils its potential as a multi-modal freight hub Development Areas The SEQ Regional Plan does not nominate any Development Areas for Toowoomba. 124
126 16.0 Findings and related actions for consideration by state and local governments This section provides an overview of the findings of this report that lead to actions for consideration by state and local governments. These findings and actions relate only to residential supply. Future SEQ Growth Management Program annual reports will seek to identify similar findings and actions for industrial land supply SEQ region In collaboration with the state government, local governments are generally progressing appropriate planning changes and will need to monitor and review existing yield estimates. Such actions will ensure planned and emerging dwelling supplies are increased where required to provide an adequate number of years supply and ultimately to provide the capacity to accommodate the various local infill and total dwelling targets to Growth Management Queensland, in collaboration with OESR, local governments and other infrastructure agencies, proposes to develop a more consistent approach to decisions about land availability, density and development probability assumptions made as part of creating land and dwelling supply and strategic land use and infrastructure planning projection databases used by state and local governments. Over time, as new databases are prepared, this will support a more integrated and consistent basis for estimates of dwelling and employment yields as part of the SEQ Growth Management Program, and for estimation of infrastructure demand and costs to inform funding priorities. From the perspective of dwelling supply needs, the highest priority for land use and infrastructure planning work across SEQ should be given to those local government areas where the planned or combined planned and emerging supply is or may soon be inadequate compared to the minimum supply benchmarks. Planning actions are underway to address apparent land supply issues in Brisbane, Logan, Toowoomba, Scenic Rim and Somerset. The next highest priority for land use and infrastructure planning work should be those areas which may have an adequate number of years supply currently, but where further planning changes would appear necessary to provide the capacity to accommodate the dwelling targets to Local government areas that appear to be in this category include Lockyer Valley, Moreton Bay, Redland and the Sunshine Coast, but again planning actions are generally in process to address the identified shortfalls or provide better measurement of the supply Brisbane Although new dwelling approvals are currently tracking above the pro rata infill and total additional dwelling targets, the combined planned and emerging dwelling supply represents a significant shortfall compared to the infill and total dwelling targets to The major land use planning changes that are in process in Brisbane to address the dwelling supply shortfalls need to be supported and monitored to ensure adequate planned supply is created over time to 125
127 accommodate the dwelling targets and maintain an adequate number of years supply. The council s new strategic framework and associated studies should be used to coordinate the distribution of growth as required to accommodate the targets Gold Coast Based primarily on its Priority Infrastructure Plan projections database, the Gold Coast appears to have adequate planned and emerging dwelling supply to accommodate the infill and total dwelling targets to As far as practicable, actual development activity, the level of tourist dwelling demand and the adoption of a number of local area plans need to be monitored over time to verify, and review if required, the dwelling yield assumptions that supported this assessment Ipswich Ipswich appears to have an adequate planned and emerging land supply to accommodate its total and infill dwelling targets to As far as practicable, actual development activity and achieved dwelling yields need to be monitored over time to verify, and where necessary review, the dwelling yield assumptions of the Ipswich Population Modeller and broadhectare study that supported this assessment Lockyer Valley Lockyer Valley has an adequate planned and emerging dwelling supply, in terms of number of years supply, but based on the broadhectare study appears to have a proportionally small shortfall compared to the total dwelling target to Council s Residential Needs Report, as prepared in support of its new planning scheme, suggests there is adequate planned supply to accommodate the total dwelling target. The Department of Local Government and Planning and the council need to work collaboratively over time to resolve what further planning actions may be required to accommodate the target, primarily through the development of the new planning scheme Logan The planned and emerging total dwelling supply appear adequate in Logan, subject to the near future implementation of the planning for the large broadhectare areas of Greater Flagstone, Yarrabilba and Park Ridge, but there appears to be a significant shortfall in accommodating the infill dwelling target to Further land use planning and associated infrastructure changes would appear necessary to be able to accommodate the infill dwelling target Moreton Bay There is currently an adequate number of years supply compared to the minimum benchmarks, but the combined planned and emerging dwelling supply falls short of both the total and infill dwelling targets to
128 Council is progressing a number of planning changes that may increase dwelling yields. Subject to the scale of those additional yields, other planning changes may need to be considered to accommodate the targets, including further urban density redevelopment of existing large lot rural residential areas in the Urban Footprint Redland The planned and combined planned and emerging dwelling supply exceed the minimum supply benchmarks for both total and infill dwellings. However, there is a shortfall compared to the infill dwelling target to 2031 which will need to be addressed through further land use and infrastructure planning changes over time. The combined planned and emerging dwelling supply is estimated to exceed the total dwelling target, but the impacts of the SEQ Koala Conservation State Planning Policy and State Planning Regulatory Provisions on dwelling yields need to be monitored Scenic Rim The current dwelling targets for Scenic Rim appear linked to future economic development opportunities for the area, such as those associated with the Bromelton industrial area. This gives the council time to implement planning changes, including the envisaged Beaudesert Growth Management Strategy and associated planning scheme amendments, to provide an adequate supply to accommodate the infill and total dwelling targets Somerset Somerset has been tracking reasonably well against its pro rata total dwelling target. However, there may be an inadequate number of years supply of planned and emerging dwellings and there is a proportionally high shortfall compared to the total dwelling target to As part of preparing its new planning scheme, council expects to increase the planned and emerging supply through local area or structure plans for the substantial Urban Footprints associated with the towns of Fernvale, Lowood and Kilcoy Sunshine Coast The Sunshine Coast appears to have adequate planned and emerging dwelling supplies in terms of the minimum years supply benchmarks, but there is a shortfall in supply compared to the total and infill dwelling targets to As part of preparing the new planning scheme for the Sunshine Coast, council is considering dwelling yields and will need to demonstrate how the dwelling targets will be addressed. Full development of Caloundra South by 2031 would contribute significantly towards achieving the total dwelling target Toowoomba (SEQ) The planned dwelling supply, both total and infill, are adequate in terms of number of years supply and the planned and emerging infill supply may exceed the infill dwelling target. The combined planned and 127
129 emerging total dwelling supply does not provide an adequate number of years supply and represents a significant shortfall compared to the total dwelling target. Council has identified additional broadhectare opportunities as part of preparing its new planning scheme. Its draft Priority Infrastructure Plan projections database now suggests the total dwelling target could, in theory, be accommodated. However, council advises that land ownership and infrastructure planning and coordination issues may make this impractical. In the context of council s planning scheme reviews, further planning actions may be required to enable the total dwelling target to be accommodated by
130 Appendices A1 Compilation of residential supply data A1.1 Approved dwelling supply The components of approved dwelling supply reported include: Uncompleted lots total uncompleted lots and operational works approvals - Uncompleted lots data is obtained from OESR s residential land activity monitoring program and covers the whole of the SEQ region. Uncompleted lots are calculated by adding new lot approvals to the opening stock of approved lots at the start of each period and then removing lots produced and lots lapsed. - Operational works approvals are a subset of the total uncompleted lots. Such approval means that the construction of those lots has been approved. These lots are reported separately because they represent the supply of land most readily able to be produced in the very short-term and lots that reach this stage are more likely, than uncompleted lots generally, to be developed. - For both the total uncompleted lots and operational works approvals, the estimated years of supply reported is based on average annual lot production for the four years to 30 June Multiple dwelling material change of use approvals - The multiple dwelling material change of use approvals are only those within the Existing Urban Area, i.e. infill multiple dwellings, although predominantly multiple dwellings are located in the Existing Urban Area. This information is based on the OESR's Residential Infill Development profile for SEQ. Only development permits and other undefined approvals are reported as they are the most readily able to be developed in the short-term. The estimated years of supply is based on the average annual other, i.e. not dwelling houses, dwelling approvals (Australian Bureau of Statistics Census Collection District level building approvals data obtained via OESR) in the Existing Urban Area over the four years to 30 June It is important to note that these components of approved dwelling supply cannot be summed because operational works approvals are a subset of the total uncompleted lots and there are overlaps between uncompleted lots and multiple dwelling material change of use approvals, e.g. the approvals may relate to the same town houses. A1.2 Planned dwelling supply The approved dwelling supply is generally a component of the planned dwelling supply which integrates estimated dwelling yields from the following sources and components: Broadhectare studies - For areas outside the Existing Urban Area, planned dwelling supply includes broadhectare study expected dwelling yields. However, it excludes yields within most SEQ Regional Plan Development Areas and Urban Development Areas because either further planning action is required for them to be classified as planned supply or the yields are as identified by the ULDA or council. 129
131 - Broadhectare study data for this report was obtained from the OESR's SEQ Broadhectare study (edition 6, 2009) updated to remove subdivision activity up to June The broadhectare study identifies expected and theoretical dwelling yields, land areas and expected timing of development for parcels greater than 2500 square metres that are suitable, potentially available and serviceable for residential use. Priority Infrastructure Plan projection databases or nearest equivalent - For areas inside the Existing Urban Area, i.e. infill, planned dwelling supply is derived primarily from Priority Infrastructure Plan projection databases and other parcel-level analyses prepared by local governments for infrastructure and strategic planning purposes. Although that information is the most recent available at the time of preparing the, some of the information is as compiled and adjusted for the review of the Regional Plan in Urban Development Area dwelling yields - Expected dwelling yields for the Urban Development Areas of Fitzgibbon, Hamilton Northshore and Bowen Hills, as provided by the ULDA, were included in the planned dwelling supply for Brisbane. Such yields were not reflected in the adopted Priority Infrastructure Plan assumptions for Brisbane as they were outside the development potential of the City Plan, but they are subject to development schemes under the Urban Land Development Authority Act 2007 and so meet the criteria for planned supply. Council yield estimates - In some areas plan changes had been adopted after the date of preparation of broadhectare studies or Priority Infrastructure Plan projections databases and overall yield estimates for such areas were obtained directly from the relevant council. Calculation of the estimated years of planned dwelling supply as at 30 June 2010 is based on the average annual dwelling target to 2031 (total or infill as appropriate). To support comparison of the planned dwelling supply to the dwelling targets, only the number of dwellings estimated to be developable by 2031 is reported in the respective planned and emerging supply graphs in Sections 4 to 15. Some of the Priority Infrastructure Plan database yields were adjusted to align with the 30 June 2010 base date for the estimation of years supply. New dwelling approvals for the relevant quarters were used for these adjustments either up or down as required. A1.3 Emerging dwelling supply The emerging dwelling supply includes expected yields from planning actions currently in process, such as the preparation of structure plans and development schemes for SEQ Regional Plan Development Areas and Urban Development Areas, and various neighbourhood and local area plans in other locations, including infill areas. The yields are only those additional to the planned dwelling supply. Such yields are based on the advice of the relevant planning authority, whether the local government or ULDA. Where Priority Infrastructure Plan projection databases more recent than the broadhectare study were available, the emerging supply outside the Existing Urban Area, and outside the Urban Development Areas, has been based on the additional dwelling yields in the Priority Infrastructure Plan database, compared to the expected yields of the broadhectare study. Only the emerging supply to 2031 is reported in the respective planned and emerging supply graphs in Sections 4 to 15. This is to enable comparison of the combined planned and emerging dwelling supply to the dwelling targets, which are for the period
132 The number of dwellings reported for the emerging dwelling supply is commonly incomplete because some planning changes in process are not sufficiently progressed to estimate an additional dwelling yield. A1.4 Dwelling supply beyond 2031 Estimated dwelling yields beyond 2031 include: outside the Existing Urban Area, broadhectare study theoretical yields in excess of the expected yields, except that where there is a more recent Priority Infrastructure Plan projection database the yields of the Priority Infrastructure Plan database in excess of the broadhectare study are used to reflect supply emerging since the preparation of the broadhectare study (mostly undertaken in the latter half of 2008) inside the Existing Urban Area, where available, Priority Infrastructure Plan projection database yields beyond 2031 are used where available, other yields beyond 2031 as identified by the local government or ULDA are used for particular areas, including some SEQ Regional Plan Development Areas. This component of supply is not reported in the respective planned and emerging supply graphs of Sections 4 to 15, but is acknowledged separately in considering how to address any shortfalls in dwelling supply compared to the dwelling targets. A1.5 Current activity To enable comparison to the dwelling targets, which are for additional dwellings over the period 1 July 2006 to 30 June 2031, dwelling approvals for the period 1 July 2006 to 30 June 2010, referred to as current activity, are shown together with planned and emerging supply in the planned and emerging dwelling supply graphs in Sections 4 to
133 A2 Compilation of industrial land supply data Industrial land supply is based on data compiled for the Industrial Land Monitoring Program stocktake undertaken by OESR during The Industrial Land Monitoring Program classifies all industrial zones and local plan precincts in local government planning schemes based on their closest equivalent standard zone in the Queensland Planning Provisions. No current planning schemes use the Queensland Planning Provisions standard zones. Those standard zones include: low impact industry medium impact industry high impact industry noxious and hazardous industry waterfront marine industry high technology industry industry industry investigation. Non-industry zones with approval for predominantly industrial uses are also captured as industrial land supply. Where such approvals are located in an industry investigation equivalent area, those land areas are also reported as non-industry zones. The data represents circumstances as at 31 December The land supply is land available for new industrial development, including vacant and underutilised land. The approved industrial land supply includes: land subject to material change of use and reconfiguring a lot development permits vacant industrial lots registered in the last five years (excluding parcels greater than 10 hectares as being balance parcels likely to be subject to further subdivision before building development, unless there is local knowledge to the contrary). The planned industrial land supply includes the approved supply and all land zoned for industrial purposes, including relevant local plan precincts but excluding industry investigation equivalent zones. It also includes preliminary approvals, for predominantly industrial uses, that override the planning scheme. The emerging industrial land supply includes: industry investigation equivalent zoned land SEQ Regional Plan Development Areas identified as for employment where appropriate, enterprise opportunity areas identified under the SEQ Regional Plan that are not currently zoned for industry. 132
134 A3 Limitations of data A3.1 Dwelling approvals New dwelling approvals as reported by the Australian Bureau of Statistics at the Census Collection District level are the best consistently available indicator for dwelling development activity, at the level of the geographic areas used in this report, but as a basis for comparison to the additional dwelling targets the data has the following shortcomings: new dwellings figures take no account of dwellings lost due to demolition or replacement the new dwellings approved will include a proportion of dwellings used by visitors, particularly in high tourist visitation areas such as the Gold and Sunshine Coasts, whereas the dwelling targets are based on dwellings expected to be required by residents a proportion of the new dwelling approvals will never be implemented for various reasons. The overall effect of these shortcomings is that the new dwelling approvals figures would generally need to exceed the pro rata dwelling targets in order to indicate effective matching of the targets. The actual nature of any adjustment to bring the new dwelling approvals figures into alignment with the additional dwelling targets is unclear and would vary across SEQ and over time. In the future it may be possible to consistently measure the actual increase in dwelling stock over time, e.g. through use of water, electricity, garbage or other connections and services information. Growth Management Queensland needs to work with OESR, local governments and other infrastructure agencies to assess the practicality of improving the measurement of the dwelling stock over time. Possibly in conjunction with projections of tourist dwelling demand, this would enable more accurate tracking of dwelling activity against the dwelling targets. A3.2 Differentiating categories of supply Due to the current limitations of available data sources, some dwelling yields that reflect draft plans not yet adopted as part of a planning scheme or equivalent may be included in the planned dwelling supply. Similarly, there may be some dwelling yields or land areas reported in the emerging dwelling or industrial land supply that effectively meet the criteria for planned supply. Growth Management Queensland needs to work with OESR, local governments and the ULDA to improve the capacity to differentiate between planned and emerging supply for future SEQ Growth Management Program annual reports. A3.3 Dwelling supply The planned dwelling supply outside the Existing Urban Area is partly based on the expected dwelling yield from the broadhectare studies prepared by OESR in consultation with local governments and the ULDA, mainly during mid late The basis for estimating the expected dwelling yield, relative to the theoretical dwelling yield, is generalised at the local government level and could be improved to give a better appreciation of realistic dwelling yields over time. Limited conflicts with the industrial land stocktake of the new Industrial Land Monitoring Program also need to be resolved. The planned dwelling supply inside the Existing Urban Area is based partly on a range of parcel-level analyses of potential dwelling yields prepared by local governments for strategic land use and infrastructure planning purposes, including some Priority Infrastructure Plan projection databases. Those databases reflect varying approaches to assumptions about densities, land availability and development probability. Also, for three local government areas, the best information available was compiled from a 133
135 range of sources at the time of the review of the SEQ Regional Plan in , with some adjustment to reflect recent planning changes. Some adjustments are based on indicative estimates only. Primarily to represent recent planning changes not reflected in the broadhectare study or Priority Infrastructure Plan projection databases (or equivalent), in some cases dwelling yields are based on overall estimates provided directly by the local governments or the ULDA for particular areas. Some such dwelling yields are indicative estimates only. It would be appropriate to develop a more consistent basis for assumptions about expected dwelling density, feasibility and probability to inform the creation of land supply and infrastructure demand projection databases in Queensland. Over time this could create a more consistent and reliable basis for measuring expected dwelling yields. A3.4 Industrial land supply The reported supply of available industrial land is drawn from data compiled for the Industrial Land Monitoring Program. Due to the diverse nature of industrial uses, and the variability over time of actual industrial land consumption, assessment of industrial land supply is inherently difficult. Additional analysis is needed to assess the suitability as well as the availability of zoned and allocated industrial land for future SEQ Growth Management Program annual reports. The SEQ Growth Management Program will work closely with the Industrial Land Analysis and Planning branch of the Coordinator General as part of the preparation of future SEQ Growth Management Program annual reports - to integrate data compiled for the Industrial Land Monitoring Program together with the findings of other detailed sub-regional studies undertaken by Industrial Land Analysis and Planning. This will enable robust and meaningful conclusions to be drawn to inform planning actions for consideration in relation to industrial land supply. A3.5 Constraints information Land supply and infrastructure demand projection databases, such as the broadhectare studies, Industrial Land Monitoring Program stocktake and Priority Infrastructure Plan projection databases drawn upon for this report, seek to exclude assumed constraints, such as steep slopes, flood prone land and areas of environmental value, from being counted as developable land (which could yield dwellings or support industrial development). There are limitations on the accuracy and completeness of the mapping of relevant constraints and the extent of constrained lands may change over time based on improved information and changing policies regarding constrained areas. The reported supplies of land and dwellings are therefore subject to change based on changing constraints information over time. 134
136 Definitions/abbreviations Approved supply Broadhectare studies Dwelling or industrial land supply that can be developed in accordance with an existing development permit (see section 2.2). As undertaken by OESR, identify the location, extent, area, timing of development and dwelling yield of all larger land parcels (larger than 2500 m 2 ) planned for residential use, including significant areas within the Existing Urban Area. The studies involve extensive consultation and collaboration with local governments, the Urban Development Institute of Australia (Queensland) (UDIA) and major developers. Dwelling yields for broadhectare parcels are estimated based on a number of factors, including local government planning scheme intent, existing approvals, reviews of available master plans and an analysis of residential densities achieved in comparable locations. Current activity Dual occupancy Dwelling Dwellings approvals Dwelling approvals for the relevant geographic area for the period 1 July 2006 to 30 June These dwelling numbers are used together with dwelling supply figures to 2031 to compare to the respective dwelling targets (which are additional dwellings for the period ). As defined in the Queensland Planning Provisions, means premises containing two dwellings on one lot (whether or not attached) where the use is primarily residential. Means a building or part of a building used or capable of being used as a self-contained residence. Dwelling approvals are those for new dwellings sourced from ABS via OESR ( Building Approvals). Statistics of building work approved are compiled from: permits issued by local governments and other principal certifying authorities contracts let or day labour work authorised by Commonwealth, state, semigovernment and local government authorities major building approvals in areas not subject to normal administrative approval, e.g. building on remote mine sites. Dwelling house Dwelling targets As defined in the Queensland Planning Provisions, means a residential use of premises for one household which contains a single dwelling. Unless the context indicates otherwise, means the relevant total or infill dwelling targets identified by the SEQ Regional Plan. The dwelling targets are a measure of the dwelling supply required to accommodate the projected dwelling demand in SEQ between 2006 and 2031, in accordance with the policies of the SEQ Regional Plan. Emerging planning changes The Department of Local Government and Planning in consultation with local governments and the Urban Land Development Authority (ULDA) have identified areas that are undergoing planning at various stages, e.g. drafting or first state interest check, to change dwelling yields from those reported as planned supply. These changes are tracked up to the date of compiling the relevant information for this report (October 2010), but always represent or affect supply expected to become available for development after the base date of 30 June
137 Emerging supply Existing Urban Area Infill Material Change of Use Multiple dwelling Intended to capture estimated dwelling yields or industrial land areas that are in various stages of allocation and planning for future development but do not yet meet the criteria for inclusion as planned supply (see Section 2.2). A special purpose statistical area developed for the purpose of the SEQ Regional Plan to define infill dwellings. Maps of the Existing Urban Area and an explanation of its derivation and use are available at Infill dwellings are dwelling houses, dual occupancy and multiple dwellings located within the Existing Urban Area. A type of development for which an application can be made and approval given under the Integrated Development Assessment System. As defined in the Queensland Planning Provisions, means a residential use of premises which contains three or more dwellings. For ease of presentation in this report, the numbers of multiple dwellings reported include the numbers of known dual occupancy dwellings. OESR Planned supply Pro rata target Office of Economic and Statistical Research (in Queensland Treasury). Intended to capture dwelling or industrial land supply which is consistent with the adopted planning scheme or equivalent, and a development permit for the measured form of development is able to be applied for and is likely to be approved (see Section 2.2). The cumulative total of additional dwellings that would be created, from 1 July 2006 up to the end of the respective quarter, if the additional dwellings identified by the target were developed at a constant rate over time between 1 July 2006 and 30 June Comparison of historical dwelling activity to the corresponding pro rata target provides a broad indication only of how areas are tracking in terms of being able to accommodate the projected dwelling demand to Actual dwelling demand and activity over any period may fall above or below the pro rata target without affecting the areas capacity to accommodate the projected dwelling demand by Reconfiguring a lot SEQ A type of development, including subdivision of land, for which an application can be made and approval given under the Integrated Development Assessment System. South East Queensland SEQ Regional Plan South East Queensland Regional Plan ULDA Uncompleted lots Urban Footprint Urban Land Development Authority Include residential lots that have been approved for subdivision by the local government but have not yet been produced, i.e. they have not yet proceeded to the stage of being sealed or certified by the local government as having met the conditions of the local government s approval. A regional land use category and regulatory boundary identified for the purpose of the SEQ Regional Plan. It identifies land that can meet the region s urban development needs to The Urban Footprint does not imply that all included land can be developed for urban purposes. 136
, Australian Bureau of Statistics unpublished dwelling approvals data, Residential Infill Development Profile (South East Queensland - No.")
138 Sources Queensland Government, Queensland's Future Population 2008 Edition, Residential Land and Dwelling Activity Profiles June Quarter 2010, South East Queensland Broadhectare Study 2009 edition 6 (updated to June 2010), Australian Bureau of Statistics unpublished dwelling approvals data, Residential Infill Development Profile (South East Queensland - No. 4) and data as compiled for the Industrial Land Monitoring Program (to December 2009). 137
Regulatory Impact Statement
 Regulatory Impact Statement Establishing one new special housing area in Queenstown under the Housing Accords and Special Housing Areas Act 2013. Agency Disclosure Statement 1 This Regulatory Impact Statement
QUEENSTOWN-LAKES DISTRICT HOUSING ACCORD
 QUEENSTOWN-LAKES DISTRICT HOUSING ACCORD Queenstown-Lakes Housing Accord 1. The Queenstown-Lakes Housing Accord (the Accord) between Queenstown-Lakes District Council (the Council) and the Government is
Dear Mr Nairn HIA is pleased to provide comments on the recently released Draft Alice Springs Regional Land Use Plan (Draft Plan).
.") 17 December 2015 Mr G Nairn Chair Northern Territory Planning Commission GPO Box 1680 DARWIN NT 0801 Submitted via email: ntpc@nt.gov.au Dear Mr Nairn HIA is pleased to provide comments on the recently
17 December 2015 Mr G Nairn Chair Northern Territory Planning Commission GPO Box 1680 DARWIN NT 0801 Submitted via email: ntpc@nt.gov.au Dear Mr Nairn HIA is pleased to provide comments on the recently
PIP practice note 1 planning assumptions. How to use this practice note. Planning assumptions. What are planning assumptions? Type.
 PIP PRACTICE NOTE 1 How to use this practice note This practice note has been prepared to support in the preparation or amending of planning assumptions within a priority infrastructure plan (PIP). It
Representation re: Sullivans Cove Planning Scheme /2015 Amendments - Macquarie Point Site Development: Affordable housing
 General Manager, Hobart City Council, GPO Box 503, Tas 7001 16 November, 2015 Representation re: Sullivans Cove Planning Scheme 1997-2/2015 Amendments - Macquarie Point Site Development: Affordable housing
RESIDENTIAL LAND SUPPLY MONITORING PROJECT
 RESIDENTIAL LAND SUPPLY MONITORING PROJECT G21 REGION (GEELONG) June 2015 Final Spatial Economics Principal Author: Dale Stokes Reviewed by: Peter Marshall (Director) 01/06/2015 Spatial Economics Pty Ltd
DCLG consultation on proposed changes to national planning policy
 Summary DCLG consultation on proposed changes to national planning policy January 2016 1. Introduction DCLG is proposing changes to the national planning policy framework (NPPF) specifically on: Broadening
LOCAL GOVERNMENT INFRASTRUCTURE PLAN SUPPORTING DOCUMENT PLANNING ASSUMPTIONS SUMMARY REPORT
 LOCAL GOVERNMENT INFRASTRUCTURE PLAN SUPPORTING DOCUMENT PLANNING ASSUMPTIONS SUMMARY REPORT 2000 2016 TABLE OF CONTENTS 1.0 INTRODUCTION... 1 1.1 PREAMBLE...1 1.2 BACKGROUND...1 1.3 OVERVIEW...2 2.0 IPSWICH
NORTH LEEDS MATTER 2. Response to Leeds Sites and Allocations DPD Examination Inspector s Questions. August 2017
 NORTH LEEDS MATTER 2 Response to Leeds Sites and Allocations DPD Examination Inspector s Questions August 2017 CLIENT: TAYLOR WIMPEY, ADEL REFERENCE NO: CONTENTS 1.0 INTRODUCTION 2.0 TEST OF SOUNDNESS
Qualification Snapshot CIH Level 3 Certificate in Housing Services (QCF)
") Qualification Snapshot CIH Certificate in Housing Services (QCF) The Chartered Institute of Housing (CIH) is an awarding organisation for national qualifications at levels 2, 3 and 4. CIH is the leading
Qualification Snapshot CIH Certificate in Housing Services (QCF) The Chartered Institute of Housing (CIH) is an awarding organisation for national qualifications at levels 2, 3 and 4. CIH is the leading
Our Focus: Your Future 2007 YEAR END HOUSING MONITORING AND SUBDIVISION STATUS REPORTS
 Town of Fort Erie Community & Development Services Our Focus: Your Future Prepared for Council-in-Committee Report No. CDS-011-08 Agenda Date February 4,2008 File No. 350204/350308 Subject 2007 YEAR END
Table of Contents. Appendix...22
 Table Contents 1. Background 3 1.1 Purpose.3 1.2 Data Sources 3 1.3 Data Aggregation...4 1.4 Principles Methodology.. 5 2. Existing Population, Dwelling Units and Employment 6 2.1 Population.6 2.1.1 Distribution
South East Queensland Regional Plan State planning regulatory provisions Current as at May 2014
 South East Queensland Regional Plan 2009 2031 State planning regulatory provisions Current as at May 2014 The Department of State Development, Infrastructure and Planning is responsible for driving the
 South Worcestershire Development Plan Examination Representation Form Additional Pages Consultation on Proposed Modifications to SWDP: 6 October 14 November 2014 South Worcestershire Councils Additional
Housing & Residential Intensification Study Discussion Paper Township of King
 Housing & Residential Intensification Study Discussion Paper Prepared by Planning Department January 2011 1.0 Background 1.1 Provincial Policies (Greenbelt and Growth Plan) Since 2001, the Province of
New challenges for urban renewal... Patrick Fensham Principal SGS Economics and Planning
 New challenges for urban renewal... Patrick Fensham Principal SGS Economics and Planning 27 March 2013 Housing supply a problem... The housing shortfall (gap) increased by 28,000 dwellings over the year
Table of Contents. Title Page # Title Page # List of Tables ii 6.7 Rental Market - Townhome and Apart ment Rents
 RESIDENTIAL MONITORING REPORT 2013 Table of Contents Title Page # Title Page # List of Tables ii 6.7 Rental Market - Townhome and Apart ment Rents 21 List of Figures iii 7.0 Other Housing Demands and Trends
South East Queensland Regional Plan 2017 ShapingSEQ
 South East Queensland Regional Plan 2017 ShapingSEQ Background paper 1: Grow September 2017 State of Queensland, September 2017. Published by the Department of Infrastructure, Local Government and Planning,
NSW Affordable Housing Guidelines. August 2012
 August 2012 NSW AFFORDABLE HOUSING GUIDELINES TABLE OF CONTENTS 1.0 INTRODUCTION... 1 2.0 DEFINITION OF KEY TERMS... 1 3.0 APPLICATION OF GUIDELINES... 2 4.0 PRINCIPLES... 2 4.1 Relationships and partnerships...
Riverton Properties Ltd Proposed Special Housing Area
 Riverton Properties Ltd Proposed Special Housing Area Housing Accords and Special Housing Areas Act 2013 Expression of Interest 1 This Expression of Interest is made on behalf of Riverton Properties Ltd,
Terms of Reference for the Regional Housing Affordability Strategy
 Terms of Reference for the Regional Housing Affordability Strategy Prepared by: CRD Regional Planning Services September, 2001 Purpose The Capital Region is one of the most expensive housing markets in
Cork Planning Authorities Joint Housing Strategy. Managers Joint Report on the submissions received and issues raised.
 Joint Housing Strategy Managers Joint Report on the submissions received and issues raised. June 2013 Introduction This is a joint report which reviews the submissions received during the public consultation
Leeds City Region Statement of Common Ground. August 2018
 Leeds City Region Statement of Common Ground August 2018 1.0 Introduction 1.1 The Leeds City Region partner councils have prepared this Statement of Common Ground in response to the requirement as set
2006 YEAR END HOUSING MONITORING AND SUBDIVISION STATUS REPORTS
 Town of Fort Erie Community & Development Services Our Focus: Your Future Prepared for: Council-in-Committee Report No.: CDS-022-07 Agenda Date: March 5, 2007 File No.: 350204/350308 Subject: 2006 YEAR
Housing Need in South Worcestershire. Malvern Hills District Council, Wychavon District Council and Worcester City Council. Final Report.
 Housing Need in South Worcestershire Malvern Hills District Council, Wychavon District Council and Worcester City Council Final Report Main Contact: Michael Bullock Email: michael.bullock@arc4.co.uk Telephone:
Community Housing Federation of Victoria Inclusionary Zoning Position and Capability Statement
 Community Housing Federation of Victoria Inclusionary Zoning Position and Capability Statement December 2015 Introduction The Community Housing Federation of Victoria (CHFV) strongly supports the development
Historic Environment Scotland Àrainneachd Eachdraidheil Alba
 The Schemes of Delegation from Scottish Ministers to Historic Environment Scotland Introduction This document sets out how Historic Environment Scotland shall fulfil the Scheme of Delegation for both properties
PROGRAM PRINCIPLES. Page 1 of 20
 PROGRAM PRINCIPLES Page 1 of 20 DEVELOPMENT OF THE PROGRAM PRINCIPLES The Program Development Project The Program Principles have been developed as part of the Planning Our Future Program Development Project
Planning Policy Guidance 3: Housing
 Planning Policy Guidance 3: Housing Contents Planning Policy Guidance Note 3: Housing...2 The Governments Objectives...3 Widening Housing Opportunity And Choice...4 Maintaining A Supply Of Housing...8
Local Government Area Statistics Report Suburban Brisbane
 Generated by: Investors Choice Mortgages Australian Credit Licence # 391985 VIC Contact Details Jane Slack Smith Local Government Area Statistics Report Suburban Brisbane Mobile: 0432 687 560 Ph: 1800
Submission July 2014 Response to the City of Cockburn Draft Housing Affordability and Diversity Strategy
 Submission July 2014 Response to the City of Cockburn Draft Housing Affordability and Diversity Strategy Chantal Roberts Organisation Email Executive Officer Shelter WA eo@shelterwa.org.au About Shelter
SELWYN HOUSING ACCORD
 SELWYN HOUSING ACCORD Selwyn Housing Accord 1 The Selwyn Housing Accord between the Selwyn District Council (the Council) and the Government is intended to increase land and housing supply in the Selwyn
Additional Policies & Objectives for Local Area Plans Dunshaughlin LAP. Dunshaughlin
 Dunshaughlin Strategic Policies SP 1 To operate an Order of Priority for the release of residential lands in compliance with the requirements of CS OBJ 6 of the County Development Plan as follows: i) The
Welsh Government Housing Policy Regulation
 www.cymru.gov.uk Welsh Government Housing Policy Regulation Regulatory Assessment Report August 2015 Welsh Government Regulatory Assessment The Welsh Ministers have powers under the Housing Act 1996 to
shortfall of housing land compared to the Core Strategy requirement of 1000 dwellings per 1 Background
 WIGAN CORE STRATEGY ADDITIONAL HEARING SESSION ADDRESSING SHORTFALL IN HOUSING SUPPLY- PROCEDURAL AND PRACTICAL IMPLICATIONS RESPONSE BY BARTON WILLMORE ON BEHALF OF PEEL HOLDINGS (LAND AND PROPERTY) LTD
Community & Infrastructure Services Committee
 REPORT TO: DATE OF MEETING: September 12, 2016 Community & Infrastructure Services Committee SUBMITTED BY: Alain Pinard, Director of Planning, 519-741-2200 ext. 7319 PREPARED BY: Natalie Goss, Senior Planner,
MAKING THE MOST EFFECTIVE AND SUSTAINABLE USE OF LAND
 165 SOC146 To deliver places that are more sustainable, development will make the most effective and sustainable use of land, focusing on: Housing density Reusing previously developed land Bringing empty
PIA would be pleased to meet with the Department to outline any aspect of our submission. Please contact myself or John Brockhoff on
 31 January 2018 Deborah Brill Director, Housing and Infrastructure Policy Department of Planning and Environment PO Box 39 SYDNEY NSW 2001 Dear Deborah, PIA Submission: Affordable Housing SEPP 70 Amendments
Assets, Regeneration & Growth Committee 17 March Development of new affordable homes by Barnet Homes Registered Provider ( Opendoor Homes )
") Assets, Regeneration & Growth Committee 17 March 2016 Title Report of Wards Status Urgent Key Enclosures Officer Contact Details Development of new affordable homes by Barnet Homes Registered Provider
Assets, Regeneration & Growth Committee 17 March 2016 Title Report of Wards Status Urgent Key Enclosures Officer Contact Details Development of new affordable homes by Barnet Homes Registered Provider
4 York Region Housing Incentives Study
 Clause 4 in Report No. 15 of Committee of the Whole was adopted, without amendment, by the Council of The Regional Municipality of York at its meeting held on October 15, 2015. 4 Committee of the Whole
Corporate Services Planning and Economic Development. Memorandum
 Corporate Services Planning and Economic Development Memorandum TO: FROM: Committee of the Whole Paul Freeman, Chief Planner DATE: June 21, 2018 RE: York Region C omments on Draft Provinci al Guidance
Toowoomba Property Factsheet
 Toowoomba Property Factsheet 1st Half 2018 OVERVIEW Located 125 kilometres west of Brisbane s CBD, Toowoomba is the main urban centre for the Toowoomba Regional area. In 2016 the labour force (59.6%) was
South African Council for Town and Regional Planners
 TARIFF OF FEES South African Council for Town and Regional Planners PLEASE NOTE : THE TARIFF OF FEES WAS APPROVED BY THE COUNCIL CHAPTER 10 : TARIFF OF FEES 10.1 INTRODUCTION 10.1.1 General This tariff
North Northamptonshire Authorities Monitoring Report (AMR) 2015/16. Assessment of Housing Land Supply ( )
 2015/16. Assessment of Housing Land Supply ( )") North Northamptonshire Authorities Monitoring Report (AMR) 2015/16 Assessment of Housing Land Supply (2017-22) April 2017 1.0 Introduction Purpose of Report 1.1 The National Planning Policy Framework (NPPF)
North Northamptonshire Authorities Monitoring Report (AMR) 2015/16 Assessment of Housing Land Supply (2017-22) April 2017 1.0 Introduction Purpose of Report 1.1 The National Planning Policy Framework (NPPF)
Council 20 December Midlothian Strategic Housing Investment Plan 2017/ /22. Report by Eibhlin McHugh, Joint Director, Health & Social Care
 Council 20 December 2016 Midlothian Strategic Housing Investment Plan 2017/18 2021/22 Report by Eibhlin McHugh, Joint Director, Health & Social Care 1 Purpose of Report This Report summarises the key points
Note on housing supply policies in draft London Plan Dec 2017 note by Duncan Bowie who agrees to it being published by Just Space
 Note on housing supply policies in draft London Plan Dec 2017 note by Duncan Bowie who agrees to it being published by Just Space 1 Housing density and sustainable residential quality. The draft has amended
Extending the Right to Buy
 Memorandum for the House of Commons Committee of Public Accounts Department for Communities and Local Government Extending the Right to Buy MARCH 2016 4 Key facts Extending the Right to Buy Key facts 1.8m
Rochford Core Strategy Schedule of Changes
 Rochford Core Strategy Schedule of Changes The changes below are expressed either in the conventional form of strikethrough for deletions and underlining for additions of text, or by specifying the change
PROPOSED DISPOSAL OF ALLOCATED HOUSING SITE AT STIRCHES, HAWICK TO EILDON HOUSING ASSOCIATION FOR THE DEVELOPMENT OF EXTRA CARE HOUSING.
 PROPOSED DISPOSAL OF ALLOCATED HOUSING SITE AT STIRCHES, HAWICK TO EILDON HOUSING ASSOCIATION FOR THE DEVELOPMENT OF EXTRA CARE HOUSING. Report by the Services Director Regulatory Services EXECUTIVE 17
STRATEGIC HOUSING INVESTMENT PLAN SUBMISSION. 16 October Report by the Service Director Regulatory Services EXECUTIVE COMMITTEE
 STRATEGIC HOUSING INVESTMENT PLAN 2019-2024 SUBMISSION Report by the Service Director Regulatory Services EXECUTIVE COMMITTEE 16 October 2018 1 PURPOSE AND SUMMARY 1.1 This report seeks approval of the
BLP PRESENTATION TO THE MACQUARIE PROPERTY CONFERENCE
 ASX Release 20 September 2007 BLP PRESENTATION TO THE MACQUARIE PROPERTY CONFERENCE Please find following the Babcock & Brown Residential Land Partners (ASX: BLP) presentation to the Macquarie Property
Terms of Reference for Town of Caledon Housing Study
 1.0 Introduction Terms of Reference for Town of Caledon Housing Study The Town of Caledon is soliciting proposals for a comprehensive Housing Study. Results of this Housing Study will serve as a guiding
New Residential Zones their application and implications. Elizabeth Lewis David Vorchheimer
 New Residential Zones their application and implications Presented by Paul Buxton Elizabeth Lewis David Vorchheimer 14 June 2013 Outline Background / context MAC recommendations, Minister s response, work
UK Housing Awards 2011
 UK Housing Awards 2011 Excellence in Housing Finance and Development: Finalist North Lanarkshire Council: Building For The Future Summary North Lanarkshire Council has been proactive in establishing, developing
Bargara Property Factsheet
 Bargara Property Factsheet 1st Half 2018 OVERVIEW Bargara* is located in the Bundaberg Region of south-east Queensland, approximately 384km north of Brisbane s CBD. Over the last 7 years the population
2. Draft Settlement Boundaries Planning Policy and local principles
 Housing Information 1. Cornwall Local Plan policy position: Cornwall Local Plan sets down key targets for the provision of homes where they can best meet need and sustain the role and function of local
City Plan Sub- Committee Report
 AGENDA ITEM: Date: 21 st July 2016 City Plan Sub- Committee Report Classification: Title: Report of: Cabinet Member Portfolio: Wards Affected: City for All Key Decision: Financial Summary: Report Author
PROJECT INITIATION DOCUMENT
 Project Name: Housing Futures Phase Two Project Sponsor: Steve Hampson Project Manager: Denise Lewis Date Issued: 15 February 2008 Version No: 1 Background: At Full Council on 31 January 2008 the following
Settlement Pattern & Form with service costs analysis Preliminary Report
 Settlement Pattern & Form with service costs analysis Preliminary Report Prepared for Regional Planning Halifax Regional Municipality by Financial Services, HRM May 15, 2004 TABLE OF CONTENTS INTRODUCTION...
Agreements for the Construction of Real Estate
 HK(IFRIC)-Int 15 Revised August 2010September 2018 Effective for annual periods beginning on or after 1 January 2009* HK(IFRIC) Interpretation 15 Agreements for the Construction of Real Estate * HK(IFRIC)-Int
City of Winnipeg Housing Policy Implementation Plan
 The City of Winnipeg s updated housing policy is aligned around four major priorities. These priorities are highlighted below: 1. Targeted Development - Encourage new housing development that: a. Creates
CONTENTS. Recommendation One Provision of Professional Development and Mentoring Opportunities
 CONTENTS Recommendation One Provision of Professional Development Mentoring Opportunities 01 Recommendation two Develop an Integrated Early Years Network 02 Recommendation THREE Develop a Pool of Qualified
Creswick Property Factsheet
 Creswick Property Factsheet 1st Half 2018 OVERVIEW Creswick, located 129km north west of Melbourne is 430m above sea level. A population of 3,170 was recorded in the 2016 ABS census. The area provides
Christchurch Housing Accord Monitoring Report. For quarter ending June 2015
 Christchurch Housing Accord Monitoring Report For quarter ending June 2015 Executive Summary This report provides an overview of the Christchurch housing market and an update on priority Accord actions.
SOCIAL SUSTAINABILITY THROUGH AFFORDABLE HOUSING IN SOUTH AUSTRALIA. Alice Lawson. Urban Renewal Authority, South Australia
 SOCIAL SUSTAINABILITY THROUGH AFFORDABLE HOUSING IN SOUTH AUSTRALIA Alice Lawson Urban Renewal Authority, South Australia Alice.Lawson@dcsi.sa.gov.au Paper Presented at the Planning Institute of Australia
Strategic Housing Market Assessment South Essex. Executive Summary. May 2016
 Strategic Housing Market Assessment South Essex Executive Summary May 2016 Executive Summary 1. Turley in partnership with specialist demographic consultancy Edge Analytics were commissioned by the Thames
LOT 30 TREEBY ROAD ANKETELL WA 6167
 FREMANTLE LOT 30 TREEBY ROAD ANKETELL WA 6167 COCKBURN CITY SHOPPING PERTH CBD AUBIN GROVE TRAIN STATION PROPOSED DISTRICT SHOPPING CENTRE SATTERLEY'S HONEYWOOD DEVELOPMENT LOT 30 TREEBY ROAD PROPOSED
Appendix. Housing Strategy
 Appendix Housing Strategy 4 Contents Executive Summary 28 1.0 INTRODUCTION 1.1 Review of Meath County Housing Strategy 2007-2013 29 1.1.1 Population 29 1.1.2 Households 30 1.1.3 Housing Completions to
Scheme of Service. for. Housing Officers
 REPUBLIC OF KENYA Scheme of Service for Housing Officers APPROVED BY THE PUBLIC SERVICE COMMISSION AND ISSUED BY THE PERMANENT SECRETARY MINISTRY OF STATE FOR PUBLIC SERVICE OFFICE OF THE PRIME MINISTER
Planning & Strategy 10 May Report for Agenda Item 1
 Planning & Strategy 10 May 2018 Department: Planning & Development Report for Agenda Item 1 Housing & Business Development Capacity Assessments Purpose The purpose of this report is to receive the results
Trip Rate and Parking Databases in New Zealand and Australia
 Trip Rate and Parking Databases in New Zealand and Australia IAN CLARK Director Flow Transportation Specialists Ltd ian@flownz.com KEYWORDS: Trip rates, databases, New Zealand developments, common practices
ACCESSIBLE HOUSING OPTIONS PAPER
 ACCESSIBLE HOUSING OPTIONS PAPER December 2018 Limited 2018. Limited ABN 68 137 130 182 Level 2, 44 Sydney Avenue, FORREST ACT 2603 PO Box 7170, YARRALUMLA ACT 2600 T: +61 2 6202 8888, F: +61 2 6202 8877,
Residential Intensification in Established Neighbourhoods Study (RIENS)
") Residential Intensification in Established Neighbourhoods Study (RIENS) EXECUTIVE SUMMARY In December 2015, the City of Kitchener retained Meridian Planning Consultants to undertake the Residential Intensification
Residential Intensification in Established Neighbourhoods Study (RIENS) EXECUTIVE SUMMARY In December 2015, the City of Kitchener retained Meridian Planning Consultants to undertake the Residential Intensification
Promoting informed debate around infill housing in Australian cities
 Promoting informed debate around infill housing in Australian cities 1 SGS has long been interested in promoting infill housing in Australian cities. This support reflects the recognised net benefits infill
Strata Titles Act Reform Consultation Summary
 Strata Titles Act Reform Consultation Summary landgate.wa.gov.au Strata Titles Act Reform - Consultation Summary Overview The State Government has set strata reform as a key priority and Landgate has been
Proposed Strategic Housing and Employment Land Availability Assessment (SHELAA) Methodology 2018
 Methodology 2018") Proposed Strategic Housing and Employment Land Availability Assessment (SHELAA) Methodology 2018 1.1 This section of the report sets out the methodology to be used in preparing the three South Worcestershire
Proposed Strategic Housing and Employment Land Availability Assessment (SHELAA) Methodology 2018 1.1 This section of the report sets out the methodology to be used in preparing the three South Worcestershire
Waterford City and County Council Vacant Homes Action Plan 2017
 Waterford City and County Council Vacant Homes Action Plan 2017 1. Introduction The high demand for residential properties on the property market, slow rate of new build and deepening housing crisis across
Assets, Regeneration & Growth Committee 11 July Development of new affordable homes by Barnet Homes Registered Provider ( Opendoor Homes )
") Assets, Regeneration & Growth Committee 11 July 2016 Title Report of Wards Status Urgent Key Enclosures Officer Contact Details Development of new affordable homes by Barnet Homes Registered Provider (
Assets, Regeneration & Growth Committee 11 July 2016 Title Report of Wards Status Urgent Key Enclosures Officer Contact Details Development of new affordable homes by Barnet Homes Registered Provider (
Housing Development Data Analysis September 2013
 Housing Development Data Analysis Prepared by the Department of Transport, Planning and Local Infrastructure for the City of Greater Dandenong Based on Housing Development Data 2004-2011 2 Contents 1.
PROPOSED DRAFT VARIATION NO. 5 MEATH COUNTY DEVELOPMENT PLAN
 PROPOSED DRAFT VARIATION NO. 5 MEATH COUNTY DEVELOPMENT PLAN 2013-2019 21 st NOVEMBER 2018 1.0 INTRODUCTION The Meath County Development Plan 2013-2019 was adopted on the 17 th December 2012 and came
DRAFT FEASIBILITY REPORT CENTRAL HILL ESTATE LONDON BOROUGH OF LAMBETH
 DRAFT FEASIBILITY REPORT For the Project At Prepared On Behalf Of LONDON BOROUGH OF LAMBETH Date: 6 th July 2016 Reference: 14/124 Central Hill Version 5 Version Control Version Date Author Page No(s)
Wellington Housing Accord Monitoring Report 4
 Wellington Housing Accord Monitoring Report 4 July 215 to June 216 Based on: building consent data to month ended June 216 new section data to month ended June 216 Executive Summary This monitoring report
LAND MONITOR REPORT
 2016-2017 LAND MONITOR REPORT Wagga Wagga Land Monitor Report 2016-2017 Contents Introduction 3 Housing Industry Association Wagga Branch 3 Definitions 4 Accuracy & Data Interpretation 5 Disclaimer 5 Opteon
Affordable Homes Service Plan 2016/17 and 2017/18
 Report To: Housing Portfolio Holder 15 March 2017 Lead Officer: Director of Housing Purpose Affordable Homes Service Plan 2016/17 and 2017/18 1. To provide the Housing Portfolio Holder with an update on
R E Q U E S T F O R P R O P O S A L S
 P.O. Box 3209, Houghton, 2041 Block A, Riviera Office Park, 6-10 Riviera Road, Riviera R E Q U E S T F O R P R O P O S A L S M A R K E T S U R V E Y T O I N F O R M R E S I D E N T I A L H O U S I N G
2019 DC Study External Stakeholder Committee Minutes
 Date / Time: October 10 th, 2017 1:30pm 3:30pm Location: Committee Room #1, 2 nd Floor City Hall 2019 DC Study External Stakeholder Committee Minutes Attended: George Kotsifas (Chair), Lois Langdon, Sandy
Australian home size hits 22-year low
 Australian home size hits 22-year low CommSec Home Size Trends Report Economics November 16 2018 The average floor size of an Australian home (houses and apartments) has fallen to a 22-year low. Data commissioned
Barbara County Housing Element. Table 5.1 Proposed Draft Housing Element Goals, Policies and Programs
 Table 5.1 Proposed Draft Housing Element Goals, Policies and Programs Goal 1: Enhance the Diversity, Quantity, and Quality of the Housing Supply Policy 1.1: Promote new housing opportunities adjacent to
ROLE OF SOUTH AFRICAN GOVERNMENT IN SOCIAL HOUSING. Section 26 of the Constitution enshrines the right to housing as follows:
 1 ROLE OF SOUTH AFRICAN GOVERNMENT IN SOCIAL HOUSING Constitution Section 26 of the Constitution enshrines the right to housing as follows: Everyone has the right to have access to adequate housing The
Reforming Building & Planning Laws. Submission to the West Australian Government. Draft Perth and Peel Green Growth Plan for 3.
 Reforming Building & Planning Laws Submission to the West Australian Government Draft Perth and Peel Green Growth Plan for 3.5 Million 13 th May 2016 ABOUT THE HOUSING INDUSTRY ASSOCIATION... 3 1. PERTH
REPRESENTATIONS TO SHEPWAY DISTRICT COUNCIL (SDC) PLACES AND POLICIES LOCAL PLAN SUBMISSIONS DRAFT SDC/COZUMEL ESTATES LIMITED
 PLACES AND POLICIES LOCAL PLAN SUBMISSIONS DRAFT SDC/COZUMEL ESTATES LIMITED") REPRESENTATIONS TO SHEPWAY DISTRICT COUNCIL (SDC) PLACES AND POLICIES LOCAL PLAN SUBMISSIONS DRAFT SDC/COZUMEL ESTATES LIMITED OTTERPOOL PARK 19 MARCH 2018 Quod Limited Contents 1 Introduction 3 2 Site
REPRESENTATIONS TO SHEPWAY DISTRICT COUNCIL (SDC) PLACES AND POLICIES LOCAL PLAN SUBMISSIONS DRAFT SDC/COZUMEL ESTATES LIMITED OTTERPOOL PARK 19 MARCH 2018 Quod Limited Contents 1 Introduction 3 2 Site
Ingleburn Property Factsheet
 Ingleburn Property Factsheet 1st Half 2018 OVERVIEW Ingleburn is a suburb situated approx. 44 kilometres from the Sydney CBD. This small hub is an ideal location for families and professionals due to its
Document under Separate Cover Refer to LPS State of Housing
 Document under Separate Cover Refer to LPS5-17 216 State of Housing Contents Housing in Halton 1 Overview The Housing Continuum Halton s Housing Model 3 216 Income & Housing Costs 216 Indicator of Housing
CASEY PLANNING SCHEME AMENDMENT C219
 Who is the planning authority? Planning and Environment Act 1987 CASEY PLANNING SCHEME AMENDMENT C219 EXPLANATORY REPORT This amendment has been prepared by the, which is the planning authority for this
Flinders Avenue, Lara Planning Scheme Amendment Combined Application for Rezoning and Multi-Lot Subdivision Reference : Decembe
 143-179 Flinders Avenue, Lara Planning Scheme Amendment Combined Application for Rezoning and Multi-Lot Subdivision Reference: 14134-03 TGM Group Geelong Melbourne Ballarat 1/27-31 Myers Street (PO Box
Statements on Housing 25 April Seanad Éireann. Ministers Opening Statement
 Statements on Housing 25 April 2018 Seanad Éireann Ministers Opening Statement Overall Context I d like to thank the House for this important opportunity to update you on housing and related matters to-day.
THE CIT Y OF GREATER GEELONG SETTLEMENT STRATEGY
 THE CIT Y OF GREATER GEELONG SETTLEMENT STRATEGY OCTOBER 2018 1 ACKNOWLEDGEMENTS The Greater Geelong municipality is located on the traditional lands of the Wadawurrung people. The land was created by
JOINT CORE STRATEGY FOR BROADLAND, NORWICH AND SOUTH NORFOLK EXAMINATION MATTER 3A GENERAL STRATEGY FOR THE GROWTH LOCATIONS
 Matter 3A General Strategy for the Growth Locations Representor No. 8826 JOINT CORE STRATEGY FOR BROADLAND, NORWICH AND SOUTH NORFOLK EXAMINATION MATTER 3A GENERAL STRATEGY FOR THE GROWTH LOCATIONS SUBMISSION
An Assessment of Sydney s Industrial Land Supply. A shortage of developable land has the potential to impact occupier location strategies
 An Assessment of Sydney s Industrial Land Supply A shortage of developable land has the potential to impact occupier location strategies At 4Q17 3 years 4.1% 37% 4 years Gross-take up above 1 million sqm
Impact Assessment (IA)
") Title: Permission in principle for development plans and brownfield registers IA No: RPC-3069(2)-CLG Lead department or agency: Department for Communities and Local Government Other departments or agencies:
Title: Permission in principle for development plans and brownfield registers IA No: RPC-3069(2)-CLG Lead department or agency: Department for Communities and Local Government Other departments or agencies: