Record house prices an early Christmas present to vendors, says REINZ
|
|
|
- Bertram Carr
- 5 years ago
- Views:
Transcription
, source of")
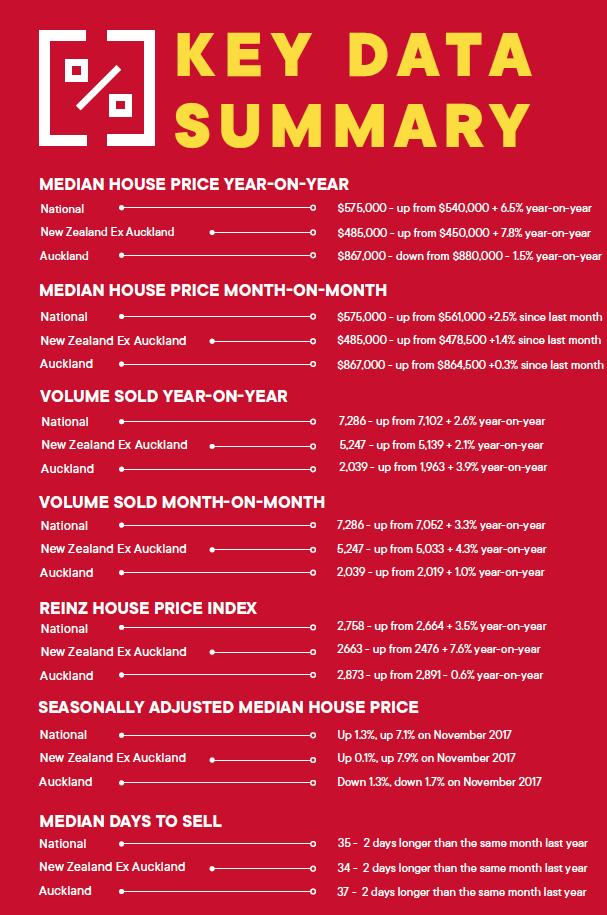
1 14 December 2018 For immediate release Record house prices an early Christmas present to vendors, says REINZ Vendors from around the country have been delivered an early Christmas present with record median prices achieved in six regions and another record median price set for the country in November, according to the latest data from the Real Estate Institute of New Zealand (REINZ), source of the most complete and accurate real estate data in New Zealand. The national median house price in November for residential properties was a record $575,000 up 6.5% from $540,000 at the same time last year. For New Zealand excluding Auckland, the median house price was a record $485,000 up 7.8% from $450,000 in November Auckland s median house price dropped -1.5% to $867,000, down from $880,000 in November 2017, but was up from last month by 0.3%. Additionally, six regions achieved a record price during November: Northland: +21.2% to $515,000 (up from $425,000 at the same time last year) Waikato: +8.0% to $529,000 (up from $490,000 at the same time last year) Hawke s Bay: +11.9% to $470,000 (up from $420,000 at the same time last year) Wellington: +11.5% to $613,000 (up from $550,000 at the same time last year) Tasman: +19.2% to $645,000 (up from $541,000 at the same time last year) Southland: +3.8% to $275,000 (up from $265,000 at the same time last year). Bindi Norwell, Chief Executive at REINZ says: For two months in a row now we ve seen record median prices set for New Zealand driven by extremely strong growth in some of the regions where demand for good properties continues to outstrip supply. In fact, prices rose annually in 14 out of 16 regions around the country the only exceptions were Auckland (-1.5%) and Canterbury (-3.3%). Of those 14 regions experiencing annual increases, 7 of them saw double digit increases showing the strength of the market, continues Norwell. While these record median prices will be a great early Christmas present for vendors selling their homes, they make hard reading for those first time buyers who are desperately saving to get onto the property market. However, with the likes of KiwiBuild and models such as BNZ s sharedownership scheme there is some light at the end of the tunnel for those first home buyers feeling locked out of the property market, she continues. Looking at the Auckland market, there were some areas that achieved strong prices during November including Auckland City s median price of $999,000 the highest price in 17 months, Franklin District saw the highest median price in 6 months of $700,000 and North Shore City had the highest median price in 8 months ($1,041,000). However, on the flip side, the Rodney District saw a year-on-year decrease of -11.3% and Manukau City had an annual fall of -2.2% points out Norwell.
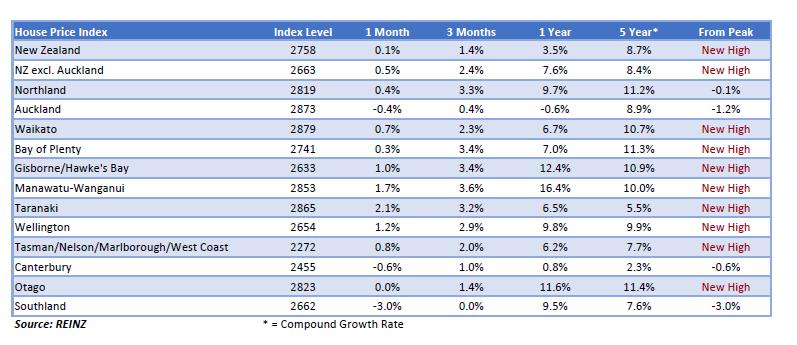
2 Good finish to spring, with volumes up 2.6% nationally The number of houses sold across the country increased by 2.6% year-on-year to 7,286 up from 7,102 (an additional 184 houses). For New Zealand excluding Auckland, the number of properties sold increased by 2.1% 108 more properties when compared to November 2017 (from 5,139 to 5,247). In Auckland, the number of properties sold increased by 3.9% or 76 more properties, from 1,963 in November 2017 to 2,039 in November Regions with the largest annual increases in sales volumes were: Gisborne: +39.3% (from 61 to 85 an additional 24 houses) West Coast: +28.6% (from 28 to 36 an additional 8 houses) Bay of Plenty: +17.4% (from 454 to 533 an additional 79 houses) Marlborough: +12.0% (from 83 to 93 an additional 10 houses). November represented another strong month of property sales, with annual increases in volumes in 10 out of 16 regions, and from a national perspective, November saw the highest volume of sales across the country in six months, says Norwell. There were some standout results for a couple of the regions with Gisborne s sales the highest number of properties sold in one month for 12 years and Taranaki s sales the highest number of properties sold in a month since March 2007 showing the buoyancy in some of these popular regions, continues Norwell. However, there were some areas that had a slower end to spring with volumes down year-on-year including Nelson (-22.3%), Canterbury (-6.9%), Southland (-5.3%), Otago (-4.5%) and Wellington (- 1.2%), concludes Norwell. REINZ House Price Index (HPI) The REINZ House Price Index for New Zealand, which measures the changing value of property in the market, increased 3.5% year-on-year to 2,758 a new record high for the country. The HPI for New Zealand excluding Auckland increased 7.6% from November 2017 to a new record high of 2,663. The Auckland HPI decreased -0.6% year-on-year to 2,873. The REINZ HPI again saw 11 out of 12 regions experience an increase over the past 12 months, highlighting the continued strength of the property market. The only exception was Auckland. In November the Manawatu/Wanganui region again had the highest annual growth rate, a 16.4% increase to a new record high of 2,853, followed by Gisborne/Hawke s Bay in second place with an annual growth rate of 12.4% to a new record high of 2,633 and in third place was Otago with an 11.6% annual increase to a new record high of 2,823. Interestingly, Waikato s index level of 2,879 (a 6.7% increase since November last year) has now overtaken Auckland s index level of 2,873 the first time Auckland s index level has been overtaken since March Days to Sell The median number of days to sell a property nationally increased by 2 days from 33 to 35 when compared to November last year.
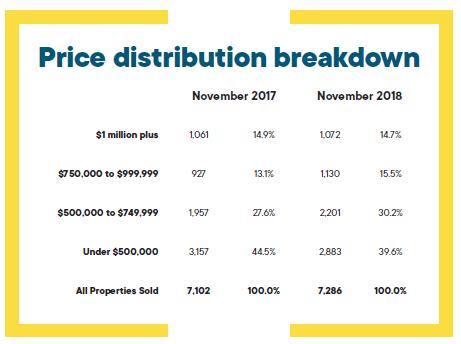
3 For New Zealand excluding Auckland, the median days to sell increased on an annual basis by 2 days from 32 to 34. Auckland saw the median number of days to sell a property increase by 2 days to 37 days (up from 35 in November 2017). This is the lowest median days to sell since December For the fifth month in a row, Southland has the lowest days to sell of all regions at 23 days, down from 29 at the same time last year. Auctions Auctions were used in 15.3% of all sales across the country in November, with 1,112 properties selling under the hammer this is down from the same time last year, when 17.4% of properties (1,235) were sold via auction. For the tenth month in a row, Gisborne had the highest percentage of auctions across the country with 50.6% (or 43 properties) in the region sold under the hammer up from 37.7% (23 properties) in November Auckland saw the second largest percentage of auctions on 25.7% (524 properties) down from 33.3% in November 2017 (653 properties). The Bay of Plenty maintained its spot of having the third highest level of auctions in the country with 20.1% (111 properties) sold under the hammer, down from 23.1% (105 properties) for the same period last year. Inventory The number of properties available for sale nationally decreased by -0.5% from 27,488 to 27,361 a decrease of 127 properties compared to 12 months ago. This is the first decrease in inventory in 3 months. November again saw 7 regions with an annual increase in inventory levels. Regions with the largest increase were: Marlborough: +12.2% from 327 to 367 an additional 40 properties Nelson: +8.5% from 413 to 448 an additional 35 properties Northland: +8.1% from 1,337 to 1,445 an additional 108 properties. Regions with the biggest falls in inventory were: Gisborne: -28.2% from 163 to fewer properties Otago: -24.5% from 756 to fewer properties Manawatu/Wanganui: -21.4% from 1,137 to fewer properties. Wellington again has the lowest level of inventory with 7 weeks inventory, followed by Otago and Gisborne on 8 weeks inventory available to prospective purchasers. Price Bands The number of homes sold for less than $500,000 across New Zealand fell from 44.5% of the market (3,157 properties) in November 2017 to 39.6% of the market (2,883 properties) in November This is the first time the percentage of properties sold for less than $500,000 has fallen below the 40% mark. The number of properties sold in the $500,000 to $750,000 bracket increased from 27.6% in November 2017 (1,957 properties) to 30.2% in November 2018 (2,201 properties).
4 At the top end of the market, properties sold for more than $1 million decreased marginally from 14.9% in November 2017 (1,061 houses) to 14.7% in November 2018 (1,072 houses). ENDS Notes to Editors The monthly REINZ residential sales reports remain the most recent, complete and accurate statistics on house prices and sales in New Zealand. They are based on actual sales reported by real estate agents. These sales are taken as of the date that a transaction becomes unconditional, up to 5:00pm on the last business day of the month. Other surveys of the residential property market are based on information from Territorial Authorities regarding settlement and the receipt of documents by the relevant Territorial Authority from a solicitor. As such, this information involves a lag of four to six weeks before the sale is recorded. For further information, please contact Dee Crooks, Head of Communications at REINZ, on
5
6
7
Real estate industry sees highest annual volume increase in 23 months
 11 May 2018 For immediate release Real estate industry sees highest annual volume increase in 23 months The number of properties sold in April 2018 across New Zealand increased by 6.6% compared to the
House prices rise 6.9% across New Zealand according to latest REINZ figures
 14 March 2018 For immediate release House prices rise 6.9% across New Zealand according to latest REINZ figures The median house price for New Zealand rose 6.9% in February to $530,000 up from $496,000
$27k price increase sees NZ hit new record median price in May says REINZ
 14 June 2018 For immediate release $27k price increase sees NZ hit new record median price in May says REINZ A year-on-year price increase of $27,000 has seen New Zealand achieve a new record median house
Strong end to 2017, with house prices up 5.8% in December says REINZ
 18 January 2018 Strong end to 2017, with house prices up 5.8% in December says REINZ Median house prices across New Zealand rose by 5.8% year-on-year to $550,000 up from $520,000 in December 2016 and median
Lowest sales volumes in 8 months a result of extremely low listings in July says REINZ
 11 October 2018 For immediate release Lowest sales volumes in 8 months a result of extremely low listings in July says REINZ The low number of new listings in July has meant that the number of houses sold
REINZ statistics: Auckland price growth slowing, regional strong growth continues
 13 July 2017 For immediate release REINZ statistics: price growth slowing, regional strong growth continues New Zealand s property market is showing all the signs of being a two-tier market with median
Sales volumes see seasonal drop in January as Auckland & National median house prices rise year-on-year
 REINZ Real Estate Institute of New Zealand February 2017 Sales volumes see seasonal drop in January as & median house prices rise year-on-year Bindi Norwell, REINZ CEO ers are once again starting to put
report New Zealand property
 report New Zealand property July 2018 issued 1 August 2018 overview Interest in homes for sale warms in July. Search for properties back to summertime levels. Searches for properties in July on realestate.co.nz
New Zealand Property Report. June
 New Zealand Property Report June 2016 The Overview Scarcity of houses for sale nationally creates sellers market. Realestate.co.nz statistics show demand and prices up, supply down. The average asking
report New Zealand property
 report New Zealand property June 2018 issued 3 July 2018 overview New property listings drop significantly in June, while asking prices and buyer interest hold steady. The Auckland region records a fall
Inventory of unsold houses drops to 6 year low
 1st July 2013 Inventory of unsold houses drops to 6 year low New listings stall After witnessing a surge of fresh listings in May, June saw listings stall, with just 9,082 listings coming to the market.
MONTHLY HOUSE PRICE INDEX REPORT
 MONTHLY HOUSE PRICE INDEX REPORT 1 4 J U N E 2018 REINZ Real Estate Institute of New Zealand REINZ HOUSE PRICE INDEX (HPI) As one of the country s foremost authorities on real estate data, we are proud
report New Zealand property
 report New Zealand property January 2018 issued 1 February 2018 overview New Zealand property market in major centres stays cool over hot summer, while regions are pumping Real-time statistics from realestate.co.nz
Sellers set a new record high asking price, as inventory drops to near record low
 1st May 2013 Sellers set a new record high asking price, as inventory drops to near record low Asking prices reach new high The seasonally adjusted asking price rose in April to a new record high of $447,275
report New Zealand property
 report New Zealand property February 2018 issued 1 March 2018 Lifestyle property a potential option in a relatively static housing market A surge in the number of lifestyle properties listed for sale nationally
report New Zealand property
 report New Zealand property April 2018 issued 1 May 2018 overview A rise in new property listings nationally is strongly underpinned by the Canterbury and Wellington regions Real-time data from realestate.co.nz
MONTHLY HOUSE PRICE INDEX REPORT
 MONTHLY HOUSE PRICE INDEX REPORT 1 2 O C T O B E R 2017 REINZ Real Estate Institute of New Zealand INTRODUCING REINZ HOUSE PRICE INDEX (HPI) As one the country s foremost authorities on real estate data,
14 N O V E M B E R
 14 N O V E M B E R 2 0 1 8 REINZ HOUSE PRICE INDEX (HPI) As one of the country s foremost authorities on real estate data, we are proud to bring you the REINZ HPI (House Price Index). It provides a level
BNZ-REINZ Residential Market Survey ISSN
 ISSN 2253-3656 13 2012 Mission Statement To help Kiwi businesspeople and householders make informed financial decisions by discussing the economy in a language they can understand. Market Strength Continues
Commentary. Regional Summary Asking Price
 Inventory recovers slightly as national asking prices ease Asking prices ease Nationally average asking prices of new listings eased in April. The seasonally adjusted asking price fell by 1.4% to $477,460,
Auckland rents kick back into gear
 Media Release 24 May 2016 Auckland rents kick back into gear The New Zealand rental market kicked back into gear in April as the median weekly asking rent increased by $10 according to the latest Trade
Rents leap to end 2016 on a record high
 Media Release 16 January 2017 Rents leap to end 2016 on a record high December was another tough month for tenants in New Zealand with the national median weekly rent jumping to a record $450, according
Auckland property cools further as summer rolls on
 Media Release 22 February 2017 Auckland property cools further as summer rolls on The Auckland property market continues to cool, with the Trade Me Property Price Index reporting the average asking price
Housing and Construction Quarterly
 New Zealand Housing and Construction Quarterly September 2014 Contents Housing Market 2 House Values by Region 3 Rents by Region 4 Rents by Bedroom and Region 5 Price and Rent Comparisons 6 Housing Affordability
Housing and Construction Quarterly
 New Zealand Housing and Construction Quarterly March 2015 Contents 2 Quarterly Highlights Housing Market 3 House Values by Region 4 Rents by Region 5 Rents by Bedroom and Region 6 Price and Rent Comparisons
New House Owners Satisfaction Survey
 Study Report SR374 [2017] New House Owners Satisfaction Survey Matthew Curtis 1222 Moonshine Rd RD1, Porirua 5381 Private Bag 50 908 Porirua 5240 New Zealand branz.nz The work reported here was funded
Renters in Auckland $12,500 p.a better off than homeowners
 Media Release 19 November 2015 Renters in Auckland $12,500 p.a better off than homeowners It is cheaper to rent a house than buy a house across New Zealand, but the disparity is most pronounced in Auckland
Housing affordability
 Background Housing affordability A paper prepared by the PPTA executive For the 2008 Annual Conference, the Auckland region prepared a paper on the issue of housing affordability, calling for a taskforce
Report ER5 Can Work, Cannot Afford to Buy the Intermediate Housing Market
 External Research Report Issue Date: 31/08/2015 ISSN: 2423-0839 Report ER5 Can Work, Cannot Afford to Buy the Intermediate Housing Market Ian Mitchell Project LR0484 Livingston and Associates Ltd funded
Queenstown-Lakes Data REINZ SLIDE 1
 Queenstown-Lakes Data REINZ SLIDE 1 OTAGO REGION SCORECARD Net Migration (year to) Unemployment (Q3) Weekly Earnings (Median) House Prices (Median) Sep 16: 1,954 Q3 2016: 3.7% 2016: $1,054 YE Sep 16: $337k
2013 Year-End Market Report
 2013 Year-End Market Report The voice of real estate in Central Virginia CAAR Member Copy Expanded Edition Charlottesville Area Year-End 2013 Highlights: Yearly home sales in Greater Charlottesville were
nd Quarter Market Report
 2015 2 nd Quarter Market Report The voice of real estate in Central Virginia CAAR Member Copy Expanded Edition Charlottesville Area 2 nd Quarter 2015 Highlights: Closed sales in the Greater Charlottesville
Housing and. Construction. Quarterly. Contents 2 Quarterly Highlights. New Zealand. June Key Issues. A Tale of Two Housing Markets.
 New Zealand Housing and Construction Quarterly June 2014 Contents 2 Quarterly Highlights Housing Market 3 House Values by Region 4 Rents by Region 5 Rents by Bedroom and Price by TA 6 Price and Rent Comparisons
Defence Force Superannuation Scheme (DFSS) Category A & C Determination for Previous Home Owner/Current Home Owner being posted elsewhere
 Category A & C Determination for Previous Home Owner/Current Home Owner being posted elsewhere") INDIVIDUAL APPLICATION FORM FOR: Defence Force Superannuation Scheme (DFSS) Category A & C Determination for Previous Home Owner/Current Home Owner being posted elsewhere All sections (A, B, C and D) to
INDIVIDUAL APPLICATION FORM FOR: Defence Force Superannuation Scheme (DFSS) Category A & C Determination for Previous Home Owner/Current Home Owner being posted elsewhere All sections (A, B, C and D) to
SAMPLE REPORT CORELOGIC NEW ZEALAND MONTHLY PROPERTY MARKET & ECONOMIC UPDATE
 CORELOGIC NEW ZEALAND MONTHLY PROPERTY MARKET & ECONOMIC UPDATE JANUARY FEBRUARY 2017 About CoreLogic 4 CoreLogic Data and Analytics 6 Legal Disclaimer 7 Macro Economic and Demographic Indicators 8 New
ASSOCIATION OF RESIDENTIAL LETTING AGENTS PRIVATE RENTED SECTOR REPORT
 ASSOCIATION OF RESIDENTIAL LETTING AGENTS PRIVATE RENTED SECTOR REPORT August 2015 For further information: Association of Residential Letting Agents Press Office 020 7566 9777 propertyprofessionals@lansons.com
LAND AND HOUSING SUPPLY. Douglas Fairgray, Director, Market Economics Ltd
 LAND AND HOUSING SUPPLY Douglas Fairgray, Director, Market Economics Ltd This paper addresses Land and Housing Supply, in the general context of what happens next in an economic down turn after an extended
Q B O S T O N M A R K E T R E P O R T
 Q 3 2 1 7 B O S T O N M A R K E T R E P O R T Introducing the Compass Q3 217 Greater Boston Market Report Page 2 Page 3 Page 5 Page 7 Page 8 Map of Coverage Area Single Family Overview Condo Overview Time
Auckland Monthly Housing Update. December 2018
 Auckland Monthly Housing Update December 2018 Table of contents 1. Summary... 3 2. Highlights... 4 3. Dwellings consented... 5 4. Dwellings consented by type... 6 5. Dwellings consented inside 2010 MUL...
NZ house price index relative to peak
 Media release 11 th July 2011 Nationwide property values edge upwards The QV residential property index shows that nationwide values increased in June, driven largely by the Auckland market. Nationwide
1 Q M A NH AT TA N M A R K E T R E P O R T
 1Q2018 MANHATTAN M A R K E T R E P O R T INTRODUCTION M A N H A T T A N S A L E S R E P O R T Q 1 2 0 1 8 : THE NECESSITY OF BALANCE The first quarter of 2018 was a balancing act supported by declines
Building plans put to work
 Crown copyright See Copyright and terms of use for our copyright, attribution, and liability statements. Citation Stats NZ (2017). Building plans put to work. Retrieved from www.stats.govt.nz. ISBN 978-0-9941463-2-8
ASSOCIATION OF REGINA REALTORS INC.
 ASSOCIATION OF REGINA REALTORS INC. 1854 McIntyre Street Regina, Sask. S4P P9 Ph: 791-7 Fax: 781-794 www.reginarealtors.com For immediate release April 3, 18 RESIDENTIAL SALES SLIDE MARKS END OF 1 ST QUARTER
CHRANZ housing reports : A summary of the CHRANZ Reports in relation to the Auckland region
 CHRANZ housing reports 2003 2007: A summary of the CHRANZ Reports in relation to the Auckland region Prepared by Leilani Hall For the Social and Economic Research and Monitoring Team Auckland Regional
Coachella Valley Median Detached Home Price April April 2017
 The Desert Housing Report Median Price $450,000 $400,000 Coachella Valley Median Detached Home Price April 2002 - $349,000 $389,000 $350,000 $300,000 $250,000 $200,000 $150,000 CV Detached Median Price
ASSOCIATION OF REGINA REALTORS INC.
 ASSOCIATION OF REGINA REALTORS INC. 1854 McIntyre Street Regina, Sask. S4P P9 Ph: 791-7 Fax: 781-794 www.reginarealtors.com For immediate release November 5, OCTOBER RESIDENTIAL SALES YIELD MIXED RESULTS
2015 First Quarter Market Report
 2015 First Quarter Market Report CAAR Member Copy Expanded Edition Charlottesville Area First Quarter 2015 Highlights: Median sales price for the region was up 5.1% over Q1-2014, rising from $244,250 to
February 2016 Loudoun County Market Trends Report Contracts and sales activity jump double-digits; Inventories down 15.5 percent
 FOR IMMEDIATE RELEASE Contact: Christine Windle 703-777-2468, cwindle@dullesarea.com Sponsored by: Access National Bank Tom Ciolkosz, (703) 871-1045, tciolkosz@accessnationalbank.com Patty Foster, 703-871-1014,
National Construction Pipeline Report 3 July 2015
 National Construction Pipeline Report 3 July 2015 Prepared by Table of contents 1 Introduction 6 1.1 How to read the graphs 7 2 Key findings 8 2.1 Unprecedented levels of construction activity are still
rd Quarter Market Report
 2012 3 rd Quarter Market Report The voice of real estate in Central Virginia CAAR Member Copy Expanded Edition Charlottesville Area 3 rd Quarter 2012 Highlights: Overall sales in Greater Charlottesville
The Market Watch Monthly Housing Report. Coachella Valley Median Detached Home Price Dec Dec 2016
 The Market Watch Monthly Housing Report Median Price $450,000 Coachella Valley Median Detached Home Price Dec 2002 - Dec 2016 $400,000 $350,000 $300,000 $339,930 $340,000 $250,000 $200,000 $150,000 CV
May 2013 April 2013 May 2012 Manhattan Condo Index 2,106 2, % 1, %
 Market Report NOTICE: StreetEasy is pleased to present our 2013 Q2 Quarterly Report on the residential market. This preview version of the report is based on over 1,000 broker sources and will provide
Housing Price Forecasts. Illinois and Chicago PMSA, March 2018
 Housing Price Forecasts Illinois and Chicago PMSA, March 2018 Presented To Illinois Realtors From R E A L Regional Economics Applications Laboratory, Institute of Government and Public Affairs University
Year to Date (thru June)
") CAAR Market Report 2009 Mid-Year Published by the Charlottesville Area Association of REALTORS Where Are We Now? The pace of home purchases in the Charlottesville area continues to improve from the dismal
CAAR Market Report 2009 Mid-Year Published by the Charlottesville Area Association of REALTORS Where Are We Now? The pace of home purchases in the Charlottesville area continues to improve from the dismal
ARLA Members Survey of the Private Rented Sector
 Prepared for The Association of Residential Letting Agents ARLA Members Survey of the Private Rented Sector Second Quarter 2014 Prepared by: O M Carey Jones 5 Henshaw Lane Yeadon Leeds LS19 7RW June, 2014
Coachella Valley Median Detached Home Price Mar Mar 2018
 Median Price $450,000 Coachella Valley Median Detached Home Price Mar 2002 - Mar 2018 $392,000 $400,000 $366,285 $350,000 $300,000 $250,000 $200,000 $150,000 Media Detached Price 4% Growth Curve Summary
Cost of owning and running a home at highest level since 2008
 This is the annual Halifax review of the cost of owning and running a home. The review is compiled using a range of official statistics, including the ONS Family Spending Survey, DCLG and Halifax's own
National Policy Statement on Urban Development Capacity Price efficiency indicators technical report: Price-cost ratios
 National Policy Statement on Urban Development Capacity Price efficiency indicators technical report: Price-cost ratios Acknowledgements: SensePartners is acknowledged for the development of this technical
Changes in the Structure of the New Zealand Housing Market Executive Summary
 Changes in the Structure of the New Zealand Housing Market Executive Summary PREPARED BY DTZ New Zealand FOR THE Centre for Housing Research, Aotearoa New Zealand MAY 2004 ISBN 0-9582553-0-X ACKNOWLEDGEMENTS
Housing Price Forecasts. Illinois and Chicago PMSA, June 2012
 Housing Price Forecasts Illinois and Chicago PMSA, June 2012 Presented To Illinois Association of REALTORS From R E A L Regional Economics Applications Laboratory, Institute of Government and Public Affairs
INLAND EMPIRE REGIONAL INTELLIGENCE REPORT. School of Business. April 2018
 INLAND EMPIRE REGIONAL INTELLIGENCE REPORT April 2018 Key economic indicators suggest that the Inland Empire s economy will continue to expand throughout the rest of 2018, building upon its recent growth.
New House Owners Satisfaction Survey 2017
 Study Report SR395 [2018] New House Owners Satisfaction Survey 2017 Nick Brunsdon and Caleb Magan 1222 Moonshine Rd, RD1, Porirua 5381 Private Bag 50 908, Porirua 5240 New Zealand branz.nz BRANZ 2018 ISSN:
Housing Market Update
 Housing Market Update March 2017 New Hampshire s Housing Market and Challenges Market Overview Dean J. Christon Executive Director, New Hampshire Housing Finance Authority New Hampshire s current housing
Residential Real Estate Market Overview: April 2017 Data
 Residential Real Estate Market Overview: April 2017 Data 2017 Mark A. Melikian Chief Valuation Officer mark.melikian@summitvaluations.com 2800 River Road, Suite 460 The following is a market data summary
ECONOMIC CURRENTS. Vol. 5 Issue 2 SOUTH FLORIDA ECONOMIC QUARTERLY. Key Findings, 2 nd Quarter, 2015
 ECONOMIC CURRENTS THE Introduction SOUTH FLORIDA ECONOMIC QUARTERLY Economic Currents provides an overview of the South Florida regional economy. The report presents current employment, economic and real
Housing Price Forecasts. Illinois and Chicago PMSA, August 2016
 Housing Price Forecasts Illinois and Chicago PMSA, August 2016 Presented To Illinois Association of Realtors From R E A L Regional Economics Applications Laboratory, Institute of Government and Public
Coachella Valley Median Detached Home Price Jan Jan 2017
 The Desert Housing Report Median Price $450,000 Coachella Valley Median Detached Home Price Jan 2002 - Jan 2017 $400,000 $350,000 $300,000 $250,000 $335,000 $340,000 $200,000 $150,000 CV Detached Median
Auckland. Regional roundup
 Auckland Regional roundup 18 August 2016 Summary New Zealand continues to enjoy a relatively buoyant period of economic growth overall, as highlighted in our last two ly Economic Overview reports.¹ However,
Toledo Regional Association of REALTORS 2015 Housing Report
 Toledo Regional Association of REALTORS Housing Report Notes for Reading the Report The data we use is publicly available and statistically valid. Our interpretation of the data in some cases may lead
The Coldwell Banker Carlson Real Estate Market Report
 The Coldwell Banker Carlson Real Estate Market Report 2017 Year-End Stowe Area Report Our 2017 Year-End Market Report uses market-wide data, based on transactions that closed in 2017 in the Multiple Listing
The Canadian Real Estate Association News Release
 According to statistics 1 released today by The Canadian Real Estate Association (CREA), national home sales posted their third monthly increase and broke all previous monthly records. Highlights: The
Social Housing (IRRS) Purchasing Intentions 15 April 2015
 Purchasing Intentions 15 April 2015") Social Housing (IRRS) Purchasing Intentions 15 April 2015 Social Housing Purchasing Intentions Page 1 Introduction The Social Housing Reform Programme is a cross-agency approach to improve the provision
Social Housing (IRRS) Purchasing Intentions 15 April 2015 Social Housing Purchasing Intentions Page 1 Introduction The Social Housing Reform Programme is a cross-agency approach to improve the provision
Weekly Market Activity Report
 Weekly Market Report A RESEARCH TOOL FROM THE MINNEAPOLIS AREA ASSOCIATION OF REALTORS BROUGHT TO YOU BY THE UNIQUE DATA-SHARING TRADITIONS OF THE REALTOR COMMUNITY For Week Ending July 7, 2018 Publish
NEW ZEALAND PROPERTY SURVEY SEPTEMBER 2015
 NEW ZEALAND PROPERTY SURVEY SEPTEMBER 2015 We asked New Zealanders what they really thought about property. What challenges Kiwis faced when selling or buying and how they felt about the property market.
DATA FOR JANUARY Published Feburary 16, Sales are down -14.0% month-over-month. The year-over-year comparison is up +2.5%.
 Permission is granted only to ARMLS Subscribers for reproduction with attribution on to ARMLS COPYRIGHT 2018. For questions regarding this publication contact Brand@ARMLS.com. DATA FOR JANUARY 2018 - Published
The Desert Housing Report. Coachella Valley Median Detached Home Price March March 2019 $392,000 $415,000
 Median Price $450,000 $400,000 $350,000 $300,000 $250,000 $200,000 $150,000 Coachella Valley Median Detached Home Price March 2002 - $392,000 $415,000 CV Detached Median Price Summary 4% Growth Curve The
San Francisco Housing Market Update
 San Francisco Housing Market Update California Economic and Housing Market Outlook The national economy maintained a healthy growth rate in the first quarter of 2005 and appeared to be settling in for
The Desert Housing Report. Coachella Valley Median Detached Home Price December December 2018
 Median Price $450,000 $400,000 Coachella Valley Median Detached Home Price December 2002 - $369,450 $389,944 $350,000 $300,000 $250,000 $200,000 $150,000 CV Detached Median Price 4% Growth Curve Summary
November 2012 October 2012 November 2011 Manhattan Condo Index 1,974 1, % 1, %
 Market Report StreetEasy is pleased to present our 2012 Q4 Quarterly Report on the residential market. The bulk of the report is based on approximately 3,600 estimated recorded sales for this quarter as
News Release. Canadian home sales slip further in January Ottawa, ON, February 17, The Canadian Real Estate Association
 Canadian home sales slip further in January Ottawa, ON, February 17, 2015 According to statistics 1 released today by The Canadian Real Estate Association (CREA), national home sales activity was down
Connecticut First Nine Months Housing Report 2014
 Connecticut First Nine Months Housing Report 2014 First Nine Months of 2014 Highlight Positive Outlook for Multi-family Home Construction Millennial buyers are finally increasing their rate of household
SECOND QUARTER 2007 QUARTERLY MARKET REPORT
 SECOND QUARTER 2007 QUARTERLY MARKET REPORT QUARTERLY MARKET REPORT Manhattan The average sale price for Manhattan apartments set a new record in the second quarter, reaching $1,300,212. This figure was
mymarket Report How is the market?
 How is the market? Otago Summer 2015 The latest property market update for the Otago region. Helping you with your property decisions. Queenstown Lakes District values continue to grow steadily, while
KIWIBUILD: 100,000 MODERN AFFORDABLE HOMES FACTSHEET
 KIWIBUILD: 100,000 MODERN AFFORDABLE HOMES FACTSHEET HIGHLIGHTS Labour will: Help Kiwis into their first home by building 100,000 modern affordable homes. Create a significant number of skilled jobs by
Auckland Monthly Housing Update. March 2018
 Auckland Monthly Housing Update March 2018 Table of contents 1. Summary... 3 2. Highlights... 4 3. Dwellings consented... 5 4. Dwellings consented by type... 6 5. Dwellings consented inside 2010 MUL...
WISCONSIN HOUSING MARKETPLACE
 WISCONSIN REALTORS ASSOCIATION WISCONSIN HOUSING MARKETPLACE Date: 2/16/06 For Release: Immediately For More Information Contact: David E. Clark, Economist C3 Statistical Solutions Inc. Office phone: 414-803-6537
Housing Price Forecasts. Illinois and Chicago PMSA, January 2019
 Housing Price Forecasts Illinois and Chicago PMSA, January 2019 Presented To Illinois Realtors From R E A L Regional Economics Applications Laboratory, Institute of Government and Public Affairs University
Market Report. Manhattan Q Significant findings in Q3 2008
 Market Report StreetEasy is pleased to present our Quarterly Report on the residential market, starting with a special section called Market Snapshot. While the bulk of the report is based on over 4,500
Housing Price Forecasts. Illinois and Chicago PMSA, March 2019
 Housing Price Forecasts Illinois and Chicago PMSA, March 2019 Presented To Illinois Realtors From R E A L Regional Economics Applications Laboratory, Institute of Government and Public Affairs University
See Full Corridor Study Volumes I and II as separate attachments.
 See Full Corridor Study Volumes I and II as separate attachments. See Housing Values 2000-2010 and 2000-2013 as separate attachments. 2013 2 nd Quarter and Mid-Year Market Report The voice of real estate
ARLA Members Survey of the Private Rented Sector
 Prepared for The Association of Residential Letting Agents & the ARLA Group of Buy to Let Mortgage Lenders ARLA Members Survey of the Private Rented Sector Fourth Quarter 2010 Prepared by: O M Carey Jones
Housing Price Forecasts. Illinois and Chicago PMSA, January 2018
 Housing Price Forecasts Illinois and Chicago PMSA, January 2018 Presented To Illinois Realtors From R E A L Regional Economics Applications Laboratory, Institute of Government and Public Affairs University
Single Family Sales Maine: Units
 Maine Home Connection 19 Commercial St Portland, Maine 04101 MaineHomeConnection.com Office: (207) 517-3100 Email: Info@MaineHomeConnection.com For the fourth consecutive year, Maine home sales set a new
REA Group Property Demand Index. Nerida Conisbee REA Group Chief Economist. Introduction
 REA Group Property Demand Index Nerida Conisbee REA Group Chief Economist OCTOBER 2016 Introduction Demand for property in Australia is now at fever pitch, with rates continuing to reach record levels,
Housing Price Forecasts. Illinois and Chicago PMSA, October 2014
 Housing Price Forecasts Illinois and Chicago PMSA, October 2014 Presented To Illinois Association of Realtors From R E A L Regional Economics Applications Laboratory, Institute of Government and Public
Housing Price Forecasts. Illinois and Chicago PMSA, September 2016
 Housing Price Forecasts Illinois and Chicago PMSA, September 2016 Presented To Illinois Realtors From R E A L Regional Economics Applications Laboratory, Institute of Government and Public Affairs University
May 2016 Loudoun County Market Trends Report Homes selling twice as fast as 2015 with re-emergence of seller s market
 FOR IMMEDIATE RELEASE Contact: Christine Windle 703-777-2468 Dulles Area Association of REALTORS cwindle@dullesarea.com Sponsored by: Access National Bank Tom Ciolkosz, (703) 871-1045, tciolkosz@accessnationalbank.com
2Q2017 L O N G ISLAND CITY
 2Q2017 L O N G ISLAND CITY M A R K E T R E P O R T INTRODUCTION L O N G I S L A N D C I T Y S A L E S R E P O R T Q 2 2 0 1 7 : LONG ISLAND CITY IS THE FASTEST GROWING NEIGHBORHOOD IN THE COUNTRY. The
Q M A N H A T T A N M A R K E T R E P O R T
 Q 4 2 0 1 7 M A N H A T T A N M A R K E T R E P O R T Introducing the Compass Q4 2017 Manhattan Market Report Page 02 Page 03 Page 05 Page 08 Page 10 Page 11 Coverage area Inventory Contracts signed Closings
edition number two 2016 Otago Market Report Highland Real Estate Group Ltd With you all the way.
 edition number two 216 Otago Market Report Highland Real Estate Group Ltd With you all the way. PROPERTY MARKET OVERVIEW DEMAND STILL ON THE UP AND UP LISTINGS NEEDED As predicted buyer pressure has continued,