Lowest sales volumes in 8 months a result of extremely low listings in July says REINZ
|
|
|
- Reynold May
- 5 years ago
- Views:
Transcription

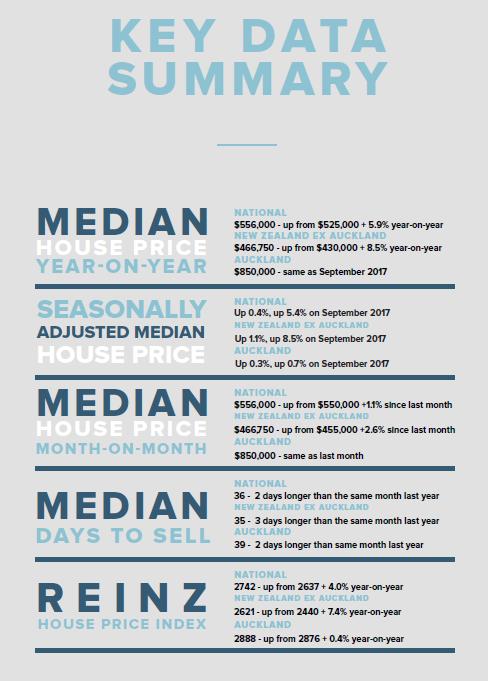
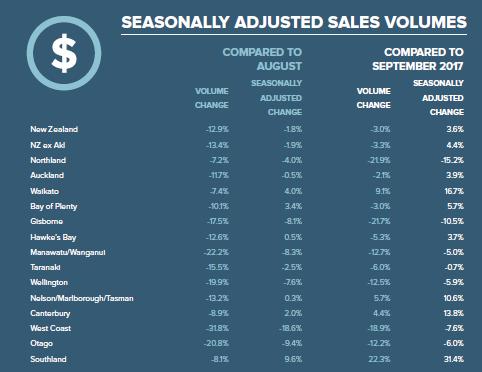
1 11 October 2018 For immediate release Lowest sales volumes in 8 months a result of extremely low listings in July says REINZ The low number of new listings in July has meant that the number of houses sold in New Zealand during September decreased by -3.0% year-on-year. This was the lowest level number of properties sold since January this year, according to the latest data from the Real Estate Institute of New Zealand (REINZ), source of the most complete and accurate real estate data in New Zealand. The number of properties sold across the country fell from 5,674 in September 2017 to 5,506 in September this year 168 fewer properties. This is the lowest for the month of September since September For New Zealand excluding Auckland, the number of properties sold decreased by -3.3% 133 fewer properties when compared to September 2017 (from 4,023 to 3,890). In Auckland, the number of properties sold decreased by -2.1% or 35 fewer properties, from 1,651 in September 2017 to 1,616 in September Bindi Norwell, Chief Executive at REINZ says: Traditionally there is a lag of about 6 weeks between significant movements in listings and sales results. With July s listings down by 5.4% year-on-year and an all-time low level of listings in seven regions, it s little wonder that September s sales volumes were so low. There simply weren t as many properties for sale resulting in a very quiet start to spring. However, with August and September s listing numbers up 0.1% and 11.7% respectively, it is expected that October and November s sales volumes will be much stronger particularly as people want to sell ahead of Christmas, continues Norwell. Across the country 12 out of 16 regions saw a fall in volumes with 6 of those regions experiencing double-digit decreases. Regions with the largest annual decrease in sales volumes were: Northland: -21.9% (from 215 to fewer houses) the lowest since January 2018 Gisborne: -21.7% (from 60 to fewer houses) the lowest since January 2018 West Coast: -18.9% (from 37 to 30 7 fewer houses) the lowest since December There were also some regions with strong annual increase in sales volumes including: Marlborough: +31.5% (from 54 to 71 an additional 17 houses) Southland: +22.3% (from 139 to 170 an additional 31 houses) Waikato: +9.1% (from 582 to 635 an additional 53 houses).
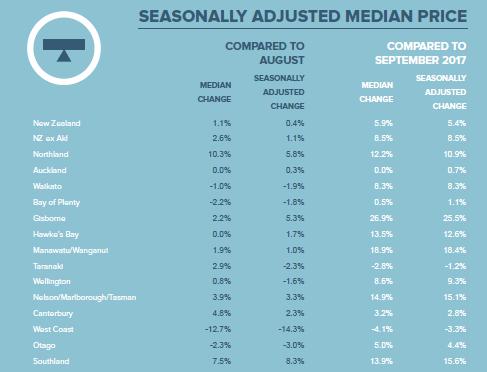
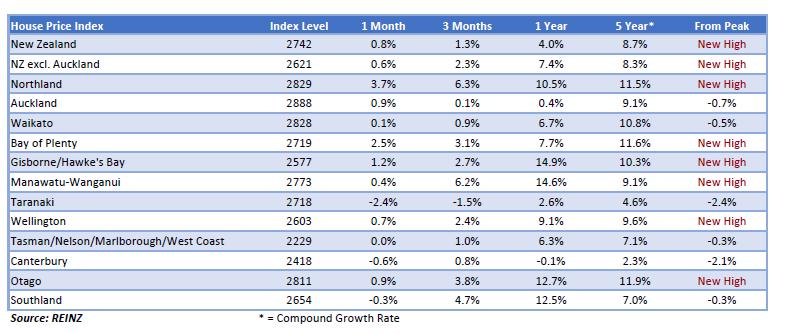
2 Prices continue to grow in the regions with 4 regions achieving record prices While volumes were down around many parts of the country, the reverse was true from a price perspective, with 14 out of 16 regions experiencing an increase in median prices when compared to September last year. Of those 14 regions, 4 achieved record median prices and 1 region equalled a previous record median: Gisborne: +26.9% to $342,500 (up $72,500 from the same time last year) Nelson: +23.1% to $592,000 (up $111,000 from the same time last year) Manawatu/Wanganui: +18.9% to $321,000 (up $51,000 from the same time last year) Northland: +12.2% to $505,000 (up $55,000 from the same time last year) Hawke s Bay: +13.5% to $445,000 an equal record with August 2018 (up $53,000 from the same time last year). Looking at the national picture, median house prices across New Zealand increased 5.9% year-onyear from $525,000 in September 2017 to $556,000 in September For New Zealand excluding Auckland, the median house price increased 8.5% annually from $430,000 to $466,750 a record high. Auckland s housing market has continued its now predictably stable pattern, with a median price of $850,000 the exact same price as September last year. There are now seven regions across New Zealand that have median prices in excess of the half a million-dollar mark with Northland the newest region to go over this level. Additionally, there are already three regions that have exceeded the $600,000 median mark and with Nelson s median sitting at $592,000 it may not be too far away until we have a fourth region edging over the $600,000 mark, points out Norwell. With our population growth and demand for properties continuing to exceed the supply of housing stock, prices are likely to continue increasing in the short to medium term. In fact, new research issued by AUT earlier this week suggested that at our current rate of supply we won't reach demand until the mid-to-late 2020s. This means that price pressure could well be an issue for some time particularly in our more densely populated cities, says Norwell. Looking at the Auckland picture, we ve seen Auckland s median house price hover around the $850,000 mark for 18 months now this incredibly stable market is positive for first time buyers who are desperately saving to get a foot on the property ladder. However, it s also good for investors, buyers and sellers too, as it means that everyone knows what the market is doing there don t tend to be too many happy people when the market is particularly volatile, concludes Norwell. REINZ House Price Index (HPI) The REINZ House Price Index for New Zealand, which measures the changing value of property in the market, increased 4.0% year-on-year to 2,742 a new record high for the country. The HPI for New Zealand excluding Auckland increased 7.4% from September 2017 to a new record high of 2,621. The Auckland HPI increased 0.4% year-on-year to 2,888.
3 The REINZ HPI again saw 11 out of 12 regions experience an increase over the past 12 months, highlighting the continued strength of the property market. The only exception was Canterbury with a minor decrease of -0.1% year-on-year. This month the Gisborne region had the highest annual growth rate of 14.9%, followed by Manawatu/Wanganui in second place with an annual growth rate of 14.6% and in third place was Otago with a 12.7% annual increase. Days to Sell The median number of days to sell a property nationally increased by 2 days from 34 to 36 when compared to September last year. For New Zealand excluding Auckland, the median days to sell increased on an annual basis by 3 days from 32 to 35. Auckland saw the median number of days to sell a property increase by 2 days to 39 days (up from 37 in September 2017). This is the lowest median days to sell since April this year. Auctions Auctions were used in 14.5% of all sales across the country in September, with 798 properties selling under the hammer this is down slightly from September 2017, when 14.8% of properties (798) were sold via auction. For the eighth month in a row, Gisborne had the highest percentage of auctions across the country with 42.6% (or 20 properties) in the region sold under the hammer up from 31.7% (19 properties) in September Auckland saw the second largest percentage of auctions on 26.4% (426 properties) up marginally from 26.1% in September 2017 (431 properties) this is the first annual increase in auctions for Auckland in 8 months. The Bay of Plenty maintained its spot of having the third highest level of auctions in the country with 19.4% (76 properties) sold under the hammer, down from 21.3% (86 properties) in September Inventory The number of properties available for sale nationally increased by 5.2% from 21,727 to 22,847 an increase of 1,120 properties compared to 12 months ago. This is the highest level of inventory for 4 months. September saw 6 regions with an annual increase in inventory levels: Auckland: +17.7% from 7,429 to 8,740 an additional 1,311 properties Nelson: +16.0% from 309 to 358 an additional 49 properties) Waikato: +11.3% from 1,481 to 1,648 an additional 167 properties Northland: +8.6% from 1,156 to 1,255 an additional 99 properties Canterbury: +8.2% from 3,228 to 3,493 an additional 265 properties Bay of Plenty: +1.2% from 1,335 to 1,351 an additional 16 properties Regions with the biggest falls in inventory were: Southland: -20.5% from 560 to fewer properties Manawatu/Wanganui: -19.6% from 916 to fewer properties West Coast: -16.5% from 563 to fewer properties
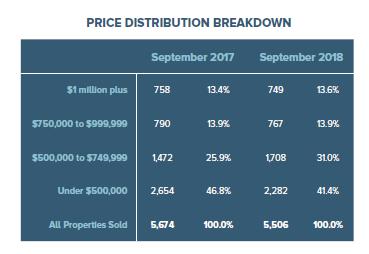
4 Gisborne: -13.9% from 139 to fewer properties. Wellington again has the lowest level of inventory with 8 weeks inventory, followed by Hawke s Bay on 9 weeks and Gisborne and Otago with 10 weeks inventory available to prospective purchasers. Price Bands The number of homes sold for less than $500,000 across New Zealand fell from 46.8% of the market (2,654 properties) in September 2017 to 41.4% of the market (2,282 properties) in September 2018 which is reflected by the overall increasing median price across the country. The number of properties sold in the $500,000 to $750,000 bracket increased from 25.9% in September 2017 (1,472 properties) to 31.0% in September 2018 (1,708 properties). At the top end of the market, properties sold for more than $1 million increased ever so slightly from 13.4% in September 2017 (758 houses) to 13.6% in September 2018 (749 houses). ENDS Notes to Editors The monthly REINZ residential sales reports remain the most recent, complete and accurate statistics on house prices and sales in New Zealand. They are based on actual sales reported by real estate agents. These sales are taken as of the date that a transaction becomes unconditional, up to 5:00pm on the last business day of the month. Other surveys of the residential property market are based on information from Territorial Authorities regarding settlement and the receipt of documents by the relevant Territorial Authority from a solicitor. As such, this information involves a lag of four to six weeks before the sale is recorded. For further information, please contact Dee Crooks, Head of Communications at REINZ, on or
5
6
7
Record house prices an early Christmas present to vendors, says REINZ
 14 December 2018 For immediate release Record house prices an early Christmas present to vendors, says REINZ Vendors from around the country have been delivered an early Christmas present with record median
$27k price increase sees NZ hit new record median price in May says REINZ
 14 June 2018 For immediate release $27k price increase sees NZ hit new record median price in May says REINZ A year-on-year price increase of $27,000 has seen New Zealand achieve a new record median house
Real estate industry sees highest annual volume increase in 23 months
 11 May 2018 For immediate release Real estate industry sees highest annual volume increase in 23 months The number of properties sold in April 2018 across New Zealand increased by 6.6% compared to the
House prices rise 6.9% across New Zealand according to latest REINZ figures
 14 March 2018 For immediate release House prices rise 6.9% across New Zealand according to latest REINZ figures The median house price for New Zealand rose 6.9% in February to $530,000 up from $496,000
Strong end to 2017, with house prices up 5.8% in December says REINZ
 18 January 2018 Strong end to 2017, with house prices up 5.8% in December says REINZ Median house prices across New Zealand rose by 5.8% year-on-year to $550,000 up from $520,000 in December 2016 and median
REINZ statistics: Auckland price growth slowing, regional strong growth continues
 13 July 2017 For immediate release REINZ statistics: price growth slowing, regional strong growth continues New Zealand s property market is showing all the signs of being a two-tier market with median
Sales volumes see seasonal drop in January as Auckland & National median house prices rise year-on-year
 REINZ Real Estate Institute of New Zealand February 2017 Sales volumes see seasonal drop in January as & median house prices rise year-on-year Bindi Norwell, REINZ CEO ers are once again starting to put
report New Zealand property
 report New Zealand property July 2018 issued 1 August 2018 overview Interest in homes for sale warms in July. Search for properties back to summertime levels. Searches for properties in July on realestate.co.nz
report New Zealand property
 report New Zealand property June 2018 issued 3 July 2018 overview New property listings drop significantly in June, while asking prices and buyer interest hold steady. The Auckland region records a fall
Sellers set a new record high asking price, as inventory drops to near record low
 1st May 2013 Sellers set a new record high asking price, as inventory drops to near record low Asking prices reach new high The seasonally adjusted asking price rose in April to a new record high of $447,275
report New Zealand property
 report New Zealand property January 2018 issued 1 February 2018 overview New Zealand property market in major centres stays cool over hot summer, while regions are pumping Real-time statistics from realestate.co.nz
MONTHLY HOUSE PRICE INDEX REPORT
 MONTHLY HOUSE PRICE INDEX REPORT 1 4 J U N E 2018 REINZ Real Estate Institute of New Zealand REINZ HOUSE PRICE INDEX (HPI) As one of the country s foremost authorities on real estate data, we are proud
report New Zealand property
 report New Zealand property February 2018 issued 1 March 2018 Lifestyle property a potential option in a relatively static housing market A surge in the number of lifestyle properties listed for sale nationally
Rents leap to end 2016 on a record high
 Media Release 16 January 2017 Rents leap to end 2016 on a record high December was another tough month for tenants in New Zealand with the national median weekly rent jumping to a record $450, according
Inventory of unsold houses drops to 6 year low
 1st July 2013 Inventory of unsold houses drops to 6 year low New listings stall After witnessing a surge of fresh listings in May, June saw listings stall, with just 9,082 listings coming to the market.
New Zealand Property Report. June
 New Zealand Property Report June 2016 The Overview Scarcity of houses for sale nationally creates sellers market. Realestate.co.nz statistics show demand and prices up, supply down. The average asking
Auckland rents kick back into gear
 Media Release 24 May 2016 Auckland rents kick back into gear The New Zealand rental market kicked back into gear in April as the median weekly asking rent increased by $10 according to the latest Trade
Commentary. Regional Summary Asking Price
 Inventory recovers slightly as national asking prices ease Asking prices ease Nationally average asking prices of new listings eased in April. The seasonally adjusted asking price fell by 1.4% to $477,460,
report New Zealand property
 report New Zealand property April 2018 issued 1 May 2018 overview A rise in new property listings nationally is strongly underpinned by the Canterbury and Wellington regions Real-time data from realestate.co.nz
MONTHLY HOUSE PRICE INDEX REPORT
 MONTHLY HOUSE PRICE INDEX REPORT 1 2 O C T O B E R 2017 REINZ Real Estate Institute of New Zealand INTRODUCING REINZ HOUSE PRICE INDEX (HPI) As one the country s foremost authorities on real estate data,
14 N O V E M B E R
 14 N O V E M B E R 2 0 1 8 REINZ HOUSE PRICE INDEX (HPI) As one of the country s foremost authorities on real estate data, we are proud to bring you the REINZ HPI (House Price Index). It provides a level
BNZ-REINZ Residential Market Survey ISSN
 ISSN 2253-3656 13 2012 Mission Statement To help Kiwi businesspeople and householders make informed financial decisions by discussing the economy in a language they can understand. Market Strength Continues
Auckland property cools further as summer rolls on
 Media Release 22 February 2017 Auckland property cools further as summer rolls on The Auckland property market continues to cool, with the Trade Me Property Price Index reporting the average asking price
Housing and Construction Quarterly
 New Zealand Housing and Construction Quarterly March 2015 Contents 2 Quarterly Highlights Housing Market 3 House Values by Region 4 Rents by Region 5 Rents by Bedroom and Region 6 Price and Rent Comparisons
Renters in Auckland $12,500 p.a better off than homeowners
 Media Release 19 November 2015 Renters in Auckland $12,500 p.a better off than homeowners It is cheaper to rent a house than buy a house across New Zealand, but the disparity is most pronounced in Auckland
Housing and Construction Quarterly
 New Zealand Housing and Construction Quarterly September 2014 Contents Housing Market 2 House Values by Region 3 Rents by Region 4 Rents by Bedroom and Region 5 Price and Rent Comparisons 6 Housing Affordability
Year to Date (thru June)
") CAAR Market Report 2009 Mid-Year Published by the Charlottesville Area Association of REALTORS Where Are We Now? The pace of home purchases in the Charlottesville area continues to improve from the dismal
CAAR Market Report 2009 Mid-Year Published by the Charlottesville Area Association of REALTORS Where Are We Now? The pace of home purchases in the Charlottesville area continues to improve from the dismal
2008 Mid-Year CAAR Market Report Real Estate Market is as Hot as ANWR
 2008 Mid-Year CAAR Market Report Real Estate Market is as Hot as ANWR By Dave Phillips, CEO Charlottesville Area Association of REALTORS Just about everything in life is relative to your perspective. Based
nd Quarter Market Report
 2015 2 nd Quarter Market Report The voice of real estate in Central Virginia CAAR Member Copy Expanded Edition Charlottesville Area 2 nd Quarter 2015 Highlights: Closed sales in the Greater Charlottesville
Queenstown-Lakes Data REINZ SLIDE 1
 Queenstown-Lakes Data REINZ SLIDE 1 OTAGO REGION SCORECARD Net Migration (year to) Unemployment (Q3) Weekly Earnings (Median) House Prices (Median) Sep 16: 1,954 Q3 2016: 3.7% 2016: $1,054 YE Sep 16: $337k
Coachella Valley Median Detached Home Price Mar Mar 2018
 Median Price $450,000 Coachella Valley Median Detached Home Price Mar 2002 - Mar 2018 $392,000 $400,000 $366,285 $350,000 $300,000 $250,000 $200,000 $150,000 Media Detached Price 4% Growth Curve Summary
ASSOCIATION OF REGINA REALTORS INC.
 ASSOCIATION OF REGINA REALTORS INC. 1854 McIntyre Street Regina, Sask. S4P P9 Ph: 791-7 Fax: 781-794 www.reginarealtors.com For immediate release April 3, 18 RESIDENTIAL SALES SLIDE MARKS END OF 1 ST QUARTER
NZ property report OCTOBER 2016
 NZ property report OCTOBER 2016 Report Definitions Sales by registration type; rolling three month, year-on-year growth This data set provides an insight into who is active in the market compared to the
2015 First Quarter Market Report
 2015 First Quarter Market Report CAAR Member Copy Expanded Edition Charlottesville Area First Quarter 2015 Highlights: Median sales price for the region was up 5.1% over Q1-2014, rising from $244,250 to
CAAR Market Report 2010 First Quarter Published by the Charlottesville Area Association of REALTORS
 CAAR Market Report 2010 First Quarter Published by the Charlottesville Area Association of REALTORS Where Are We Now? In the first quarter of 2010, the Charlottesville real estate market continued the
Single Family Sales Maine: Units
 Maine Home Connection 19 Commercial St Portland, Maine 04101 MaineHomeConnection.com Office: (207) 517-3100 Email: Info@MaineHomeConnection.com For the fourth consecutive year, Maine home sales set a new
Austin-area home prices set August record, outpace household income growth in August 2015
 Austin-area home prices set August record, outpace household income growth in August 2015 Market Reports Austin Board of REALTORS releases real estate statistics for August 2015 AUSTIN, Texas September
The Canadian Real Estate Association News Release
 According to statistics 1 released today by The Canadian Real Estate Association (CREA), national home sales posted their third monthly increase and broke all previous monthly records. Highlights: The
ASSOCIATION OF REGINA REALTORS INC.
 ASSOCIATION OF REGINA REALTORS INC. 1854 McIntyre Street Regina, Sask. S4P P9 Ph: 791-7 Fax: 781-794 www.reginarealtors.com For immediate release November 5, OCTOBER RESIDENTIAL SALES YIELD MIXED RESULTS
2013 Year-End Market Report
 2013 Year-End Market Report The voice of real estate in Central Virginia CAAR Member Copy Expanded Edition Charlottesville Area Year-End 2013 Highlights: Yearly home sales in Greater Charlottesville were
1 Q M A NH AT TA N M A R K E T R E P O R T
 1Q2018 MANHATTAN M A R K E T R E P O R T INTRODUCTION M A N H A T T A N S A L E S R E P O R T Q 1 2 0 1 8 : THE NECESSITY OF BALANCE The first quarter of 2018 was a balancing act supported by declines
ARLA Members Survey of the Private Rented Sector
 Prepared for The Association of Residential Letting Agents ARLA Members Survey of the Private Rented Sector Second Quarter 2014 Prepared by: O M Carey Jones 5 Henshaw Lane Yeadon Leeds LS19 7RW June, 2014
Building plans put to work
 Crown copyright See Copyright and terms of use for our copyright, attribution, and liability statements. Citation Stats NZ (2017). Building plans put to work. Retrieved from www.stats.govt.nz. ISBN 978-0-9941463-2-8
Housing and. Construction. Quarterly. Contents 2 Quarterly Highlights. New Zealand. June Key Issues. A Tale of Two Housing Markets.
 New Zealand Housing and Construction Quarterly June 2014 Contents 2 Quarterly Highlights Housing Market 3 House Values by Region 4 Rents by Region 5 Rents by Bedroom and Price by TA 6 Price and Rent Comparisons
The Market Watch Monthly Housing Report. Coachella Valley Median Detached Home Price Dec Dec 2016
 The Market Watch Monthly Housing Report Median Price $450,000 Coachella Valley Median Detached Home Price Dec 2002 - Dec 2016 $400,000 $350,000 $300,000 $339,930 $340,000 $250,000 $200,000 $150,000 CV
mymarket Report How is the market?
 mymarket Report How is the market? Lower North Island Autumn 2016 The latest property market update for the Lower North Island region. Helping you with your property decisions. mymarket Report Median property
FOR IMMEDIATE RELEASE Contact: David B. Bennett President & CEO Phone:
 FOR IMMEDIATE RELEASE Contact: David B. Bennett President & CEO Phone: 727-216-32 Email: dbennett@tampabayrealtor.com Real Estate Statistics for September 217 September s numbers are out, and it comes
Housing affordability
 Background Housing affordability A paper prepared by the PPTA executive For the 2008 Annual Conference, the Auckland region prepared a paper on the issue of housing affordability, calling for a taskforce
mymarket Report How is the market?
 mymarket Report How is the market? Lower North Island Autumn 2016 The latest property market update for the Lower North Island region. Helping you with your property decisions. mymarket Report Median property
SAMPLE REPORT CORELOGIC NEW ZEALAND MONTHLY PROPERTY MARKET & ECONOMIC UPDATE
 CORELOGIC NEW ZEALAND MONTHLY PROPERTY MARKET & ECONOMIC UPDATE JANUARY FEBRUARY 2017 About CoreLogic 4 CoreLogic Data and Analytics 6 Legal Disclaimer 7 Macro Economic and Demographic Indicators 8 New
Coachella Valley Median Detached Home Price Jan Jan 2017
 The Desert Housing Report Median Price $450,000 Coachella Valley Median Detached Home Price Jan 2002 - Jan 2017 $400,000 $350,000 $300,000 $250,000 $335,000 $340,000 $200,000 $150,000 CV Detached Median
mymarket Report How is the market?
 How is the market?,, Tokoroa & Autumn 2016 The latest property market update for the Central North Island region. Helping you with your property decisions. The market is picking up in Central North Island
Residential Real Estate Market Overview: April 2017 Data
 Residential Real Estate Market Overview: April 2017 Data 2017 Mark A. Melikian Chief Valuation Officer mark.melikian@summitvaluations.com 2800 River Road, Suite 460 The following is a market data summary
2013 Arizona Housing Market Mid-Year Report
 2013 Arizona Housing Market Mid-Year Report This mid-year market report outlines the latest trends in Arizona real estate. The housing market hit bottom in mid to late 2011, and has been in recovery mode
Smoothed Weighted National Housing Index (base = January 2008)
") HOUSING INDEX February 2013 House Prices Remain Stubbornly High 1 1 1 120 Smoothed Weighted National Housing Index (base = January 8) 178.6 102.2 Value Index Volume Index The FNB House Price Index fell
HOUSING INDEX February 2013 House Prices Remain Stubbornly High 1 1 1 120 Smoothed Weighted National Housing Index (base = January 8) 178.6 102.2 Value Index Volume Index The FNB House Price Index fell
Charlottesville Housing Market Report Year-End (Published by the Charlottesville Area Association of REALTORS )
") Charlottesville Housing Market Report - 2009 Year-End (Published by the Charlottesville Area Association of REALTORS ) This Quarterly Market Report is produced by the Charlottesville Area Association of
Charlottesville Housing Market Report - 2009 Year-End (Published by the Charlottesville Area Association of REALTORS ) This Quarterly Market Report is produced by the Charlottesville Area Association of
Rental Index. September 2018 (Q3 18)
") Rental Index September 2018 (Q3 18) Contents National rental trends 3 Data from offices trading over 10 years 3 Data including new Belvoir offices 3 Summary for England 4 Summary for Scotland 5 Summary
Rental Index September 2018 (Q3 18) Contents National rental trends 3 Data from offices trading over 10 years 3 Data including new Belvoir offices 3 Summary for England 4 Summary for Scotland 5 Summary
mymarket Report How is the market?
 How is the market? Otago Summer 2015 The latest property market update for the Otago region. Helping you with your property decisions. Queenstown Lakes District values continue to grow steadily, while
Rental Index. March 2018 (Q1 18)
") Rental Index March 2018 (Q1 18) Contents National rental trends 3 Data from offices trading over 10 years 3 Data including new Belvoir offices 3 Summary for England 4 Summary for Scotland 5 Summary for
Rental Index March 2018 (Q1 18) Contents National rental trends 3 Data from offices trading over 10 years 3 Data including new Belvoir offices 3 Summary for England 4 Summary for Scotland 5 Summary for
STATPAK MARKET IN A MINUTE A SUMMARY OF MARKET CONDITIONS FOR JULY McEnearney.com CONTRACTS URGENCY INDEX INVENTORY INTEREST RATES AFFORDABILITY
 STATPAK LOUDOUN COUNTY AUGUST 2017 McEnearney.com MARKET IN A MINUTE A SUMMARY OF MARKET CONDITIONS FOR JULY 2017 Contract activity in July 2017 was down 8.7% from July 2016, and there were decreases in
The Desert Housing Report. Coachella Valley Median Detached Home Price December December 2018
 Median Price $450,000 $400,000 Coachella Valley Median Detached Home Price December 2002 - $369,450 $389,944 $350,000 $300,000 $250,000 $200,000 $150,000 CV Detached Median Price 4% Growth Curve Summary
Housing Price Forecasts. Illinois and Chicago PMSA, January 2018
 Housing Price Forecasts Illinois and Chicago PMSA, January 2018 Presented To Illinois Realtors From R E A L Regional Economics Applications Laboratory, Institute of Government and Public Affairs University
Report ER5 Can Work, Cannot Afford to Buy the Intermediate Housing Market
 External Research Report Issue Date: 31/08/2015 ISSN: 2423-0839 Report ER5 Can Work, Cannot Afford to Buy the Intermediate Housing Market Ian Mitchell Project LR0484 Livingston and Associates Ltd funded
National Policy Statement on Urban Development Capacity Price efficiency indicators technical report: Price-cost ratios
 National Policy Statement on Urban Development Capacity Price efficiency indicators technical report: Price-cost ratios Acknowledgements: SensePartners is acknowledged for the development of this technical
III. Housing Profile and Analysis
 III. Housing Profile and Analysis 3-1 III. Housing Profile and Analysis A. Housing Types Information on the type of housing available is important to have a clear picture of what Lacey has in its housing
This Month in Real Estate
 Keller Williams Research This Month in Real Estate Released: September 14, 2009 Commentary. The Numbers That Drive Real Estate Recent Government Action. Research for Buyers and Sellers. 2 4 10 14 1 Green
Housing Price Forecasts. Illinois and Chicago PMSA, October 2014
 Housing Price Forecasts Illinois and Chicago PMSA, October 2014 Presented To Illinois Association of Realtors From R E A L Regional Economics Applications Laboratory, Institute of Government and Public
DATA FOR MAY Published June 23, Sales are up +11.3% month-over-month. The year-over-year comparison shows an increase of +11.1%.
 Permission is granted only to ARMLS Subscribers for reproduction with attribution on to ARMLS COPYRIGHT 2017. For questions regarding this publication contact Brand@ARMLS.com. DATA FOR MAY 2017 - Published
Auckland Monthly Housing Update. December 2018
 Auckland Monthly Housing Update December 2018 Table of contents 1. Summary... 3 2. Highlights... 4 3. Dwellings consented... 5 4. Dwellings consented by type... 6 5. Dwellings consented inside 2010 MUL...
Coachella Valley Median Detached Home Price May May 2018
 Median Price $450,000 $400,000 Coachella Valley Median Detached Home Price May 2002 - $389,000 $412,000 $350,000 $300,000 $250,000 $200,000 $150,000 CV Detached Median Price 4 % Growth Curve Summary The
FOR IMMEDIATE RELEASE Contact: David B. Bennett President & CEO Phone:
 FOR IMMEDIATE RELEASE Contact: David B. Bennett President & CEO Phone: 727-216-32 Email: dbennett@tampabayrealtor.com Real Estate Statistics for September 216 At this time of year everyone starts to get
The Impact of Market Rate Vacancy Increases Eight-Year Report
 The Impact of Market Rate Vacancy Increases Eight-Year Report January 1, 1999 - December 31, 2006 Santa Monica Rent Control Board March 2007 TABLE OF CONTENTS Summary 1 Units Rented at Market Rates Rates
2007 Sales (thru September)
") Third Quarter Market Report Challenges, Opportunities, and Surprises, Oh My! By Dave Phillips, CEO Charlottesville Area Association of REALTORS Someone named Anonymous once said, "Many an opportunity is
Third Quarter Market Report Challenges, Opportunities, and Surprises, Oh My! By Dave Phillips, CEO Charlottesville Area Association of REALTORS Someone named Anonymous once said, "Many an opportunity is
STATPAK MARKET IN A MINUTE A SUMMARY OF MARKET CONDITIONS FOR JUNE & FIRST HALF McEnearney.com CONTRACTS URGENCY INDEX INVENTORY INTEREST RATES
 STATPAK LOUDOUN COUNTY JULY 2018 McEnearney.com MARKET IN A MINUTE A SUMMARY OF MARKET CONDITIONS FOR JUNE & FIRST HALF 2018 Contract activity in June 2018 was up 5.1% from June 2017. Through the first
August 1, Victoria Housing Market Still Finding Its Balance
 August, 28 PRESIDENT Kyle Kerr PRESIDENT ELECT Cheryl Woolley SECRETARY TREASURER David Langlois PAST PRESIDENT Ara Balabanian DIRECTORS Jackie Adkins Sandi-Jo Ayers Bill Ethier Karen Dinnie-Smyth Andrew
Coachella Valley Median Detached Home Price April April 2017
 The Desert Housing Report Median Price $450,000 $400,000 Coachella Valley Median Detached Home Price April 2002 - $349,000 $389,000 $350,000 $300,000 $250,000 $200,000 $150,000 CV Detached Median Price
ental Market report Vacancy Rate Up Slightly Vacancy Rate Edges Higher in 2004 Charlottetown CA CHARLOTTETOWN Canada Mortgage and Housing Corporation
 4.8% r ental Market report Vacancy Rate Up Slightly CHARLOTTETOWN Canada Mortgage and Housing Corporation Volume 6 Edition 1 October 2004 www.cmhc.ca Vacancy Rate Edges Higher in 2004 The vacancy rate
mymarket Report How is the market?
 mymarket How is the market?, Rotorua, & Putaruru Summer 2017 The latest property market update for the Central North Island region. Helping you with your property decisions. mymarket After more than 7
MONTGOMERY COUNTY JULY 2018
 STATPAK MONTGOMERY COUNTY JULY 2018 McEnearney.com MARKET IN A MINUTE A SUMMARY OF MARKET CONDITIONS FOR JUNE & FIRST HALF 2018 Contract activity in June 2018 was up 1.2% from June 2017, solely because
Weekly Market Activity Report
 Weekly Market Report A RESEARCH TOOL FROM THE MINNEAPOLIS AREA ASSOCIATION OF REALTORS BROUGHT TO YOU BY THE UNIQUE DATA-SHARING TRADITIONS OF THE REALTOR COMMUNITY For Week Ending July 8, 2017 Publish
Housing Price Forecasts. Illinois and Chicago PMSA, March 2018
 Housing Price Forecasts Illinois and Chicago PMSA, March 2018 Presented To Illinois Realtors From R E A L Regional Economics Applications Laboratory, Institute of Government and Public Affairs University
Volume III Edition I 2011 Year end Recap What will 2012 Bring? Financing for Canadians Where are Canadians Buying in the Greater Phoenix area?
 The Realtors Canadians Trust www.arizonaforcanadians.com Volume III Edition I 2011 Year end Recap What will 2012 Bring? Financing for Canadians Where are Canadians Buying in the Greater Phoenix area? As
The Coldwell Banker Carlson Real Estate Market Report
 The Coldwell Banker Carlson Real Estate Market Report 2017 Year-End Stowe Area Report Our 2017 Year-End Market Report uses market-wide data, based on transactions that closed in 2017 in the Multiple Listing
PRINCE GEORGE S COUNTY AUGUST 2018
 STATPAK PRINCE GEORGE S COUNTY AUGUST 2018 McEnearney.com MARKET IN A MINUTE A SUMMARY OF MARKET CONDITIONS FOR JULY 2018 Contract activity in July 2018 was up 19.7% from July 2017, and through the first
DATA FOR OCTOBER Published November 14, Sales are down -0.8% month-over-month. The year-over-year comparison is at 4.1%.
 Permission is granted only to ARMLS Subscribers for reproduction with attribution on to ARMLS COPYRIGHT 2017. For questions regarding this publication contact Brand@ARMLS.com. DATA FOR OCTOBER 2017 - Published
STATPAK MARKET IN A MINUTE A SUMMARY OF MARKET CONDITIONS FOR AUGUST McEnearney.com CONTRACTS URGENCY INDEX INVENTORY INTEREST RATES
 STATPAK WASHINGTON, DC SEPTEMBER 2017 McEnearney.com MARKET IN A MINUTE A SUMMARY OF MARKET CONDITIONS FOR AUGUST 2017 Contract activity in August 2017 was up 4.9% from August 2016, and there were increases
San Francisco Bay Area to Santa Clara and San Benito Counties Housing and Economic Outlook
 San Francisco Bay Area to 2020 Santa Clara and San Benito Counties Housing and Economic Outlook Economic Forecast Summary 2017 Presented by Pacific Union International, Inc. and John Burns Real Estate
MARKET AREA UPDATE Report as of: 1Q 2Q 3Q 4Q
 MARKET AREA UPDATE Report as of: 1Q 2Q 3Q 4Q Year: 2013 Market Area (City, State): Arlington, Virginia Provided by (Company / Companies): McEnearney Associates, Inc. Realtors What are the most significant
CAAR Market Report 2010 Mid-Year Published by the Charlottesville Area Association of REALTORS
 CAAR Market Report 2010 Mid-Year Published by the Charlottesville Area Association of REALTORS Where Are We Now? The pace of home purchases in the Charlottesville market area showed a significant increase
REAL ESTATE MARKET OVERVIEW 1 st Half of 2015
 REAL ESTATE MARKET OVERVIEW 1 st Half of 2015 With Comparisons to the 2 nd Half of 2014 September 4, 2015 Prepared for: First Bank of Wyoming Prepared by: Ken Markert, AICP MMI Planning 2319 Davidson Ave.
BONDREPORT QTR BONDREPORT QTR BONDNEWYORK.COM
 BONDREPORT QTR 4 2017 WELCOME TO THE 19 TH EDITION OF THE BOND REPORT It has been quite the year on many fronts, and by all indications, 2017 has no intention of going quietly. The market has continued
News Release FOR IMMEDIATE RELEASE
 News Release FOR IMMEDIATE RELEASE Housing market factors indicate stability in recent months VANCOUVER, B.C. October 4, home sales in Greater Vancouver were consistent with activity experienced in the
edition number two 2016 Otago Market Report Highland Real Estate Group Ltd With you all the way.
 edition number two 216 Otago Market Report Highland Real Estate Group Ltd With you all the way. PROPERTY MARKET OVERVIEW DEMAND STILL ON THE UP AND UP LISTINGS NEEDED As predicted buyer pressure has continued,
ARLA Members Survey of the Private Rented Sector
 Prepared for The Association of Residential Letting Agents & the ARLA Group of Buy to Let Mortgage Lenders ARLA Members Survey of the Private Rented Sector Fourth Quarter 2010 Prepared by: O M Carey Jones
The Corcoran Report 4Q16 MANHATTAN
 The Corcoran Report 4Q16 MANHATTAN Contents Fourth Quarter 2016 4/7 12/23 3 Overview 8 9 10 Market Wide 11 Luxury 24 2 Sales / Days on Market 3 Inventory / Months of Supply 4 5 Market Share Resale Co-ops
ECONOMIC CURRENTS. Vol. 5 Issue 2 SOUTH FLORIDA ECONOMIC QUARTERLY. Key Findings, 2 nd Quarter, 2015
 ECONOMIC CURRENTS THE Introduction SOUTH FLORIDA ECONOMIC QUARTERLY Economic Currents provides an overview of the South Florida regional economy. The report presents current employment, economic and real
FOR IMMEDIATE RELEASE Contact: David B. Bennett President & CEO Phone:
 FOR IMMEDIATE RELEASE Contact: David B. Bennett President & CEO Phone: 727-216-32 Email: dbennett@tampabayrealtor.com Real Estate Statistics for December 217 wrapped up a sizzling 217 with a steady month
Housing market report
 Capital city market report Prepared August Dr Andrew Wilson, Senior Economist Australian Property Monitors Buyer momentum rises through mid-winter housing markets National overview Buyer and seller momentum
FOR IMMEDIATE RELEASE Contact: Bobette Banks Director of Communications Greater Capital Area Association of REALTORS
 FOR IMMEDIATE RELEASE Contact: Bobette Banks 301-590-8764 Director of Communications Greater Capital Area Association of REALTORS bbanks@gcaar.com November 2015 Washington, DC Market Trends Report Median
DATA FOR FEBRUARY Published March 20, Sales are up +19.6% month-over-month. The year-over-year comparison is down -7.3%.
 Permission is granted only to ARMLS Subscribers for reproduction with attribution on to ARMLS COPYRIGHT 2019. For questions regarding this publication contact Brand@ARMLS.com. DATA FOR FEBRUARY 2019 -