The High Cost of Short-Term Rentals in New York City
|
|
|
- Austen Doyle
- 6 years ago
- Views:
Transcription


1 The High Cost of Short-Term Rentals in New York City David Wachsmuth David Chaney Danielle Kerrigan Andrea Shillolo Robin Basalaev-Binder January 30, 2018 A report from the Urban Politics and Governance research group School of Urban Planning McGill University 1
2 Executive Summary This report provides a comprehensive analysis of Airbnb activity in New York City and the surrounding region in the last three years (September August 2017). Relying on new methodologies to analyze big data, we set out to answer four questions: 1. Where is Airbnb activity located in New York, and how is it changing? 2. Who makes money from Airbnb in New York? 3. How much housing has Airbnb removed from the market in New York? 4. Is Airbnb driving gentrification in New York? KEY FINDINGS: Two Thirds of Revenue from Likely Illegal Listings: Entire-home/apartment listings account for 75% ($490 million) of total Airbnb revenue and represent 51% of total listings. 87% of entire-home reservations are illegal under New York State law, which means that 66% of revenue ($435 million) and 45% of all New York Airbnb reservations last year were illegal. 13,500 Units of Lost Housing: Airbnb has removed between 7,000 and 13,500 units of housing from New York City s long-term rental market, including 12,200 frequently rented entire-home listings that were available for rent 120 days or more and 5,600 entire-home listings available for rent 240 days or more. $380 More in Rent: By reducing housing supply, Airbnb has increased the median long-term rent in New York City by 1.4% over the last three years, resulting in a $380 rent increase for the median New York tenant looking for an apartment this year. In some Manhattan neighborhoods the increase is more than $700. 4,700 Ghost Hotels: There are 4,700 privateroom listings that are in fact ghost hotels comprising many rooms in a single apartment. These ghost hotels have removed 1,400 units of housing from the long-term rental market, and are a new tactic for commercial Airbnb operators to avoid regulatory scrutiny. 28% of Revenue: Commercial operators that control multiple entire-home/apartment listings or large portfolios of private rooms are only 12% of hosts but they earn more than 28% of revenue in New York City. Top 10% of Hosts: The top 10% of hosts earned a staggering 48% of all revenue last year, while the bottom 80% of hosts earned just 32%. 200% and $100K More: The median host of a frequently rented entire-home/apartment 2

3 Executive Summary listing earned 55% more than the median long-term rent in its neighborhood last year. This disparity between short-term and long-term rents is driving Airbnb-induced housing loss and gentrification. Nearly 300 unique listings earned $100,000 or more last year. Racialized Revenue: White neighborhoods make systematically more money on Airbnb than non-white neighborhoods. Neighborhoods with high existing Airbnb revenue (generally in Midtown and Lower Manhattan) are disproportionately white. But the fastest-growing neighborhoods for Airbnb (particularly Harlem and Bedford-Stuyvesant) are disproportionately African American. 72% of the Population: Nearly three quarters of the population in neighborhoods at highest risk of Airbnb-induced gentrification across New York is nonwhite, as Airbnb continues to have a strongly racialized impact across the city. Airbnb as a Racial Gentrification Tool : In March 2017, InsideAirbnb.com released a report that categorized host photographs in all predominantly Black NYC neighborhoods. That report s key findings have been cited in this new report: Across all 72 predominantly Black New York City neighborhoods, Airbnb hosts are 5 times more likely to be white. In those neighborhoods, the Airbnb host population is 74% white, while the white resident population is only 14%. White Airbnb hosts in Black neighborhoods earned an estimated $160 million, compared to only $48 million for Black hosts a 530% disparity. The loss of housing and neighborhood disruption due to Airbnb is 6 times more likely to affect Black residents, based on their majority presence in Black neighborhoods, as residents in these neighborhoods are 14% white and 80% Black. 3

4 Table of Contents EXECUTIVE SUMMARY p. 2 INTRODUCTION 1. WHERE IS AIRBNB ACTIVITY LOCATED, AND HOW IS IT CHANGING? 2. WHO MAKES MONEY FROM AIRBNB? 3. HOW MUCH HOUSING HAS AIRBNB REMOVED FROM THE MARKET? 4. IS AIRBNB DRIVING GENTRIFICATION? p. 5 p. 9 p. 18 p. 25 p. 34 APPENDIX: DATA AND METHODOLOGY REFERENCES AUTHORSHIP AND FUNDING ACKNOWLEDGMENTS ABOUT UPGO p. 43 p. 47 p. 48 p. 48 p. 48 4
5 Introduction Community groups and housing advocates in cities across the world have begun to sound the alarm about the impact Airbnb is having on affordable housing in their communities, citing concerns about housing supply lost, racialized gentrification, and impact on residents quality of life. To understand Airbnb s impact on housing in New York, this report presents a comprehensive analysis of three years of Airbnb activity in New York City and the surrounding region. It relies on the most comprehensive third-party dataset of Airbnb activity available, and new methodologies for spatial analysis of big data. AIRBNB AND ITS CRITICS IN NEW YORK Community groups and housing advocates in cities across the world have begun to sound the alarm about Airbnb s impact on affordable housing in their communities, citing concerns about housing supply lost, racialized gentrification, and impact on residents quality of life (see, e.g., BJH Advisors 2016; Lee 2016; Samaan 2015; New York Communities for Change 2015; Wachsmuth et al. 2017; Wieditz 2017). Several years ago, a study by New York Communities for Change and Real Affordability for All found that Airbnb took approximately 20% of vacancies off the market in certain Manhattan and Brooklyn zip codes, and up to 28% in the East Village neighborhood, even though it is technically illegal to rent an entire unit for fewer than 30 days in most buildings. Overall, they estimated that the 20 neighborhoods most popular on Airbnb have lost 10% of rental units (NYCC and RAFA 2015). These neighborhoods are also featured in Airbnb s neighbourhood guides. More recently, a study found that Airbnb hosts are prone to reject African-American guests even if it means a loss in possible income (Edelman et al. 2017). Another another study found that short-term rentals are growing faster in Black neighborhoods in New York, displacing and otherwise disproportionately affecting Black residents while accruing wealth for white residents (Cox 2017). Quality of life is also a concern for residents who have seen their neighbourhoods transformed into de facto hotel districts (Cócola Gant 2016). In the fall of 2016, residents of New Orleans, still recovering from Hurricane Katrina, held a jazz funeral at city hall (with coffins reading RIP real neighbors and RIP affordable housing ) to mourn neighbourhoods lost to Airbnb tourism in a protest (Litten 2016). Meanwhile, hotel associations complain that short-term rentals effectively function as hotels but have an unfair advantage because they don t pay taxes and don t comply with safety and zoning regulations. Airbnb has effectively created a new category of rental housing short-term rentals which occupies a gap between traditional residential rental housing and hotel accommodation. Nonetheless, Airbnb s impact on cities and housing markets is not well understood, in part because the company takes great pains to cloud its operations from scrutiny. The New York 5

6 term is normally understood (occasional shortterm rentals of a family s primary residence or a room within the primary residence), but rather a new form of de facto hotel. Either concern, if justified, would represent a serious problem for municipal authorities. But reliable, up-to-date evidence has been hard to come by. Accordingly, we set out to answer four questions using rigorous empirical analysis: Attorney General, for example, was forced to subpoena Airbnb s data for the city, which the company eventually provided only in anonymized form. It was unclear how many transactions were excluded, and the Attorney General s office had to accept the anonymization in good faith. Airbnb s business model has been particularly controversial because it so clearly flouts existing housing and land-use regulations in many or even most of the cities in which it operates, and does so in a fashion which appears to undermine policies aimed at protecting the supply of affordable housing. Airbnb and its advocates insist that these regulations must be updated to accommodate the new possibilities presented by the sharing economy. Opponents argue that Airbnb aims to avoid regulation and taxation, and threatens affordable housing in cities. REPORT OBJECTIVES The report is motivated by the concerns increasingly raised by local communities and housing advocates that short-term rentals are having a detrimental impact on housing availability and affordability in New York. These concerns are closely connected to a widespread suspicion that a large amount of activity on shortterm rental platforms is not home sharing as the 1. Where is Airbnb activity located in New York, and how is it changing? 2. Who makes money from Airbnb in New York? 3. How much housing has Airbnb removed from the market in New York? 4. Is Airbnb driving gentrification in New York? The findings in this report are based on a comprehensive study of three years of Airbnb activity in the New York region. Relying on estimates of Airbnb activity from the consulting firm Airdna, we measured and analyzed more than 80 million data points, relying on new spatial big data methodologies developed specifically to analyze short-term rentals. (The methodology is outlined in detail in the appendix.) We collected and analyzed data for the entire 20-million population New York metropolitan region, which includes significant seasonal tourism destinations such as Long Island and the New Jersey Shore. These latter areas receive large numbers of Airbnb tourists each summer, and so are important components of the region s short-term rental activity. But because the report s focus is the relationship of short-term rentals to urban housing availability and affordability, we tend not to emphasize these areas in our findings. Instead, we focus on New York City. In general, we present all aggregate figures for a) New York City, b) the borough of Manhattan, c) the borough of Brooklyn, and d) the areas of the metropolitan region outside of New York City. 6

7 SUMMARY OF KEY FINDINGS The report provides detailed analysis of three years of Airbnb activity in New York, including profiles of neighborhoods with disproportionate shares of either total Airbnb activity or new growth. The key report findings are as follows: Two Thirds of Revenue from Likely Illegal Listings: Entire-home/apartment listings account for 75% ($490 million) of total Airbnb revenue and represent 51% of total listings. 87% of entire-home reservations are illegal under New York State law, which means that 66% of revenue ($435 million) and 45% of all Airbnb reservations in New York City last year were illegal. 13,500 Units of Lost Housing: Airbnb has removed between 7,000 and 13,500 units of housing from New York City s long-term rental market, including 12,200 frequently rented entire-home listings that were available for rent 120 days or more and 5,600 entire-home listings available for rent 240 days or more. $380 More in Rent: By reducing housing supply, Airbnb has increased the median long-term rent in New York City by 1.4% over the last three years: a $380 rent increase for the median New York tenant looking for an apartment this year. In some Manhattan areas the increase is $700 or more. 4,700 Ghost Hotels: There are 4,700 privateroom listings that are in fact ghost hotels comprising many rooms in a single apartment or building. These ghost hotels have removed 1,400 units of housing from the long-term rental market, and represent a new tactic for commercial Airbnb operators to avoid regulatory scrutiny. 28% of Revenue: Commercial operators that control multiple entire-home listings or large portfolios of private rooms are only 12% of hosts but earn more than 28% of revenue in New York City. Top 10% of Hosts: The top 10% of hosts earned a staggering 48% of all revenue last year, while the bottom 80% of hosts earned just 32%. 7

8 200% and $100K More: The median host of a frequently rented entire-home/apartment listing earned 55% more than the median long-term rent in its neighborhood last year. This disparity between short-term and long-term rents is driving Airbnb-induced housing loss and gentrification. Nearly 300 unique listings earned $100,000 or more last year. Racialized Revenue: White neighborhoods make systematically more money on Airbnb than nonwhite neighborhoods. Neighborhoods with high existing Airbnb revenue (generally in Midtown and Lower Manhattan) are disproportionately white. But the fastest-growing neighborhoods for Airbnb (particularly Harlem and Bedford-Stuyvesant) are disproportionately African American. 72% of the Population: Nearly three quarters of the population in neighborhoods at highest risk of Airbnb-induced gentrification across New York is non-white, as Airbnb continues to have a strongly racialized impact across the city. Airbnb as a Racial Gentrification Tool : In March 2017, InsideAirbnb.com released a report that categorized host photographs in all predominantly Black NYC neighborhoods. That report s key findings have been cited in this new report: Across all 72 predominantly Black New York City neighborhoods, Airbnb hosts are 5 times more likely to be white. In those neighborhoods, the Airbnb host population is 74% white, while the white resident population is only 14%. White Airbnb hosts in Black neighborhoods earned an estimated $160 million, compared to only $48 million for Black hosts a 530% disparity. The loss of housing and neighborhood disruption due to Airbnb is 6 times more likely to affect Black residents, based on their majority presence in Black neighborhoods, as residents in these neighborhoods are 14% white and 80% Black. 8
9 1. Where is Airbnb activity located, and how is it changing? In the last year, Airbnb growth in New York City has slowed down considerably. Revenue-earning listings grew by only 4.5% (to 67,100) citywide, and even shrunk by 3% (to 34,000) in Manhattan. Total host revenue grew by 14% (to $657 million) between 2016 and 2017, a major slowdown from the previous year s growth rate of 35% (to $576 million). However, growth remains strong in several North Brooklyn and North Manhattan neighborhoods, even as it has stagnated in the areas with historically the most short-term rental activity. Entire-home Airbnb listings are a slim majority of total listings (51%, 34,300 listings) but account for 75% ($490 million) of total revenue. They predominate in Midtown and Lower Manhattan and North Brooklyn, while private-room listings are more common outside this core area. Nearly half of New York City listings in a given month are hosting illegal reservations. AIRBNB ACTIVITY ACROSS THE NEW YORK METROPOLITAN REGION In the past year (September August 2017), there were 67,100 listings reserved at least once on Airbnb in New York City a 4.5% increase from the previous year (64,200 listings), and a 37% increase from the year before that (48,800 listings). It is not the case, however, that there are 67,100 listings receiving reservations at any given time there is a large amount of churn in the market and, on average, half of the listings available on Airbnb in a given month receive at least one reservation. Just over 50% (34,000) of these listings are in Manhattan, while 37% Listings reserved at least once in the last year % increase over previous year Listings available at least once in the last year Listings reserved month-to-month Listings available month-to-month New York City 67, % 95,500 16,100-25,700 50,000-59,100 Manhattan 34, % 49,000 7,900-15,600 25,500-30,000 Brooklyn 25, % 35,100 6,200-11,100 18,300-21,900 Rest of MSA 18,200 48% 25,000 3,700-10,200 12,500-18,200 Figure 1a. Airbnb listings in the New York region 9


.")


10 (25,000) are in Brooklyn. Although listings in the former have decreased year-overyear, they continue to grow robustly in the latter. New York City is responsible for the overwhelming majority of Airbnb activity in the wider metropolitan region (the New York MSA), but listings in the rest of the MSA are growing at more than ten times New York City s rate (Figure 1a). The number of revenue-earning listings is the clearest indicator of the fluctuations of the short-term rental market. Figure 1b aggregates this count and represents it spatially in three heatmaps of revenueearning Airbnb listings, and indicates both the expansion and intensification of listing density in the New York region over the last three years. Manhattan, Midtown, the West Side, and the Lower East Side have consistently seen the greatest concentration of Airbnb activity; off the island of Manhattan, only Williamsburg in Brooklyn is comparable. In the last two years, however, new hotspots have been emerging in Brooklyn (Bushwick and Bedford-Stuyvesant), Manhattan (the Upper West Side and Harlem), and New Jersey (Jersey City). Figure 1b. The growth in revenue-earning Airbnb listings, Sep Aug
11 AIRBNB S DECLINING GROWTH IN NEW YORK: MANHATTAN DOWN, BROOKLYN UP Airbnb s growth in New York City has decisively slowed down in the last year. For the year ending August, total host revenue grew by 35% (to $576 million) between 2015 and 2016, but only by 14% (to $657 million) between 2016 and Figure 1c shows the month-to-month change in the number of listings which receive at least one reservation. (These figures are seasonally 30,000 adjusted, as discussed in the Appendix.) Two patterns are apparent. First, a slowdown in listing growth across New York City, even as the rest of the region continues to grow. Second, a convergence between Manhattan and Brooklyn, with the latter borough drawing within a few thousand listings of the former for the first time ever. 200% 22, % 100% 15,000 50% 7,500 0 Sep 14 Feb 15 Jul 15 Dec 15 May 16 Oct 16 Mar 17 Aug 17-50% New York City Manhattan Brooklyn Rest of MSA Figure 1c. Seasonally adjusted revenue-earning listings: month-to-month listings (left) and year-over-year growth rate (right) 0% Sep 15 Dec 15 Mar 16 Jun 16 Sep 16 Dec 16 Mar 17 Jun 17 Even as the growth of new listings has slowed down in the last year, revenue growth in New York City has stagnated completely (Figure 1d.). While the wider New York region has continued to see moderate (though slowed) revenue growth, average year-over-year growth in the city has been flat for the last six months, with significant shrinkage in Manhattan (an average of -6% over the last six months) balanced out by continuing (although slowing) growth in Brooklyn (averaging 9% over the last six months). As a result of Manhattan s decline in contrast to Brooklyn s growth, the latter borough now accounts for a historically large proportion of New York City s Airbnb activity 32% ($195 million) of monthly revenue at the end of the study period, compared to 27% ($114 million) at the beginning. 11
12 $60M 200% $45M 150% 100% $30M 50% $15M $0M Sep 14 Feb 15 Jul 15 Dec 15 May 16 Oct 16 Mar 17 Aug 17-50% New York City Manhattan Brooklyn Rest of MSA Figure 1d. Seasonally adjusted host revenue: month-to-month revenue (left), year-over-year growth rate (right) 0% Sep 15 Dec 15 Mar 16 Jun 16 Sep 16 Dec 16 Mar 17 Jun % 75% 50% 25% 0% Sep 14 Nov 14 Jan 15 Mar 15 May 15 Jul 15 Sep 15 Nov 15 Jan 16 Mar 16 May 16 Jul 16 Sep 16 Nov 16 Jan 17 Mar 17 May 17 Jul 17 Figure 1e. New York City s declining share of the region s Airbnb host revenue 12


13 Recent months have also seen the intensification of a longer-term trend: over time, New York City has accounted for a smaller and smaller proportion of the New York region s Airbnb activity. As Figure 1e shows, each summertime New York City s share of total regional revenue plummets, since listings outside the city are more likely to be seasonally variable vacation homes. But, each year, New York City s peak share of revenue (in the winter) has been lower than the one before it, and its lowest share (in the summer) has been lower still. While in 2015 August saw 82% of regional revenue go to New York City, that proportion fell to 57% in Current trends suggest that, for the first time, New York City will account for a minority of monthly regional revenue in the summer of THE SHIFTING DOMINANCE OF ENTIRE-HOME LISTINGS A majority of revenue-earning Airbnb listings (51%, 34,300 listings) in New York City are entire homes. Entire-home listings account for a disproportionate share of host revenue 75% of the total ($490 million out of $657 million). However this proportion varies geographically; broadly speaking, Manhattan has a far higher proportion of entire-home listings than Brooklyn. Figure 1f shows the variation in entire home listing proportion across the region, and demonstrates a concentration of entire-home listings stretching continuously from Midtown Manhattan down through Park Slope in Brooklyn. The ratio of entire-home to private-room listings has also been changing steadily over time. Entire homes are accounting for fewer and fewer of all active listings, and this pattern is consistent across New York City and each borough (although not the rest of the region, where the proportion is rising slightly). At the same time, the proportion of host revenue earned by entire-home listings has not declined at the same rate. Although they have decreased slightly in number in New York City Figure 1f. Percentage of all revenue-earning listings which are entire homes in the last year, by census tract and Manhattan, entire homes are now earning proportionally more revenue in Brooklyn and outside New York City (Figure 1g). Since entirehome and private-room Airbnb rentals have very different implications for housing availability and regulatory compliance, these patterns will be explored at length in the rest of the report. 13
14 100% 100% 85% 85% 70% 70% 55% 55% 40% % New York City Manhattan Brooklyn Rest of MSA Figure 1g. Percentage of all revenue-earning listings (left) and host revenue (right) from entire homes HOW MANY AIRBNB LISTINGS IN NEW YORK CITY ARE ILLEGAL? Under New York State s Multiple Dwelling Law (MDL), short-term rentals of fewer than 30 days are illegal in buildings with 3 or more units unless the owner is present. Any entire-home rental of fewer than 30 days in such a building is therefore almost certainly an illegal rental. Using our dataset in combination with census-tract information from the American Community Survey about building types, we are therefore able to estimate what percentage of Airbnb reservations violate the MDL, and what percentage of listings are in violation of the MDL at any given time. Private-room rentals will also violate the MDL if the owner is not present, as would be the case with ghost hotels, but it is difficult to make reliable estimates of the frequency of these illegal rentals because there is no way to reliably know if the owner is present. There are other reasons why a short-term rental might violate of regulations, notably for health and safety standards mandated by the New York City building code, but these cannot be assessed using our existing dataset. Since the current iteration of the Multiple Dwelling Law was passed in October 2016, we estimate that between 85 percent and 89 percent of entirehome rentals to have been illegal each month. This means, even assuming that all private-room listings are legal, that between 43 percent and 47 percent of reservations in New York City have been illegal. In any given month, between 14
15 7,600 and 12,700 listings have had illegal reservations accounting for between 42 percent and 46 percent of all active listings. In total over the last year, 45% of reservations were likely illegal, and these illegal reservations generated 66% ($435 million) of all host revenue. Because Manhattan has a higher proportion of entire-home listings than the other boroughs, along with a much higher proportion of multiunit apartment buildings (in which entire-home short-term rentals are generally illegal), it also has the highest proportion of illegal Airbnb listings. A majority (57%) of reservations in Manhattan last year were illegal, and these illegal reservations generated 77% of revenue. In Brooklyn, 37% of reservations and 58% of revenue were illegal. A small decline in the non-compliance rate occurred between October 2016 (when the Multiple Dwelling Law was revised) and January 2017 (when the revised law came into effect); however, a similar decline occurred the previous year, suggesting that this was just seasonal variation. When comparing the percentage of listings with illegal reservations for the October to July period from the year before, similar patterns and results are apparent, with between 43 percent and 49 percent of all listings in violation of the MDL from month to month (Figure 1h). At the same time, last year s level of illegality was consistently higher than this year s, a fact which largely reflects the growing prominence of (presumptively legal) private-room listings on Airbnb in New York. The available evidence thus leads to the conclusion that current regulations may be having a modest impact on illegal activity on the Airbnb platform. It is possible that heightened regulatory scrutiny under the Multiple Dwelling Act is driving an observable shift in Airbnb hosts from entire-home to private-room listings. 60% 50% 40% 30% Oct 16 Nov 16 Dec 16 Jan 17 Feb 17 Mar 17 Apr 17 May 17 Jun 17 Jul 17 % reservations which are illegal % listings w/ illegal reservations % listings w/ illegal reservations (previous year) Figure 1h. New York City reservations and listings in violation of the MDL 15
 $126 million (11%) Downtown Manhattan and Williamsburg (Chinatown, East Village, SoHo-TriBeCa, West Village, Williamsburg) 12,400 (-9.2%) $160 million (1.")
16 High Revenue Neighborhood (component areas) Rev.-earning listings (% growth) Total revenue (% growth) Midtown Manhattan (Chelsea, Clinton, Midtown, Upper West Side) 8,800 (0.0%) $126 million (11%) Downtown Manhattan and Williamsburg (Chinatown, East Village, SoHo-TriBeCa, West Village, Williamsburg) 12,400 (-9.2%) $160 million (1.1%) High Growth Neighborhood (component areas) Eastside Manhattan (Central Harlem, Central Harlem South, Gramercy, East Midtown) Rev.-earning listings (% growth) 4,200 (4.7%) Total revenue (% growth) $52.1 million (26%) North-Central Brooklyn (Bedford, Bushwick South, Crown Heights North, East Williamsburg, Park Slope, Stuyvesant Heights) 10,100 (10%) $75.7 million (23%) Figure 1i. Location of highlight neighborhoods and Airbnb performance last year NEIGHBORHOOD PROFILES The broad patterns above can be refined by analyzing a set of distinctive neighborhoods. Figure 1i identifies the 10 New York City neighborhoods with the highest total Airbnb host revenue, and the 10 other neighborhoods growing the fastest, and clusters them in four groups (Midtown Manhattan; Downtown Manhattan and Williamsburg; East Manhattan; and North- 16

17 Central Brooklyn). The boundaries are taken from neighborhood tabulation areas defined by the city government, which are meant to provide a middle-ground between the very small census tracts used elsewhere in the report, and the very large community districts used for city planning purposes. The map demonstrates at a glance that Airbnb s areas of historic intensity are on the west side and downtown of Manhattan, while the newer areas of growth are in Brooklyn and outlying parts of Manhattan. The table in Figure 1h summarizes current performance and growth characteristics of Airbnb listings in each of the highlight neighborhoods. It demonstrates a clear divergence between the historic Airbnb hotspots in Manhattan which at this point appear to be largely saturated, with an average revenue growth rate of only 4.6% in the last year and new emerging hotspots further from the center, which are bucking the city-wide trend of growth stagnation and grew their revenue on average 24% in the last year. 17
18 2. Who makes money from Airbnb? Airbnb revenue is distributed highly unequally among hosts in New York City. Commercial Airbnb operators, who have multiple entire-home listings or large portfolios of private rooms, are 12% of hosts but earn more than one quarter of revenue in New York City. The top 10% (5,000) of hosts earned a staggering 48% ($318 million) of all revenue last year, while the bottom 80% (40,400) of hosts earned just 32% ($209 million). The median listing earned a modest $4,100 last year, but at the high end of the market, more than 280 listings earned $100,000 or more. REVENUE GROWTH AND DISTRIBUTION The previous chapter established that Airbnb host revenue growth is slowing in New York City most notably in Manhattan, Airbnb s traditionally most lucrative submarket. This state of affairs makes all the more urgent the question of who is earning the revenue, since there may no longer be a rising tide to lift all boats. The simple answer is that revenue is distributed in a highly uneven fashion among New York hosts. Figures 2a and 2b summarize key statistics related to Airbnb revenue in the last year, and show large disparities between both geographical regions and individual hosts. On the first point, the most notable disparity is between Manhattan and Brooklyn: the former has high revenue per listing but slow growth, while the latter has low revenue per listing but faster growth. Across all geographies, the large gap between average revenue per listing and median revenue per listing reveals the unequal distribution of revenue: in general, where the average of a set of cases is much higher than the median, it indicates that a relatively small number of cases has pulled the average higher than the level at which most cases are clustered. However, focusing on revenue characteristics of all active listings in the last twelve months will tend to understate revenue performance, because, even with a relatively lower growth rate than previous years, many hosts joined in the middle of the last twelve months, and hence drag down average annual revenue. An arguably more accurate portrait of listing performance can be seen by examining only those listings which were active throughout the entire last twelve months. The same pattern is visible here, with the average revenue roughly double the median revenue. This indicates that, even among dedicated, long-term Airbnb listings, there is a large disparity in revenue earnings. Another way of analyzing inequality in revenue earning among Airbnb hosts is to look at earning percentiles. There were 50,500 income-earning hosts in New York City last year, who earned nearly $660 million between them. Just ten percent of these hosts earned half that revenue (48%, $319 million), and the top twenty percent of hosts earned a staggering 68% ($448 million) of all host revenue. The top 1% of hosts, each of whom earned substantially more than $100,000 on Airbnb last year, managed to earn 12% of total revenue ($76 million). As Figure 2c shows, this unequal distribution of host revenue looks 18
19 Total revenue (year-overyear growth) Average rev. per rev.- earning listing Median rev. per rev.- earning listing Average rev. per listing active year-round Median rev. per listing active year-round New York City $657 million (14%) $9,800 $4,100 $17,200 $10,200 Manhattan $414 million (8.5%) $12,200 $5,300 $22,200 $13,800 Brooklyn $195 million (21%) $7,800 $3,300 $13,700 $8,400 Rest of MSA $211 million (82%) $11,600 $5,000 $17,000 $9,100 Figure 2a. Revenue earned by Airbnb listings in the last year $90M $60M $30M $0M Sep 14 Nov 14 Jan 15 Mar 15 May 15 Jul 15 Sep 15 Nov 15 Jan 16 Mar 16 May 16 Jul 16 Sep 16 Nov 16 Jan 17 Mar 17 May 17 Jul 17 Other NYC Manhattan Brooklyn Rest of MSA Figure 2b. Geographic components of seasonally adjusted host revenue 19
20 very similar for the different New York region geographies. The concentration of Airbnb revenue among an extremely narrow segment of hosts provides vital context for debates about the benefits of home sharing to middle-class families for example Airbnb s (2014) claim that 87% of Airbnb hosts in New York share only the home in which they live. And 62% of Airbnb hosts said Airbnb helped them stay in their homes. These statements misleadingly suggest that most Airbnb reservations are hosted by smallscale, part-time hosts. In fact, half of rentals on the Airbnb platform are being conducted by only 10% of hosts many of whom, as we will explore shortly, are unambiguously commercial operators. Top 1% Top 10% Top 20% Remaining 80% 12% 11% 11% 16% 32% 33% 32% 31% 48% 47% 48% 50% 68% 67% 68% 69% 0% 35% 70% New York City Manhattan Brooklyn Rest of MSA Figure 2b. Geographic components of seasonally adjusted host revenue in the last year COMMERCIAL OPERATORS The term home sharing conjures an image of a family occasionally renting a spare room in their home, or perhaps renting their entire home for a brief period of time while they are out of town. And, indeed, this occasional use characterizes the majority of Airbnb hosts in New York. For example in summer 2017, during the peak tourism season of May to August, among the 56,300 listings in the region which were reserved at some point during these four months, the median listing was rented for 7 or 8 nights per month. And yet, as the revenue distribution figures presented above demonstrate, these occasional hosts might be the numerical majority of hosts, but they account for 20
21 a surprisingly small proportion of the actual rental activity on Airbnb and earn a surprisingly small proportion of the actual revenue. One way to isolate commercial operators is to look at hosts who have multiple listings on Airbnb. In particular, a host with more than one entire home listing is by definition a commercial operator, since only one of their listings could be their primary residence. Estimating commercial operators this way will dramatically underestimate their numbers, since it will fail to identify hosts who have a single listing which is not their primary residence and which they run as a business, and it will fail to identify hosts who have operate their listings via multiple Airbnb accounts, but it is a useful first approximation. We define a multi-listing as an entire-home listing whose host has at least one other entire-home listing, or a private-room listing whose host has at least two other private-room listings. (We set a higher threshold for private-room multi-listings to avoid falsely include a pair of spare rooms in a host s primary residence; there will be very few homes in the New York region that have both a primary resident living in them and three or more spare bedrooms.) Figure 2d summarizes basic facts about the nearly 20,000 multi-listings in New York City. Each of these listings, and the 28% ($184 million) of total platform revenue they represent, is by definition a commercial operation which does not represent any reasonable definition of home sharing. Instead, these are de facto hotel units which, as the next chapter will explore, are in direct competition with long-term housing for New Yorkers. Multi-listing hosts consistently earn a disproportionate share of revenue. In the last year, for example, they were just 12% of all revenue-earning hosts in New York (6,200 out of 50,500), but earned 28% of revenue ($184 million out of $657 million). Their share of revenue, however, has been declining substantially across all geographies, despite an ongoing rise in the proportion of listings which are multilistings (Figure 2e). Multi-listings continue to earn a disproportionately high share of revenue, but by a much narrower margin than in previous years. This appears to be a result of a shift in the composition of multi-listing units from entire homes to private rooms. Across all geographies, private room multi-listings have grown dramatically as a share of all listings, while entire- Entire-home multilistings (% of all entirehome listings) Private-room multi-listings (% of all private-room listings) Multi-listing revenue (% of total revenue) New York City 8,300 (24%) 7,700 (25%) $184 million (28%) Manhattan 5,200 (25%) 2,700 (22%) $110 million (27%) Brooklyn 2,400 (22%) 3,300 (25%) $56.9 million (29%) Rest of MSA 4,300 (39%) 2,400 (37%) $78.0 million (37%) Figure 2d. Multi-listing hosts in the New York region last year 21
22 40% 30% 20% 10% 0% New York City Manhattan Brooklyn Rest of MSA Figure 2e. Percentage of revenue earned by multi-listings (left), and proportion of revenueearning entire-home listings (center) and private-room listings (right) which are multi-listings home multi-listings have declined in the last year. Below we discuss the possibility that this trend represents a deliberate strategy of commercial operators to shift their listings away from (illegal) entire homes to private rooms, by relisting entire homes as multiple private rooms. The New York region has a number of extremely large Airbnb commercial operators. In particular, there are seven currently active hosts who control more than 100 listings. Most of these, however, are vacation rental companies active in traditional vacation areas, such as Long Island and the New Top Host Main area of operation # of revenue-earning listings Approximate annual revenue West Village Manhattan 7 $700,000 (Host closed account) Manhattan 16 $450,000 Anthony and Laura Queens 7 $450,000 Lisa Manhattan and Long Island 5 $400,000 in NYC, $250,000 outside Tatiana Manhattan and Long Island 9 $400,000 Figure 2f. The largest commercial operators by revenue in New York City last year 22


23 Jersey Shore. The largest commercial operator in the region by revenue earned, for example, is Symbol Management, a vacation rental company based in the Hamptons. It only entered the Airbnb market in February of 2017, but has nearly 300 entire homes listed on the service, and appears to have already earned nearly $1.5 million on the platform in half a year. Unlike some other cities, New York does not appear to see a dominance of its central city Airbnb market by very large firms with dozens or hundreds of listings. The top-earning host in New York City made $700,000 last year renting four entire homes and three private rooms. The five largest commercial operators by revenue in New York City are summarized in Figure 2f. (It is important to note that, because this population is extremely small, the uncertainty about these estimates is much higher than with the rest of the revenue estimates in the report, which are generally aggregating hundreds or thousands of listings.) Figure 2g shows the listing distributions of the entire-home listings for the four commercial operators of entire-homes listings in New York City. Each listing controlled by a single host is connected by a thin line to emphasize the spatial extent of each host s holdings. As the map indicates, among the largest operators, entire-home multi-listings are concentrated in Manhattan. Two of the hosts (shown in blue and purple on the map) have all their listings in Midtown and Downtown Manhattan. A third host (in green) has listings concentrated in Manhattan but with several in adjacent areas in Brooklyn. Only the largest operator (shown in red) has significant non-manhattan listings, although these are in fact west and north of New York City altogether. Figure 2g. The four largest commercial operators of entirehome listings in New York City last year THE HIGH END OF AIRBNB IN NEW YORK CITY The preceding sections demonstrated that a disproportionate amount of Airbnb host revenue is earned by a small high-end of hosts and commercial operators. What does that look like in New York City? More than 280 listings earned more than $100,000 last year, but the very highest-earning Airbnb listings in the city (which earned $200,000 or more) 23

24 Location Listing title excerpts Average annual revenue Average annual nights booked Average nightly rate Manhattan Brooklyn Ultra-Modern, West Village Townhouse, New Modern Townhouse, Heart of New York, Midtown Triplex Gorgeous Townhouse in Williamsburg, 6BR Duplex, 7 Bedrooms, Heart of Williamsburg, Gorgeous Historic Brownstone $281, $1,170 $158, $670 Figure 2h. The five highest-earning Airbnb properties in Manhattan and Brooklyn are concentrated exclusively in Manhattan in Midtown and Greenwich Village. Brooklyn s top earning properties, meanwhile, are nearly all in Williamsburg. Some characteristics from these properties are summarized in Figure 2h. The topearning listings in both Manhattan and Brooklyn were booked extremely frequently on average 240 nights a year (close to the feasible maximum, given the need for cleaning). All of the top Manhattan listings advertise their luxuriousness, prime location, and high-end facilities (Figure 2i). In a review of a Manhattan townhouse, one guest noted We usually stay in 5 star hotel suites in NYC and in comparison this is a great price point. Figure 2i. Photos from top-earning Airbnb rentals in New York City 24
25 3. How much housing has Airbnb removed from the market? Airbnb has removed between 7,000 and 13,500 units of housing from New York City s long-term rental market. In the last year, 12,200 entirehome listings were frequently rented (rented 60 days or more, and available 120 days or more), while 5,600 entire-home listings were very frequently rented (rented 120 days or more, and available 240 days or more). These listings are concentrated in Midtown and Downtown Manhattan, but are growing rapidly in Brooklyn, and taking up a larger and larger portion of the overall Airbnb market over time. Additionally, spatial cluster analysis reveals that 4,700 private-room listings are in fact ghost hotels comprising many rooms in a single apartment or building. This is perhaps the fastest growing category of listing in all of New York, and may represent a tactic for commercial Airbnb operators to avoid regulatory scrutiny. ENTIRE HOMES CONVERTED TO DEDICATED AIRBNB RENTALS Despite Airbnb s public-relations focus on small scale and occasional uses of its platform the way, for example, that homeowners can help meet their mortgage payments by hosting occasional guests most regulatory scrutiny of short-term rentals has been focused on entire homes which are frequently rented or available on shortterm rental platforms. This is for good reason: every home converted to full-time Airbnb use is subtracted from the pool of long-term rental housing units in a city. In many cases, full-time, entire-home Airbnb listings would have housed long-term tenants, whom the landlord evicted or failed to replace after they left. In other cases, particularly in recently built apartments and condominiums, the unit has spent its entire lifetime on the short-term rental market. Such listings were not literally removed from the long-term market, but they represent exactly the same loss of potential rental housing as units that were directly removed. If full-time, entire-home rentals on Airbnb were prohibited, both these types of unit would end up on the long-term rental market. Defining the threshold at which an Airbnb listing is likely to have departed the long-term housing market is difficult. There are probably people who travelled extremely frequently during a year, and were able to keep a unit as their primary residence while still renting it on Airbnb for 200 days in the year. And there are probably people who listed their unit year-round but set too high a price or were in an area with insufficient demand, and it only rented 25 days in total despite being otherwise unoccupied by a long-term resident. Setting the threshold too low will generate many false positives for example by counting as fulltime an apartment which was on Airbnb for a few weeks after one long-term tenant moved out and before another moved in, or an apartment which the long-term inhabitant puts on Airbnb during periods of occasional travel. On the other hand, 25
, and the number of days that a unit is either booked or available to be booked (")
26 setting the threshold too high will generate many false negatives, and end up underestimating the impact Airbnb is having on housing markets. We use two metrics to estimate frequent Airbnb usage: the number of days per year that a unit is booked ( occupancy ), and the number of days that a unit is either booked or available to be booked ( availability ). We define frequently rented as 60 days of occupancy and 120 days of availability. Sixty days of occupancy rules out most scenarios of occasional short-term rental, such as a landlord taking advantage of a one-month gap between long-term tenants, or a family leaving on a one-month summer vacation. Setting an additional constraint of 120 days of availability prevents the inclusion of listings which are rented relatively infrequently but with extremely high efficiency; for example, a homeowner who was out of town every weekend and listed their unit on Airbnb would only have 104 days of availability, and so would not be counted as full-time by our criteria even if they managed to rent the unit for 60 of those days. We also define a more stringent threshold of very frequently rented as 120 days of occupancy and 240 days of availability. While it is likely that very few frequently rented listings can also house long- Entire-home listings rented 60 days and available 120 days Percentage of revenue-earning entire-home listings Year-over-year growth rate Entire-home listings rented 120 days and available 240 days New York City 12,200 36% 14% 5,600 Manhattan 7,000 34% 20% 3,100 Brooklyn 4,200 38% 14% 2,000 Rest of MSA 3,200 29% 80% 1,100 Figure 3a. Frequently rented (60/120) entire-home listings in the New York region last year 26
27 60 days reserved 13, reserved, 120 available 12, reserved, 120 available 9, reserved 7, reserved, 240 available 5, ,000 10,000 15,000 Figure 3b. Entire-home listings in New York City at different thresholds of frequently rented term resident, it would be nearly impossible for a very frequently rented listing to have a long-term resident, since these listings are on Airbnb for at least 8 months of the year, and have short-term tenants for at least 4 months. According to these thresholds, there are 12,200 entire-home Airbnb listings in New York City which were frequently rented in the last year 5,600 of which were very frequently rented. These figures set reasonable upper and lower bounds on the number of housing units which have been removed from New York s housing market by Airbnb. The 5,600 very frequently rented entire homes have almost certainly been subtracted from the city s rental housing supply. The 12,200 frequently rented entire homes may also all have been removed from the long-term rental market; at minimum, they are at high risk of being removed. Figure 3a summarizes key facts related to frequently rented entire-home listings, while Figure 3b contextualizes these estimates by showing the number of entirehome listings in the New York region which meet a series of different definitions of frequently rented. In New York City, revenue-earning listings increased by 4.5% last year (from 64,200 to 67,100). By contrast, frequently rented entire-home listings increased by 14% in New York City (from 10,700 to 12,200). In other words, frequently rented entirehome listings are growing at approximately three times the overall listing growth rate. The significance of the frequently rented entirehome listings becomes even clearer when they are expressed as a percentage of total housing on a neighborhood scale. Figure 3c shows the proportion of total housing in each census tract that is frequently or very frequently rented on Airbnb over the last three years. It reveals significant areas of the city where 2% or more of total housing stock has either already been lost to Airbnb or is at serious risk of being lost. Figure 3d summarizes these patterns for the highlight neighborhoods, demonstrating that there are entire neighborhoods where more than 1% of housing has been lost or is under threat of being lost to Airbnb, along with other areas where the year-over-year growth rate of these listings has exceeded 30%. 27

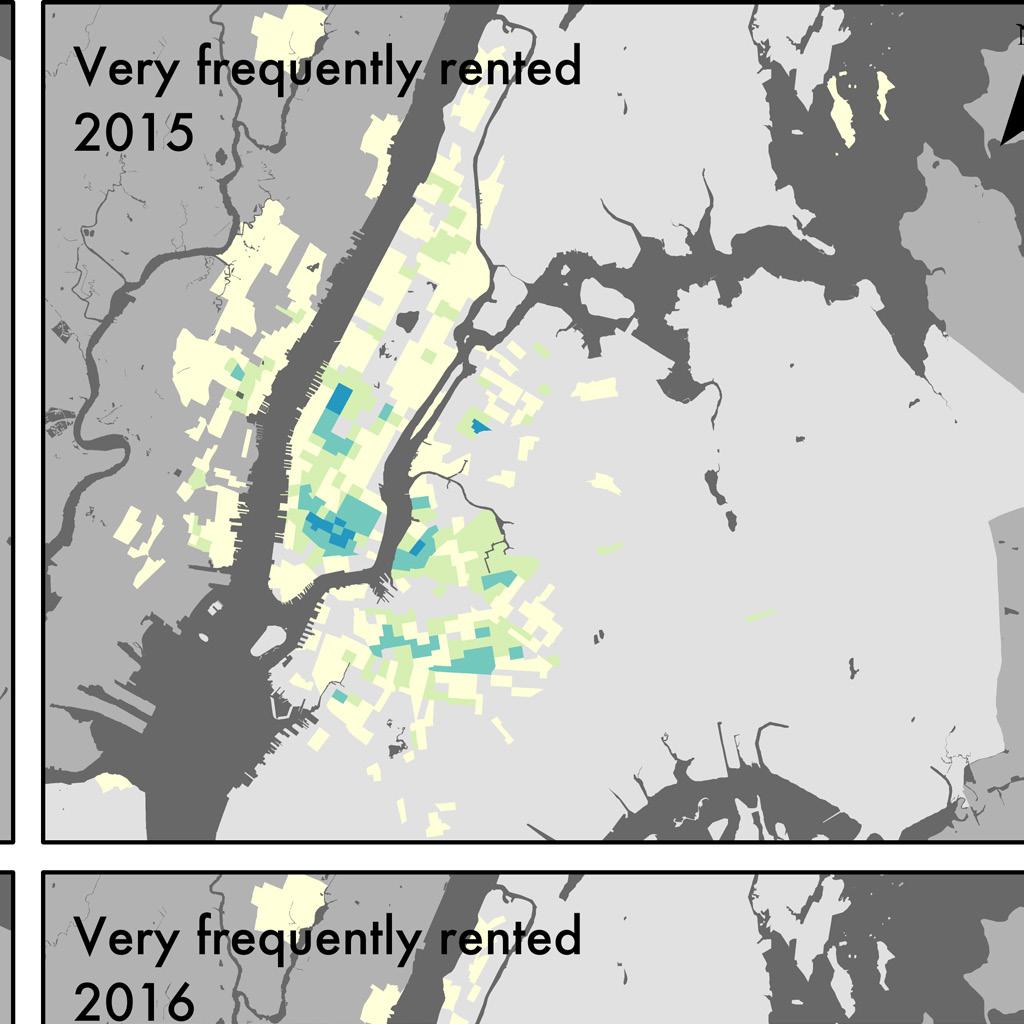
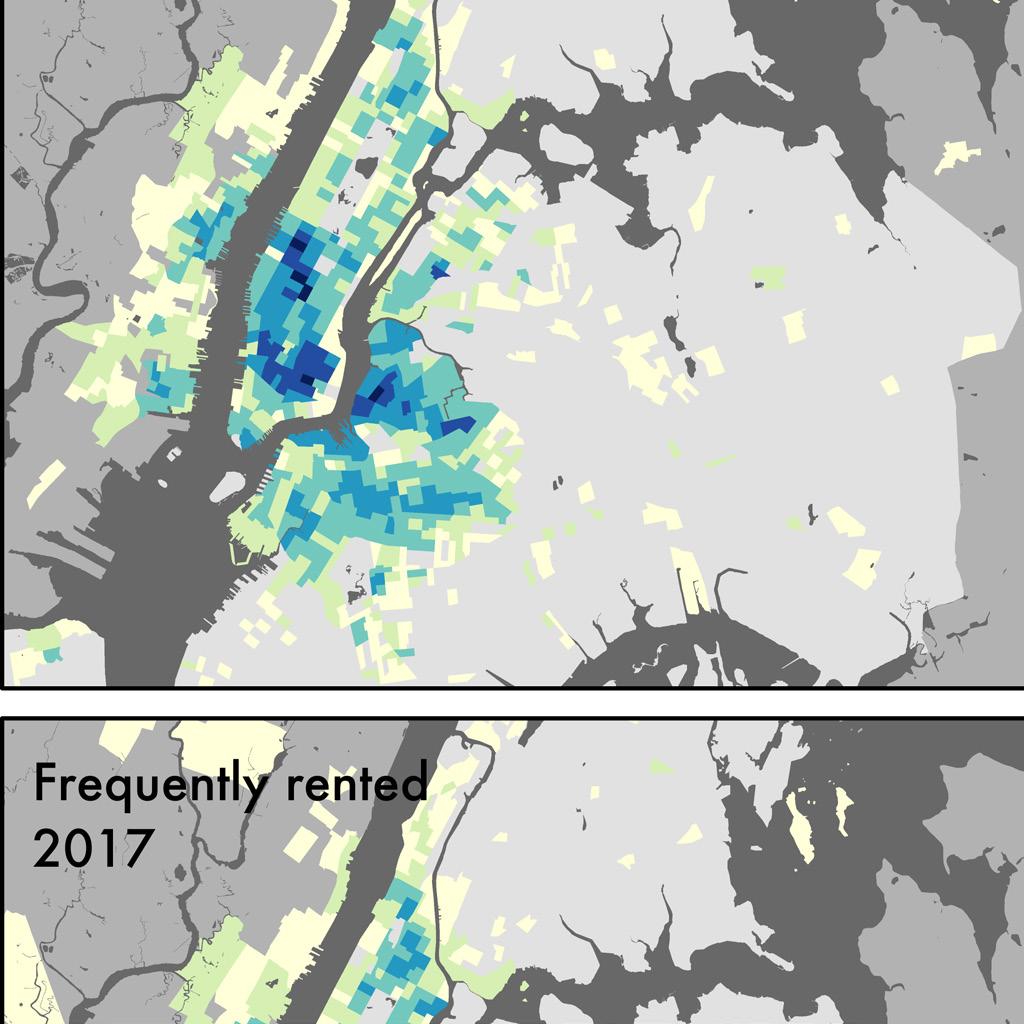
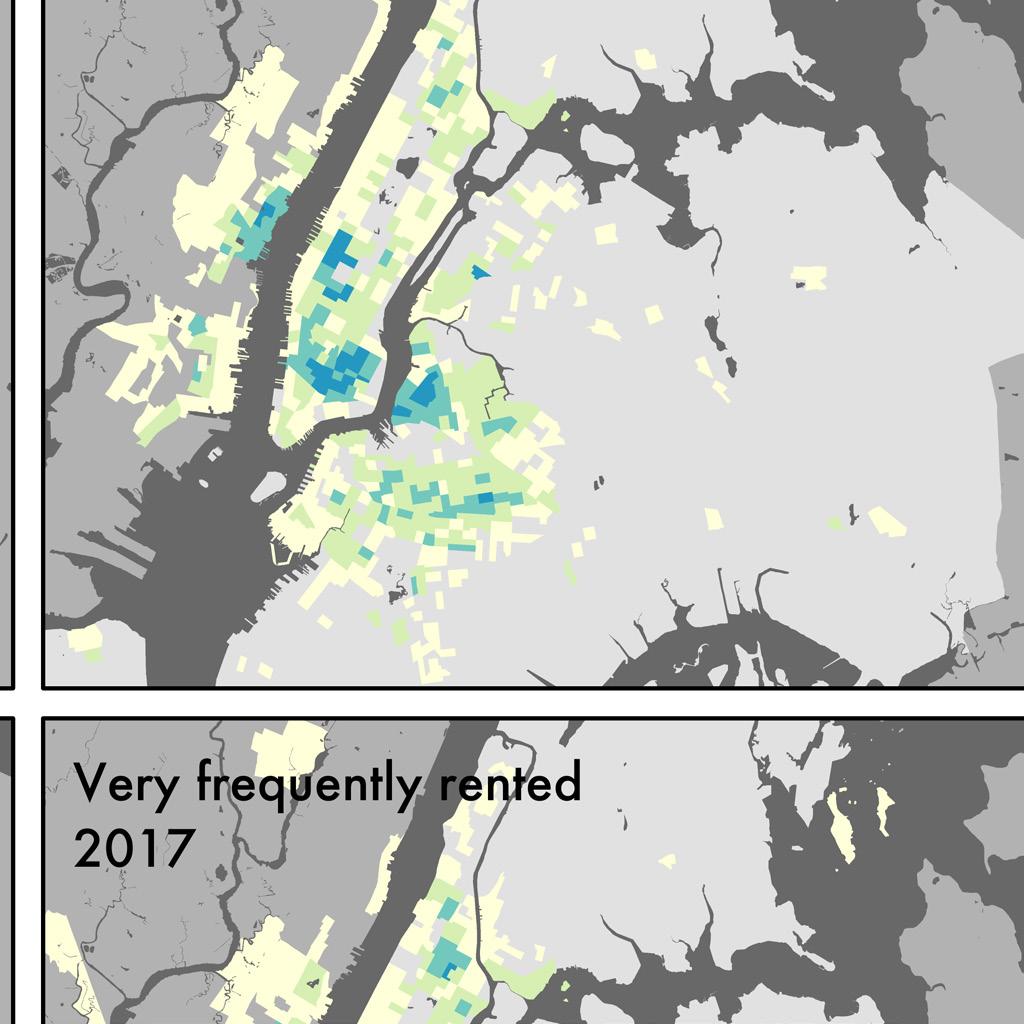
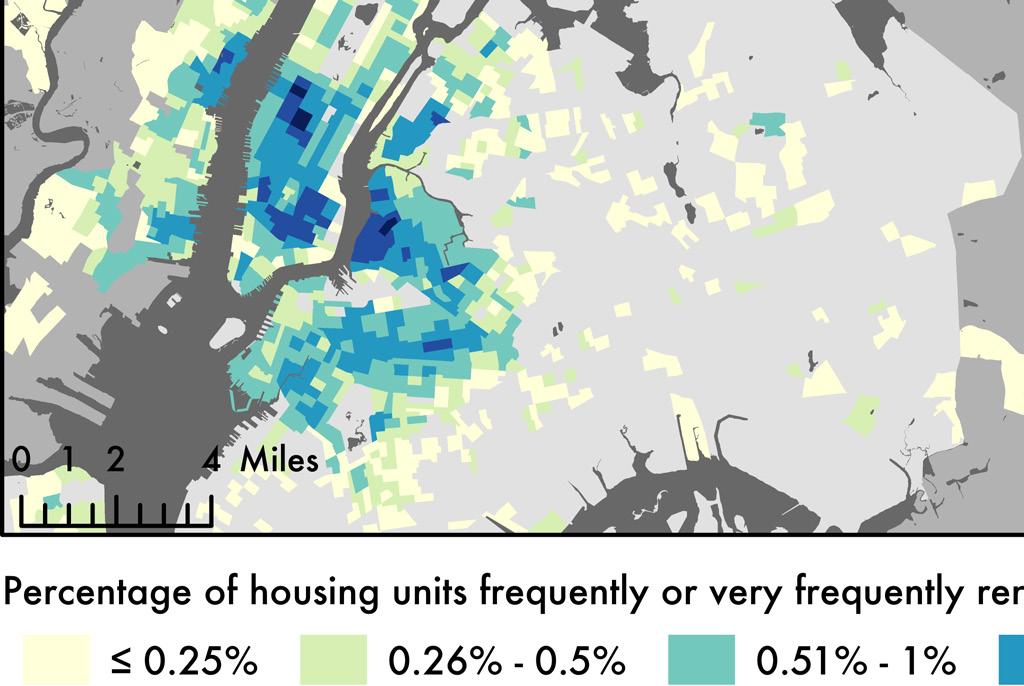
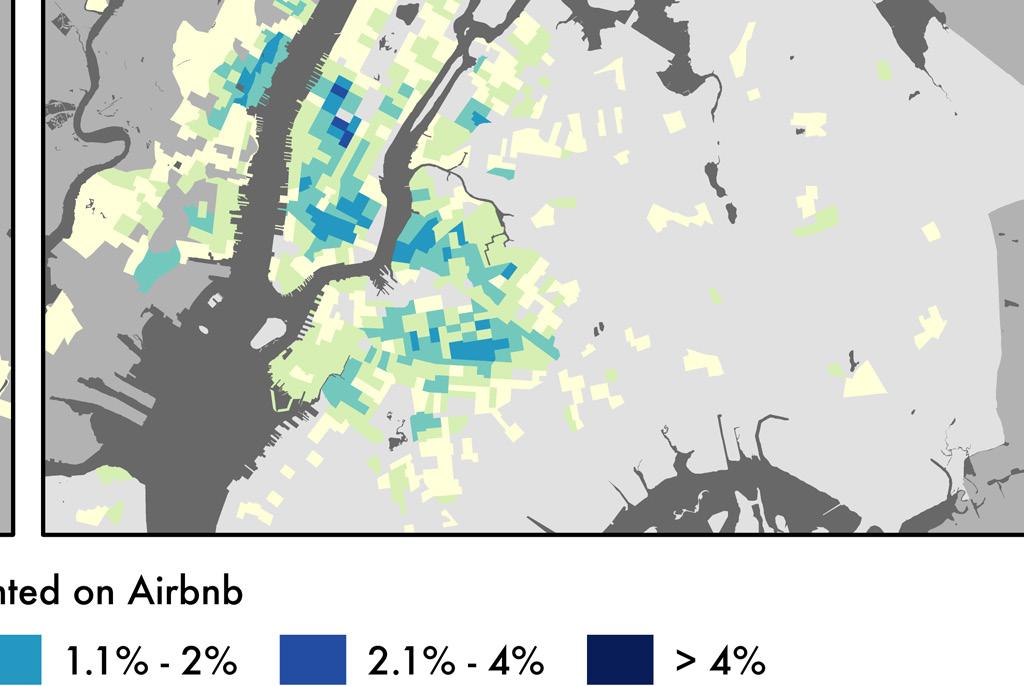
28 Figure 3c. The proportion of total housing units frequently (60/120) and very frequently (120/240) rented in New York 28
29 High Revenue Neighborhood Number of 60/120 frequently rented listings (% growth rate) % of all housing units frequently rented on Airbnb Midtown Manhattan 2,000 (0.8%) 1.1% Downtown Manhattan and Williamsburg 2,700 (-2.3%) 1.6% High Growth Neighborhood Number of 60/120 frequently rented listings (% growth rate) % of all housing units frequently rented on Airbnb Eastside Manhattan 900 (17%) 0.7% North-Central Brooklyn 1,700 (32%) 0.9% Figure 3d. Frequently rented (60/120) Airbnb listings in the highlight neighborhoods last year NEW YORK S GHOST HOTELS It is likely that most private-room listings on Airbnb are rented by primary residents with a spare room. But using spatial analysis we have identified 4,700 listings across New York City (16% of all privateroom listings in the city) which are in fact ghost hotels entire units or even whole apartment buildings which have been converted into many private-room listings by the owner. These 4,700 listings form 1,200 discrete ghost hotels, a number which has increased 79% since 2015 (far faster than the overall rate of Airbnb growth in New York). All told, New York s ghost hotel operators earned $30.4 million on Airbnb last year. Most discussion of Airbnb s impact on housing availability and affordability focuses on entirehome listings, and for good reason these are the listings which, if rented sufficiently often throughout the year, by definition can no longer be housing a long-term tenant. Private room listings, by contrast, are generally assumed to have little if any impact on housing markets, since they generally do not displace renters. This assumption is clearly false in a city such as New York where a high percentage of renters live with roommates. A primary tenant who might have previously listed a spare bedroom on Craigslist and found a long-term tenant can now list the spare bedroom on Airbnb. But the impact of private-room Airbnb rentals on the long-term rental market for roommates is difficult to estimate without extensive surveying and interviews to determine what residents were previously doing with the rooms which they are now renting on Airbnb. There is another possible way in which privateroom Airbnb rentals may be reducing rental housing supply for long-term tenants, though. This is the question of whether entire units or 29
30 apartment buildings are being converted into what the Canadian housing advocacy group Fairbnb has called ghost hotels (Wieditz 2017). Ghost hotels are entire units or buildings whose individual bedrooms have been listed individually on Airbnb as private rooms. There are various reasons a host might choose to list their units this way, but given that short-term rentals of entire homes are generally illegal in New York, converting apartments into ghost hotels would be a convenient way for a host to avoid regulatory scrutiny. short-term rentals often assumes the benignness of private-room rentals, because these are thought to be hosted by owner- or renter-occupiers and thus not removing any rental housing options for local residents. The fact that thousands of these listings are actually a surreptitious mechanism for converting apartments (and entire apartment buildings) into hotels is an important fact to be added to the public debate. For example, here is a guest review from a private-room listing in one of the most lucrative ghost hotels in New York: Using spatial cluster analysis, we identified groupings of private rooms rented by a single host which are highly likely to be located in the same building. The results are startling: across New York City, there are 1,200 ghost hotels, comprising over 4,700 separate private-room listings. Each of these ghost hotels has removed rental housing from the long-term rental market. Most of these ghost hotels comprise three to five private-room listings, and thus appear to be single apartment units. But some have 10 or more listings, and thus are almost certainly multiple units in a building or an entire building listed on Airbnb by the landlord. (The top three ghost hotels are detailed in Figure 3e; a traditional hostel which has listed its rooms on Airbnb has been excluded.) Three facts are striking about New York City s ghost hotels. The first is the simple fact of their existence. Public discussion and debate about This is made to look like a couple sharing their home on AirBNB, but it s actually more like a hostel run by multiple people. Very misleading listing. There are like 20ish tiny rooms and you can hear people snoring and cleaning and such... Additionally, for those who believe every small room is private, it s actually not. On my check in, I was given room keys for room 116, but my room was 115, but my key still worked for room 115. My first day there, I got curious and tried using the keys on room 116 as well, and they actually worked. The door key to every single room is the same. The second striking fact is the scale and distribution of the ghost hotel phenomenon. Figure 3f shows the locations of all the ghost hotels operating in New York City over the last twelve months (the size of points is proportionate to the number of private rooms in the ghost hotel). There are ghost hotels across all five boroughs, although Example listing title # of revenue-earning rooms Average # of annual nights booked per room Approx. annual revenue [301] 5 minute WALK to Times Square $350,000 Interfaith Retreat Guest Rooms (Seva) $200,000 Large Room 15 Minutes to Manhattan $200,000 Figure 3e. The largest three ghost hotels in New York City last year 30
. In total, New York City s ghost hotels earned $30.")


 earning $30.4 million (a 58% increase).")
31 Figure 3f. Locations of the 1,200 likely ghost hotels in New York City Brooklyn has the most in both absolute and proportional terms. These hotels earn on average $6,400 per room annually, which is 27% higher than non-ghost-hotel private-room listings (which earn $5,100 annually). In total, New York City s ghost hotels earned $30.4 million dollars which is 19% of all the revenue earned by private-room Airbnb listings in the city. The final striking fact about New York s ghost hotels is their growth rate. Over the last two years, the number of revenue-earning listings in New York City has grown 37%, from 48,800 in the September August 2015 year to 67,100 in the September August 2017 year. In the same time period, the number of revenueearning private-room listings has grown 55%, from 19,600 to 30,300. Ghost hotels are growing substantially faster than either of these categories, nearly doubling over the same time period. In the year ending August 2015, there were 670 ghost hotels, comprising 2,600 listings and earning a total of $19.3 million for the year. Two years later, the number of ghost hotels had increased 79% to 1,202, comprising 4,700 private-rooms (an 84% increase) earning $30.4 million (a 58% increase). These facts are summarized in Figure 3g, and clearly demonstrate that ghost hotels are a rapidly growing portion of Airbnb activity in New York City. This portion has so far flown under the radar of regulatory scrutiny despite the fact that it is taking an increasingly large number of apartments off the long-term housing market for New York residents. Given that every ghost hotel is by definition a commercial operation and not home sharing, new regulatory scrutiny seems warranted. 31
32 # of ghost hotels (% increase from 2015) # of private rooms in ghost hotels (% of total revenue-earning private rooms) Annual revenue New York City 1,200 (79%) 4,700 (16%) $30.4 million Manhattan 400 (76%) 1,500 (12%) $11.8 million Brooklyn 520 (49%) 2,100 (16%) $13.0 million Figure 3g. New York s ghost hotels HOW MANY HOUSING UNITS HAS AIRBNB REMOVED FROM THE RENTAL MARKET? Combining the estimates of entire-home Airbnb listings which have been removed from the rental market with the ghost hotels provides an estimate of Airbnb s overall impact on long-term rental housing availability in New York. Figure 3h provides these estimates for a range of different New York geographies, while Figure 3i shows the distribution of lost housing across the city. What these figures indicate is that no fewer than 7,000 units have been removed from the market for local residents (very frequently rented, entire-home listings plus ghost hotels), and the number of lost units could in fact be 13,500 or more (frequently rented, entire-home listings plus ghost hotels). This housing loss has been concentrated most heavily in Midtown and Lower Manhattan, but the growth rate of housing loss is highest in North and Central Brooklyn. Frequently rented entire-home listings Very frequently rented entirehome listings Rental units converted to ghost hotels Plausible range for housing lost to Airbnb New York City 12,200 5,600 1,400 7,000-13,500 Manhattan 7,000 3, ,600-7,500 Brooklyn 4,200 2, ,600-4,800 Midtown Manhattan Downtown Manhattan and Williamsburg Eastside Manhattan North-Central Brooklyn 2, ,000-2,000 2,700 1, ,300-2, , ,200-2,000 Figure 3h. Combined estimate of housing lost to Airbnb 32


33 Figure 3i: Combined estimate of housing lost to Airbnb by census tract 33
34 4. Is Airbnb driving gentrification? We estimate that, by reducing housing supply, Airbnb has increased the average long-term rent by 1.4% over the last three years, implying that the average New York tenant looking for an apartment this year will pay $380 more annually in rent because of Airbnb. In large parts of the city, hosts of frequently rented entire-home Airbnb listings earn 200% or more the median long-term neighborhood rent, and these areas are 72% non-white. This means there is a powerful economic incentive for landlords to displace tenants and convert apartments to Airbnb de facto hotels in communities of color. High-growth neighborhoods (particularly Harlem and Bedford- Stuyvesant) are disproportionately African American, while neighborhoods with high existing Airbnb revenue (generally in Midtown and Lower Manhattan) are disproportionately white. AIRBNB S ECONOMIC DOMINANCE OF NEW YORK S RENTAL MARKET Given the fact that Airbnb has taken between 7,000 and 13,500 units of long-term rental housing off the market in New York City, an important question is the extent to which Airbnb is thereby fueling gentrification across the city. Based on an analysis of revenue flows through the housing market, our conclusion is that Airbnb has created a new rent gap a systematic gap between rental revenue under a building s current use and potential revenue under a different use which is driving gentrification in a number of Manhattan and Brooklyn neighborhoods (Wachsmuth and Weisler forthcoming). The potential economic returns to the very same apartment may be higher now than they were a few years ago, simply because Airbnb provides a new revenue stream which requires little new investment needed on behalf of landlords. While serious Airbnb entrepreneurs may well refurbish their units to increase their success with the service, the only necessary step for converting a long-term rental to a short-term rental is to remove the existing tenant. The implication is that, in areas where there is strong tourist demand, owners of rental units in areas have a strong economic incentive to convert units to shortterm rentals. In order to quickly and cheaply realize these higher potential rents, owners of rental units may evict existing tenants, or not replace tenants when they depart. Figures 4a and 4b analyze revenue flows through Airbnb and through the longterm rental market to identify the areas of New York where Airbnb has already had a large impact on housing market revenue flows and the areas where the likelihood of future impact is highest. Figure 4a compares total monthly Airbnb host revenue with total monthly long-term rental revenue by census tract. The hotspots are Midtown Manhattan, the Lower East Side, and Williamsburg neighborhoods which are all post-gentrified, in the sense that they saw massive increases in rents and massive 34


35 displacement over the last several decades, and now have been transformed, to a greater or lesser extent, into affluent neighborhoods. In these areas, Airbnb generally now accounts for 5% or more of the entire housing rental market by revenue. Across the entire city last year, the median host of a frequently rented entire-home listing earned 54% more than the median long-term rent in the same neighborhood. In fact, 92% of all hosts of frequently rented entire-home listings made more than the median long-term neighborhood rent. Figure 4b shows this pattern across the city; neighborhoods where the ratio of short-term rents to long-term rents is highest are where the data suggests that there is money to be made but landlords haven t yet seized on the opportunity en masse. In other words, these are the neighborhoods at greatest risk for Airbnbinduced gentrification in the near future. Whereas current Airbnb impacts were concentrated in already-gentrified areas, these at-risk neighborhoods are all still very clearly at the gentrification frontier. Just under 380,000 households in New York City live in these areas 11% of the city s population. Comparing these two patterns the percentage of housing revenue that now flows through Airbnb, and the percentage of the median rent which an average full-time Airbnb property earns allows us to see where Airbnb has already had a major impact on local housing and where it is likely to have an impact in the future. The first pattern indicates where Airbnb has already had a major impact on local housing. The second pattern indicates where there is still money to be made for landlords by converting longterm rental housing to short-term rentals. IS AIRBNB INCREASING RENTS IN NEW YORK? Applying a comparative model developed by researchers at UCLA, we estimate that Airbnb has increased long-term rents in New York City by 1.4% over the last three years. This implies that the median renter household looking for a new Figure 4a. The percentage of rent payments which now flow through Airbnb apartment will pay $384 more per year because of Airbnb s recent growth. The previous chapter demonstrated that Airbnb is very likely removing between 7,000 and 13,500 units of rental housing from the long-term rental 35


36 stock will drive up prevailing rents, because the same amount of demand for accommodation will be chasing a smaller supply of available accommodation. But is it possible to directly estimate Airbnb s impact on rents in New York? Such an estimation can only be done by comparing New York to other city-regions. This is because we need to be able to control for endogeneity : factors specific to New York which might suggest a spurious correlation. For example, imagine that New York s tourism office conducts an extremely successful place-marketing campaign that encourages many new tourists, but also encourages long-term residential relocations. We might observe rising Airbnb activity and rising long-term rents, and conclude that Airbnb activity causes higher rents. But in fact, the tourism campaign was the cause of both the increased Airbnb activity and the higher rents, and our conclusion would be false. If we can compare New York with many other cities, we can minimize these confounders, and find the true association between short-term rentals and long-term rentals. Figure 4b. The profitability of an average Airbnb listing compared to median 12-month rents in the neighborhood market across New York City, with the effects particularly concentrated in neighborhoods in Midtown and Lower Manhattan and North Brooklyn. Basic principles of supply and demand suggest that the removal of rental housing Conducting such a large-scale comparison is outside the scope of the present study. However, a recent paper by Barron et al. (2017) has gathered data from 100 US cities to answer precisely this question. After controlling for a comprehensive set of factors, they find that a exogenous 10% increase in number of Airbnb listings in an area (which is to say, an increase that is not driven by other factors which would have increased rents anyway) predicts a 0.42% increase in long-term rents. Applying this relationship to our data, we find strong evidence that Airbnb has increased long-term rents in New York City. On a city-wide scale, using the broadest possible definition of active listings (used by Barron et al. in their model), active listings increased annually by 116%, 62%, and 33% in the three years between September 2014 and August Applying Barron et al. s national average ratio of exogeneity to New York City, this implies that, city-wide, Airbnb drove up 36


37 rents by 0.8% in 2015, 0.4% in 2016, and 0.2% in 2017 (all for years ending in August). This is a cumulative 1.4% increase in rents over these three years attributable to Airbnb s presence in the city. The overall median rent increase in New York City in this time period was 8.7%, which means that Airbnb is responsible for something like 16% of the total increase in rents in New York City in the last three years. 1 Zillow s rent index is generally understood to offer the best estimate of current market rents, which means rents which a prospective tenant is likely to encounter if searching for an apartment. According to Zillow, the current monthly median rent city-wide is $2,354. If Airbnb had remained at its September 2014 levels in New York City over the last three years, Barron et al. s model implies that the median rent would instead be $2,322. The implication is that the median renter household looking for housing in New York City will pay an average of $384 more in rent this year because of the growth of short-term rentals in the city over the last three years. Of course, Airbnb activity is not distributed evenly across the city. Figure 4c estimates the impact of Airbnb on rents at the census tract scale using Barron et al. s model. (In the map, zip codes with fewer than 100 listings at the beginning of the study period are suppressed because of reliability concerns, although their data contributed in aggregate to the calculation of the city-wide average.) Figure 4d summarizes the impact for the four profile neighborhoods, along with all the subneighborhoods for which reliable data could be collected. Many of these areas have seen estimated increases in annual median rent of $500 or more thanks to the last three years of Airbnb activity. Notably, zip code in Clinton has seen an estimated increase of $780. Figure 4c. Total estimated annual rent increases attributable to Airbnb 1 Because these figures are derived from a limited subset of data used for a national comparative model, they should be treated as suggestive rather than definitive. For reference, across their entire national dataset, Barron et al. find that Airbnb has driven up rents an average of 0.27% each year, compared to the average of 0.46% each year we find for New York. Given how much faster Airbnb has grown in New York than the country as a whole, our estimates are quite plausible. 37
38 High Revenue Neighborhood Total estimated annual % rent increase attributable to Airbnb Range of estimated annual $ increases in median rent by sub-neighborhood Midtown Manhattan 1.42% Chelsea: $610 - $720 Clinton: $690 - $780 Upper West Side: $560 - $580 Downtown Manhattan and Williamsburg 1.17% East Village: $610 Lower East Side: $510 - $590 West Village: $570 Williamsburg: $330 High Growth Neighborhood Total estimated annual % rent increase attributable to Airbnb Range of estimated annual $ increases in median rent by sub-neighborhood Eastside Manhattan 1.31% Central Harlem North: $460 Central Harlem South: $490 East Midtown: $640 - $720 Gramercy: $570 North-Central Brooklyn 1.42% Bedford: $370 Crown Heights: $450 East Williamsburg: $470 Park Slope/Gowanus: $310 - $350 Stuyvesant Heights: $530 Figure 4d. Total estimated rent increases driven by Airbnb across highlight neighborhoods RACIALIZED IMPACTS OF AIRBNB IN NEW YORK Over the last several years, evidence has mounted that people of color face persistent discrimination on Airbnb. Edelman et al. (2017) found, for example, that prospective guests with distinctively African American names are 16% less likely to have their reservation requests accepted than nearly identical guests with distinctively white names. The Twitter hashtag #airbnbwhileblack amply documents these experiences. But if people of color face persistent discrimination as users of Airbnb while traveling, how does Airbnb impact communities of color in their home cities? Is Airbnb contributing economically to these communities, or increasing their economic challenges? Across New York City, we find no correlation between host revenue growth and the racial composition of a neighborhood. But we do find a moderately strong positive correlation ( ρ = 0.229) between host revenue earned in the last 38
39 year and the proportion of households which are white. In other words, at the level of simple correlation, white neighborhoods make more money on Airbnb than non-white neighborhoods. This pattern is borne out for the high-revenue highlight neighborhoods, in which white households are dramatically overrepresented. Across New York City, 39.2% of households are white, while 68.4% of households in the Midtown Manhattan focus neighborhood are white, as are 56.9% of households in the Downtown Manhattan and Williamsburg focus neighborhood. The pattern looks quite different for the highgrowth neighborhoods, though; the North-Central Brooklyn highlight neighborhood in particular is 70.8% non-white by household, compared to the city-wide average of 60.8% (Figure 4e). The Eastside Manhattan neighborhood is very close to the city-wide average, although in this case this figure is somewhat misleading, since the area combines two disproportionately white Midtown locations (Gramercy and Turtle Bay) with two disproportionately Black and Latino locations (Central Harlem South and Central Harlem North). In spite of this complication, the overall pattern is clear: the highest-earning neighborhoods for Airbnb tend to be whiter than the city as a whole, while the fastest-growing neighborhoods for Airbnb tend to be less white than the city as a whole. Narrowing in on the parts of New York City where the average frequently rented entire-home Airbnb listing earns more than double the median long-term rent reveals an even starker picture of racialized gentrification. Because of the large disparity between current long-term rental income and potential future Airbnb income, these areas are under the highest pressure for Airbnb-induced rent increases and loss of rental housing. And these neighborhoods are 72% non-white. Variations of this fact have been noted by a range of commentators, as well as by Airbnb itself, which has launched an aggressive public relations campaign touting the supposed economic benefits it brings to Black neighborhoods. According to recent research, however, the reality is that most Black residents of areas seeing Airbnb growth are unlikely to see much benefit from this growth. Using facial recognition technology High Revenue Neighborhood % of households which are non-white Midtown Manhattan 31.6% Downtown Manhattan and Williamsburg 43.1% High Growth Neighborhood % of households which are non-white Eastside Manhattan 57.9% North-Central Brooklyn 70.8% Figure 4e. High-revenue neighborhoods are disproportionately white, while high-growth neighborhoods are disproportionately African American and Latino 39

40 to identify the race of Airbnb hosts, Murray Cox (2017) has investigated the impact of Airbnb on predominantly Black neighborhoods in New York City. The study found that short-term rentals are growing faster in Black neighborhoods, displacing and otherwise disproportionately affecting Black residents while simultaneously accruing wealth for white residents. The findings conclude that, across Black neighborhoods, Airbnb hosts are five times more likely to be white than the underlying demographics would predict. Seventy four percent of Airbnb listings are operated by white hosts, while white residents comprise only 13.9 percent of the population in those neighborhoods. Cox (2017) uses a white disparity index to calculate the representation of whites people in the Airbnb community compared to their representation in a neighborhood ( An index of 100 means that white Airbnb hosts are representative in the Airbnb host community in the same proportion as their representation in the underlying neighborhood [ibid, 9]). The highest white disparity index can be found in Erasmus, southeast of Prospect Park in Brooklyn, where white people make up 1.7 percent of the neighborhood population but 58 percent of Airbnb hosts. Across all the 72 predominantly Black neighborhoods, where white residents make up only 13.9% of the population, white Airbnb hosts earned $159.7 million in the study period, compared to $48.3 million earned by Black hosts in those neighborhoods. The patterns identified by Cox (2017) suggest that the new growth of Airbnb in Black neighborhoods will not provide the economic benefits that the company claims it will. Indeed, Cox concludes that Black residents are six times more likely than white residents to be affected by Airbnb-induced housing loss in the neighborhoods he examined, since 79.2% of residents of these neighborhoods are Black, and only 13.9% are white. (Likewise, we found that in high-risk neighborhoods across the city, 72% of residents are non-white.) As we have discussed in the current and previous chapters, the expansion of Airbnb activity in these areas is taking long-term housing off the market and increasing rents for new tenants. Meanwhile, Cox s findings imply that white hosts are disproportionately accruing economic benefit from Airbnb in these areas. Broadway Atlantic Ave Linden Blvd Figure 4f. Case study neighborhoods and approximate locations of Airbnb listings threatening housing supply 40
41 CASE STUDY: BEDFORD-STUYVESANT AND EAST NEW YORK The relationship of Airbnb to gentrification can be illustrated through a more detailed examination of a pair of Brooklyn neighborhoods: Bedford-Stuyvesant and East New York. (These neighborhoods are shown, along with the Airbnb listings which are threatening to remove housing from the rental market, in Figure 4f.) Each of these areas has seen Airbnb growth far outpacing the city-wide average. For example, between 2015 and 2017, the number of frequently rented, entirehome listings in New York City increased 63%, from 7,500 to 12,200. In the same time period, the number of these listings nearly doubled in Bedford- Stuyvesant (a 94% increase from 310 to 610 listings), and nearly quadrupled in East New York, albeit from a very low base (a 275% increase from 12 to 45 listings). Bedford-Stuyvesant is quickly becoming one of the city-wide hotspots for Airbnb activity in New York, while East New York represents the far edge of Airbnb s expansion in the city. The median asked rent in zip codes and 11221, which roughly overlap the western (Bedford) and eastern (Stuyvesant Heights) portions of Bedford-Stuyvesant were $2,320 and $2,316 in September Three years later, they had increased to $2,485 and $2,466. These are 7.1% and 6.5% increases. In the same time period, the total number of Airbnb listings (active and inactive) in the two zip codes increased from 838 and 706 to 3,499 and 4,615. Applying Barron et al. s (2017) model, this suggests that approximately one sixth of the rent increase in Bedford s zip code could be attributed to Airbnb expansion (1.2%, or $30 a month), while fully a quarter of the rent increase in Stuyvesant Heights s zip code could have been caused by Airbnb (1.83%, or $44 a month). How could Airbnb have had such a dramatic impact on rents in Stuyvesant Heights over the last three years? Last year there were 1,640 revenue-earning listings in the area. However, many of these listings were part-time, and many more were private rooms in homes occupied by their primary resident. Limiting the tally to only those units at serious risk of being removed from the long-term rental market, 350 entire-home listings were frequently rented, and a further 50 units appear to have been converted into private-room ghost hotels. This means that approximately 400 long-term housing units in Stuyvesant Heights may have been removed from the long-term rental market and converted to fulltime Airbnb usage. This is a large number, but less than 1% of the total 47,855 units of housing in the neighborhood. However, the vast majority of those housing units are occupied by long-term residents. Market rents are determined by the intersection of supply and demand for the much smaller number of units available on the rental market at any given point. According to the 2015 American Community Survey (the most recent available), there were 1,557 housing units in the neighborhood vacant and available for rent. If we charitably assume that none of these was directly converted into an Airbnb listing, it still remains the case that full-time Airbnb listings account for something like 20% of the available rental housing stock (i.e. all the units vacant and available for rent, plus all the units which would be available for rent if they weren t full-time Airbnb short-term rentals). Cox s (2017) study of Airbnb hosts further demonstrates that, in Stuyvesant Heights, it is white Airbnb hosts who are disproportionately benefiting from Airbnb, while Black residents are bearing the burden of higher rents and fewer available apartments. Cox found white people make up 74.9 percent of Airbnb hosts and generate 63.4% of platform revenue in Stuyvesant Heights, but represent only 7.4 percent of the neighborhood population. This makes it the fourth most disparate in the top 20 predominantly Black neighborhoods, with a white disparity index of 1,
42 Active listings in 2017 (% growth since 2015) Airbnb host revenue in 2017 (% growth since 2015) Freq. rented entirehome listings in 2017 (% growth since 2015) Estimated annual $ increases in median rent Bedford- Stuyvesant 3,270 (56.9%) $26.0 million (87.4%) 610 (93.6%) $370 (Bedford) $530 (Stuy. Heights) East New York 190 (246%) $1.3 million (311%) 45 (275%) $550 (zip 11207) Figure 4g. Airbnb s impact on Bedford-Stuyvesant and East New York East New York is one of New York City s poorest neighborhoods, and has suffered waves of disinvestment since the Second World War. However, in 2016 City Council approved a comprehensive rezoning of the neighborhood, ushering in new housing development, some of it subsidized by the City. As development starts to accelerate, gentrification concerns have accelerated as well, and there is evidence to suggest that Airbnb is now growing rapidly in the area, and is beginning to reduce housing affordability and availability particularly in the west wide of East New York. The median rent in zip codes and (which include East New York as well as adjacent areas to the north) increased from $1,985 and $2,108 in September 2014 to $2,225 and $2,191 in September 2017: respectively 12.1% and 3.9% increases in three years. Applying Barron et al. s (2017) model to zip code (the western portion of East New York) suggests that approximately a sixth of the total rent increase 2.1%, or $46 a month could be attributed to Airbnb expansion in this area. The eastern area (zip code 11207) did not have enough Airbnb listings in 2014 to reliably estimate the effects of Airbnb on long-term rents, although the much lower level of Airbnb activity here would suggest a more modest impact on rents. Indeed, the following facts are suggestive: in 2014, the eastern zip code had 6% higher median rent than the western zip code, but by 2017 this situation had reversed, and the western area (where Airbnb usage had surged) had slightly higher rent. Moreover, the increase in Airbnb usage in the western part of East New York has mapped very closely onto subway access (an important predictor of Airbnb listing success). Nearly all the frequently rented listings and ghost hotels are within 1500 feet of a subway station.the eastern part of the neighborhood does not have subway access, and has not seen the same increase in frequently rented listings. Unlike Stuyvesant Heights, however, East New York has not seen the same enormously disproportionate share of the economic benefits of Airbnb hosting accruing to the white population. The situation is mixed; on the one hand, Cox (2017) found that white hosts administered 29% of listings in the neighborhood, despite accounting for only 2.5% of the population. On the other hand, he estimated that Black hosts earned 97.9% of the revenue from Airbnb hosting in East New York, actually slightly outpacing Black residents 94.6% share of the neighborhood s population. An important proviso to these findings is that they are more than a year old; given the rapid Airbnb growth in East New York since then, along with the previous scarcity of listings, it is difficult to know how to extrapolate Cox s findings here to the present. The conclusion of these case studies (summarized in Figure 4g), as well as the preceding analysis of New York City as a whole, is that Black residents are coming under increased housing availability and affordability stress thanks in part to the expanding Airbnb hosting activities of white residents. In other words, Airbnb is increasing racialized gentrification pressures in New York. 42
43 Appendix: Data and methodology The findings in this report are based on a comprehensive analysis of three years of Airbnb activity in the New York region. The data covers the New York-Newark-Jersey City, NY-NJ-PA Metro Area, the US Census Bureau-defined metropolitan statistical area (MSA) which contains 24 million residents across the tri-state areas. The study period is September August 2017, and every Airbnb listing which existed at any point in this period in the New York MSA has been included in the analysis. Excluding listings which were created but never made available on the Airbnb website (for example because they were created shortly below the end of the study period), the database contains 184,462 listings. For each of these listings, we have information about its reservation status for each day it was active over the three-year period. In total, we analyzed just over 80 million datapoints. The analysis relies on two data sources. The first is a proprietary dataset of Airbnb activity obtained from the consulting firm Airdna, which has been performing daily scrapes of Airbnb s public website since mid-2014, and aggregating the information. The Airdna data has two parts: a property file which provides specific static characteristics of each property listing (such as number of bedrooms, cancellation policies, the listing title, etc.), and a transaction file which provides a complete list of daily activities for each property (the listed nightly price and whether the property was available, reserved, or blocked for each day). For 2014 and 2015, this transaction data was taken directly from Airbnb and is thus highly accurate. At the end of 2015 Airbnb stopped disclosing when a non-available property was reserved or was simply blocked from new reservations, which made it impossible to precisely measure occupancy and revenue earned. In response, Airdna developed a machine learning model to estimate this information based on a combination of its existing historical dataset of activity and other information which remained publicly available (e.g. reviews and ratings). While the activity dataset for 2016 and 2017 therefore cannot be fully accurate, we believe it is the most accurate third-party estimate available, and it enables us to estimate occupancy rates as well as revenues for each property over time. The second data source is the American Community Survey (ACS), an annual survey performed by the US Census Bureau to serve as a complement to the decennial census. We used the 2015 ACS five-year estimates, which provide reliable data about demographics and housing market performance for the period, and are the most current government data available. The ACS data was analyzed at the scale of the census tract (a small, stable geographic area of approximately 1,200-8,000 people defined by the Census Bureau). The methodology for the report was developed specifically to analyze Airbnb activity s relationship to urban housing markets, and has been used in two previous studies (Wachsmuth et al. 2017; Wachsmuth and Weisler forthcoming), one of which is currently undergoing peer review in a leading scholarly journal. It is a spatial big data methodology designed to extract meaningful patterns out of tens of millions of datapoints, and it is based on two principles: Be conservative about spatial uncertainty: Although each Airbnb listing is specified on the public Airbnb website with exact latitude and longitude coordinates, these coordinates have been shifted from the real location by up to 150m in a random direction (in order to protect hosts privacy). This randomness means that maps which show the 43
44 exact locations of listings (or rely on these locations for their analyses) are misleading inasmuch as they exaggerate the precision of the underlying spatial data. It also can lead to nonsensical situations, such as listings apparently located in the middle of a park or a body of water. For spatial analysis of the listings, we have developed a novel Bayesian spatial inference technique to address this problem. This technique relies on the distribution of housing units across the city to weight the probabilities of a listing being located in any position within the 150-m radius in which Airbnb randomized it. In practical terms, this means that a listing which has X-Y coordinates which place it in an area with relatively little housing but very close to an area with a lot of housing will be assigned a higher probability of being located in the highly populated area than the lightly populated one. This inference was carried out at the scale of census tracts, and the results aggregated to either census tracts or to the Neighborhood Tabulation Areas defined by New York City. This method of probabilistic spatial analysis allows our estimates to be more reliable at smaller scales than other approaches, while simultaneously avoiding the false appearance of precision of using exact latitude and longitude coordinates which is common in short-term rental mapping. Aggregate information at meaningful geographies and timescales: We have two strategies for dealing with other, non-spatial sources of uncertainty and error. First, the analysis presented in this report is almost exclusively conducted with large aggregates of listings, at which scales random error should be relatively minimal. Furthermore, results are presented with conservative precision (i.e. where there is higher uncertainty, numbers are rounded to fewer significant digits), in order to not over-imply precision. Second, there is the possibility of non-random (i.e. systematic) error in the underlying dataset, since it is based on a thirdparty estimate of Airbnb activity. To mitigate this possibility, we have chosen to present as many of the findings as possible in the form of comparisons over time. Even where there is some uncertainty about the precise levels of the various estimates, the trends presented are much less subject to this uncertainty, because they have been derived using a consistent methodology over time. For example, an estimate of 8,000 homes taken off the long-term rental market may slightly overstate or understate the real figure, but if we find, using the same methodology, that the estimate was 7,000 for the previous year, then there is good reason to think that the underlying growth pattern is accurate. SEASONALITY: NEW YORK S SIX- MONTH SUMMER Any attempt to measure growth trends of shortterm rental activity must contend with the fact that this activity is highly seasonal. New York, like other internationally popular tourist destinations, receives substantially more visitors during the summertime than at other points in the year. Given the increasing popularity of Airbnb as accommodation for tourists, it therefore seems likely that Airbnb activity will also be seasonal. Measuring and ultimately controlling for this seasonality is necessary to accurately interpret month-to-month changes in Airbnb activity. For example, total monthly Airbnb host revenue in the New York region increased by just over 30% between April and May of This sounds like a large increase, but is it more, less, or equal to the change we should expect based on past years? We are able to answer this question, as well as any other questions related to growth trends, by constructing seasonal indices. A seasonal index allows a time series to be decomposed into two parts: the routine variation that occurs over a year, and the underlying pattern of growth or decline. Using the ratio-to-moving-average method, we calculated seasonal indices for the 35-month period October 2014 to August Figure Aa shows three seasonality curves for New York Airbnb activity over the three-year 44
45 study period. For the number of listings available in a given month, the number of listings with reservations in a given month, and the total host revenue earned in a given month, these seasonality curves show the proportion of a year s activity which occurs in each calendar month, independent of the underlying trends of growth or decline. As the figure indicates, the number of listings active in a given month shows relatively little seasonal variation; in other words, hosts do not appear to add or remove listings from Airbnb in response to changes in demand throughout the year. However, the number of monthly reserved listings (i.e. listings which receive at least one reservation in a given month) does show substantial seasonal variation, and the total amount of revenue hosts earn in a month shows even more variation. In both these cases, the New York region has what can be characterized as a six-month summer. Airbnb activity is at its lowest in January and February, and rises consistently until May, when it plateaus through October. (These six months account for 60% of revenue earned through the year.) Activity falls steeply in November, and then rises again in December thanks to the holiday season. Given the highly seasonal nature of Airbnb activity in New York, it is also noteworthy that this seasonality is intensifying. Figure Ab compares revenue seasonality curves for the earliest and latest periods for which it can be calculated (October August 2016, and October 2015 August 2017). It shows that the June-September period is starting to account for more and more of the year s revenue, while revenue from the December- April period is declining. This pattern suggests that Airbnb is hosting increasing proportions of seasonal tourists, and decreasing proportions of off-season visitors (such as business travelers). In the New York regional context, this appears to have been caused by a leveling off of Airbnb revenue growth in New York City (where demand has less seasonal variation) and strong growth in outlying seasonal tourism destinations on Long Island, in Upstate New York, and along the New Jersey Shore. 12% 8% 4% 0% January February March April May June July August September October November December Monthly active listings Monthly reserved listings Monthly revenue Figure Aa. Seasonality curves for Airbnb activity in the New York MSA 45
46 12% 8% 4% 0% January February March April May June July August September October November December Earliest revenue seasonality curve Latest revenue seasonality curve Figure Ab. Increasing revenue seasonality in the New York MSA 46
47 References Airbnb Airbnb and Housing. Available online at < Last accessed November 3, Barron, K., Kung, E., & Proserpio, D. (2017). The Sharing Economy and Housing Affordability: Evidence from Airbnb. Retrieved from BJH Advisors. (2016). Short Changing New York City: The Impact of Airbnb on New York City s Housing Market. Policy report prepared for Housing Conservation Coordinators and MFY Legal Services. Cócola Gant, A Holiday Rentals: The New Gentrification Battlefront. Sociological Research Online 21 (3): 10. Cox, M The Face of Airbnb, New York City: Airbnb as a Racial Gentrification Tool. Inside Airbnb. Available online at < Last accessed July 4, Edelman, B., Luca, M., and Svirsky, D Racial Discrimination in the Sharing Economy: Evidence from a Field Experiment. America Economic Journal: Applied Economics 9 (2): New York Communities for Change and Real Affordability for All. (2015). Airbnb in NYC: Housing Report Policy report. Lee, D How Airbnb Short-Term Rentals Exacerbate Los Angeles s Affordable Housing Crisis: Analysis and Policy Recommendations. Harvard Law & Policy Review 10: Litten, K Neighborhood Mourners Want New Orleans Short-Term Rentals Regulated. The Times-Picayune. Available online at < Last accessed July 4, Samaan, R Airbnb, Rising Rent, and the Housing Crisis in Los Angeles. Policy report prepared for the Los Angeles Alliance for a New Economy. Wachsmuth, D., Kerrigan, D., Chaney, D, and Shillolo, A Short-term Cities: Airbnb s Impact on Canadian Housing Market. Policy report. Urban Politics and Governance research group, McGill University. 48 pages. Wachsmuth., D., and Weisler, A. (Forthcoming). Airbnb and the Rent Gap: Gentrification through the sharing economy. Environment and Planning A. Wieditz, T. (2017). Squeezed Out: Airbnb s Commercialization of Home-Sharing in Toronto. Policy report prepared for FAIRBNB.CA Coalition. 47


48 AUTHORSHIP AND FUNDING This report was commissioned by the Hotel Trades Council, AFL-CIO, and is cosponsored by a number of New York City community, housing and tenant advocacy organizations, including New York Communities For Change, Housing Conservation Coordinators, Goddard Riverside Law Project, St. Nick s Alliance, Cooper Square Committee, Mobilization for Justice (formerly MFY Legal Services), West Side Neighborhood Association, and the Hell s Kitchen Neighborhood Association. The authors from the School of Urban Planning, McGill University, are exclusively responsible for all analysis, findings, and conclusions. ACKNOWLEDGMENTS Guillaume Barreau provided data processing expertise, and Cecelia Cobb performed layout and design work. All photographs are by Jörg Schubert, licensed under CC BY 2.0. ABOUT UPGO UPGo, the Urban Politics and Governance research group at McGill University, conducts rigorous, publicinterest research into pressing urban governance problems particularly those that exceed or challenge city boundaries. Our three research themes are 1) local and regional economic development; 2) urban sustainability policy; 3) the impact of globalization on local housing markets. UPGo is led by Prof. David Wachsmuth of McGill s School of Urban Planning. 48

49
Short-term cities. Airbnb s impact on Canadian housing markets. David Wachsmuth Danielle Kerrigan David Chaney Andrea Shillolo
 Airbnb s impact on Canadian housing markets David Wachsmuth Danielle Kerrigan David Chaney Andrea Shillolo A report from the Urban Politics and Governance research group School of Urban Planning McGill
Manhattan Residential Rental Market Report
 Manhattan Residential Rental Market Report December & Fourth Quarter 217 Residential Rental Market Report December & Fourth Quarter 217 This report follows overall conditions in the Manhattan rental market
Manhattan Residential Rental Market Report
 Manhattan Residential Rental Market Report June & Second Quarter 218 Residential Rental Market Report June & Second Quarter 218 This report follows conditions in the Manhattan rental market during June
Manhattan Rental Market Report December 2017 mns.com
 Manhattan Rental Market Report December 2017 TABLE OF CONTENTS 03 Introduction 04 A Quick Look 07 Mean Manhattan Rental Prices 11 Manhattan Price Trends 12 Neighborhood Price Trends 12 Battery Park City
Manhattan Rental Market Report November 2015 mns.com
 Manhattan Rental Market Report November 2015 TABLE OF CONTENTS 03 Introduction 04 A Quick Look 07 Mean Manhattan Rental Prices 11 Manhattan Price Trends 12 Neighborhood Price Trends 12 Battery Park City
Residential Rental Market Report JU NE & S EC O N D Q U A RT E R 2Q18
 Residential Rental Market Report JU NE & S EC O N D Q U A RT E R 2Q18 Manhattan Residential Rental Market Report June & Second Quarter 2018 This report follows conditions in the Manhattan rental market
Manhattan Rental Market Report March 2016 mns.com
 Manhattan Rental Market Report March 2016 TABLE OF CONTENTS 03 Introduction 04 A Quick Look 07 Mean Manhattan Rental Prices 11 Manhattan Price Trends 12 Neighborhood Price Trends 12 Battery Park City 13
One Host, One Home: New York City (February 2017 Update)
") One Host, One Home: New York City (February 2017 Update) Key Figures About Airbnb s NYC Community Today, we re releasing updated information about the Airbnb community in New York City. This covers the
One Host, One Home: New York City (February 2017 Update) Key Figures About Airbnb s NYC Community Today, we re releasing updated information about the Airbnb community in New York City. This covers the
One Host, One Home: New York City (January 2018 Update)
") One Host, One Home: New York City (January 2018 Update) Key Figures About Airbnb s NYC Community Today, we re releasing updated information about the Airbnb community in New York City. This covers the
One Host, One Home: New York City (January 2018 Update) Key Figures About Airbnb s NYC Community Today, we re releasing updated information about the Airbnb community in New York City. This covers the
Brooklyn Rental Market Report April 2015 mns.com
 Brooklyn Rental Market Report April 2015 TABLE OF CONTENTS 03 Introduction 04 A Quick Look 05 Mean Brooklyn Rental Prices 10 Brooklyn Price Trends 11 Neighborhood Price Trends 11 Bay Ridge 12 Bedford-Stuyvesant
Key Findings on the Affordability of Rental Housing from New York City s Housing and Vacancy Survey 2008
 Furman Center for real estate & urban policy New York University school of law n wagner school of public service 110 West 3rd Street, Suite 209, New York, NY 10012 n Tel: (212) 998-6713 n www.furmancenter.org
One Host, One Home: New York City (April 2018 Update)
") One Host, One Home: New York City (April 2018 Update) Key Figures About Airbnb s NYC Community Today, we re releasing updated information about the Airbnb community in New York City. This covers the time
One Host, One Home: New York City (April 2018 Update) Key Figures About Airbnb s NYC Community Today, we re releasing updated information about the Airbnb community in New York City. This covers the time
Manhattan Rental Market Report April 2016 mns.com
 Manhattan Rental Market Report April 2016 TABLE OF CONTENTS 03 Introduction 04 A Quick Look 07 Mean Manhattan Rental Prices 11 Manhattan Price Trends 12 Neighborhood Price Trends 12 Battery Park City 13
Brooklyn Rental Market Report October 2014 mns.com
 Brooklyn Rental Market Report October 2014 TABLE OF CONTENTS 03 Introduction 04 A Quick Look 05 Mean Brooklyn Rental Prices 10 Brooklyn Price Trends 11 Neighborhood Price Trends 11 Bay Ridge 12 Bedford-Stuyvesant
Manhattan Rental Market Report January 2018 mns.com
 Manhattan Rental Market Report January 2018 TABLE OF CONTENTS 03 Introduction 04 A Quick Look 07 Mean Manhattan Rental Prices 11 Manhattan Price Trends 12 Neighborhood Price Trends 12 Battery Park City
Manhattan Residential Rental Market Report
 average $2,33 $2,755 $3,15 $4,312 median $2,155 $2,525 $3,1 $3,6 Washington Harlem $4,8 $3,225 Morningside $4,22 $3,835 $3,4 $3,35 Upper Side $3,939 $3,4 C e n t r a l P a r k $4,876 $4,498 $3,45 $4,125
MANHATTAN MARKET REPORT
 MANHATTAN MARKET REPORT Q1 MANHATTAN MARKET REPORT 1Q 2017 Manhattan s residential market is showing signs of improvement after a period of uncertainty leading up to the Presidential election, as it does
Performance of the Private Rental Market in Northern Ireland
 Summary Research Report July - December Performance of the Private Rental Market in Northern Ireland Research Report July - December 1 Northern Ireland Rental Index: Issue No. 8 Disclaimer This report
Manhattan Rental Market Report October 2017 mns.com
 Manhattan Rental Market Report October 2017 TABLE OF CONTENTS 03 Introduction 04 A Quick Look 07 Mean Manhattan Rental Prices 11 Manhattan Price Trends 12 Neighborhood Price Trends 12 Battery Park City
Hamilton Heights Manhattan. Morningside Heights Harlem
 Sutton Area TriBeCa Upper East Side Upper West Side Washington Heights West Village The Corcoran Report Battery Park City Beekman Carnegie Hill Central Park South Chelsea Flatiron Clinton East Harlem East
The Profile for Residential Building Approvals by Type and Geography
 The Profile for Residential Building Approvals by Type and Geography Key Points: ABS Building Approvals for Australia peaked back in October 2015. As we have frequently highlighted, approvals have subsequently
Q manhattan. the corcoran report. comitini. com
 Q3. manhattan the corcoran report peter comitini comitini.com peter@ comitini. com 212. 444.7844 3 r d QUARTER We are pleased to present the Third Quarter Corcoran Report, an easy-to-read snapshot of the
Brooklyn Rental Market Report June 2013 mns.com
 Brooklyn Rental Market Report June 2013 TABLE OF CONTENTS 03 Introduction 04 A Quick Look 05 Mean Brooklyn Rental Prices 07 Brooklyn Price Trends 08 Neighborhood Price Trends 08 Bay Ridge 09 Bedford-Stuyvesant
Ontario Rental Market Study:
 Ontario Rental Market Study: Renovation Investment and the Role of Vacancy Decontrol October 2017 Prepared for the Federation of Rental-housing Providers of Ontario by URBANATION Inc. Page 1 of 11 TABLE
1 Q M A NH AT TA N M A R K E T R E P O R T
 1Q2018 MANHATTAN M A R K E T R E P O R T INTRODUCTION M A N H A T T A N S A L E S R E P O R T Q 1 2 0 1 8 : THE NECESSITY OF BALANCE The first quarter of 2018 was a balancing act supported by declines
Manhattan Rental Market Report August 2013 mns.com
 Manhattan Rental Market Report August 2013 TABLE OF CONTENTS 03 Introduction 04 A Quick Look 07 Mean Manhattan Rental Prices 11 Manhattan Price Trends 12 Neighborhood Price Trends 12 Battery Park City
New Development Year-End Report
 New Development Year-End Report MANHATTAN $ 2,215 AVERAGE PRICE PER SQ. FT. CONTRACT SIGNED BROOKLYN $ 1,129 AVERAGE PRICE PER SQ. FT. CONTRACT SIGNED $ 2,86 $ 997 AVERAGE PRICE PER SQ. FT. CLOSED AVERAGE
The Manhattan real estate market
 Manhattan Market Report Q 04 by the numbers +.6% StreetEasy Condo Price Index (QuarteroverQuarter) 0.% StreetEasy Condo Price Forecast (MonthoverMonth) 6.0% Total (QuarteroverQuarter) 6.0% Number of Pending
THE MANHATTAN RENTAL MARKET REPORT
 TM THE MANHATTAN RENTAL MARKET REPORT JULY 2012 1 TABLE OF CONTENTS Introduction 3 A Quick Look 4 Mean Manhattan Rental Prices 8 Manhattan Price Trends 10 Neighborhood Price Trends Harlem 11 Upper West
Manhattan Rental Market Report March 2018 mns.com
 Manhattan Rental Market Report March 2018 TABLE OF CONTENTS 03 Introduction 04 A Quick Look 07 Mean Manhattan Rental Prices 11 Manhattan Price Trends 12 Neighborhood Price Trends 12 Battery Park City 13
Manhattan condo prices rose to
 Manhattan Market Report Q4 4 by the numbers +.8% StreetEasy Condo Price Index (QuarteroverQuarter) +.4% StreetEasy Condo Price Forecast (MonthoverMonth).7% Total (QuarteroverQuarter) +5.7% Number of Pending
REAL ESTATE MARKET OVERVIEW 1 st Half of 2015
 REAL ESTATE MARKET OVERVIEW 1 st Half of 2015 With Comparisons to the 2 nd Half of 2014 September 4, 2015 Prepared for: First Bank of Wyoming Prepared by: Ken Markert, AICP MMI Planning 2319 Davidson Ave.
Table of Contents. Appendix...22
 Table Contents 1. Background 3 1.1 Purpose.3 1.2 Data Sources 3 1.3 Data Aggregation...4 1.4 Principles Methodology.. 5 2. Existing Population, Dwelling Units and Employment 6 2.1 Population.6 2.1.1 Distribution
New Development Report
 New Development Report 2018 First Quarter MANHATTAN $ 2,513 $ 2,185 $ 2,152 3.7% YoY PER SQ. FT. ACTIVE PER SQ. FT. CONTRACT SIGNED PER SQ. FT. CLOSED 1% YoY 4.1% YoY BROOKLYN $ 1,475 PER SQ. FT. ACTIVE
Residential May Karl L. Guntermann Fred E. Taylor Professor of Real Estate. Adam Nowak Research Associate
 Residential May 2008 Karl L. Guntermann Fred E. Taylor Professor of Real Estate Adam Nowak Research Associate The use of repeat sales is the most reliable way to estimate price changes in the housing market
FOR IMMEDIATE RELEASE Contact: David B. Bennett President & CEO Phone:
 FOR IMMEDIATE RELEASE Contact: David B. Bennett President & CEO Phone: 727-216-32 Email: dbennett@tampabayrealtor.com Real Estate Statistics for September 217 September s numbers are out, and it comes
Queens Rental Market Report October 2017 mns.com
 Queens Rental Market Report October 2017 TABLE OF CONTENTS 03 Introduction 04 A Quick Look 10 Queens Price Trends 11 Neighborhood Price Trends 11 Long Island City 12 Astoria 13 Ridgewood 14 Flushing 15
The Corcoran Report 4Q16 MANHATTAN
 The Corcoran Report 4Q16 MANHATTAN Contents Fourth Quarter 2016 4/7 12/23 3 Overview 8 9 10 Market Wide 11 Luxury 24 2 Sales / Days on Market 3 Inventory / Months of Supply 4 5 Market Share Resale Co-ops
Residential December 2009
 Residential December 2009 Karl L. Guntermann Fred E. Taylor Professor of Real Estate Adam Nowak Research Associate Year End Review The dramatic decline in Phoenix house prices caused by an unprecedented
Market Report. Manhattan Q Significant findings in Q3 2009
 ket Report Q3 StreetEasy is pleased to present our Q3 Quarterly Report on the residential market. The bulk of the report is based on approximately 3,300 recorded sales for this quarter as well as over
Queens Rental Market Report November 2017 mns.com
 Queens Rental Market Report November 2017 TABLE OF CONTENTS 03 Introduction 04 A Quick Look 10 Queens Price Trends 11 Neighborhood Price Trends 11 Long Island City 12 Astoria 13 Ridgewood 14 Flushing 15
Manhattan Rental Market Report November 2014 mns.com
 Manhattan Rental Market Report November 2014 TABLE OF CONTENTS 03 Introduction 04 A Quick Look 07 Mean Manhattan Rental Prices 11 Manhattan Price Trends 12 Neighborhood Price Trends 12 Battery Park City
New Development Report
 New Development Report 2017 Third Quarter MANHATTAN $ 2,537 PER SQ. FT. ACTIVE $ 2,138 PER SQ. FT. CONTRACT SIGNED $ 2,096 PER SQ. FT. CLOSED BROOKLYN $ 1,468 PER SQ. FT. ACTIVE $ 1,423 PER SQ. FT. CONTRACT
METROPOLITAN TRACT PERFORMANCE REPORT For the Quarter Ended September 30, 2005
 F-8 METROPOLITAN TRACT PERFORMANCE REPORT For the Quarter Ended September 30, 2005 Finance, Audit & Facilities Committee vember 18, 2005 CONSOLIDATED METROPOLITAN TRACT PROPERTIES Quarterly Summary Quarterly
Manhattan Residential Rental Market Report
 Manhattan Residential Rental Market Report Second Quarter 217 Second Quarter 217 This report follows overall conditions in the Manhattan rental market during June as well as throughout the second quarter
May 2013 April 2013 May 2012 Manhattan Condo Index 2,106 2, % 1, %
 Market Report NOTICE: StreetEasy is pleased to present our 2013 Q2 Quarterly Report on the residential market. This preview version of the report is based on over 1,000 broker sources and will provide
Housing Indicators in Tennessee
 Housing Indicators in l l l By Joe Speer, Megan Morgeson, Bettie Teasley and Ceagus Clark Introduction Looking at general housing-related indicators across the state of, substantial variation emerges but
NINE FACTS NEW YORKERS SHOULD KNOW ABOUT RENT REGULATION
 NINE FACTS NEW YORKERS SHOULD KNOW ABOUT RENT REGULATION July 2009 Citizens Budget Commission Since 1993 New York City s rent regulations have moved toward deregulation. However, there is a possibility
BONDREPORT QTR BONDREPORT QTR BONDNEWYORK.COM
 BONDREPORT QTR 4 2017 WELCOME TO THE 19 TH EDITION OF THE BOND REPORT It has been quite the year on many fronts, and by all indications, 2017 has no intention of going quietly. The market has continued
ECONOMIC CURRENTS. Vol. 5 Issue 2 SOUTH FLORIDA ECONOMIC QUARTERLY. Key Findings, 2 nd Quarter, 2015
 ECONOMIC CURRENTS THE Introduction SOUTH FLORIDA ECONOMIC QUARTERLY Economic Currents provides an overview of the South Florida regional economy. The report presents current employment, economic and real
Residential December 2010
 Residential December 2010 Karl L. Guntermann Fred E. Taylor Professor of Real Estate Adam Nowak Research Associate I The preliminary data for November shows that housing prices declined for another month
FOR IMMEDIATE RELEASE Contact: David B. Bennett President & CEO Phone:
 FOR IMMEDIATE RELEASE Contact: David B. Bennett President & CEO Phone: 727-216-32 Email: dbennett@tampabayrealtor.com Real Estate Statistics for December 217 wrapped up a sizzling 217 with a steady month
ARLA Members Survey of the Private Rented Sector
 Prepared for The Association of Residential Letting Agents ARLA Members Survey of the Private Rented Sector Second Quarter 2014 Prepared by: O M Carey Jones 5 Henshaw Lane Yeadon Leeds LS19 7RW June, 2014
Brooklyn Rental Market Report July 2015 mns.com
 Brooklyn Rental Market Report July 2015 TABLE OF CONTENTS 03 Introduction 04 A Quick Look 05 Mean Brooklyn Rental Prices 10 Brooklyn Price Trends 11 Neighborhood Price Trends 11 Bay Ridge 12 Bedford-Stuyvesant
Manhattan Rental Market Report Year End 2012 mns.com
 Manhattan Rental Market Report Year End 2012 TABLE OF CONTENTS 03 Introduction 04 Notable Trends 06 Mean Manhattan Rental Prices 08 Neighborhood Price Trends 08 Battery Park City 08 Chelsea 08 East Village
An Introduction to RPX INTRODUCTION
 An Introduction to RPX INTRODUCTION Radar Logic is a real estate information company based in New York. We convert public residential closing data into information about the state and prospects for the
Housing Bulletin Monthly Report
 January 21 1 Housing Bulletin Monthly Report Most new homes built in second half of 29 25, 2, 15, 1, 5, Dec 7 Jan 8 Feb 8 mar 8 apr 8 Alberta s 29 housing starts increased 72.8 per cent over 28, suggesting
M A N H A T T A N 69 THE FURMAN CENTER FOR REAL ESTATE & URBAN POLICY. Financial District Greenwich Village/Soho
 M A N H A T T A N Page Financial District 301 72 Greenwich Village/Soho 302 73 Lower East Side/Chinatown 303 74 Clinton/Chelsea 304 75 69 THE FURMAN CENTER FOR REAL ESTATE & URBAN POLICY Midtown 305 76
Residential January 2010
 Residential January 2010 Karl L. Guntermann Fred E. Taylor Professor of Real Estate Adam Nowak Research Associate Another improvement to the ASU-RSI is introduced this month with new indices for foreclosure
Profile of International Home Buyers in Florida
 Profile of International Home Buyers in Florida Research Division National Association of REALTORS 2009 Prepared for the Florida Association of REALTORS 2009 National Association of REALTORS Profile of
Minneapolis St. Paul Residential Real Estate Index
 University of St. Thomas Minneapolis St. Paul Residential Real Estate Index Welcome to the latest edition of the UST Minneapolis St. Paul Residential Real Estate Index. The University of St Thomas Residential
The Corcoran Report 3Q17 MANHATTAN
 The Corcoran Report 3Q17 MANHATTAN Contents Third Quarter 2017 4/7 12/23 3 Overview 8 9 10 Market Wide 11 Luxury 24 4 Sales / Days on Market 5 Inventory / Months of Supply 6 7 Market Share Resale Co-ops
Residential October 2009
 Residential October 2009 Karl L. Guntermann Fred E. Taylor Professor of Real Estate Adam Nowak Research Associate Summary The latest data for July 2009 reveals that house prices declined by 28 percent
Residential March 2010
 Residential March 2010 Karl L. Guntermann Fred E. Taylor Professor of Real Estate Adam Nowak Research Associate The latest data for December 2009 reveals that overall house prices declined by 13 percent
Peter Comitini Senior VP Associate Broker The Corcoran Group
 Sutton Area TriBeCa Upper East Side Upper West Side Washington Heights West Village Battery Park City Beekman Carnegie Hill Central Park South Chelsea Flatiron Clinton East Harlem East Village Financial
COMMERCIAL PROPERTY PRICES REMAIN IN SLOWDOWN PATTERN AS MARKET REACTS TO INVESTOR PULLBACK
 CCRSI RELEASE MARCH 2016 (With data through February 2016) COMMERCIAL PROPERTY PRICES REMAIN IN SLOWDOWN PATTERN AS MARKET REACTS TO INVESTOR PULLBACK DESPITE DECLINE IN PROPERTY PRICING, LEASING ACTIVITY
The State of Renters & Their Homes
 FORECLOSURES FINDING #14 The number of pre-foreclosure notices issued to one- to four-unit properties and condominiums in 2015 fell from the previous year. Pre-foreclosure notices for one- to four-unit
The Impact of Market Rate Vacancy Increases Eleven-Year Report
 The Impact of Market Rate Vacancy Increases Eleven-Year Report January 1, 1999 - December 31, 2009 Santa Monica Rent Control Board April 2010 TABLE OF CONTENTS Summary 1 Vacancy Decontrol s Effects on
Housing as an Investment Greater Toronto Area
 Housing as an Investment Greater Toronto Area Completed by: Will Dunning Inc. For: Trinity Diversified North America Limited February 2009 Housing as an Investment Greater Toronto Area Overview We are
Brooklyn Rental Market Report July 2016 mns.com
 Brooklyn Rental Market Report July 2016 TABLE OF CONTENTS 03 Introduction 04 A Quick Look 05 Mean Brooklyn Rental Prices 10 Brooklyn Price Trends 11 Neighborhood Price Trends 11 Bay Ridge 12 Bedford-Stuyvesant
Manhattan Rental Market Report Year End 2009
 Manhattan Rental Market Report Year End 2009 Table of Contents Introduction 3 A Quick Look 4 Mean Manhattan Rental Prices 5 Notable Trends 7 Manhattan Price Trends 7 Neighborhood Price Trends Upper West
Addressing the Impact of Housing for Virginia s Economy
 Addressing the Impact of Housing for Virginia s Economy A REPORT FOR VIRGINIA S HOUSING POLICY ADVISORY COUNCIL NOVEMBER 2017 Appendix Report 2: Housing the Commonwealth's Future Workforce 2014-2024 Jeannette
THE REAL ESTATE GROUP
 The Manhattan Rental Market Report March 2008 Table of Contents Letter from Our Chief Operating Officer 3 A Quick Look 4 Mean Citywide Rental Prices 8 Citywide Price Trends 10 Neighborhood Price Trends
METROPOLITAN TRACT PERFORMANCE REPORT For the Quarter Ended June 30, 2006
 F-5 METROPOLITAN TRACT PERFORMANCE REPORT For the Quarter Ended June 30, 2006 Finance, Audit & Facilities Committee September 21, 2006 CONSOLIDATED METROPOLITAN TRACT PROPERTIES Quarterly Summary Quarterly
ARLA Members Survey of the Private Rented Sector
 Prepared for The Association of Residential Letting Agents & the ARLA Group of Buy to Let Mortgage Lenders ARLA Members Survey of the Private Rented Sector Fourth Quarter 2010 Prepared by: O M Carey Jones
THE MANHATTAN RENTAL MARKET REPORT
 TM THE MANHATTAN RENTAL MARKET REPORT YEAR END 2011 TABLE OF CONTENTS Introduction 3 Notable Trends 4 Mean Manhattan Rental Prices 5 Neighborhood Price Trends Harlem 7 Upper West 7 Upper East 7 Midtown
Q M A N H A T T A N M A R K E T R E P O R T
 Q 4 2 0 1 7 M A N H A T T A N M A R K E T R E P O R T Introducing the Compass Q4 2017 Manhattan Market Report Page 02 Page 03 Page 05 Page 08 Page 10 Page 11 Coverage area Inventory Contracts signed Closings
THE MANHATTAN RENTAL MARKET REPORT
 TM THE MANHATTAN RENTAL MARKET REPORT AUGUST 2011 1 TABLE OF CONTENTS Introduction 3 A Quick Look 4 Mean Manhattan Rental Prices 8 Manhattan Price Trends 10 Neighborhood Price Trends Harlem 11 Upper West
RESIDENTIAL MARKET ANALYSIS
 RESIDENTIAL MARKET ANALYSIS CLANCY TERRY RMLS Student Fellow Master of Real Estate Development Candidate Oregon and national housing markets both demonstrated shifting trends in the first quarter of 2015
SJC Comprehensive Plan Update Housing Needs Assessment Briefing. County Council: October 16, 2017 Planning Commission: October 20, 2017
 SJC Comprehensive Plan Update 2036 Housing Needs Assessment Briefing County Council: October 16, 2017 Planning Commission: October 20, 2017 Overview GMA Housing Element Background Demographics Employment
Minneapolis St. Paul Residential Real Estate Index
 University of St. Thomas Minneapolis St. Paul Residential Real Estate Index Welcome to the latest edition of the UST Minneapolis St. Paul Residential Real Estate Index. The University of St Thomas Residential
Economic Spotlight September 1, 2009
 Economic Spotlight September 1, 29 Update on Alberta s Housing Market Summary Alberta s housing market is beginning to show signs of recovery. Housing starts have rebounded from March lows and activity
insights from new york's premier broker for townhouses and small buildings TOWNHOUSE end of year review MARKET SNAPSHOT JAN-DEC 2017
 leslie j. garfield jan-dec 2017 insights from new york's premier broker for townhouses and small buildings TOWNHOUSE end of year review MARKET SNAPSHOT JAN-DEC 2017 2017 Sales Avg. Sales Price Avg. Price/Sq.ft
MANHATTAN RENTAL MARKET REPORT august 2012 AUGUST 2012
 MANHATTAN RENTAL MARKET REPORT august 2012 TM T H E M A N H AT TA N R E N TA L M A R K E T R E P O R T AUGUST 2012 MNS 1 1 5 E A S T 2 3 RD S T R E E T, N E W Y O R K, N Y 1 0 0 1 0 212.475.9000 INFO@MNS.COM
The Impact of Using. Market-Value to Replacement-Cost. Ratios on Housing Insurance in Toledo Neighborhoods
 The Impact of Using Market-Value to Replacement-Cost Ratios on Housing Insurance in Toledo Neighborhoods February 12, 1999 Urban Affairs Center The University of Toledo Toledo, OH 43606-3390 Prepared by
Appendix D HOUSING WORK GROUP REPORT JULY 10, 2002
 Appendix D HOUSING WORK GROUP REPORT JULY 10, 2002 Work Group Assignment At the 20/20 forum in April 2001, the community expressed a need for housing policies which will protect both the Town s social
Chapter 12 Changes Since This is just a brief and cursory comparison. More analysis will be done at a later date.
 Chapter 12 Changes Since 1986 This approach to Fiscal Analysis was first done in 1986 for the City of Anoka. It was the first of its kind and was recognized by the National Science Foundation (NSF). Geographic
New Development Year-End Report
 New Development Year-End Report 2017 MANHATTAN $ 2,610 $ 2,282 $ 2,133 0.9% YoY PER SQ. FT. ACTIVE 2.2% YoY PER SQ. FT. CONTRACT SIGNED 2.3% YoY PER SQ. FT. CLOSED BROOKLYN $ 1,440 PER SQ. FT. ACTIVE $
2015 First Quarter Market Report
 2015 First Quarter Market Report CAAR Member Copy Expanded Edition Charlottesville Area First Quarter 2015 Highlights: Median sales price for the region was up 5.1% over Q1-2014, rising from $244,250 to
Residential September 2010
 Residential September 2010 Karl L. Guntermann Fred E. Taylor Professor of Real Estate Adam Nowak Research Associate For the first time since March, house prices turned down slightly in August (-2 percent)
Ten-Year Residential Rental Market Report CITI HABITATS
 Ten-Year Residential Rental Market Report 2007-2016 TEN-YEAR RESIDENTIAL RENTAL MARKET REPORT 2007-2016 The last ten years have been remarkable ones for the Manhattan rental market. This study covers the
March 19, State of the Homeless 2015 TURNING THE TIDE: New York City Takes Steps to Combat Record Homelessness, but Albany Must Step Up
 March 19, 2015 State of the Homeless 2015 TURNING THE TIDE: New York City Takes Steps to Combat Record Homelessness, but Albany Must Step Up State of the Homeless 2015 TURNING THE TIDE: New York City Takes
New Development Year-End Report
 New Development Year-End Report MANHATTAN 2,775 PER SQ. FT. ACTIVE 2,268 BROOKLYN 1,34 PER SQ. FT. ACTIVE 1,335 PER SQ. FT. CONTRACT SIGNED PER SQ. FT. CONTRACT SIGNED 1,98 1,167 PER SQ. FT. CLOSED PER
INTRODUCTION SUMMER SLIDE
 3 Q 2 0 1 8 M A NH AT TA N M A R K E T R E P O R T INTRODUCTION M A N H A T T A N S A L E S R E P O R T Q 3 2 0 1 8 : SUMMER SLIDE It s common knowledge that Manhattan property sales typically take a dip
Queens Rental Market Report February 2018 mns.com
 Queens Rental Market Report February 2018 TABLE OF CONTENTS 03 Introduction 04 A Quick Look 10 Queens Price Trends 11 Neighborhood Price Trends 11 Long Island City 12 Astoria 13 Ridgewood 14 Flushing 15
The Impact of Market Rate Vacancy Increases One Year Report
 The Impact of Market Rate Vacancy Increases One Year Report January 1, 1999- December 31, 1999 Santa Monica Rent Control Board TABLE OF CONTENTS Summary 2 Market Rent Increases 1/1/99-12/31/99 4 Rates
City Futures Research Centre
 Built Environment City Futures Research Centre Estimating need and costs of social and affordable housing delivery Dr Laurence Troy, Dr Ryan van den Nouwelant & Prof Bill Randolph March 2019 Estimating
ON THE HAZARDS OF INFERRING HOUSING PRICE TRENDS USING MEAN/MEDIAN PRICES
 ON THE HAZARDS OF INFERRING HOUSING PRICE TRENDS USING MEAN/MEDIAN PRICES Chee W. Chow, Charles W. Lamden School of Accountancy, San Diego State University, 5500 Campanile Drive, San Diego, CA 92182, chow@mail.sdsu.edu
Minneapolis St. Paul Residential Real Estate Index
 University of St. Thomas Minneapolis St. Paul Residential Real Estate Index Welcome to the latest edition of the UST Minneapolis St. Paul Residential Real Estate Index. The University of St Thomas Residential
Post-Katrina housing affordability challenges continue in 2008, worsening among Orleans Parish very low income renters
 Post-Katrina housing affordability challenges continue in 2008, worsening among Orleans Parish very low income renters Based on 2004, 2007 and 2008 American Community Survey data from the U.S. Census Bureau